overview - bankaudi.com.eg · net interest income increased by 28% (y-o-y) to reach egp 1,903...
TRANSCRIPT

EGYPT

OVERVIEWOVERVIEWA. The Chairman’s Statement...............................................................B. CEO & MD’s Statement......................................................................C. Bank Audi sae Strategic Direction & Values...................................D. Bank Audi Group...............................................................................E. Bank Audi sae Key Financial Highlights.........................................F. The Egyptian Economy in 2017........................................................
2 CORPORATE GOVERNANCEA. Board of Directors.............................................................................B. Governance........................................................................................
A. Business Performance:..................................................................................I. Corporate Banking & SMEs...............................................................II. Retail Banking....................................................................................III. Treasury............................................................................................IV. Capital Markets & Investment ........................................................V. Financial Institutions & Correspondent Banking............................VI. Islamic Banking................................................................................VII. Global Transaction Services (GTS) ...............................................VIII. Branches ........................................................................................
B. Risk Performance ..........................................................................................Risk Performance & Capital Management .........................................
C. Control & Support Performance ...................................................................I. Support Functions .............................................................................II. Control Functions..............................................................................
FINANCIAL STATEMENTS......................................
OUR PEOPLE...............................................................................
BUSINESS, RISK, SUPPORT & CONTROL PERFORMANCE
01
02
03
05BRANCHES’ NETWORK & ATMS LOCATIONS BY GOVERNORATE..............06
04
INDEX
68
10101112
16
2626
2626272727
2728
28
28
303033
38
104
110


Hatem SadekChairman & Managing Director
1. Overview
A. The Chairman’s Statement
It is my privilege and pleasure on behalf of the Board of Bank Audi Egypt to present our Annual Report and Accounts for the full year 2017.
This was a challenging year of transition for Egypt, its businesses, banks and the community at large. I find it difficult to adequately express my appreciation for the way in which our Bank rose to those challenges and tried to make a positive contribution to this transition process affecting our stakeholders. Whilst the financial results of the Bank are highly credible under those circumstances, my personal and the Board’s optimism remains focused on the key steps we are continuing to try to take towards achieving the sustainable future in terms of vision, values and strategy of the Bank.
In this respect, 2017 saw not only some of the fruition of previous balanced investment in our tangible and intangible resources but also the necessary core platform taking shape for its future role as a modern and relevant financial services organization, that can make an integral contribution to Egypt’s changing and ongoing development. I would highlight three specific elements in this journey, namely: proving that we have value added risk management capabilities; progressing effective governance within international standards; and continuing to look at the potential needs of our expanding relationship customers and the intrinsic role of technology in future financial service delivery and quality. During 2017, we successfully managed changes, introduced enhancements and continued to invest in related systems, across all these three key elements.
In summary, the Board and Bank Audi Group extended their full support to the management to meet the new market challenges emanating from the Egyptian pound floatation and its consequent devaluation, which impacted largely the financial positions of the corporate clients in the market, especially those with foreign currency obligations and the cost of living of our community. Our efforts on the Risk Management front proved successful in preserving the Bank’s excellent Asset quality, evidenced by maintaining an NPL ratio of 1.46 %, considered to be among the lowest in the market. On the other hand, being part of the Bank Audi Group, which operates in different markets that have applied IFRS 9 on a trial basis during 2017, we have already managed to provide our related financial requirements for Group consolidation. Hence, our Bank strives to be ahead of the local market in applying the IFRS 9 concept of forward looking provisions estimation “Expected Credit Losses”, and when complying with recently issued local regulations.
On the Governance front in 2017, we chose the bold option of splitting executive and non-executive responsibilities at the top of the Bank’s organization chart. I was delighted that one of our key values of Meritocracy saw two of our long-term senior management members with proven performance appointed as Board directors, thus continuing to balance the key skills and inputs of business, finance and risk. We
continued to implement further important Governance changes and enhancements regarding the number and role of Board Committees, in order to closely follow the latest trends and best practice among leading international banks.
In addition and culminating in 2017, the Bank delivered an exceptional leap forward, as the management and staff successfully achieved, in a record time, the implementation of a new technology transformation program. We have managed to introduce a top of the line core banking system together with five new systems, to which 32 satellites were successfully integrated. The advantages of this considerable investment will give the Bank a competitive edge; facilitate enhancements across all our business, support and control functions; but ultimately and most importantly, it should benefit our customers and other financial partners and our ability to deliver the quality of our service. Such a major achievement sheds lights on the soft power of Bank Audi Egypt driven by its remarkable intangible assets. It emphasizes the extended cross-functional knowledge of our staff and their deep understanding of their customers’ businesses and competition requirements; the collaborative management approach with their high sense of loyalty and the deep-rooted culture of discipline and commitment; and backed by the high quality of project management exercised by the Group and Bank Audi Egypt working together.
As the Egyptian economy started reaping the early benefits of the nation-wide reform program in 2017, we are confident that our Bank in its new phase, with the continuous support of our shareholders and the dedication of our staff, will continue its successful journey towards the top among the leading private banks in the Egyptian market. Our final aim will always remain the satisfaction of our valued customers while answering, promptly and efficiently, their present and future financial needs.
Mohamed A. FayedChief Executive Officer & Managing Director
B. CEO & MD’s Statement
Dear Shareholders, Clients & Colleagues,
We started our second decade in the year 2017 being our eleventh year of operations in Egypt. During the first quarter of 2017, I was nominated by the Board of Directors for the newly created position as the Chief Executive Officer and Manager Director of Bank Audi Egypt, as we commenced a new chapter in the Bank’s rich journey of success, having established it as one of the top performers in the Egyptian banking market since our inception in 2006.
During 2017, we encountered numerous external challenges, in addition to the devaluation of the Egyptian Pound, which was followed by a set of drastic and ambitious economic reform decisions aimed at improving the economy.
Internally, we successfully concluded our 3-year long comprehensive Transformation Project that completely overhauled our Core Banking System and its satellite services. This was finalized in November 2017 and has now successfully gone live.
In 2017, Bank Audi Egypt directed its efforts towards enhancing efficiency and optimizing our existing resources and assets, with the aim of improving our Return on Assets and Return on Equity, being the Bank’s major challenge for the upcoming 2 to 3 years.
To achieve our major goal of improved efficiency, we are focusing on providing our customers with the best quality services in a timely manner and ensuring delivering the most up-to-date products using our latest state-of-the-art core banking system.
Our driving objective is to go beyond the provision of transaction-based links with our clients, and build profound and lasting relationships with them based on applying our expertise and the quality of service they require across a broad spectrum of financial services.
In alignment with the directives set forward by the Central Bank of Egypt, Bank Audi Egypt during 2017, paid special attention to financial inclusion, represented by our active participation in the Central Bank of Egypt’s initiative to incentivize a more inclusive Countrywide relationship between the banking sector and all stakeholders.
In conclusion, I would like to thank our shareholders for their continuous support on the technical side on the one hand, and through constantly reinvesting and enhancing our capital base on the other hand, mirroring their belief in the Egyptian economy and our Bank’s strong prospects in the market.
As we express our gratitude, we must never forget our appreciation to our loyal and valuable customers, who constantly fuel our ambitions for providing the best quality products and services. Furthermore, I would like to take this opportunity to offer my gratitude to all my diligent colleagues who have exerted immense efforts during the last couple of years, and have proven to be very competent, as embodied in our 2017 achieved results.
6 7

Net Interest Income increased by 28% (y-o-y) to reach EGP 1,903 Billion in 2017; in addition, net fees and commissions increased by 12% to reach EGP 482 Million in 2017.
Foreign Exchange translation losses represented EGP 2,313 Million. Salaries and related costs increased by 9% and other administrative costs by 30%, despite the continuing and additional manpower and other resource costs associated with the Bank’s technology transformation program.
Gross loans decreased slightly to EGP 29.3 Billion at end of December 2017, compared to EGP 30.1Billion at end of December 2016.
As in 2016, 96% of the Loans and Advances Portfolio were maintained in the two highest internal risk ratings, with 90% of the portfolio having no past dues or impairment indicators (versus 91% in 2016).
In parallel, consolidated customers’ deposits rose to EGP 47.4 Billion at end of December 2017, rising by 4% compared to 2016, although non-interest bearing balances decreased by 8%.
Total assets reached EGP 56 Billion at end of December 2017, recording an increase of 1% compared to 2016.
Total equity grew to EGP 5.663 Billion versus EGP 4.648 Billion in 2016 with capital adequacy ratio 16.6%. Earnings per share were 29.34 and leverage increased to 7.63% (versus 3.94%).
E. Overview of Bank Audi Group
Bank Audi sal is one of the largest and most diversified banking groups in the MENA region, with principal operations in Lebanon, Turkey and Egypt, along with ancillary presence in France, Switzerland, Jordan, Saudi Arabia, Qatar, Abu Dhabi (through a representative office), Monaco and Iraq. It ranks first among Lebanese banking groups, the 7th largest in Egypt and the 9th in Turkey, while maintaining a leading position in Private Banking in the MENA region. The Group is also positioned among the top Arab banking groups.
The Bank operates through the following four main business segments: Corporate and Commercial Banking; Retail and Personal Banking; Treasury and Capital Markets; and Group Functions and Head Office. Its geographic coverage extends to 11 countries through 10 banks and 3 financial companies, supported by a network of 204 branches, 474 ATMs, 35 ITMs and 6,541 employees, servicing more than 1.2 Million clients.
Founded in 1830 in Sidon (Southern Lebanon), Bank Audi was incorporated in its present form in 1962 as a private joint stock company with limited liability (“société anonyme libanaise”) with a term of 99 years. Bank Audi is licensed by Banque Du Liban (BDL) and registered on the Lebanese list of banks under number 56 and on the Beirut Commercial Registry under number 11347. The Central Bank of Lebanon is the lead supervisor of Bank Audi sal and its subsidiaries. Bank Audi’s head office and registered address is Bank Audi Plaza, Omar Daouk Street, Bab Idriss, P.O. Box: 11-2560, Beirut, Lebanon.
C. Bank Audi sae Strategic Direction & Values
Bank Audi sae Vision:
To be the Egyptian partner of choice to Bank with, Work for and Invest in.
Bank Audi sae Mission:
To deliver a superior level of service and provide easy access to innovative & tailored products and services for targeted segments through user appropriate modular channels, and the sharing of our knowledge by highly trained and innovative staff, working in meritocracy, so as to provide sustainable value to our stakeholders and community.
Bank Audi sae Values:
Transparency
Ensure open communication with all stakeholders to maintain trust, integrity, and accountability.
Human Capital
Promote diversity, provide equal opportunity, reward talent and value teamwork.
Heritage
Enhance Bank Audi sae reputation by building on our record of accomplishment and contribution.
Quality
Strive for excellence and professionalism in everything we do.
Civic Role
Be good citizens in the communities in which we live and work.
Innovation
Encourage creativity and continuous development.
D. Bank Audi sae Key Financial Highlights
Bank Audi Egypt continues to be driven by an uncompromising mission to build lasting relationships with clients who share our aspiration for being partners by mutual choice. We see a
key part of our contribution to this affinity partnership being based around our values and the creation of value. We strive for professionalism, innovation, and quality of service. Through the sharing of information and applying our knowledge and capabilities, we try to meet the changing financial service needs of our clients. In this way, the Bank’s management and staff aspire to apply our values to make each day better than the day before.
The Bank recorded outstanding financial performance ratios in 2017. As transparency is one of Bank Audi’s main core values, the Bank consolidated net profit after normalization of the FX impact recorded EGP 1,089 Million, which represented a growth of 48%, compared to the previous year. This increase was achieved despite the Bank allocating provisions of EGP 178 Million while maintaining the same non-performing asset ratio of 1.5%, which is considered one of the best ratios in the Banking Sector.
8 9

Comparative Banking Sector Indicators in Egypt
(LE Billion) Dec-15 Dec-16 Variation % Change Dec-16 Dec-17 Variation % Change
Bank Assets 2,485.50 3,962.60 1,477.10 59.40% 3,962.60 4,865.50 902.9 22.80%
Bank Deposits 1,914.60 2,761.10 846.5 44.20% 2,761.10 3,257.90 496.8 18.00%
Bank Loans 791.5 1,300.20 508.7 64.30% 1,300.20 1,441.20 141 10.80%
Sources: Central Bank of Egypt, Bank Audi’s Group Research Department.
At the monetary level, FX reserves increased significantly over the year to reach US$ 37 Billion in December 2017, their highest level on record. As such, Egypt’s reserves rose by US$ 17 Billion since it began its IMF-backed reform program. The exchange market mirrored the improvement in the economy, as the Egyptian pound slightly appreciated against the US$ to reach 17.80 LE/US$ as compared to LE 18.12 at end-December 2016. The main challenge remains inflation, with headline inflation staying above 20% by end 2017. Egypt’s core inflation rose by a yearly 25.5% up to November 2017 following fuel and energy subsidy cuts as part of the IMF-backed reforms.
A net improvement in the external sector has indeed been reported. Tourist arrivals jumped by 54.7% in the first eleven months of 2017 from a year earlier, as announced by the Ministry of Tourism, marking the sector’s revival from its sharp contraction since 2011. The current account deficit recorded its lowest deficit since 2014 on the back of higher exports, declining non-oil imports and recovering receipts from tourism and worker’s remittances. Egypt’s current account recorded in the fiscal year 2016/17 (Jul-Jun) a deficit of US$ 15.6 Billion down from US$ 19.8 Billion a year before. Having said that, although the latest external data continued to show significant positive gains, Egypt’s shortfall is still large and the adjustment still has some way to go. The trade deficit remained high at 10% of GDP. The challenge for Egypt going forward will be to continue growing its more sustainable sources of foreign inflows, particularly FDI and tourism receipts.
At the fiscal level, Egypt reported a relative improvement in 2017, with fiscal deficit retreating from 10.9% in 2016 to 9.5% in 2017. Egypt started its new fiscal year in July with the passing of an ambitious budget that plans to reduce the deficit to around 9% of GDP in 2017/18. The budget, if achieved, would give the government its first single-digit deficit in seven years, and first primary surplus in 11 years.
Capital markets mirrored to a large extent the improving economy. At the stock market level, the stock market index reported a rise in prices of 21.6% over the year amid a recovering economy, favorable corporate financial results and opportunistic buying. At the fixed income market’s level, Egypt’s CDS spreads reported a yearly contraction of 100 bps to reach a current 350 bps reflecting a noticeable improvement in the market perception of Egypt’s sovereign risk.
Within this environment, banking activity continued to show resilience. Over the first nine months of 2017, bank assets grew by 18% when expressed in Egyptian pounds, while deposits grew by 15% over the period. In parallel, bank loans to the private sector grew by 9% over the period. Given the stability of the exchange rate over the first half of 2017, banking aggregates growth rates in US$ terms are almost the same as those in the Egyptian pound. The growth in banking aggregates is not recorded at the detriment of financial standing, as financial soundness indicators continue to show solid performance at the level of liquidity, capital adequacy, asset quality and profitability.
F. The Egyptian Economy in 2017
Egypt’s reform process accelerated in 2017 with further subsidy reductions, VAT increases and interest rate hikes. The fruits of this challenging reform became evident, with real economic activity picking up, foreign currency reserves improving to their highest level on record, tourist arrivals recovering from low levels and the capital market performing solidly, with parallel improvement in banking activity at large.
At the real sector level, there was also a pick-up in growth albeit moderately. Benefits became apparent across the whole economy reinforcing the investment aggregate, but the consumer remained quite challenged. Egypt’s Gross Domestic Product registered a strong growth of 4.1% during 2017, as a result of the growth in several sectors, including communication, tourism and manufacturing and supported by the gradual implementation of business climate reforms and improved competitiveness.
The initial shareholders of Bank Audi were members of the Audi family, together with certain Kuwaiti investors. Since 1983, the shareholder base has expanded with an aim to build a diversified shareholders base in support of the growth story of the Group. At end-December 2017, a total number of common shares of 399,749,204, comprised of ordinary shares and Global Depositary Receipts (GDRs) were held by more than 1,500 shareholders varying between individual investors, institutional investors and a supranational agency. Ordinary shares are listed on the Beirut Stock Exchange while Global Depositary Receipts (GDRs) are listed on both the Beirut Stock Exchange and the London Stock Exchange.
The Group’s main purpose is to achieve quality growth by efficiently meeting the needs of both businesses and
individuals in the various countries of presence and ensuring long-term sustainable value to all stakeholders. Its main strategic orientation revolves around positioning the Group as a leading MENAT bank.
Consolidated Activity Highlights
As at end-December 2017
• US$ 43.8 Billion of assets
• US$ 33.5 Billion of customers’ deposits
• US$ 16.3 Billion of loans to customers
• US$ 4.2 Billion of shareholders’ equity
• US$ 559 Million of net profits in 2017
Sources: IMF, Bank Audi's Group Research Department.
230.0247.7
278.8 288.0305.6
332.1 332.3
262.1
5.1%
1.8% 2.2%
3.3%2.9%
4.4% 4.3% 4.1%
0%
1%
2%
3%
4%
5%
6%
7%
8%
9%
10%
0
40
80
120
160
200
240
280
320
360
FY 2010 FY 2011 FY 2012 FY 2013 FY 2014 FY 2015 FY 2016 FY 2017e
Evolution of Egypt Economic Growth
Nominal GDP Real GDP Growth
US$ billion
10 11

2. Corporate Governance
A. Board of Directors & Biographies
Mr. Hatem Sadek graduated with a BSc in Economics & Political Science from Cairo University. He started working in 1964 as an assistant to the Chief Executive Officer in the Information Bureau of the President of Egypt. Between 1968 and 1974, Mr. Sadek became Manager of the Research Center for Strategic Studies and editor at Al Ahram newspaper. He then joined the Bureau of the Secretary General of the League of Arab States for one year
Mr. Sadek’s banking career started in 1976 when he established Arab Bank PLC regional office and branches in Egypt and held the position of Senior Executive VP & Chief Country Manager; in addition to Chairman of the Strategic Planning Committee for the Arab Bank worldwide between 2000 - 2001.
Mr. Sadek then moved to Misr International Bank (MIBank) in 2001 where he held the position of Deputy Executive Chairman of MIBank as well as Deputy Chairman, Supervisory Board of MIBank Europe Gmbh, Frankfurt, Germany. From 2003 until 2005, he was MIBank’s Executive Chairman where he launched and supervised MIBank’s 5-year total restructuring program, until the Bank was acquired by Nationale Société Generale in September 2005.
Mr. Sadek then became Consultant to Banque Misr’s Board of Directors for Change and Restructuring Programs before joining Bank Audi sae in 2006 as Chairman & Managing Director.
He was also a Board Member of Odeabank A.Ş Turkey, a subsidiary of Bank Audi sal - from November 1st, 2012 until March 23rd, 2017.
On March 2nd 2017, Mr. Sadek became non-executive Chairman of Bank Audi sae, following the restructuring of the role and responsibilities at the top of the Bank’s organization chart, to follow the latest trends and best practice in Governance among leading international banks.
Non-Executive Chairman from March 2017Chairman & Managing Director from May 2006
until March 2017
MR. HATEM A. SADEK Mr. MOHAMED A. FAYED
Mr. Mohamed Fayed joined Bank Audi in October 2014 as a Deputy Chairman and Managing Director, later in mid 2016 he was elected by the Board of Directors to act as a Co-Chairman.
Finally, the General Assembly held on March 2nd 2017 nominated Mr. Fayed as the CEO & Managing Director.
Mr. Fayed has 25 years’ experience in banking, diversified in two leading local and multinational banks in Egypt, namely Banque Misr and Misr International Bank, (acquired by National Société General Bank, which in turn was later acquired by Qatar National Bank).
He was the Executive Vice Chairman of Banque Misr, the second largest Bank in Egypt from June 2010 until September 2014, in charge of all Lines of Business including Corporate Banking & Syndication, Treasury & Capital Markets, Financial Institutions, Islamic Banking, Retail Banking, 500 Branches, Investment Banking, Information Technology and all Overseas Subsidiaries.
His major target during his last 4 years at Banque Misr was to boost the Bank businesses’ activities in all areas. He managed over 12,000 employees, and led a remarkable growth of 52% in total footing, 226% net profit and total assets reached around US$ 40 Billion, being attributed to his restructuring of that bank’s business model (corporate identity, branches, services, developed products, distributing channels, IT systems and applications).
From 2003 until 2014, he successfully managed and closed several landmark transactions with total investments exceeding EGP300 Billion in various economic sectors with a great value for the economy and helped Banque Misr to reach the 4th ranking for the first time on Bloomberg League table as a mandated lead arranger.
Additionally he was the Vice Chairman of Misr Bank Europe – Germany and Board Member in Bank Misr Liban, as well as Member of the Canadian Chamber and the American Chamber of Commerce. Mr. Fayed was also a Board member representing Banque Misr in different corporates, Egyptian Real Estate Asset Management and Investment, Nile Fund for Investment & Development, Egyptian Mortgage Refinance Co., and Misr Financial and Investment Co.
Mr. Fayed started his career back in 1989, when he joined Misr International Bank and remained for 18 years in Corporate Banking with a wide experience in Corporate Finance, Project Finance, Syndicated Loans, Acquisition Finance, Corporate Bonds, Securitization, Restructuring, and Islamic finance.
Additionally, he played a principal role during the acquisition of Misr International Bank by National Société Generale Bank.
CEO & Managing Director since March 2017Deputy Chairman & Managing Director from
October 2014 until March 2017
14 15

Mr. Mohamed Mahmoud Bedeir was nominated as Board Member & Deputy Managing Director of Bank Audi Egypt in May 2016. Mr. Bedeir first joined Bank Audi Egypt in January 2007 and since then he has led and overseen several functions in Risk Management and Finance, acting as the Chief Financial Officer from April 2009 until April 2016.
As a CFO at Bank Audi Egypt, Mr. Bedeir has worked on formulating and developing the Bank’s financial strategy, as well as taking an active part in its elaboration, ensuring proper implementation and achievement across the bank’s widening range of activities. He also contributed to designing and guiding the bank’s budgeting and business planning processes.
As a previous leader of Market Risk and Asset and Liability Management Units in Bank Audi Egypt, he was responsible for the implementation and management of the decisions and policies of the Asset & Liability Management Committee (ALCO), formulating and proposing changes in policies to the ALCO, as well as ensuring the efficiency of the Fund Transfer Pricing system (FTP). He was also in charge of initiating policy and limit proposals in respect of market risk exposures, and validating risk management methodologies and assumptions employed by business units.
Mr. Bedeir has more than 25 years of professional banking experience within the Egyptian Market. He began his career in 1991 with Misr International Bank where he worked in Letters of Guarantees, Import and Export L/Cs, as well as Multinational corporate banking field. In 2000, he became Manager of Investment and Private Equity Division, then Head of Asset & Liability Management during the period from 2002 until 2005.
He also held the position of Head of Asset & Liability Management at the National Société General Bank during the period from 2005 until 2007.
Mr. Bedeir graduated with a B.A. in Management from Sadat Academy for Managerial Science – Faculty of Management in 1991. He holds a Master’s Degree in Business Administration with specialization in Banking from Arab Academy for Banking & Financial Sciences in 2011.
Deputy CEO & Chief Banking Services Officer since May 2016
Held several positions since January 2007, the last being CFO of Bank Audi sae.
Mr. MOHAMED M. BEDEIR Mr. AFDAL E. NAGUIB Mr. Afdal Naguib was nominated as Board Member in December 2017. Mr. Naguib first joined Bank Audi Egypt in January 2007 and he assumed CRO responsibilities since November 2010.
Since then he has led and overseen a fully-fledged Risk Management Department and has overseen the Compliance and Governance functions since November 2016.
As a CRO at Bank Audi Egypt, Mr. Naguib has worked on formulating and developing the Bank’s Risk Policies as well as Bank’s regulatory and management reporting system, as well as ensuring proper implementation of CBE regulations and governance guidance and rules across all the bank’s activities.
Mr. Naguib has more than 30 years of professional banking experience within the Egyptian market. He began his career in 1988 with Misr International Bank where he worked in Branch network operations and Corporate Banking. In 1999,
he joined at the creation of the Risk function at MIBank and became the Head of Credit Risk from 2004. He participated
in the acquisition transaction of National Société General Bank over MIBank in 2005, and held the position of Head of Credit Risk at National Société General Bank before he moved to Bank Audi in 2007.
Mr. Naguib graduated with a B.A in Accounting and Management from Cairo University, Faculty of Commerce in 1986.
Chief Risk Officer sinceBoard Member since January 2018
Board Member since April 2006
Mr. Samir Hanna is the Chairman and Chief Executive Officer of the Bank Audi Group. He joined Bank Audi sal in January 1963 and held several managerial and executive positions across various departments of the Bank.
He was appointed General Manager of Bank Audi sal in 1986 and member of its Board of Directors in 1990. In the early 1990s, he initiated and managed the restructuring and expansion strategy of Bank Audi sal, transforming it into a strong banking powerhouse offering universal banking products and services including Corporate, Commercial, Retail, Investment and Private Banking. He grew the Bank to its current position as the largest bank in Lebanon (and among the top 20 Arab banking groups), with a presence in 11 countries, consolidated assets exceeding USD 43 Billion, consolidated deposits exceeding USD 33 Billion, and a group staff headcount exceeding 6,500 employees.
Mr. Hanna was elected Chairman of the Board of Bank Audi sal, succeeding Mr. Raymond Audi, on 10 April 2017. He is also the Chairman of Odeabank A.Ş., Bank Audi’s subsidiary in Turkey, and member of the Board of Directors of several other affiliates of Bank Audi.
As Group Chief Executive Officer, he heads all aspects of the Bank’s Executive Management.
Mr. SAMIR N. HANNA
16 17

Dr. MARWAN M. GHANDOUR Dr. Marwan Ghandour has been an independent member of the Board of Directors of Bank Audi sal since March 2000 and the Vice-Chairman of its Board of Directors since December 2009. He also serves as member of the Board of Directors of Odeabank A.Ş., Bank Audi’s subsidiary in Turkey, (Vice-Chairman until 31 December 2017).
Dr. Ghandour is a previous Vice-Governor of the Central Bank of Lebanon. He held this position between January 1990 and August 1993, with primary responsibilities in the area of monetary policy. During this period, he was also a member of the Higher Banking Commission and various other government committees involved in economic policy. In this capacity, he liaised with renowned international institutions such as the International Monetary Fund (IMF), the World Bank and the Bank for International Settlements (BIS). From 1995 until July 2011, Dr. Ghandour served as Chairman and General Manager of Lebanon Invest sal, a leading financial services group in the region whose holding company merged with Bank Audi in 2000. Since 2000, Dr. Ghandour has also served as member or Chair of the boards of a number of subsidiaries of the Bank Audi Group including (i) Chairman of the Board of Directors of Banque Audi (Suisse) SA from 2011 until 2015, and (ii) Chairman of the Board of Directors of Audi Investment Bank sal from 2005 until 2011.
Dr. Ghandour holds a PhD in Economics (Econometrics) from the University of Illinois (Post-doctorate research at Stanford University).
Board Member since April 2006 till March 2018
Dr. FREDDIE C. BAZ Dr. Freddie Baz is the Vice-Chairman of the Board of Bank Audi sal and the Group Strategy Director. He joined Bank Audi sal in 1991 as Advisor to the Chairman and founded the Secretariat for Planning and Development at the Bank. As Group Strategy Director, he is now responsible for the development of the Group strategy and for its oversight and communication, internally and externally. In addition to his duties as Group Strategy Director, Dr. Baz held the position of Group Chief Financial Officer of Bank Audi sal from 2006 to 2015, with overall authority over the finance and accounting, MIS and budgeting functions throughout the Group.
In March 2015, he decided, jointly with the Group CEO, to hand over his Group CFO responsibilities to his deputy, in conclusion of five years of cooperation and of common efforts to achieve that objective. In June 2015, Dr. Baz was appointed Vice-Chairman of the Board of Directors of Bank Audi sal and Bank Audi’s representative on the Board of Directors of the Association of Banks in Lebanon.
He is also the Chairman of the Board of Directors of Bank Audi France sa, a fully owned subsidiary of Bank Audi, and a member of the Board of Directors of several affiliates of Bank Audi. Furthermore, he is the General Manager of Bankdata Financial Services WLL which publishes Bilanbanques, the only reference in Lebanon that provides an extensive structural analysis of all banks located in Lebanon, in addition to other specialized periodicals and reports.
Dr. Baz holds a State PhD degree in Economics from the University of Paris I (Panthéon – Sorbonne).
Board Member since April 2006 till March 2018
Dr. Imad Itani is the Head of Retail Banking of the Bank Audi Group. He has served as a member of the Board of Directors of Bank Audi sal since 2002 and has been a General Manager since 2004. Dr. Itani started his banking career at Bank Audi in 1997, after having worked for a few years in Corporate Finance for major energy companies in Canada. Dr. Itani formed and headed the team that successfully launched the Bank’s Retail business line, today a major pillar of the Bank’s innovative and leading position. In 2002, he was appointed Deputy General Manager and Member of the Board of Directors. He was later appointed General Manager – Head of Group Retail Banking. In addition to his responsibilities as Head of Group Retail Banking, Dr. Itani is also Head of Group Islamic Banking. He is the Chairman of the Board of Audi Investment Bank sal, a fully owned subsidiary of Bank Audi, and a member of the Board of Directors of Odeabank A.Ş., Bank Audi’s subsidiary in Turkey.
Dr. Itani holds a PhD in Economics from the University of Chicago and is a former lecturer in Economics and Finance to graduate students at the American University of Beirut.
Board Member since May 2016
Dr. IMAD I. ITANI
Mr. ARISTIDIS I. VOURAKIS Mr. Aristidis Vourakis joined Bank Audi sal as Deputy Group Chief Executive Officer in April 2017 after 19 years with J.P. Morgan, where he was Managing Director leading a J.P. Morgan team focusing on Financial Institutions in Central Eastern Europe, Middle East, and Africa. He was also JP Morgan’s Senior Country Officer for Greece and Cyprus. Based out of London, Mr. Vourakis has led a large number of capital raising, funding and IPO transactions for credit institutions across Europe, and managed the development and implementation of regional expansion strategies and group re-organizations. He has also supported a number of Greek companies and the sovereign itself, in accessing international capital markets following the sovereign debt restructuring in 2012.
Mr. Vourakis holds a M.Sc. in Accounting and Finance with distinction from the London School of Economics and Political Science.
Board Member since February 2018
18 19

Mr. KHALIL I. EL DEBS Mr. Khalil Debs joined Bank Audi sal in 1995. He currently acts as the Group Head of Corporate Banking overseeing the corporate and commercial lending activities of the bank’s entities spanning across several countries in addition to his role as a member of their respective credit committees.
Mr. Debs actively contributed to the regional expansion policy on which Bank Audi embarked since 2004. He subsequently established in 2008 the group’s syndication and project finance division, which successfully structured and led a number of key transactions in the MENA region.
He currently serves as the Chairman of Solifac (Bank Audi’s factoring arm in Lebanon) and is a member of the Board of Directors of Odeabank A.S. (Turkey), Bank Audi LLC (Qatar) and Audi Investment Bank (Bank Audi’s investment arm). Prior to joining Bank Audi sal, he worked with ABILLION-AMRO Bank N.V. for two years.
Mr. Debs holds a Master in Business Administration from the Lebanese American University and is a Chartered Financial Analyst (CFA) since 2001.
Board Member since February 2018
Mr. MAURICE H. SAYDE Mr. Maurice Saydé is a prominent Lebanese Banker, a previous member of both the Lebanese Banking Control Commission and the Higher Banking Commission of the Lebanese Central Bank.
Mr. Saydé started his banking career in 1962 at the Banque de Syrie et du Liban where he remained until 1966, when he joined the Banking Control Commission. He moved to Crédit Libanais sal in 1970 and was appointed its General Manager in 1985. He remained in this position until his appointment, in 1990, as member of the Banking Control Commission and member of the Higher Banking Commission of the Lebanese Central Bank. He occupied these positions until 1998.
He has acted as Group Advisor to the Bank Audi Group notably on Corporate Risk Management and was elected member of the Board of Directors of Bank Audi sal and Chairman of its Group Audit Committee from June 2006 until July 2008.
Since then he has acted as Advisor to the Board of Directors of Bank Audi sal for Audit Committee matters.
Board Member since June 2011Resigned as of March 2018
Mr. MOUNIR F. ABDELNOUR Mr. Mounir AbdelNour is a Member of the Board of Directors of several leading industrial and non-bank financial companies in Egypt and acts as Senior Adviser for Rothschild & Co in Paris, one of the world’s largest independent financial advisory groups.
between 2011 and 2015 Mr. AbdelNour was Minister of Tourism, Minister of Investments and Minister of Trade and Industry.
Prior to joining the Egyptian Cabinet, Mr. AbdelNour was founder and Chairman of Hero Middle East and Africa, previously Societe Egypto-Franciase Pour les Industries Agro-Alimentaires (Vitrac ), member of the Board of Directors of Egypt Arab African Bank, Founder and Managing Director of Egyptian Finance Company, Vice President of American Express Bank and representative of Banque de l’Union Europeenne Paris in Egypt and the Middle East.
Mr. AbdelNour was a member of the Board of Directors of the Federation of Egyptian Industries, the Egyptian Competition Authority, the Cairo Stock Exchange and the Egyptian Expo and Convention Authority. He was Chairman of the Egyptian Center for Economic Studies.
Mr. AbdelNour earned his undergraduate degree in Statistics from the Faculty of Economics and Political Science, Cairo University and a Master’s degree in Economics from the American University in Cairo.
Board Member since January 2018
Board Committees Composition
# Executive MembersAudit
CommitteeRisk
CommitteeComplianceCommittee
RemunerationCommittee
1 Mr. Mohamed Fayed
2 Mr. Mohamed Bedeir
3 Mr. Afdal Naguib
Non-Executive Members
1 Mr. Samir Hanna
2 Mr.Hatem Sadek Chair
3 Mr. Aristidls Vourakis Chair Chair
4 Dr. Imad Itani Chair
5 Mr. Khalil El Debs
Non-Executive Members(Idependent)
1 Mr. Mounir Fakhry Abdelnour
20 21


3. Business, Risk, Support & Control Performance
A. Business Performance
I. Corporate Banking & SMEs
The Corporate Business Banking of Bank Audi Egypt with all its underlying lines of business (i.e. Large, Commercial & SME Departments) concentrated in 2017 on efficiency more than increasing asset volume, whilst continuing our penetration to all sectors and with special direction towards SME categories characterized by higher profitability levels.
Selling all the Banks’ products was also one of the Corporate Department’s prime targets over lending volumes. In addition, we focused on small club deals where Bank Audi was the initiator/leader in said deals; an example of this being the closing a club deal for EGP 500 Million (equivalent of US$ 28 Million) with a market leader in the Real Estate development where Bank Audi took the lead along with two other banks.
The Corporate Lending Portfolio as at end of December 2017 stood at around US$ 1.3 Billion, which was lower than year-end 2016 due to the aforementioned facts but with a higher profitability yield.
The year 2017 witnessed the boosting of the Bank’s SME’s portfolio, providing financing products and services to a wide range of SME business sectors through the CBE initiatives supporting the microfinance segment as well by financing the microfinance institutions.
The SME Business Model’s implementation had a positive impact on clients’ satisfaction leading to the achievement of substantial growth on the financial portfolio performance indicators. In fact, lending volume grew by 264% at the end of 2017 vs 2016.
It is worthy of mention that the Bank's SME Department was officially launched in February 2011 and by the end of 2015 lending volume was EGP 212 Million. In 2017 we witnessed a massive expansion in terms of lending volumes which increased by almost EGP 711 Million to reach EGP 1,144 Million coming from EGP 433 Million at end 2016. Constant reshaping of our SME’s Business Model in addition to lending policies, processes and services is necessary to enable us to meet the Bank’s lending objectives and align with regulator recommendations.
I I. Retail Banking
Bank Audi has always been active when it comes to extending financial support and adapting to clients’ ever-changing needs. Commitment to meaningful customer relationships as a key strategic objective, leads to the development of innovative products that directly reflect the mission and values at the core of its work. Bank Audi Egypt provides a wide array of alternative delivery channels that increased to 46 branches, 148 ATMs performing a total of nearly 4 Million financial and non-financial transactions and a high quality 24/7 call center.In addition, we launched the new payment service Mobile Wallet application “Audi2Pay” with multiple access pointsdepending on customer’s preferred ease and flexibility
features such as sending money, paying bills, purchasing online and with more features to be introduced during 2018.
The Bank’s Individual customer deposits increased by 10% growth rate, while total deposits (including corporate) increased by 4%.
The Credit card’s business produced a very solid earnings performance with Net Receivables recorded of over EGP550 Million. This represented the 5th biggest cards portfolio within peer groups with potential to reach the 4th rank during 2018, whilst the Credit cards average pricing reached 24.5 %.
In Retail Assets business, we started capitalizing on the opportunities in the SME’s asset finance market by launching the Very Small Business Loans “VSBL”; being businesses categorized with annual sales turnover starting with EGP 1 Million up to EGP 10 Million.
We built a franchise with 256 VSBL clients and a total portfolio of EGP 206 Million in less than one year.
Bank Audi Retail succeeded to grab the loyalty of its clients and increased our retail-lending portfolio to reach EGP 5.2 Billion as of December 2017. Despite the 2017 internal and external challenges, personal loans realized a net growth of EGP 182 Million since Dec 2016, with total portfolio of EGP 2.5 Billion. In addition, Auto Loans portfolio grew by EGP 62 Million to close the year with a total portfolio of EGP 1.2 Billion.
As Bank Audi has always been one of the leading banks in the Retail-banking sector, it’s ranked as the eighth bank in terms of total Retail lending portfolio between the peer groups of private banks as of Q4 2017. Moreover, the 7th in terms of Retail loans growth, 5th in Credit cards ENR and the 6th in Mortgage lending between the peer groups of private banks as of Q4 2017.
I I I. Treasury
Bank Audi Egypt’s capital markets division is a strategic business partner across all areas of the business. Adding value to the operating divisions of the bank, the Treasury’s function is important in making sure that the business has sufficient liquidity to meet its obligations, whilst managing payments, receipts and financial risks effectively. The Bank’s blend of fresh well-educated traders provide assistance to all of the bank’s business partners in order to spread the knowledge on the various treasury products it provides, in order to assure a mutual benefit environment.
In 2018, the Egyptian economy is said to be slowly turning a corner. International reserves are on the rise, the budget deficit for July-December fell to a multi-year low due to tight wage bill control and higher tax revenue. The Monetary Policy Committee’s strategy stance is also turning round the corner and is currently starting an expansionary policy that inaugurated in February 2018 with a 100 bps cut in the CBE benchmark interest rates. The Bank’s Treasury department has a well-built strategy in order to reap all the benefit from the improving economic stance especially on the fixed income side, and an increase in market securities prices is expected to lead to enhanced fixed income capital gains.
The Bank intends to expand its trade finance coverage to satisfy its corporate client needs, through signing trade facilitation programs with multilateral financial institutions to support Egyptian exporters’ trade transactions with Africa.
VI. Islamic Banking:
Within the framework of the development of the Bank’s Islamic Banking, the Islamic Banking team have been working on different aspects such as Islamic bank contracts, processes, products, image, financials and training. Moreover, as part of the restructuring, the Islamic Business Support department was established to serve and enhance main Islamic business functions. In addition, the Islamic Banking Departments contributed substantially to the transformation project of FlexCube.
Islamic Corporate department has succeeded to maintain a portfolio of EGP 1.25Billion including SMEs, Large Corporate, and Syndication finance.
VII. Global Transaction Services (GTS):
“Technical Innovative Solutions” and “Service Excellence” are the main drivers of our GTS department. GTS aims to be a top-notch Product & Service provider to all Business Banking clients in Trade Finance and Cash Management covering the full business cycle, as well as the Bank arm in corporate technology products innovation.
As part of the above GTS role, 2015 witnessed the original launch of a New internet banking platform phase ‘I’ for Business banking followed by phase ‘II’ in 2017 offering an easy, free, fast and highly secured transactional facility based on Business banking aspirations derived from Market research.
Under GTS service model, BESTSERVICE Unit (Business Easy Services & Transactions) is a contact center specialized for Business Banking, covering selective clients, providing them with transaction facilitation and execution as well as service requests and complaints handling.
In 2017, GTS provided the Bank’s Trade Finance clients with continuous consulting support helping them face the prevailing Egyptian and International trade situation as well as leading the trade export project offering more solutions to trade export clients. This included providing the Business banking clients with product management services in E-Channels and Cash Management.
Transformation projects
GTS department has been an active member and participator in Bank Audi Technology Transformation Projects, leading the implementation of the new revolutionary Internet Banking with the high security parameters in Soft and Hard tokens as well as implementing more functions supporting the corporate client’s daily transactions. In addition, GTS participated in the new Core Banking System transformation project and new Loan Origination system for SME's as well as new archiving systems.
IV. Capital Markets & Investment
Margin Trading and Custody:
The Bank’s Margin Trading and Custody Products successfully managed to increase two-fold in terms of utilization and book keeping under Bank Audi custodianship.
Delivery vs. Payment Product:
In line with the Egyptian equity market changes and the dramatic increase in trading volumes in 2017, we effectively managed to acquire new Delivery vs. Payment (DVP) clients and raise existing facility lines to brokerage companies dealing with Bank Audi.
Ezdehar Fund:
This Fund successfully achieved a return rate of 34.22% in 2017, keeping its leading position among the Balanced Islamic Funds.
The Fund has also achieved the highest cumulative returns among all the Islamic Funds throughout three years 2015, 2016 & 2017 with a return of 76.6% total.
Ezdehar Fund has been recognized by MENA Fund Manager Awards 2018 in Dubai for being Best MENA Equity Fund USD70 Million and Best MENA Balanced Fund for 2017 performance.
In 2018, we are efficiently targeting to widen the base number of Bank Audi partners to encounter any future market volatility in all Capital Markets business products fronts, along with enabling Bank Audi partners with new digital methods; deepening the relation with Bank Audi and facilitating their business as usual daily work by using the new enhanced technology in our new Core Banking System.
V. Financial Institutions & Correspondent Banking
In 2017, the Egyptian banking sector faced important challenges mainly due to the implications of economic reform including the exchange rate volatility of the Egyptian Pound because of the floatation that took place end of 2016.
During 2017, the Correspondent Banking strategy mainly was to attract new business, increase profitability, and function more efficiently; where it manages its business relationships through one of the largest correspondent bank networks worldwide covering more than 150 countries providing the best level of service to its clients
Moreover, the department succeeded to open two new Nostro accounts with major American and European correspondents and provided new Trade Finance and Treasury Limits to meet the client needs and sustain any excess liquidity.
Programs & Multilateral Relationships (PMR)
In 2017, Bank Audi Egypt disbursed USD 10MM from its loan agreement of USD 30MM, signed with the European Bank for Reconstruction and Development (EBRD), to secure additional sources of foreign currency mainly to satisfysmall and medium enterprises’ needs. The Bank widened its substantial relation with EBRD through successfully signing trade facilitation agreements under its Trade Finance Program.
24 25

GTS strategic milestones
Cultivating on 2017 achievements, GTS will continue over the coming years its role in introducing technology driven initiatives to pamper our Business Banking customers by improving their daily Transactions Experience. GTS will be focusing on accompanying the SME department in its journey for growth by new technology driven solutions like SME's cards / payments through Mobile wallet and deposit cards for E-channels usage and working with Bank Audi Group on SME digital banking as well as enhancing the Large & Commercial Corporate banking clients products, Technology & Service experience.
VIII. Branch Network
Despite the challenging macro-economic environment, the Branch Network witnessed yet another year of sound and consistent performance, and solid business growth. December 2017 ended with a liabilities balance sheet of EGP 47,373 Million, showing 4% growth vs. December 2016. Throughout 2017, 3 new branches were opened in strategic locations, namely Port Said, Damietta and Assiut, totalling our branch network to 46 branches.
The branch network core focus throughout the year has been on striving to attain the highest standards of operational and service excellence. In order to achieve this objective, the business underwent an enhancement in the branch structure enabling it to have a clear and dedicated focus on its core service pillars, with the aim of ensuring a seamless experience for the customer. This is also reflected in the high satisfaction rates evident through our customer voice surveys.
Our customer centric approach entails maintaining service levels that are not only favorably comparable with the top peer banks in Egypt but also aspire to some of the most recognized service led financial service institutions globally. The focus is not only on offering a bouquet of financial solutions but also on delivering them in a way that would bring about a paradigm shift in how customers can be served. Each element of the customer journey is reviewed extensively to find ways in which it should be enhanced to create a seamless, consistent and exceptional customer experience.
Bank Audi has created its branch network service model around forming firm and long lasting relationships with its customers. We build on this relationship by deepening our understanding of customer needs and providing the right financial solutions for the customer through multiple points of access, and responding promptly to his requests and having his concerns addressed by competent people. Our processes have been fine-tuned to deliver on a timely manner and we closely track and improve the response time that it takes to respond to a customer’s query. Our processes have also been re-engineered to minimize any repeated or controllable errors. Being customer oriented means taking feedback from the customer regularly and raising our standards every time. In short, service excellence is a management theme at Bank Audi and we continue to strive to go the extra mile for our customers.
Governmental & Public Sector
In line with the Bank’s vision of expansion to be one of the leading Banks in the market and to engage and strengthen the relationship between Bank Audi and key government and public sector entities, the division was established to cover two major areas, including all the accounts of the following:
- Governmental Entities including Sovereign Entities.
- Public Sector Companies & the Governmental related entities.
The Governmental & Public Sector division aims to identify needs, provide service quality, and enhance the range of products and services while expanding our business relationships with governmental and Public Sector Entities across several of the Bank’s existing business lines. The division is dedicated to serving and promoting all kinds of products and during 2018, will be focused on building a new segment, which will enable us to seize many opportunities by increasing our market share. This will eventually lead to even higher quality of service as we find different ways of attracting new clients in the sector and reactivating the Governmental Entities & Public Sectors existing companies, whilst at the same time increasing the Bank’s liabilities.
B. Risk Performance
Credit Risk
Bank Audi Credit Risk function encompasses several departments, namely Credit Risk Assessment, Credit Administration, Credit Investigation and the Loan Remedial department, all of which are geared towards safe and diligent granting of corporate credit facilities for proper utilization and monitoring.
The ultimate target of our credit risk management operations is to minimize risk to acceptable levels and reach optimal capital allocation by achieving a balance between the risk vs return of our portfolio, guided in our endeavor by international standards and best practices.
During the past 12 years, Bank Audi’s Credit Risk function has represented the main security valve in the Bank’s placements of funds with corporate clients; it has participated in the banks rapid yet safe asset growth and build-up of the healthy portfolio that is evidenced today by a safe risk profile.
On the technical side, the Bank has evolved during the years to move towards automation systems to achieve a more accurate and consistent credit granting process backed by globally renowned systems and institutions.
During the years of turbulence that the market has endured, Bank Audi Credit Risk has remained vigilant to the factors at play, yet was able to maintain enough vision and flexibility to aid the Bank’s business developers to assist their clients in these stressed times.
The results of the past efforts are evident today in a corporate credit portfolio that shows an average risk rating that is on the desirable side of the acceptable levels with an NPL ratio lower than 1.5%.
Operational Risk takes part in decision making processes at the three key and inter-linked Strategic, Management and Operational levels, through the following:
• Involvement of the Risk function as key partner in all the new projects, products & services
• Effective participation in all the bank committees
Bank Audi Egypt has a solid internal loss database of 11 years that enables the Bank to manage its risks efficiently and give a clear picture of the Bank’s risk profile. This puts the Bank in a better position to choose among its best alternatives for operational risk mitigation within its risk appetite guidelines. This goes hand in hand with being managed by well-set policies and procedures that consider the needed controls to mitigate the risks to tolerable levels.
In addition, an automated solution is used to help the Bank obtain better analysis of its solid Loss Database, leading to more proficient display of its overall operational risk picture. The implementation of the new Core Banking System provided a platform to ensure that all the Banks’ procedures are reviewed and updated in a timely and risk appropriate manner, including the adequacy and levels of controls. In turn, this will enhance or maintain as well as boost the Bank’s workflows efficiency, which will depend more on effective system controls rather than manual ones.
Retail Credit Risk
Bank Audi Egypt’s Retail Risk function continues to pursue the Bank’s pre-set strategy and business model of creating, maintaining and improving the risk management and control environment of its Retail risk exposures. The main objective remains to be promotion of portfolio growth in a well-controlled and efficient environment through system driven processes and decisions that ensure consistency, accuracy, reliability, and timeliness of credit decisions.
2017 was a year of validation, testing, and improvement. After the implementation of application scorecards and roll out of automated analytics reporting and dissemination, our systems and processes were stress tested during the volatile economic conditions post the devaluation of the Egyptian pound. Portfolio resilience and robustness of processes were demonstrated by the maintenance of asset quality while growing the portfolio at the desired rate.
After having invested in an overhaul of our core banking system, middleware, and peripheral systems, namely a new origination platform, the transformation marks the completion of the upgrade in the core retail credit risk systems. The newly implemented applications will allow more flexibility with product offerings, faster time to market, better control environment with automated de-duplication and fraud detection, enhanced data control and accuracy, and finally improved efficiencies and productivity across retail credit risk processes.
The newly implemented systems when combined with an experienced, well trained, and highly competent team yield a positive outlook for Bank Audi Egypt’s future growth, asset quality, and profitability prospects. Our customer centric
On the internal part, the Bank’s Credit Risk management have been with the Bank since its inception and managed to build up a strong team of exceptional calibers around them that have ensured loyalty and commitment to sound credit risk practices whilst facilitating the Bank’s ability to grow.
Looking forward, we are aware of the challenges and market pressures that face the banking sector in Egypt. Our role is to carefully select and cater to new categories of clients, which call for innovative and out of the box ideas while maintaining regulatory based prudence in line with the environmental conditions.
Market Risk
Bank Audi’s Market Risk function started in 2007 by establishing and applying a Market Risk Management framework by which the Risk Department currently identifies, analyses and monitors all market risk factors within the Bank. The function also conducts different scenarios, stress testing and correlates its findings to capital adequacy, liquidity and profitability to provide advice to senior management and the Board.
The Bank is exposed to market risk, primarily arising from open positions related to currency, of which each is exposed to market movements and foreign exchange rates. The Bank separates its exposure to market risk into trading and non-trading portfolios.
The Bank’s Market Risk management division oversees, reports and advises management and its committees, (such as ALCO) and the lines of business on the market risks arising from trading and non-trading activities. Regular reports are submitted to the Board of Directors and each business unit head.
Foreign currency and interest rate risks arise out of the Bank’s interest and currency exchange rate sensitive assets and liabilities. The mismatch in the re-pricing dates of these positions creates interest rate risk for the Bank, which is inherent to its banking activities. The Bank sets appetite, tolerance and limits for its various market risks to ensure that they remain within acceptable bounds.
Operational Risk
Operational Risk department is one of the main and vital Risk management arms of Bank Audi Egypt. It is already embedded in the management decision-making process through its involvement in the new products and services offered to the Bank’s customers, the analysis of all unusual events, determining their root causes and setting the necessary mitigation actions.
26 27

approach has only been strengthened and with professional human resources, teamwork culture backed by state-of-the-art systems, the Bank is poised to deliver the desired returns to the shareholders.
C. Control & Support Performance
I. Support Functions
Operations
Core Banking change and its effect:
• Bank Audi Egypt’s Transformation Program started in December 2014 and went live in November2017. Given the magnitude of related operational tasks and changes, this represented a remarkable professional team effort maintained consistently over an almost 3 year period. The base infrastructure was built based on new systems hardware with sizing calculated for each project, and the core base for integration (MiddleWare) was the first implemented project. The new system has the ability to offer any new products smoothly & effectively, including monitoring, managing and regulating operational processes as well as their related compliance and reporting.
• The new system will enable users in the future to simply and rapidly analyze products, review current profitability data and trends to better optimize business decisions and manage competitive pressures, and review standard reports and enhance accountability by monitoring branch-level performance.
• The use of FlexCube will enable the business lines to take fast and accurate business decisions, which will be impacted on customers, so that after a stabilization period, the system will help us to deliver the services efficiently in a faster way.
Efficiency
• Collection/Clearing & Commercial Papers: Efficiency has been enhanced by the integration of check processing between the Bank’s new system (FlexCube) and checks system (Daltex) and a copy from checks are archived in the Daltex database, which facilitates any historical search.
• Trade Finance: We have added new products that did not exist on the TI system and registered all outstanding L/G’s related to such products on TI. Many enhancements to the reports generated from the TI system were made, which will in time ease the reporting process and lessen the time consumed to finalize it. In co-ordination with MIS department, we have managed to prepare, extract and upload some of our CBE monthly reports instead of inserting it manually on CBE’s web page. This has reduced time consumption for reports by 30%.
• Back Office Treasury: We succeeded to go-live with our new core system “FlexCube” for Clients’ fixed income products. FlexCube shifts any manual process to an automated one, which will then provide a speedy, high quality services presented to our clients and enhanced the overall controls of Fixed Income products, consequently Treasury products’ related risks have been reduced.
Finance
Finance, through its various departments, plays a major role in the Bank’s growth, stability, and compliance.
The main objective of Finance is to enhance the usage of all financial figures that can be extracted, derived, or forecasted to add maximum value to the Bank in terms of transparency, effective and efficient decision-making, performance measurement and accountability, and control.
• Transparency: Financial reports and statements sent to all stakeholders are done in accordance with related standards and regulations including all detailed disclosures to present the most useful and comprehensive financial position and performance of the Bank.
• Decision-making: Finance department supports internal decision making by presenting financial figures as well as applying knowledge in terms of performance evaluation, budget preparation, asset and liability management, accounting treatments, application of standards, anticipating tax effects, and presentation of scenarios.
• Control: Finance closely monitors transactions and parameters applied on customer accounts that have an effect on P&L to ensure on daily basis that P&L is reflecting correct figures with explanations for daily trends and movements.
Finance also controls payments to suppliers by executing their related cash outflows, recording expenses and capitalized assets, and preparing all analysis and track records related to payments for control and decision making purposes in addition to making payments on time to keep the good relationships with the bank’s business partners.
• Compliance to standards and regulations: Finance makes sure that all financial standards, CBE regulations, and tax laws have been met .Accordingly accounting and financial reporting standards, CBE regulations, and operational and income tax laws are always reviewed and reflected in payments, reporting, and accounting treatments of our bank transactions.
Finance plays a major role in the application of new standards as currently done for IFRS 9, where members of Finance work together with members of other departments to ensure the most professional application of the standards and guides them towards building models and preparing policies and procedures that ensure proper application.
Year 2017 has been a monumental year in Bank Audi Egypt’s journey as it has witnessed the completion of the transformation systems project.
Currently the Bank is applying a set of satellite systems working in harmony with the core banking system as well as a data warehouse for financial and risk reporting.
Moving towards this set of new systems increases the effectiveness and efficiency of our bank’s operations, optimizes the control environment, and enhances financial reporting and analysis capabilities.
Al Fanar program comprises 5 distinctive projects to tackle the Bank’s pressing business needs:
• Core Banking System (Oracle FlexCube Universal Banking system - FCUB):
This project will empower the Bank to provide new Retail and Corporate products and services. It will allow increase in market share, improve operational efficiency, manage risk and improve control over all Bank processes.
• Online Banking Solution, Internet & Mobile Banking (Oracle FlexCube Direct Banking System FCDB):
This project will improve existing direct channels to our customer base, allowing better services. It will introduce Mobile Banking to our customers and provide a significantly improved Internet channel. The solution adopted will increase availability and reliability of the services provided over the multiple channels.
• Document Management System (IBM DMS):
This project will provide electronic archiving of all documents in the Branches and Bank departments to fulfill regulatory requirements, decrease turnaround time for document retrieving and improve overall process workflow and efficiency.
• Integrated Finance and Risk Management System (Oracle IFRMS):
This project will fulfill all regulatory reporting requirements as well as all financial reporting. It will increase the Bank’s ability to produce and manage information.
• Treasury Module (MUREX):
This project will provide better control and monitoring of all Capital market operations.
Human Resources
The Human Resources Department’s strategy is focused on the employees and the power of human capital. Initiatives were taken by designing new strategies, HR plans and polices in coordination with all lines of business. In 2017, The HR Department worked on providing equal opportunity through designing and applying new salary and benefits structures, revisiting the Bank grading structure and re-allocating over 800 employees on their new grades and subsequently adjusting their pay. Moreover, the HR team managed to develop and redesign all the HR policies and procedures to be announced and applied during Q1 2018 with the aim of speeding processes, ensuring cost effectiveness and competing with the banking sector in Egypt. Human Resources Department played an effective role in enhancing internal communications through organizing several social activities and trips to ensure harmony among the Bank’s teams.
Strategic Planning
During 2017, the Strategic Support Unit further elevated its analysis of the impacts of the external environment and macroeconomic factors on our Strategy. The Strategic Support Unit also utilized market knowledge of peer banks’ rankings to advance the bank-wide strategy formulation
Information Technology
One of the critical success factors in the banking sector remains the ability of Information Technology to support a bank’s business strategy. The Information Technology department within Bank Audi Egypt provides all levels of service and support to the business expansion throughout its lifecycle from strategy to execution and finally to operation and continual service improvement.
One of the ways of gaining or sustaining an edge in the market is by investing and utilizing new levels of IT ability and flexibility.
During 2016, the Bank’s IT Department took many giant leaps towards the ambitious goal set by Management for the completion of Business Technology Transformation under the umbrella named “Al-Fanar Transformation Program” with a target date of second half of 2017.
Throughout 2017, Bank Audi IT Department managed to streamline and maintain smooth operation of existing legacy systems while meeting target delivery dates of key milestone projects within “Al-Fanar Transformation Program” such as delivering Phase I of the “Document Management System” Project, delivering Phase I of the “Murex Treasury System” Project and delivering Phase I of the “FCDB Internet Banking” Project.
In parallel to the above tremendous challenge, the Bank’s IT Department managed to steadily carry on many large sized projects aiming at enhancing the IT Infrastructure to offer a more reliable, available and consistent customer and end user experience, targeting all customer channels, from branches, to ATMs and finally to the new internet banking platform.
A key factor in the success story of the Bank’s IT Department throughout the year 2017, is the ability to deliver on time, jumping over the obstacles, running parallel projects with a highly optimized number of resources, where IT resources serve as key players in various parallel projects with no effect on quality nor delivery target date of any of the projects.
Adding to the above, and part of the Bank wide strategic plan for 2015-2018, the Bank’s IT Department planned a short, medium and long term projects plan to support Bank Audi Egypt’s ambitious business plan, by offering business technology oriented solutions, aiming for enhanced customer footprint and improved customer experience against market benchmarks, and keeping Bank Audi Egypt’s image as the technology Innovative Bank in the Egyptian market.
Moreover, the Bank’s IT function is technically leading the bank-wide efforts for “Al-Fanar Transformation Program”, bridging the gap between the application functionality, market demand and business requirement through the introduction of the Business Technology team inside the IT Department, where the team includes skilled resources in technology solutions with the adequate Business Knowledge and background.
28 29
process and address areas of concern that have arisen in the previous year.
In ensuring full alignment between the Strategic Support Unit and all other functions, KPIs have been tweaked and adjusted to mirror the Bank’s directives of the year, specifically: cost of funds, profitability and customer service levels, and to actively support these high-level goals, the Strategic Support Unit played a pivotal role in embedding and highlighting all the relevant KPIs into all functions’ Key Activities for the year 2017. A high-level cumulative Red Flag Report is produced quarterly and presented to the Management Committee to shed light on action needed on pending issues.
Finally, the Strategic Support Unit, in conjunction with our in-house Project Management Office (PMO) will roll out the Strategic KPIs Module, which enhances efficiency and allows for a more timely production of needed reports from different perspectives.
PMO
In order to accomplish any institution’s goals and objectives you must have an efficient tool to regularly measure performance of their functionalities, as this represents the lifeblood for delivering value to our stakeholders.
The Bank’s management is eager to finalize the approvals stage to start-up a complete solution (first phase) to accurately measure the performance (KPIs) of different functions throughout the Bank including their sub-functions and individual levels. This (In-house developed) solution – by the PMO – can help facilitate handling the aspects of planning activities and KPIs through the Bank’s different functions.
The new solution’s goal is to ‘gain visibility & info-sharing’ over the bank-wide functions’ portfolios, thus ensuring greater strategic alignment. Moreover, it enhances the investment of the Bank’s overall resources and avails a wide-range of analysis and reporting and improves turnaround time for preparing and following-up on each functions’ quarterly performance reports.
As requested by the Strategic Support Unit, the main features of the new solution are that it provides a structured and unified format (drop-down and assisting menus), where management can easily view the ‘big picture’ and monitor hotspots (Areas of Concern). Reports of all ‘lagging initiatives’ can be generated automatically and sent directly to the functions’ heads and Executive Management and any KPI reports can be generated accurately from the system.
Marketing & Communication
2017 was a significant year on several fronts from a communications standpoint mainly on the following platforms:
Communication
Our Internal Communication team has shown complete dedication in communicating on a regular basis to discuss diversified topics from travel and purchase offers, to announcing new products, campaigns or offerings, or for internal job postings and hiring and movement of staff.
2017 has grounded this function and has made it more confident with a set calendar and specific timings of communication sharing. Not only that, but the Bank’s Intranet has been finalized and is ready for data update and launch so that there is a comprehensive platform that will provide all staff with instant answers to any questions they may have on products, HR issues, governance and other updates.
Externally and after assigning a new PR Agency, the Bank has grown exponentially in the amount of unpaid press releases on all fronts on both print and online portals and publications.
Corporate Social Responsibility
In 2017, Bank Audi Egypt has pooled its efforts to concentrate on a few activities that would target its responsibility towards its employees, and the public.
The Bank believes in the value of its staff and thus has sponsored and communicated to the Bank’s employees sponsorships made for some sports activities that were carried out of Egypt by providing the staff travel and accommodation facilities to travel and represent Egypt. On the charity front and in an attempt to regularly donate to Cancer Institutions, the Bank has collaborated with Baheya Breast Cancer institution through a co-branded credit card where up to 1% of all customers transactions are directed to the organization as donations. On the same medical platform, the Bank has carried out a nationwide blood donation exercise targeting not only staff at the head office, but through a road show that has travelled to all branches encouraging all staff to donate their blood to the National Blood Bank of Egypt.
Finally, and as part of the Central Bank of Egypt financial inclusion initiative, the Bank has participated through the following activities: Road show to selected cities to explain to people what financial inclusion is; Activations in schools and universities to explain the same; Waiving of admin fees for a certain time to entice people to go to banks; and finally offering tailor made youth products with high interest rates.
To top all that, and following international technical standards, Bank Audi Egypt has been awarded the Leadership in Energy and Environmental Design (LEED) Gold Certification for its new headquarters. The building is outfitted with solar panels, solar heaters, water treatment system, green air conditioning systems, and large windows to save energy consumption.
Market Research
The Market Research Department plays a vital role for all bank departments including the non-business ones as it helps in:
1- Providing the Bank’s various departments with valuable, accurate and up-to-date information, which helps in decision-making, and new business acquisition.
2- Running different types of structured surveys/studies to measure, assess and analyze the Bank’s performance; and benchmark its products and services to the marketplace.
3- Running geo-marketing studies to assess the new locations where the Bank should expand its branches and ATMs network, which helps deciding the best locations to have new branches and ATMs and reach the fastest return on investment.
4- Helping the various lines of business in building their new business models by running different types of structured surveys/studies to identify the market gap/need and segment the targeted clients.
The Bank values the importance of market research on both directions: launching new product/service, and assessing existing products’ performance.
In the case of a new launch, we help in defining, classifying and understanding both market and targeted customers’ needs, defining the available gaps in the market to use it as business opportunities and assessing the peer competitors’ performance which helps in the new banking products/services development and the way it should be delivered and communicated to the market and targeted customers.
In the case of running business, we usually conduct market surveys and scanning for selected peers/ features / edges / customer preferences in order to assess our products versus peers and always be ahead of others with a competitive advantage in order to be always able to satisfy and retain our customers, and the ability to attract new ones.
The Market Research Department managed to increase and diverse its data resources which lead to increasing the number of business databases provided within 2017 for the various business lines.
Service Excellence
Mirroring BANK AUDI’s core values and strategic direction, the Service Excellence department paid special attention to aligning its own business plan to our bank-wide one. As Bank Audi Egypt further grows as a prominent customer-centric organization, we are continuing our full devotion to service as the main driver for business acquisition, customer approach and retention and focusing on service level to be our competitive edge.
Service Excellence department plays a pivotal role in ensuring the effective implementation of such levels of service on the ground, through synergizing between our variety of channels on one hand, and customers on the other. This is reinforced through the effective interaction between front-liners and support functions, to achieve customer satisfaction by utilizing our efficient work environment, and ensuring that our customers have an excellent customer experience through hearing their voices through many channels. This allows us to work on process enhancements and all needed improvements that would reflect on service quality.
The core business directives of Service Excellence are a reflection of the Bank’s core values in the following ways:
Transparency: Building interactive channels of communication between departments and various lines of business / branch network, in addition to support functions in order to enrich
and strengthen the interrelationships that are necessary in achieving the bank’s optimal objectives.
Innovation: We built a reward program comprising innovative ideas as one of its main pillars, to encourage our human capital to consistently contribute with their positive thinking and enhance overall engagement.
Quality: Quality is characterized in our service, staff performance, communication and all aspects related to our customers, staff and shareholders.
Engineering
The Engineering Department played a central role in the handing over of the new Head Office premises located in New Cairo. The building is built on an area of 33,000 square metres, distributed among 11 levels. During 2018, the Engineering team will finalize the initial design in the most efficient and suitable way. Moreover, the Engineering team managed to deliver 3 new branches and renovated 2 branches according to the Bank’s standards and identity.
Administration
The Administration department’s achievements during 2017 were; creating a cycle and system to make sure that all Head Quarters’ furniture is in good condition and cleanliness expectations were met; supplier workers reduced to half; and improving the overall quality of services. New suppliers were selected according to a specific standard selection.
Procurement
During 2017, the focus of our initiatives was to maintain cost and time efficiency in harmony with high quality product standards. A Supply chain study was held in 2017 and will be implemented in early 2018. The project objective is to develop accountable supply chain process flows and procedures for the procurement and warehouse cycle. In addition, we implemented several case studies for the market, which led to unexpected saving achievements in spite of the inflation and foreign currency fluctuation impact on prices. Launching the new core banking system and linking the supply chain process to it, obviously maintained better control overall process starting from receiving order requisitions until products are delivered to Requester/Warehouse. The core banking system was also an effective tool for monitoring performance and providing various automated reports.
II.Control Functions
Legal
During the past years, the Legal Department has been working on different levels to legally give support to the Bank’s business and towards boosting its growth plans.
Building the Legal Department’s human capital has been a key focus throughout past years; starting from a small team consisting only of 3 lawyers and reaching a team of 15 experienced and young qualified lawyers who enjoy diverse experiences and great understanding of the business, and whose main focus is to provide efficient and timely services to our business lines and clients and to support the Bank’s image and reputation. We have successfully built an institutional
30 31

structure within the Legal team by creating second and third lines of management to ensure sustainable level of efficiency and support.
Litigation:
The professional management of lawsuits by the Legal Department resulted in the Bank being awarded favorable judgments in a number of major lawsuits, where the relevant courts issued their verdicts obliging the defendants to settle unpaid debts to the Bank plus accrued interest. Numerous court verdicts were issued in favor of the Bank in civil and criminal cases.
Legal department participated in negotiations and preparation of rescheduling of debt and amicable settlement arrangements for several cases, with total rescheduling/settlement of debts amounting to over EGP 160 Million and USD 11 Million.
Legislative:
The Bank’s Senior General Counsel had an interactive role in reviewing and commenting on the draft of the new CBE law.
The New Core Banking System:
The Legal Department participated in reviewing the contractual documentation needed with external IT Service Providers for proper implementation and execution of the new core system.
Before the GO-LIVE Date of the new core system, the Legal Department successfully handled all legal queries raised by the core system team as well as reviewing all forms of invoices automatically generated from the new core system with regard to any banking transaction made through it.
Products & Services:
- The Legal Department has always been a key participant in establishing and providing new products and services to the Bank’s clients, working side by side with the business lines to create and develop the necessary legal platform and documentation.
Actively supporting all business lines in Egypt to provide efficient legal advice and support striving to find legal solutions to cater for the clients’ needs and facilitating transactions while safeguarding the Bank’s best interests. We also provide support to Bank Audi sal Legal Department, and to other entities within the Audi Group, on matters related to Egyptian law issues.
The Legal Department provided all necessary support to the Bank’s business lines for successful execution of numerous loans, syndicated facilities, Islamic finance transaction, structured finance deals, acquisition finance, mortgage finance, real estate and commercial mortgages and various types of securities.
Audit
Across the Internal Audit Journey in Bank Audi Egypt, the Audit team encountered many challenges starting from the first stage to establish the Internal Audit department in line with professional standards, risk based methodologies and
best practice. The audit team has succeeded in creating an encouraging environment that exploits the team’s potential to participate in building a concrete structure for the department.
In this regard, the audit team is updating on a regular basis internal audit policies, audit procedures, audit charter, in addition to several audit work programs across different types of business and banking operations for the sake of quality and consistency as to reflect the rapid changes occurring inside the Bank and the market . However, the audit team will remain the cornerstone of development, which is able to create and add value.
The Internal Audit team believes that it has a crucial responsibility to reinforce the control environment within the Bank in order to create a solid culture whereby risk exposure would be mitigated within the Bank’s risk tolerance. Consequently, the team went the extra mile and reflected such orientation into the department KPIs to impose a positive participation of each auditor to add value toward the Bank.
The Risk Based Audit (RBA) plan 2017 had been successfully achieved over the major four audit activities; Branches’ Audit, Centralized Operations, Head Office, and IT. The audit plan had been completed in accordance with laws, regulations, professional standards and Internal Audit KPIs. Regarding the Bank’s new core banking system, Internal Audit performed a review on the testing phase of the new core banking system and issued a report with all the observation revealed during the review process for management consideration.
For the upcoming challenges, the department is targeting the quality of audit processes, service delivery, and efficiency of communication. In addition, Internal Audit department is in process to reflect the changes that have occurred in all Bank departments/branches due to the implementation of the new core banking system on the audit work programs in order to assess any potential new risks and the way to mitigate those risks. Therefore, the department is challenging dynamic changes, which will impose a continuous development in our experience, competences, updating audit tools and scope under the umbrella of a risk based audit methodology.
Compliance
The new core banking system will enhance the Banks’ compliance capabilities, specifications and features through the embedded controls within the system. In addition, the new core banking system will boost the competencies of the Compliance and AML monitoring systems securing timely and efficient monitoring of all compliance operations and improving the TAT for related processes supporting the Bank’s strategic expansions.
Going forward, the Compliance department will continue to assist the Bank in achieving its financial, operational, and strategic goals while maintaining compliance with all associated laws and regulations through identifying all related risks, performing investigations, and analysis. Moreover, the Compliance department will continue to act as a safeguard
for the Bank risks while upholding compliance issues through effective education and training programs, and fostering the values of knowledge, honesty and professionalism.
CISBC
Bank Audi Egypt recognizes the importance of information, which is considered to be one of the most critical assets of the Bank and how information is managed, controlled and protected has a significant impact on the delivery of services. Information assets must be protected from unauthorized use, disclosure, modification, damage and loss. Additionally, information assets must be available when needed, particularly during emergencies and times of crisis.
In this regard, CISBC focused in its security program on setting up security measures, implementing best security practices, acquiring best solutions and applying many security controls to protect clients’ valuable information and to ensure the continuity of Business operations.
Cyberattacks have increased in the last few years; Therefore,
CISBC is adopting several measures to reduce the risk of cyberattacks and protecting the Information assets from the unauthorized exploitation of systems, networks and technologies.
As part of our roadmap, initiatives undertaken this year include the following: assisting in and evaluating the new core banking systems and providing security requirements and recommendations; and in compliance with the set of Information Security Policies and standards, reviewing and testing the access rights for all Transformation Systems before they go live to ensure applying the segregation of duties concept.
CISBC also conducts vulnerability assessments on all operating systems for new core banking system servers and on all satellite systems, which have interfaces with core system as well as evaluating the e-channels from an information security perspective to ensure compliance with internal and external auditing recommendations as well as regulatory requirements.
32 33

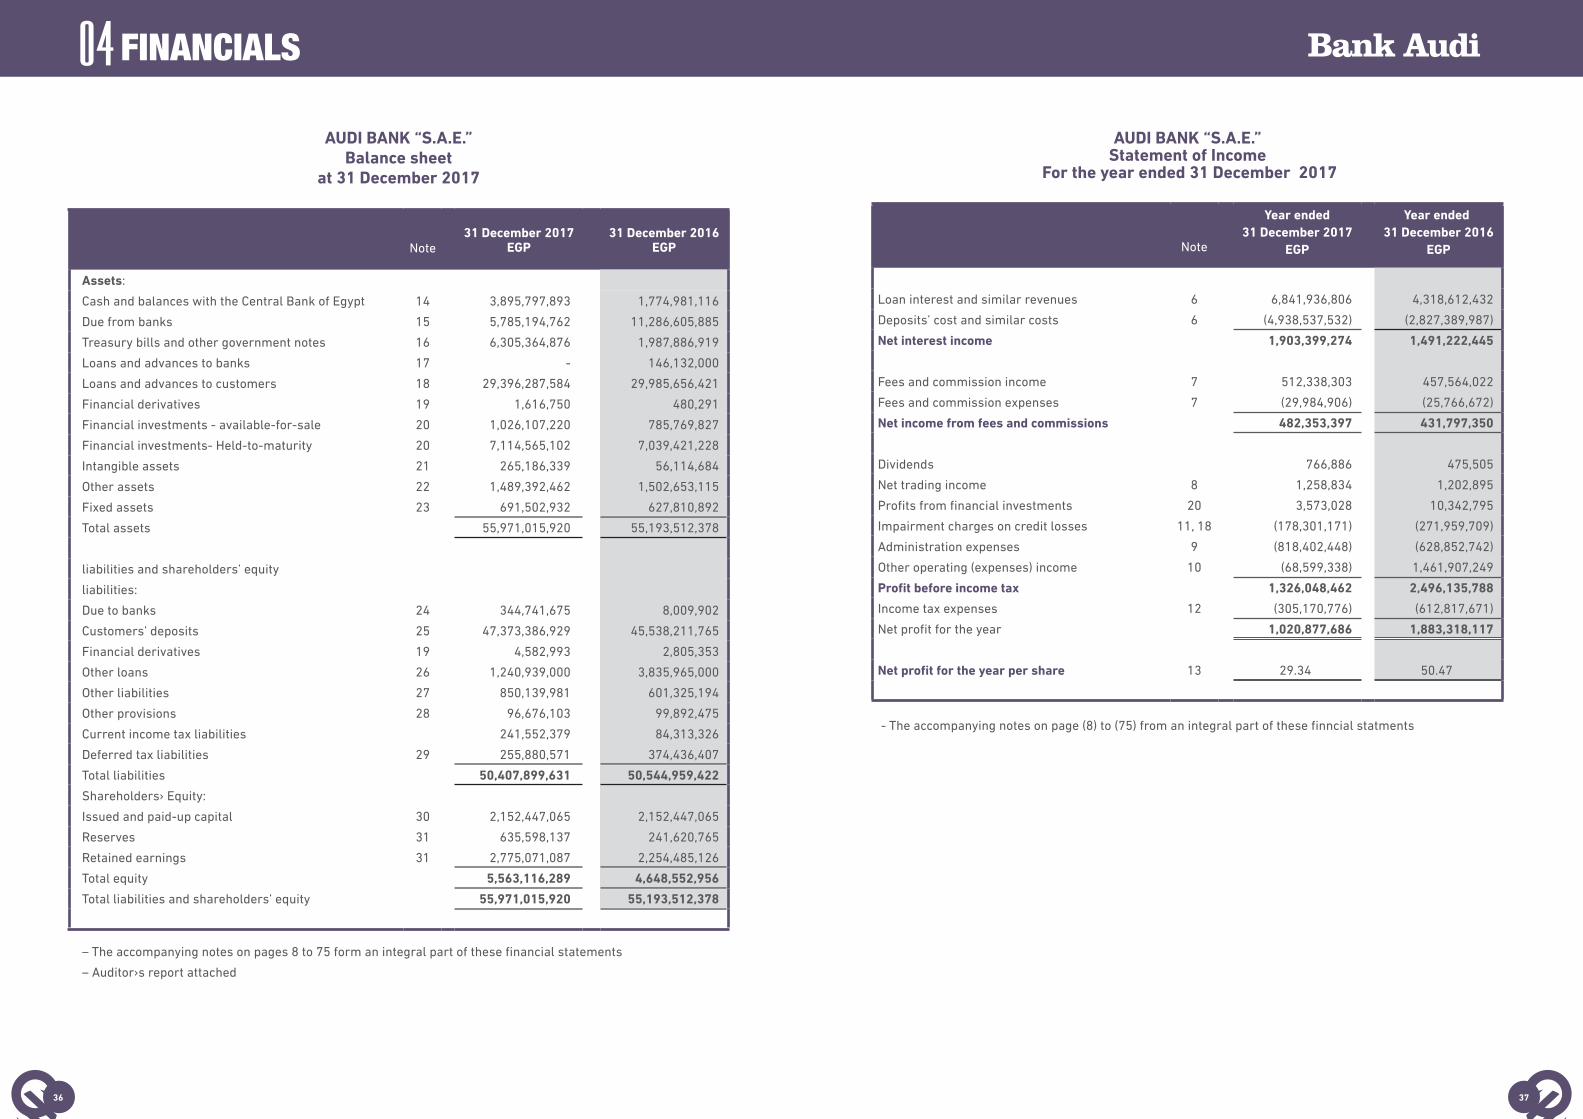
FINANCIALS04
AUDI BANK “S.A.E.”Balance sheet
at 31 December 2017
Note 31 December 2017
EGP31 December 2016
EGP
Assets:
Cash and balances with the Central Bank of Egypt 14 3,895,797,893 1,774,981,116
Due from banks 15 5,785,194,762 11,286,605,885
Treasury bills and other government notes 16 6,305,364,876 1,987,886,919
Loans and advances to banks 17 - 146,132,000
Loans and advances to customers 18 29,396,287,584 29,985,656,421
Financial derivatives 19 1,616,750 480,291
Financial investments - available-for-sale 20 1,026,107,220 785,769,827
Financial investments- Held-to-maturity 20 7,114,565,102 7,039,421,228
Intangible assets 21 265,186,339 56,114,684
Other assets 22 1,489,392,462 1,502,653,115
Fixed assets 23 691,502,932 627,810,892
Total assets 55,971,015,920 55,193,512,378
liabilities and shareholders’ equity
liabilities:
Due to banks 24 344,741,675 8,009,902
Customers’ deposits 25 47,373,386,929 45,538,211,765
Financial derivatives 19 4,582,993 2,805,353
Other loans 26 1,240,939,000 3,835,965,000
Other liabilities 27 850,139,981 601,325,194
Other provisions 28 96,676,103 99,892,475
Current income tax liabilities 241,552,379 84,313,326
Deferred tax liabilities 29 255,880,571 374,436,407
Total liabilities 50,407,899,631 50,544,959,422
Shareholders› Equity:
Issued and paid-up capital 30 2,152,447,065 2,152,447,065
Reserves 31 635,598,137 241,620,765
Retained earnings 31 2,775,071,087 2,254,485,126
Total equity 5,563,116,289 4,648,552,956
Total liabilities and shareholders’ equity 55,971,015,920 55,193,512,378
– The accompanying notes on pages 8 to 75 form an integral part of these financial statements
– Auditor›s report attached
AUDI BANK “S.A.E.”Statement of Income
For the year ended 31 December 2017
Note
Year ended 31 December 2017
EGP
Year ended 31 December 2016
EGP
Loan interest and similar revenues 6 6,841,936,806 4,318,612,432
Deposits’ cost and similar costs 6 (4,938,537,532) (2,827,389,987)
Net interest income 1,903,399,274 1,491,222,445
Fees and commission income 7 512,338,303 457,564,022
Fees and commission expenses 7 (29,984,906) (25,766,672)
Net income from fees and commissions 482,353,397 431,797,350
Dividends 766,886 475,505
Net trading income 8 1,258,834 1,202,895
Profits from financial investments 20 3,573,028 10,342,795
Impairment charges on credit losses 11, 18 (178,301,171) (271,959,709)
Administration expenses 9 (818,402,448) (628,852,742)
Other operating (expenses) income 10 (68,599,338) 1,461,907,249
Profit before income tax 1,326,048,462 2,496,135,788
Income tax expenses 12 (305,170,776) (612,817,671)
Net profit for the year 1,020,877,686 1,883,318,117
Net profit for the year per share 13 29.34 50.47
- The accompanying notes on page (8) to (75) from an integral part of these finncial statments
36 37

04
AUDI BANK “S.A.E.”Statement of cash flows
For the year ended 31 December 2017
Note
Year ended 31 December
2017
Year ended 31 December
2016
EGP EGP
Cash flows from operating activities
Net profit for the year before tax 1,326,048,462 2,496,135,788
Adjustments to reconcile net income to cash flows for operating activities
Depreciation and amortisation 83,747,399 61,755,457
Impairment charges on credit losses 11 178,301,171 271,959,709
Cost of other provisions 10 2,053,145 21,589,859
Reversal of investments’ impairment - 6,696,027
Provisions utilised excluding loans’ provision (4,965,457) (155,098)
Differences of revaluation of balances of other provisions in foreign currencies
(304,060) 4,900,253
Amortisation of share premium and available-for-sale financial investments revaluation differences
15,017,876 (447,579,157)
Dividends of investments excluding financial assets held for trading
(766,886) (475,505)
Gains on sale of fixed assets (20,000) (62,169)
Differences of revaluation of other loans’ balances (32,328,000) 2,212,644,000
Differences of revaluation of loan balances and advances to banks - (79,975,114)
Gains on sale of other financial investments (3,573,028) (16,591,548)
Amortisation of fair value reserve for investments reclassified from available-for-sale to held-to-maturity financial investments
(3,715,038) (1,065,697)
Operating profit before changes in operating assets and liabilities
1,559,495,584 4,529,776,805
Net decrease in assets
Balances at the Central Bank within the reserve ratio (1,778,812,151) 647,217,850
Bank balances 3,005,256,782 (3,436,573,129)
Treasury bills and other government notes (Net). (4,317,183,111) 3,096,952,845
Financial derivatives (Net) 641,181 1,700,783
Loans and advances to banks 146,132,000 -
Loans and advances to customers 411,067,666 (11,748,945,123)
Other assets 13,260,652 (818,230,723)
Due to banks 336,731,773 782,704
Customers’ deposits 1,835,175,162 13,486,433,779
Other liabilities 248,814,787 168,178,919
Taxes paid (266,487,558) (281,976,577)
Net cash generated from operating activities 1,194,092,767 5,645,318,133
Cash flows from investing activities
FINANCIALS
AUDI BANK “S.A.E.”Statement of cash flows
For the year ended 31 December 2017
Note
Year ended 31 December
2017
EGP
Year ended 31 December
2016
EGP
Proceeds from sale of fixed assets 75,000 221,901
Payments for purchase of fixed assets and preparation and supplies of branches
(125,703,221) (183,932,835)
Payments for purchase of intangible assets (230,862,873) (46,516,626)
Payments of financial investments excluding financial assets held for trading
(1,131,243,981) (881,876,021)
Proceeds from sale of financial investments excluding financial assets held for trading for trading
876,534,041 395,167,485
Dividends of investments excluding financial assets held for trading
766,886 475,505
Net cash flows used in investing activities (610,434,148) (716,460,591)
Cash flows generated from financing activities
Repayment of other loans (2,739,975,000) -
Proceeds from capital increase - -
Dividends paid (174,815,490) (45,789,475)
Proceeds from loans 177,277,000 -
Net cash flows used in financing activities (2,737,513,490) (45,789,475)
Net change in cash and cash equivalents during the year (2,153,854,871) 4,883,068,067
Cash and cash equivalents’ balance at the beginning of the year 7,060,018,748 2,176,950,681
Cash and cash equivalents’ balance at the end of the year 4,906,163,877 7,060,018,748
Cash and cash equivalents comprise:
Cash and balance with the Central Bank of Egypt 3,895,797,893 1,774,981,116
Bank balances 5,785,194,763 11,286,605,885
Treasury bills and other government notes 6,305,364,876 1,987,886,919
Balances at the Central Bank within the mandatory reserve ratio (3,128,167,111) (1,349,354,960)
Balances at banks with maturities of more than three months from the date of acquisition
(1,646,956,513) (4,652,213,293)
Treasury bills (net) with maturities of more than three months from the date of acquisition
(6,305,070,031) (1,987,886,919)
Cash and cash equivalents 32 4,906,163,877 7,060,018,748
– The accompanying notes on pages 8 to 75 form an integral part of these financial statements
38 39
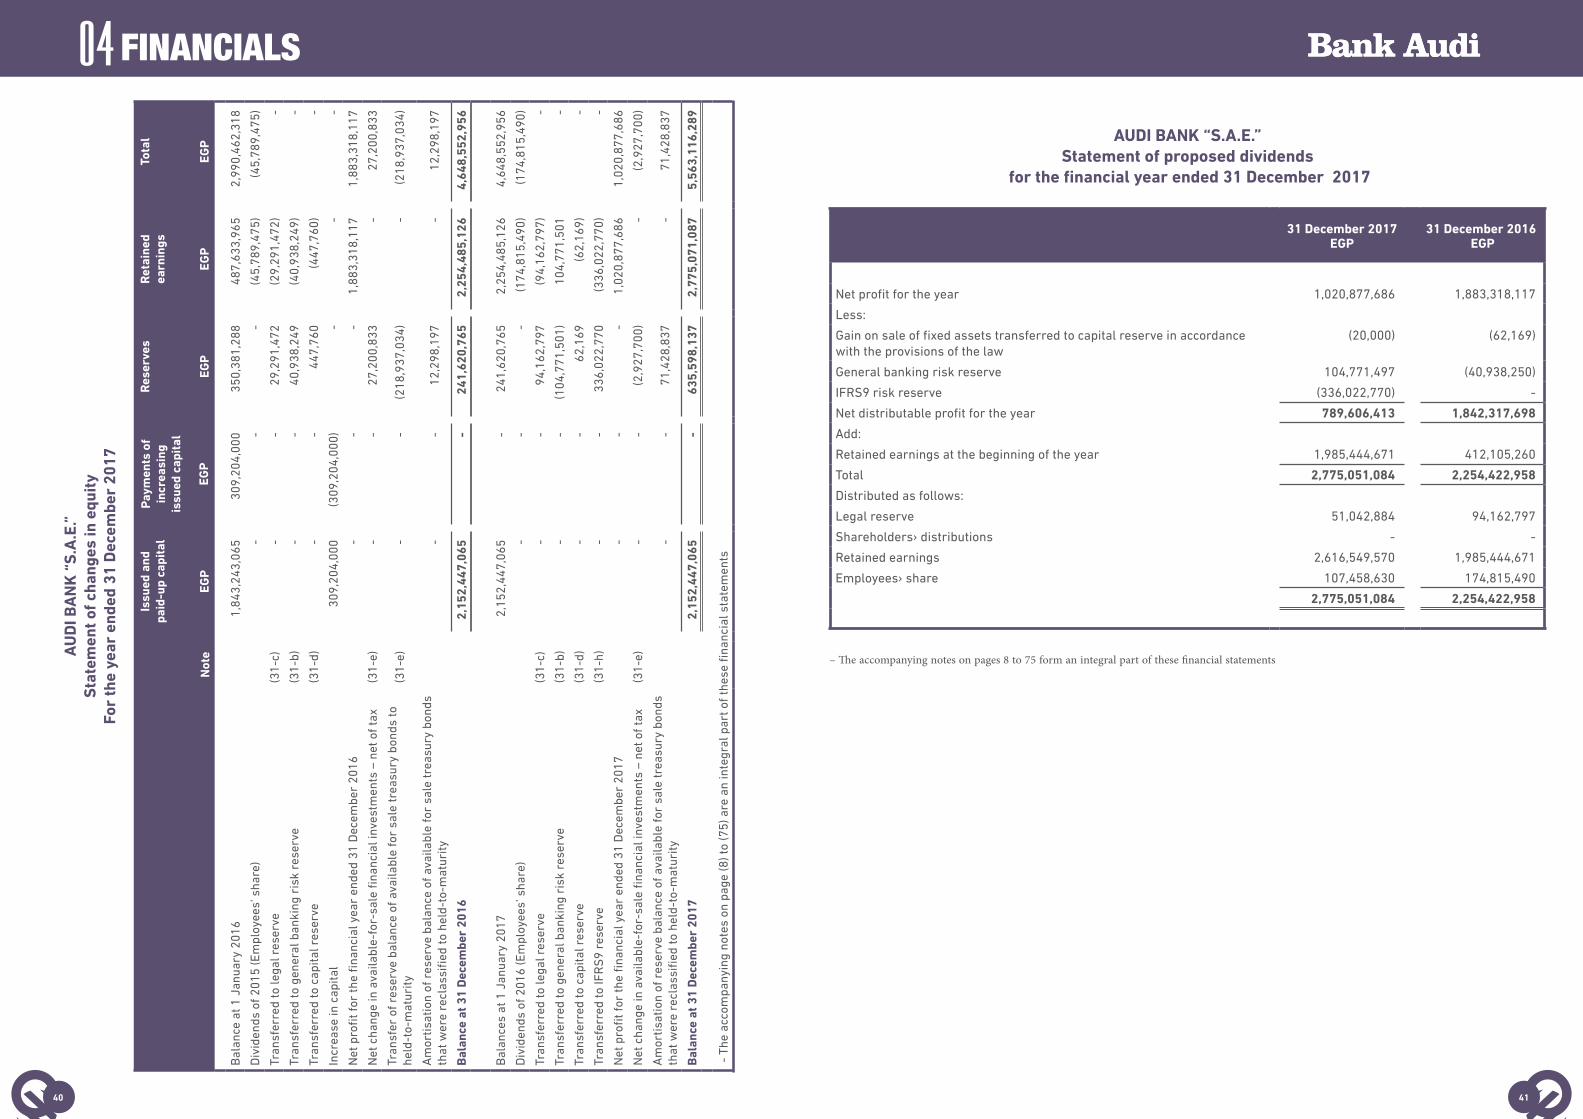
04A
UD
I BA
NK
“S
.A.E
.”S
tate
men
t of c
hang
es in
equ
ity
For
the
year
end
ed 3
1 D
ecem
ber
2017
Not
e
Issu
ed a
nd
paid
-up
capi
tal
EGP
Paym
ents
of
incr
easi
ng
issu
ed c
apit
al
EGP
Res
erve
s
EGP
Ret
aine
d ea
rnin
gs
EGP
Tota
l
EGP
Bal
ance
at 1
Jan
uary
201
6 1
,843
,243
,065
3
09,2
04,0
00
350
,381
,288
4
87,6
33,9
65
2,9
90,4
62,3
18
Div
iden
ds o
f 201
5 (E
mpl
oyee
s’ s
hare
) -
-
-
(4
5,78
9,47
5) (4
5,78
9,47
5)
Tran
sfer
red
to le
gal r
eser
ve(3
1-c)
-
-
29,
291,
472
(29,
291,
472)
-
Tran
sfer
red
to g
ener
al b
anki
ng r
isk
rese
rve
(31-
b) -
-
4
0,93
8,24
9 (4
0,93
8,24
9) -
Tran
sfer
red
to c
apita
l res
erve
(31-
d) -
-
4
47,7
60
(447
,760
) -
Incr
ease
in c
apita
l 3
09,2
04,0
00
(309
,204
,000
) -
-
-
Net
pro
fit f
or th
e fi
nanc
ial y
ear
ende
d 31
Dec
embe
r 20
16 -
-
-
1
,883
,318
,117
1
,883
,318
,117
Net
cha
nge
in a
vaila
ble-
for-
sale
fina
ncia
l inv
estm
ents
– n
et o
f tax
(31-
e) -
-
2
7,20
0,83
3 -
2
7,20
0,83
3
Tran
sfer
of r
eser
ve b
alan
ce o
f ava
ilabl
e fo
r sa
le tr
easu
ry b
onds
to
held
-to-
mat
urity
(31-
e) -
-
(2
18,9
37,0
34)
-
(218
,937
,034
)
Am
ortis
atio
n of
res
erve
bal
ance
of a
vaila
ble
for
sale
trea
sury
bon
ds
that
wer
e re
clas
sifi
ed to
hel
d-to
-mat
urity
-
-
12,
298,
197
-
12,
298,
197
Bal
ance
at 3
1 D
ecem
ber
2016
2,1
52,4
47,0
65
-
241
,620
,765
2
,254
,485
,126
4
,648
,552
,956
Bal
ance
s at
1 J
anua
ry 2
017
2,1
52,4
47,0
65
-
241
,620
,765
2
,254
,485
,126
4
,648
,552
,956
Div
iden
ds o
f 201
6 (E
mpl
oyee
s’ s
hare
) -
-
-
(1
74,8
15,4
90)
(174
,815
,490
)
Tran
sfer
red
to le
gal r
eser
ve(3
1-c)
-
-
94,
162,
797
(94,
162,
797)
-
Tran
sfer
red
to g
ener
al b
anki
ng r
isk
rese
rve
(31-
b) -
-
(1
04,7
71,5
01)
104
,771
,501
-
Tran
sfer
red
to c
apita
l res
erve
(31-
d) -
-
6
2,16
9 (6
2,16
9) -
Tran
sfer
red
to IF
RS
9 re
serv
e(3
1-h)
-
-
336
,022
,770
(3
36,0
22,7
70)
-
Net
pro
fit f
or th
e fi
nanc
ial y
ear
ende
d 31
Dec
embe
r 20
17 -
-
-
1
,020
,877
,686
1
,020
,877
,686
Net
cha
nge
in a
vaila
ble-
for-
sale
fina
ncia
l inv
estm
ents
– n
et o
f tax
(31-
e) -
-
(2
,927
,700
) -
(2
,927
,700
)
Am
ortis
atio
n of
res
erve
bal
ance
of a
vaila
ble
for
sale
trea
sury
bon
ds
that
wer
e re
clas
sifi
ed to
hel
d-to
-mat
urity
-
-
71,
428,
837
-
71,
428,
837
Bal
ance
at 3
1 D
ecem
ber
2017
2,1
52,4
47,0
65
-
635
,598
,137
2
,775
,071
,087
5
,563
,116
,289
- T
he a
ccom
pany
ing
note
s on
pag
e (8
) to
(75)
are
an
inte
gral
par
t of t
hese
fina
ncia
l sta
tem
ents
FINANCIALS
AUDI BANK “S.A.E.”Statement of proposed dividends
for the financial year ended 31 December 2017
31 December 2017EGP
31 December 2016EGP
Net profit for the year 1,020,877,686 1,883,318,117
Less:
Gain on sale of fixed assets transferred to capital reserve in accordance with the provisions of the law
(20,000) (62,169)
General banking risk reserve 104,771,497 (40,938,250)
IFRS9 risk reserve (336,022,770) -
Net distributable profit for the year 789,606,413 1,842,317,698
Add:
Retained earnings at the beginning of the year 1,985,444,671 412,105,260
Total 2,775,051,084 2,254,422,958
Distributed as follows:
Legal reserve 51,042,884 94,162,797
Shareholders› distributions - -
Retained earnings 2,616,549,570 1,985,444,671
Employees› share 107,458,630 174,815,490
2,775,051,084 2,254,422,958
– The accompanying notes on pages 8 to 75 form an integral part of these financial statements
40 41

04
AUDI BANK“.S.A.E”
INDEPENDENT AUDITOR’S REPORT AND FINANCIAL STATEMENTS
FOR THE FINANCIAL YEAR ENDEDAT 31 DECEMBER 2017
FINANCIALS
Report on the financial statementsWe have audited the accompanying financial statements of Audi Bank “S.A.E.” (the Bank) which comprise the balance sheet as at 31 December 2017 and the statements of income, changes in equity and cash flows for the financial year then ended, and a summary of significant accounting policies and other explanatory notes.
Management’ responsibility for the financial statementsThese financial statements are the responsibility of the Bank’s management. The management is responsible for the preparation and fair presentation of these financial statements in accordance with Central Bank of Egypt’s rules pertaining to the preparation and the presentation of the financial statements in 16 December 2008 and in light of the prevailing Egyptian laws. The management’s responsibility includes designing, implementing and maintaining internal control relevant to the preparation and fair presentation of financial statements that are free from material misstatement, whether due to fraud or error; management responsibility also includes selecting and applying appropriate accounting policies; and making accounting estimates that are reasonable in the circumstances.
Auditors’ responsibilityOur responsibility is to express an opinion on these financial statements based on our audit. We conducted our audit in accordance with Egyptian Standards on Auditing and in light of the prevailing Egyptian laws. Those standards require that we comply with ethical requirements and plan and perform the audit to obtain reasonable assurance that the financial statements are free from material misstatement.An audit involves performing procedures to obtain audit evidence about the amounts and disclosures in the financial statements. The procedures selected depend on the auditor’s judgement, including the assessment of the risks of material misstatement of the financial statements, whether due to fraud or error. In making those risk assessments, the auditor considers internal control relevant to the Bank’s preparation and fair presentation of the financial statements in order to design audit procedures that are appropriate in the circumstances, but not for the purpose of expressing an opinion on the effectiveness of the Bank’s internal control. An audit also includes evaluating the appropriateness of accounting policies used and the reasonableness of accounting estimates made by management, as well as evaluating the overall presentation of the financial statements.We believe that the audit evidence we have obtained is sufficient and appropriate to provide a basis for our audit opinion on these financial statements.
Shareholders of Bank Audi (S.A.E.)OpinionIn our opinion, the financial statements referred to above present fairly, in all material respects, the financial position of Bank Audi “S.A.E.” as at 31 December 2017, its financial performance, and its cash flows for the financial year then ended in accordance with the rules of preparation and presentation of Bank’s financial statements issued by the Central Bank of Egypt on 16 December 2008 and in light of the related Egyptian laws and regulations.To: The Shareholders of Bank Audi “S.A.E.”Report on other legal and regulatory requirementsNothing has come to our attention- during the financial year ended 31 December 2017- indicating that the Bank materially violated either any of the provisions of the Central Bank, banking and Monetary Institution Law No.88 of 2003 or any of the provisions of the Articles of Association.The Bank maintains proper financial records, which includes all that is required by the law and the Bank’s statutes, and the accompanying financial statements are in agreement therewith.The financial information included in the Board of Directors’ report is prepared in accordance with Law No. 159 of 1981 and its executive regulations, is in agreement with the Bank’s accounting records, within the limits that such information recorded therein.Cairo on 19 February 2018
Mansour & Co. PricewaterhouseCoopers Khalid & Co. BDO
Certified Public Accountants & Consultants Certified Public Accountants & Consultants
AUDITORS’ REPORTTo The Shareholders of Bank Audi (S.A.E.)
Taha Mahmoud Khalid___________________________
Member of the Institute of Chartered Accountants in England and Wales
Member of Egyptian Society of Accountants & AuditorsMember of the Egyptian Tax Society
R.A.A. 5136EFSA Registration 28
BDO Khalid & Co.
Mohamed Elmoataz Abdel Monem Mohamed___________________________
Accountant and Auditors Register Number 12747Financial Supervisory Authority Register Number 133
Mansour & Co. PricewaterhouseCoopersCertified Public Accountants & Consultants
Auditors
42 43

041.General Information Bank Audi “S.A.E.” provides corporate and retail banking services and investment in the Republic of Egypt and abroad through 46 branches and has more than 1,434 employees at the date of the balance sheet.The Bank was established as an Egyptian Shareholding Company under Law No. 43 of 1974 and its executive regulations in the Arab Republic of Egypt; the Head office of the Bank is located in in Giza governorate.These financial statements have been approved for issuance by the Board of Directors on 15 February 2018.
2.Summary of accounting policiesThe principal accounting policies used in the preparation of these financial statements are set out below. These policies are adopted consistently for the periods presented, unless otherwise stated.
2.1.Basis of preparationThe financial statements are prepared in accordance with the rules of preparation and presentation of the Banks’ financial statements issued by the Central Bank of Egypt on 16th of December 2008 and on the historical cost basis modified by the revaluation of financial assets and liabilities held for trading, financial assets and liabilities classified as at fair value through profit and loss at initial recognition, available for sale investments and all derivative contacts.
2.2.Segment reportingA business segment is associated with a group of assets and operations engaged in providing products or services that are characterised with risks and rewards different from those of other business segments. A geographical segment is associated with providing products or services within a particular economic environment that is characterised with risks and rewards different from those of geographical segments operating in other economic environments.
2.3.Foreign currency translation 2.3.1. Functional and presentation currencyItems included in the financial statements are measured using the currency of the primary economic environment in which the Bank operates (‘the functional currency’). The financial statements are presented in Egyptian pounds, which is the Bank’s functional and presentation currency.
2.3.2.Transaction and balances in foreign currencyThe Bank keeps its accounting records in Egyptian pounds. Foreign currency transactions during the financial year are recognised using the exchange rates prevailing at the date of the transaction. Balances of monetary assets and liabilities in foreign currencies are reassessed at the end of the financial year based on the exchange rates then prevailing. Foreign exchange gains and losses resulting from settlement of such transactions and valuation differences are recognised in the statement of income under the following items: Net trading income or net income from financial instruments initially classified at fair value through profit and loss for held-for-trading assets and liabilities or those classified at fair value through profit and loss according to its type. Other operating income (expenses) for the remaining items.
Equity of financial derivatives as qualifying hedge for cash flows, or as qualifying hedge for net investment.
Changes in the fair value of monetary financial instruments in foreign currency classified as available for sale investments (debt instruments) are analysed within revaluation differences from changes in amortised costs of the instrument, differences from changes in the prevailing exchange rates, and differences from changes in the fair value of the instrument. Revaluation differences related to changes in the amortised cost are recognised into interest income from loans and similar revenues, and those related to the changes in the exchange rates in other operating income (expenses) in the statement of income. Differences from changes in the fair value (fair value reserve/ available for sale investments) are recognised within equity.Translation differences resulting from non-monetary items comprise profit and loss resulting from the change of fair value such as equity instruments held at fair value through profit or loss. Translation differences resulting from the equity instruments recognised as available for sale financial investments are carried within fair value reserve in equity.
2.4. Financial assetsThe Bank classifies its financial assets in the following categories:Financial assets at fair value through profit and loss, loans and receivables, held-to-maturity financial investments, and available-for-sale financial investments. Management determines the classification of its investments at initial recognition.
2.4.1. Financial assets at fair value through profit or lossThis group includes financial assets held for trading and financial assets recognised at fair value through profit or loss as they arise.- A financial instrument is classified as held for trading if it is acquired principally for the purpose of selling in the short term or if it is part of a portfolio of identified financial instruments that are managed together and for which there is evidence of a recent actual pattern of short-term profit-taking. Derivatives are classified as trading unless it is recognised as a hedge instrument.- Financial assets are recognised initially at fair value through profit or loss when: Doing so reduces measurement inconsistencies that would arise if the related derivative was treated as held for trading and the underlying financial instruments were carried at amortised cost for such loans and advances to banks and customers, and issued debt instruments. Certain investments, such as equity investments that are managed and evaluated at fair value in accordance with a risk management or investment strategy, and reported to key management on that basis are recognised at fair value through profit and loss. Financial instruments, such as held debt instruments which contain one or more embedded derivatives which
FINANCIALS
significantly affect the cash flows are recognised at fair value through profit or loss.- Gains and losses arising from changes in the fair value of derivatives that are managed in conjunction with recognised financial assets and liabilities are initially recorded at fair value through profit and loss in the statement of income under “net income from financial instruments recognised initially at fair value through profit and loss”.- Derivatives may not be reclassified out of the group of the financial instruments at fair value through profit or loss, at the period they are retained or valid. Furthermore, the financial instruments may not be reclassified by transferring them from their group that is recognised at fair value through profit or loss if it was initially designated by the Bank as an instrument measured at fair value through profit or loss.- In all cases, the Bank should not re-classify any financial instrument to the financial instruments group which is measured at fair value through profit and loss or held-for-trading financial assets’ group.
2.4.2. Loans and receivablesLoans and receivables are non-derivative financial assets with a fixed or determinable amount that are not quoted in an active market, except:- Assets that the Bank intends to sell immediately or in the short term are classified as held for trading, and those that the Bank upon initial recognition designates as at fair value through profit or loss.- Assets that the Bank classified upon initial recognition as available-for-sale. - Assets from which the Bank may not recover substantially its initial investment amount, for reasons other than credit deterioration.
2.4.3. Financial investments held-to-maturityHeld-to-maturity financial investments are non-derivative financial assets with fixed or determinable amounts and fixed maturities that the Bank has positive intention and ability to hold till maturity.The entire group is reclassified as available for sale if the Bank sells a significant amount of financial assets held to maturity except in cases of necessity.
2.4.4. Available-for-sale financial investmentsAvailable-for-sale financial investments are non-derivative financial assets intended to be held for an indefinite period of time, which may be sold in response to needs for liquidity or changes in interest rates, foreign rates or equity prices . The following applies to financial assets: - Purchases and sales of financial assets, which are recognised at fair value through profit and loss, held to maturity and available for sale investments, are recognised on trade-date; the date on which the Bank commits to purchase or sell the asset.
2.4.5 Available-for-sale financial assets- Financial assets are initially recognised at fair value plus transaction costs for all financial assets not carried at fair value through profit or loss. Financial assets carried at fair value through profit or loss are initially recognised at fair value, and transaction costs are expensed in the statement
of income in net trading income.- Financial assets are derecognised when the rights to receive cash flows from the financial assets have expired or where the Bank has transferred substantially all risks and rewards of ownership. Financial liabilities are derecognised when they are extinguished − either, when the obligation is discharged, cancelled or expired. - Available for sale investments and financial assets at fair value through profit or loss are subsequently carried at fair value. Loans and receivables and held-to-maturity investments are carried at amortised cost.Gains and losses arising from changes in the fair value of financial assets carried at fair value through profit and loss are included in the statement of income in the year in which they arise. Gains and losses arising from changes in the fair value of available-for-sale financial investments are recognised directly in equity until the financial asset is derecognised or impaired. At this time. the cumulative gains and losses previously recognised in equity are recognised in the statement of income - Interest calculated using the amortised cost and foreign currency gains and losses on monetary assets classified as available for sale are recognised in the statement of income. Dividends from available for sale equity instruments are recognised in the statement of income when the Bank’s right to receive the payment is established.-The fair values of quoted investments in active markets are based on current bid price. If there is no active market or a current bid price for a financial asset, the Bank establishes fair value using valuation techniques. These include the use of recent arm’s length transactions, discounted cash flow analysis, option pricing models and other valuation techniques, and if the Bank could not assess the fair value of the equity instruments classified as available for sale, these instruments are measured at cost less impairment.- Profits and losses related to reclassified financial assets with fixed maturity are amortised using the effective interest method over the remaining life of the held to maturity investment. Any difference between the value on the basis of amortised cost and the value on the basis of maturity date is amortised over the remaining life of the financial asset using the effective interest rate method. In case of financial asset’s impairment, any profits or losses previously recognised in equity are recognised in profit and loss.
2.5. Treasury BillsTreasury bills are recognized at the time of purchase at nominal value and the issuance discount, representing the unearned interest on such balances is shown in other credit balances and liabilities. Treasury bills are shown in the balance sheet, excluding the unearned income, and are measured at amortized cost using the effective interest rate. The terms of the purchase agreements for treasury bills with a commitment to resell and agreements for the sale of bills with a net purchase obligation are shown in the balance sheet under treasury bills and other government instruments.
44 45

042.6. Offsetting financial instrumentsFinancial assets and liabilities are offset when there is a legally enforceable right to offset the recognised amounts and there is an intention to settle on a net basis or realise the asset and settle the liability simultaneously.
2.7. Derivative financial instrumentsDerivatives are initially recognised at fair value on the date on which a derivative contract is entered into and are subsequently re-measured at their fair value. Fair values are obtained from quoted market prices in active markets, including recent market transactions, and valuation techniques, including discounted cash flow models and options pricing models, as appropriate. All derivatives are carried as assets when fair value is positive and as liabilities when fair value is negative.Embedded derivatives in other financial instruments, such as conversion option in a convertible bond, are treated as separate derivatives when their economic characteristics and risks are not closely related to those of the host contract, provided that the host contract is not classified as at fair value through profit and loss. These embedded derivatives are measured at fair value with changes in fair value recognized in income statement unless the bank chooses to designate the hybrid contact as at fair value through net trading income in profit or loss.
2.8. Fair value hedgeChanges in fair value of financial derivatives that are designated and qualify as hedging instrument at fair value are recorded in the statement of income, together with any changes in the fair value of the hedge asset or liability that are attributed in the hedged risk. Effective changes in fair value of interest rate swaps and related hedged items are reflected in ‘net interest income’ and effective changes in fair value of currency future contracts are reflected in ‘net trading income’. Any ineffective changed in contracts are related hedged items mentioned in the previous paragraph are recorded in ‘net trading income’. If the hedge no longer meets the criteria for hedge accounting, the adjustment to book value of a hedged item that is accounted for using the amortized cost method should be amortized by charging it to profit or loss over the period to maturity. The adjustments made to the book value of the hedged equity instrument are included among the equity until they are disposed.
2.9.Cash flows hedgeFor designated and qualifying cash flows hedges, the effective portion of the fair value of the hedging instrument initially recognized directly in equity. The ineffective portion of the gain or loss on the hedging instrument is recognized immediately in the ‘net trading income’. Amounts accumulated in equity are carried to the statement of income in the same periods in which the hedged item has an impact on profit or loss, and gains or losses relating to the effective portion of the currency swaps and options are taken to the “net trading income”. When a hedging instrument is mature or sold, or if hedge no longer meets the conditions for hedge accounting, the cumulative gain or loss in equity at that time is retained in equity and recognized in the statement of income when the forecast transaction is finally recognized.
When a forecast transaction is no longer expected to occur, the cumulative gain or loss that was reported in the equity is immediately transferred to the statement of income.
2.10. Net investment hedgesHedges of net investments are accounted for in a way similar to cash flow hedges. Gains or losses on the hedging instrument relating to the effective portion of the hedge are recognized in the equity while any gains or losses relating to the ineffective portion are recognized in the statement of income. On disposal of the foreign operation, the cumulative value of any such gains or losses recognized in the equity is transferred to the statement of income.
2.11. Derivatives that do not qualify for hedge accountingChanges in the fair value of derivative instruments that do not qualify for hedge accounting are recognised in the statement of income under “net trading income”. However, gains and losses arising from changes in the fair value of derivatives that are managed in conjunction with financial assets and liabilities classified when they arise at fair value through profit or loss are included in ‘Net income from financial instruments classified when they arise at fair value through profit or loss’.
2.12. Interest income and expenseInterest income and expenses are recognised in the statement of income under “loan interest and similar income” or “deposits cost and similar costs” using the effective interest rate method for all interest-bearing financial instruments except for the held-for-trading instruments or instruments that were classified at fair value through profit and loss.The effective interest method is a method of calculating the amortized cost of a financial asset or a financial liability and of allocating the interest income or interest expense over the relevant Period. The effective interest rate is the rate that exactly discounts estimated future cash payments or receipts through the expected life of the financial instrument or, when appropriate, a shorter Period to the net carrying amount of the financial asset or financial liability. When calculating the effective interest rate, the Bank estimates cash flows considering all contractual terms of the financial instrument (for example, prepayment options) but does not consider future credit losses. The calculation includes all fees paid or received between parties to the contract that are an integral part of the effective interest rate, in addition to any transaction costs and all other premiums or discounts. When loans or debts are classified as non-performing loans, proceeds are credited to marginally classified loans, ie, they are added to a marginal account outside the financial statements (which do not affect the Bank’s income) and are recognized under income according to the cash basis as follows:- When collected and after the recovery of all arrears for consumer and real estate loans for personal housing and small loans for economic activities.- For loans granted to organisations, interest income is recognised on a cash basis after the Bank collects 25% of the scheduling instalments and after regular payment of instalments for at least one year. If the customer continues to pay regularly, the interest calculated on the outstanding loan balance (interest on regular scheduling balance) is
FINANCIALS
recognised without the marginalised interest beforescheduling which is not recognised within revenues until full payment of the loan balance in the balance sheet before scheduling.
2.13. Fees and commission incomeFees that are due for a loan service or facilities are recognised as income when the service is rendered. Fees and commissions income related to non-performing loans or debts are suspended and are carried off balance sheet and are recognised under income according to the cash basis when interest income is recognised in accordance with note (2-12) above. Fees that represent a complementing part of the financial asset effective rate are recognised as adjustment to the effective interest rate. The loan commitment fee is deferred when the loan is granted. The extent of the customer’s use of the loan is reviewed at agreed intervals with the customer. In the case of the end of the period without the customer’s use of the loan or part thereof, the fees are recognized as income.Fees related to debt instruments measured at fair value are recognised as income at initial recognition. Fees related to marketing of a syndicated loan are recognised as income when the marketing process is completed and the loan is fully used or if the Bank kept its share of the syndicated loan using the effective interest rate as used by the other participants.Commissions and fees arising from negotiation or participating in a negotiation of a transaction in favour of a third party - such as shares or other financial instruments purchase arrangements or acquisition or sale of entities - are recognised in the statement of income when the related transaction is completed. Fees related to management advisory and other services are recognised on a time proportion basis over the period in which the service is provided. Financial planning and custody services fees provided on long periods are recognised over the year in which the service is provided.
2.14. Impairment of financial assets2.14.1. Financial assets at amortised costAt each balance sheet date, the Bank assesses whether there is objective evidence that any financial asset or group of financial assets have been impaired. A financial asset or a group of financial assets are considered impaired and the impairment losses are recognised when there is an objective evidence of the impairment as a result of one or more events that occurred after the initial recognition of the asset (loss event), and that loss event affects the future cash flows of the financial asset or the group of financial assets which can be reliably estimated. The Bank considers the following indicators to determine the existence of objective evidence for impairment losses: - Significant financial difficulty of the issuer or obligor.- A breach of contract, such as a default or delinquency in interest or principal payments.- Expected bankruptcy of the borrower, entering a liquidation lawsuit, or restructuring the finance granted to the borrower.- Deterioration of the competitive position of the borrower. - Granting privileges or assignments by the Bank to the
borrower due to economic or legal reasons, which are not granted by the Bank in the normal course of business.- Impairment of the guarantee.- Deterioration of creditworthiness.An objective proof for impairment loss of a group of financial assets is the existence of clear information indicating a measurable decline in the future cash flows expected from such category since initial recognition, although such decline is not identifiable for each individual asset i.e. the increase in default cases regarding one of the banking products.The Bank estimates the period between losses occurring and its identification for each specific portfolio. In general, the period varies between one month to twelve months.Corporate Sector Impairment The Bank first assesses whether objective evidence of impairment exists individually for each financial asset, and the Bank then performs an individual assessment to assess the impairment. If the Bank determines that an objective evidence of financial asset impairment exists, identified impairment is calculated based on expected the future cash flows discounted using the original contractual return rate. If the Bank determines that there is no objective evidence of impairment of a financial asset that has been individually assessed, then the impairment is calculated using the probability of default, loss given default, and an unidentified impairment is calculated for such group of assets. Retail Impairment Identified Impairment is calculated for all overdue assets (default of one day or more) and this is according to outstanding balance and default rates of each group balances according to the probability of default and loss given default. Unidentified impairment is calculated for all assets with no over dues and this is according to aggregate outstanding balance and probability of default for that category and the loss given default. Impairment losses are measured by the difference between the asset’s book value and the present value of expected future cash flows, excluding future expected credit losses not charged yet, discounted at the financial assets’ contractual return rate. The book value of the financial asset is reduced by the impairment amount using the ‘impairment loss provision’, and the impairment is recognised in the statement of income.If the loan or the investment classified as held-to-maturity carry a variable rate, the discount rate used to measure any impairment losses will be the contractual return rate when there is objective evidence that the asset is impaired. For practical purposes, the Bank may measure the impairment loss using the fair value of the instrument through its market rate. For guaranteed financial assets, the present value for expected future cash flows has to be considered in addition to the proceeds from sale of guarantee after deducting the related expenses.For the purpose of an estimation of impairment on the aggregated level, financial assets are grouped on the basis of similar credit risk characteristics according to the Bank classification process taking into consideration the type ofasset, industry, geographical location, arrears position, and other relevant factors. Those characteristics are relevant
46 47

04to the estimation of future cash flows for those groups of assets as they are indicators of the debtors’ ability to pay all the amounts dues according to its contract terms for assets under study.Upon estimation of impairment of a group of financial assets on the basis of historical default rates, the future contractual cash flows of the group are estimated based on the contractual cash flows of the assets in the Bank and the amount of historical losses of the assets with credit risk characteristics similar to the assets that the Bank owns. The amount of historical losses is adjusted based on the current declared information where it reflects the effect of the current conditions which were not available during the period the historical losses were determined, and to eliminate the effects of the conditions that existed in the historical periods which no longer exist. The Bank has to ensure that the estimates of changes in future cash flows for a group of assets are consistent with changes in relative data from one period to another, such as changes in unemployment rates, real estate prices, settlement status, or other factors that may indicate changes in the probabilities of loss in the group and its amount. The Bank periodically reviews the method and assumptions used to estimate future flows.
2.14.2. Available for sale investments/ investments held to maturityThe Bank assesses, at each balance sheet date, whether there is objective evidence that a financial asset or a group of financial assets classified under available for sale or financial investment held to maturity is impaired. In the case of equity investments classified as available for sale, a significant or prolonged decline in the fair value of the security below its cost is considered in determining whether the assets are impaired. The decline in value is considered significant if it reaches 10% of the book value cost. A decline is considered prolonged if it lasts for a period that exceeds 9 months, and if the mentioned evidences are available the accumulated loss is carried forward from equity and is recognised in the statement of income. Impairment losses recognised in the statement of income with regard to equity instruments are not reversed if an increase subsequently occurred in the fair value; however, if the fair value of available for sale debt instruments increased, and this increase can be objectively related to an event occurring after the recognition of impairment loss in the statement of income, the impairment is reversed through the statement of income.
2.15. Tangible and intangible assets2.15.1. Fixed assetsThe Bank’s fixed assets of lands and buildings basically comprise the head office premises and branches and offices. All fixed assets are carried at historical cost net of accumulated depreciation and impairment losses. The historical cost includes the charges directly related to acquisition of fixed assets items. Subsequent costs are recognised in the asset’s carrying amount or are recognised as a separate asset, as appropriate, only when it is probable that future economic benefits associated with the asset will flow to the Bank and
the cost can be measured reliably. Maintenance and repair expenses are charged to other operating expenses during the period in which they are incurred.
Lands are not depreciated. Depreciation of fixed assets is calculated using the straight line method to allocate their cost to their residual values over their estimated useful lives, as follows:
Buildings and facilities 40 - 50 years
Leasehold improvements10 years or lease term whichever is
lower
Office furniture and lockers 4 - 20 years
Vehicles 5 – 7 years
Computers hardware/ software
4 - 5 years
Typewriters, calculators and A/C’s
4 – 5 years
Fixtures and fittings 5 to 10 years
The assets’ residual values and useful lives are reviewed, and adjusted if appropriate, at each balance sheet date. Depreciable Assets are reviewed for impairment whenever events or changes in circumstances indicate that the carrying amount may not be recovered. An asset’s carrying amount is written down immediately to its recoverable value if the asset’s carrying amount exceeds its estimated recoverable amount. The recoverable amount is the higher of the asset’s fair value less costs to sell and value in use. Gains and losses on disposals are determined by comparing the selling proceeds with the asset carrying amount and charged to “other operating expenses” in the statement of income.
2.15.2. Computer hardware/ softwareExpenditure on upgrade and maintenance of computer programs is recognized as an expense in the statement of income in the period in which it is incurred. Expenditures directly incurred in connection with specific software are recognized as intangible assets if they are controlled by the bank and when it is probable that they will generate future economic benefits that exceed its cost within more than one year. Direct costs include the cost of the staff involved in upgrading the software in addition to a reasonable portion of relative overheads.The expenses which lead to the increase or expansion in the performance of computer software beyond their original specifications are recognised as a development cost and are added to the original software cost.Depreciation is calculated using the straight-line method to allocate the cost to reach the residual value over the useful life of the software from 5 to 10 years.
2.16. Impairment of non-financial assetsAssets that have an indefinite useful life are not subject to amortization-except for goodwill- and are tested annuallyfor impairment. Assets that are subject to amortization are reviewed for impairment whenever events or changes in circumstances indicate that the carrying amount may not be recoverable. An impairment loss is recognized for the amount by which the asset’s carrying amount exceeds its recoverable amount. The recoverable value represents the higher of the net realisable value of the asset or the value in use. For the purpose of estimating the impairment, the asset is grouped
FINANCIALS
with the smallest cash generating unit. At each financial statement date, non-financial assets with impairment have to be reviewed to determine if there is impairment reversal made to the statement of income.
2.17. LeasesThe leases entered into by the Bank are primarily operating leases. Operating lease payments less any discounts granted from the lessor are recognised as expenses in the statement of income using the straight line method over the contract term. When an operating lease is terminated before the lease period has expired, any payment required to be made to the lessor by way of penalty is recognised as an expense in the period in which termination takes place.
2.18. Cash and cash equivalentsFor the purposes of the cash flow statement prepared using the indirect method, cash and cash equivalents comprise balances with less than three months’ maturity from the date of acquisition, including cash and non-restricted balances with central banks, due from other banks and treasury bills and other governmental notes.
2.19. Other provisionsProvision of restructuring costs and legal claims is recognised when there is a present legal or constructive obligation as a result of past events, and it is probable that the Bank’s resources will be required to settle the obligation; and the amount of the obligation can be reliably estimated. Where there are a number of similar obligations, the likelihood that an outflow is required to settle an obligation is determined, taking into consideration the group of obligations as a whole. The provision is recognised even if the likelihood of an outflow with respect to an item in the group is minimal.Provisions no longer required fully or partially are reversed in other operating income (expenses). The current value of payments to settle the obligations that must be settled after one year from the balance sheet date using an appropriate rate in accordance with the terms of settlement, without being affected by the prevailing tax rate, which reflects the time value of money. If the settlement term is less than one year, the estimated value of the obligation is calculated unless it has a material impact; otherwise, it is calculated at the current value.
2.20. Financial guarantee contracts The financial guarantees contracts are the contracts that the Bank issues as a guarantee for loans or overdrafts provided to its customers from other entities, which require the Bank to make certain payments to compensate the beneficiary for a loss incurred due to default of the debtor on the maturity date and in accordance with debt instrument conditions These financial guarantees are presented to banks and other financial institutions instead of the banks’ customers. It is initially recognised in the financial statements at fair value at the date of the granting the guarantee which could reflect the guarantee fees. Subsequently, the Bank’s obligation shall be measured under the guarantee by the value initially recognised, less guarantee fees amortisation, which is recognised in the statement of income on a straight-line basis over the higher of the guarantee life term or over the best payment estimates required to settle any financial obligation resulting from the financial guarantee at the balance sheet date. These estimates are mainly based on the experience with similar transactions and historical losses, consolidated by the management’s judgement. Any increase in the obligations resulting from the financial guarantee is recognised in the statement of income under the ‘other operating income (expenses)’ item.
2.21. Employees’ benefitsEmployees’ saving program The Bank manages its saving program for employees and the Human Resources Department manages this program
by identifying participation rates for both the employee and the Bank and determine the percentage of the annual return on investment, and this is an optional program according to the employee’s request.In case of the clearance of the program, the Bank is committed to settle the total savings program balances additional to the accrued interest for each employee who registered on the program at the clearance decision date. All calculated portions and interest are included in liabilities which represents the maximum claims to the Bank at this date.
2.22. TaxationIncome tax on the net income of the year includes current tax (calculated based on the laws and regulations and the instructions related to the subject matter using the applicable tax rate as of the Balance Sheet date and deferred tax). Income tax liability is recognized directly except for income tax relating to items of equity which are recognized directly in equity. Current tax- Current tax due on the Bank is calculated according to laws and regulations applicable in Egypt. - Provision is built for taxes liabilities of previous years after conducting the required tax studies in light of the tax claims.
Deferred tax- Deferred tax is the tax arising from temporary differences resulting from difference in financial year in which some assets and liabilities are recognized based on the various tax rules applied and the accounting rules used for the preparation of the financial statements. Deferred tax is identified based on the expected measurement to settle or achieve the current values for the assets and liabilities referred to above using the tax rates applicable as of the balance sheet date. - Deferred tax assets are generally recognized as assets for the Bank when it is probable that this asset can be used to reduce the taxes due from the Bank in future years. Deferred tax asset recognised as an asset to the Bank is reduced with the value that will not generate future tax benefits to the Bank in the following years based on the fact that in case that the future expected future tax benefit is increased the deferred tax asset shall is increase within the limit of the previous reduction.
2.23. BorrowingsBorrowings are recognised initially at fair value less the cost of obtaining the loan. Borrowings are subsequently stated at amortised cost; any difference between proceeds net of transaction costs and the redemption value is recognised in the statement of income over the period of the borrowings using the effective interest method.
2.24. Capital costIssuance cost directly related to issuing new shares orissuing shares in return for acquisition of an entity or issuing options is charged to shareholders’ equity of total proceeds net of tax.
2.25.Dividend distributionDividends are recognised in shareholders’ equity in the period in which the General Assembly of shareholders declares the dividends. Those dividends include employees’
48 49

04share in the profits and the Board of Directors’ remuneration as prescribed by the Articles of Association and Law.
2.26.Dividend incomeDividends are recognised in the statement of income when the Bank’s right to receive those dividends is established.
2.27. Purchase and resale agreements and sale and repurchase agreementsFinancial instruments purchased under resale agreements are presented as assets and added to the treasury bills balance and other governmental notes’ item in the balance sheet. On the other hand, liabilities (purchase and resale agreements) are presented as a deduction from the ‘Treasury bills and other governmental notes’ line item in the balance sheet. Differences between the sale and repurchase price are recognised as due interest throughout the period of the agreements using the effective interest rate method.
3. Financial risk managementThe Bank, as a result of the activities it exercises, is exposed to various financial risks. Since the basis of financial activity is to accept risks, some risks or group of risks are analysed, evaluated and managed altogether. The Bank intends to strike a balance between the risk and return and to reduce the probable adverse effects on the Bank’s financial performance. The most important types of risks are credit risk, market risk, liquidity risk and other operating risks. Market risk comprises foreign currency exchange rates, interest rate risk and other pricing risks.The risk management policies have been laid down to determine and analyse the risks, set limits to the risks and control them through reliable methods and up-to-date IT systems. The Bank regularly reviews the risk management policies and systems and amends them to reflect the changes in the markets, products and services, and the best updated applications.Risks are managed by the Risk Management Department in light of policies approved by the Board of Directors. The Risk Management determines, evaluates and covers the financial risks, in collaboration with the Bank’s various operating units, and the Board provides written principles to manage risks as a whole, in addition to written policies covering specific risk areas like credit risk, foreign exchange rate risk, interest rate risk and using derivative and non-derivative financial instruments. Moreover, the Risk Management is independently responsible for periodic review of risk management and control environment.
3.1. Credit riskThe Bank is exposed to the credit risk, which is the risk resulting from failure of one party to meet its contractual obligations towards the Bank. The credit risk is considered to be the most significant risk for the Bank and hence, the management sets specific procedures to manage that risk. The credit risk is represented in the lending activities from which loans, facilities, and investment activities arise, which necessitates that the Bank assets must contain debt instruments. The credit risk is also found in off-balance sheet financial instruments such as loan commitment. The managing and monitoring process of credit risk is centralised at the credit risk management team at the risk department, which prepares reports for the Board of Directors, top management, and heads of units on a regular basis.
3.1.1. Credit risk measurementLoans and advances to banks and customersTo measure credit risk relating to loans and advances to banks and customers, the Bank considers three components as follows:- Probability of default - by the client or counterparty on its contractual obligations. - Current position and its likely future development, from which the Bank derives the ‘Exposure at default balance’ .- The ‘loss given default’.
The day-to-day management of the Bank’s activity involves those credit risk measures that reflect the expected loss (the expected loss model) required by the Basel Committee for Banking Supervision. Operational measures may be in conflict with the impairment charge in accordance with IAS 26 which depends on the realised losses in the balance sheet date (model of realized losses) rather than expected losses.The Bank assesses the probability of default of individual customers using internal rating tools tailored to the various clients’ categories. These methods have been updated taking into consideration the statistical analysis credit officer judgement to reach the appropriate grading. Clients of the Bank are segmented into four rating classes. The rating scale which is shown below reflects the range of default probabilities defined for each credit rating category, which means that credit positions may be transferred from one rating to another depending on the probability of default changes. Evaluation methods are reviewed and updated when necessary. The Bank regularly evaluates the performance of creditworthiness classification methods and their ability to foresee cases of default.
The Bank’s internal rating categories
Rating Description
1 Performing loans
2 Regular watch list
3 Special watch list
4 Non-performing loans
Exposure at default is based on the amounts the Bank expects to be outstanding at the time of default. For example, as for the loans, this position is the nominal value. As for commitments, the Bank includes all actual withdrawals in addition to any withdrawals expected to occur until the date of the late payment, if any.Expected losses or severe losses represent the Bank’s loss expectations when the settlement is due. This is represented by the loss percentage to the loan that differs according to the type of debtor, the priority of the claim, and the availability of guarantees and any other credit cover.Debt instruments, treasury bills and other billsFor debt securities and treasury bills external rating such as (Standard & Poor’s) rating or their equivalents are used for managing the credit risk exposures. In case such ratings are unavailable, internal rating methods are used that are similar to those used for credit customers. Investments in securities and bills are considered a method to obtain a better credit quality. Such investments also provide an available source to meet the funding requirements.
3.1.2. Risk limit control and mitigation policiesThe Bank manages, limits and controls concentrationsof credit risk wherever they are identified − in particular, to individual counterparties, groups and to industries and countries. The Bank manages the credit risk it undertakes by placing limits on the amount of risk accepted in relation to each borrower or groups of borrowers and to the geographical and industry segments. Such risks are monitored on a regular basis and are subject to an annual or more frequent review when necessary. Limits on the level of credit risk by product/ group, industry sector and by country are approved quarterly by the Board of Directors. The exposure to any borrower including banks is further restricted by sub-limits covering on- and off-balance sheet exposures, and daily delivery risk limits in relation to trading items such as forward foreign exchange contracts. Actual exposures against limits are monitored daily. Exposure to credit risk is also managed through regular
FINANCIALS
analysis of the existing and potential borrowers’ ability to meet their obligations and through changing the lending limits where appropriate. Some other specific control and mitigation measures are outlined below:
· CollateralsThe Bank applies a range of policies and practices to mitigate credit risk. One of these methods is accepting collaterals against facilities granted by the Bank. The Bank implements guidelines on the acceptability of specific classes of collateral or credit risk mitigation. The principal collateral types for loans and advances are: - Real estate mortgage.- Business assets mortgage, such as machines and goods.- Financial instruments mortgage, such as debt and equity instruments.Longer-term finance and lending to corporate entities are generally secured; However, individual credit facilities are generally unsecured. In addition, to minimise the credit loss, the Bank seeks additional collaterals from the concerned parties as soon as impairment indicators are noticed for any loans or facilities.The Bank determines the collaterals held to secure assets other than loans and advances according to the nature of the instrument. Generally, debt instruments and Treasury bills are unsecured except for asset-backed securities and similar instruments that are secured by a financial instruments portfolio.
· DerivativesThe Bank maintains strict control procedures over amounts and terms for the net value of opened derivative positions, i.e. the difference between purchase and sale contracts at both the value and duration levels. In all cases, the amount subject to credit risk is limited to the current fair value of instruments in from which the Bank could gain benefits, i.e. assets that have positive fair value which represent a small value of the contractual amount or the notional value used to express outstanding instruments. The Bank manages this credit risk, which is considered part of the total lending limit granted to customers with expected market changes risk all together. Generally, no collateral is obtained for credit risk related to these instruments, except for marginal deposits required by the Bank from other parties.
3.1.2 Risk limit control and mitigation policies (continued)Settlement risk arises when cash, equity instruments or other securities are used in the settlement process or if there is expectation to receive cash, equity instruments or other securities. Daily settlement limits are established for each counterparty to cover the aggregate settlement risk arising from the daily transactions of the Bank .
· Master Netting ArrangementsThe bank further restricts its exposure to credit losses by entering into master netting arrangements with counterparties with which it undertakes a significant volume of transactions. Master netting arrangements do not generally result in an offset of assets and liabilities shown in the balance sheet, as transactions are either usually settled on a gross basis. However, the credit risk associated with favourable contracts is reduced by a master netting arrangement to the extent that if a default occurs, all amounts with the counterparty are terminated and settled on a net basis. The banks overall exposure to credit risk on derivative instruments subject to master netting arrangements can change substantially within a short Period, as it is affected by each transaction subject to the arrangement.
· Credit-related commitmentsThe primary purpose of credit-related commitments is to ensure that funds are available to customers when required. Guarantees and standby letters of credit are of the same credit risks as loans. Documentary and commercial letters of credit, which are issued by the Bank on behalf of customers to authorise a third-party to draw within a certain limit in accordance with specific terms and conditions and guaranteed by the goods under shipment, therefore carries a lower risk of the direct loan.Credit-related commitments represent the unused portion of credit limit authorised to grant loans, guarantees or letters of credit. The Bank is exposed to a possible loss of an amount that equals the total unused commitments as for the credit risk resulting from credit-related commitments. However, the probable amount of loss is less than the unused commitments as most commitments related to granting credit represent contingent liabilities to customers maintaining certain credit standards. The Bank monitors the maturity term of the credit commitments because long-term commitments are of a higher credit risk than short-term commitments.
3.1.3. Impairment and provisioning policiesThe internal rating systems described in (Note3-1-1) focus more on credit quality planning from the beginning of lending and investment activities. Otherwise, impairment losses that occurred at the balance sheet date only are recognised for financial reports purposes based on objective evidence indicating impairment according to what will be mentioned in this note. Due to the different methodologies applied, the amounts of incurred credit losses charged to the financial statements are usually lower than the loss amount determined using the expected loss model used on 31 December 2016 for and Central Bank of Egypt regulations purposes (note 3-1-4).
50 51
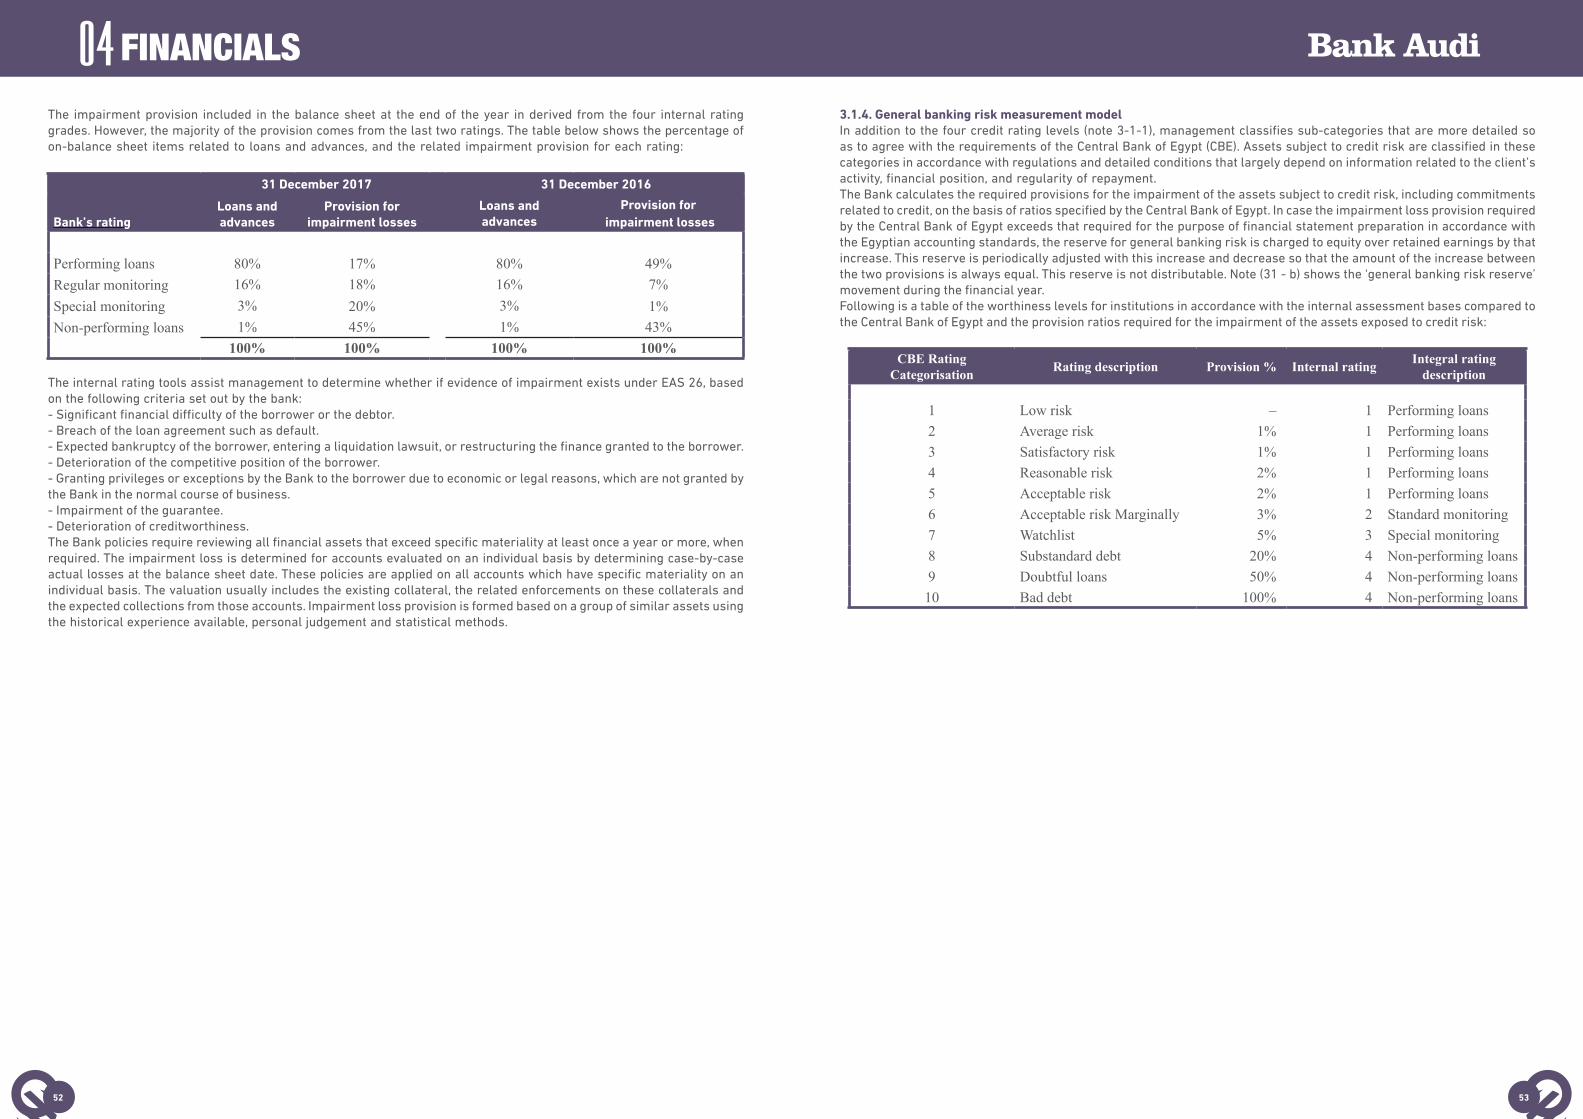
04The impairment provision included in the balance sheet at the end of the year in derived from the four internal rating grades. However, the majority of the provision comes from the last two ratings. The table below shows the percentage of on-balance sheet items related to loans and advances, and the related impairment provision for each rating:
31 December 2017 31 December 2016
Bank’s ratingLoans and advances
Provision for impairment losses
Loans and advances
Provision for impairment losses
Performing loans 80% 17% 80% 49%Regular monitoring 16% 18% 16% 7%Special monitoring 3% 20% 3% 1%Non-performing loans 1% 45% 1% 43%
100% 100% 100% 100%
The internal rating tools assist management to determine whether if evidence of impairment exists under EAS 26, based on the following criteria set out by the bank:- Significant financial difficulty of the borrower or the debtor.- Breach of the loan agreement such as default.- Expected bankruptcy of the borrower, entering a liquidation lawsuit, or restructuring the finance granted to the borrower.- Deterioration of the competitive position of the borrower.- Granting privileges or exceptions by the Bank to the borrower due to economic or legal reasons, which are not granted by the Bank in the normal course of business.- Impairment of the guarantee.- Deterioration of creditworthiness.The Bank policies require reviewing all financial assets that exceed specific materiality at least once a year or more, when required. The impairment loss is determined for accounts evaluated on an individual basis by determining case-by-case actual losses at the balance sheet date. These policies are applied on all accounts which have specific materiality on an individual basis. The valuation usually includes the existing collateral, the related enforcements on these collaterals and the expected collections from those accounts. Impairment loss provision is formed based on a group of similar assets using the historical experience available, personal judgement and statistical methods.
FINANCIALS
3.1.4. General banking risk measurement model In addition to the four credit rating levels (note 3-1-1), management classifies sub-categories that are more detailed so as to agree with the requirements of the Central Bank of Egypt (CBE). Assets subject to credit risk are classified in these categories in accordance with regulations and detailed conditions that largely depend on information related to the client’s activity, financial position, and regularity of repayment. The Bank calculates the required provisions for the impairment of the assets subject to credit risk, including commitments related to credit, on the basis of ratios specified by the Central Bank of Egypt. In case the impairment loss provision required by the Central Bank of Egypt exceeds that required for the purpose of financial statement preparation in accordance with the Egyptian accounting standards, the reserve for general banking risk is charged to equity over retained earnings by that increase. This reserve is periodically adjusted with this increase and decrease so that the amount of the increase between the two provisions is always equal. This reserve is not distributable. Note (31 - b) shows the ‘general banking risk reserve’ movement during the financial year.Following is a table of the worthiness levels for institutions in accordance with the internal assessment bases compared to the Central Bank of Egypt and the provision ratios required for the impairment of the assets exposed to credit risk:
CBE RatingCategorisation Rating description Provision % Internal rating Integral rating
description
1 Low risk – 1 Performing loans2 Average risk 1% 1 Performing loans3 Satisfactory risk 1% 1 Performing loans4 Reasonable risk 2% 1 Performing loans5 Acceptable risk 2% 1 Performing loans6 Acceptable risk Marginally 3% 2 Standard monitoring7 Watchlist 5% 3 Special monitoring8 Substandard debt 20% 4 Non-performing loans9 Doubtful loans 50% 4 Non-performing loans10 Bad debt 100% 4 Non-performing loans
52 53

043.1.5. Maximum limit for credit risk before collaterals
2017 2016
Balance Sheet items exposed to credit risks
Balances with the Central Bank limited
to the statutory reserve ratio3,128,167,111 1,349,354,960
Due from banks 5,785,194,762 11,286,605,885
Treasury bills and other government securities 6,305,364,876 1,987,886,919
Loans and advances to banks – 146,132,000
Loans and advances to customers
Retail loans (net):
- Credit cards 585,768,056 510,456,717
- Personal loans 4,015,310,913 3,748,431,014
- Overdrafts 605,829,822 465,612,762
- Real estate loans 232,085,707 209,932,578
Corporates Loans (net):
- Overdrafts 11,730,910,875 11,405,395,379
- Direct loans 5,397,033,991 4,895,967,135
- Syndicated loans 6,196,423,466 7,924,129,889
- Other loans 632,924,753 825,730,947
Financial investments:
- Debt instruments 8,134,834,852 7,816,307,679
Total 52,749,849,184 52,571,943,864
Off-balance sheet items exposed to credit risk *
Loans commitments and other irrecoverable credit commitments 550,249,516 265,528,060
Letters of credit - import 268,705,323 355,024,001
Letters of guarantee 4,701,590,774 3,734,865,756
Letters of guarantee for suppliers facilities 233,750,126 138,310,543
Letters of credits - export 1,191,881 –
Total 5,755,487,620 4,493,728,360
*(note 33)- The above table represents the maximum limit for credit risk as of 31 September 2017 and 31 December 2016, without taking any collaterals into consideration. For on-balance-sheet items, amounts stated depend on net carrying amounts shown in the balance sheet. As shown in the preceding table 56% of the total maximum limit exposed to credit risk resulted from loans and advances to customers and banks at 31 December 2017 against 57% at 31 December 2017, while investments in debt instruments represents 15% against 15% at 31 December 2016.
FINANCIALS
3.1.5 Maximum limit for credit risk before collateralsThe management is confident of its ability to maintain control on an ongoing basis and maintain the minimum credit risk resulting from the loans and advances portfolio and debt instruments based on the following:- 96% of the loans and advances portfolio is classified at the highest two ratings in the internal rating as at 31 December 2017 against 96% as at 31 December 2016.- 90% of the loans and advances portfolio does not have past dues or impairment indicators as at 31 December 2017 against 91% as at 31 December 2016.- Loans and advances, which are assessed on individual basis, amounted to EGP 440,803,902 at 31 December 2017 against EGP 452,723,604 at 31 December 2016, there is impairment less than 81.96% against 74% at 31 December 2016.- As a result, the impairment loss charged to statement of income at 31 December 2017 amounted to EGP 96,856,748 on an individual basis against the amount of EGP 81,863,929 at 31 December 2016.- The Bank has applied more strict granting operations when granting loans and advances during the financial year ended as of 31 December 2017.- Investments in debt instruments and treasury bills contain more than 93% at 31 December 2017 against 92% at 31 December 2016 due from the Egyptian government.
3.1.6. Loans and advancesBelow is the position of loans and advances relative to credit worthiness:
2017 2016
Neither past due nor impaired 27,152,696,395 27,766,263,198
Past due but not impaired 2,568,724,801 2,393,503,363
Subject to Impairment 440,803,902 452,723,604
Total 30,162,225,098 30,612,490,165
Less: Provision for impairment losses (765,937,513) (626,833,742)
Net 29,396,287,585 29,985,656,423
- The Bank’s total impairment loss for loans and advances amounted to EGP 765,937,513 in 31 December 2017 against EGP 626,833,742 as at 31 December 2016, of which EGP 341,228,027 against EGP 325,957,533 as at 31 December 2016 representing impairment of individual loans and the remaining amount of EGP 424,709,486 against EGP 300,876,209 as at 31 December 2016 representing impairment for the credit portfolio as a group. Note (18) includes additional information regarding the impairment loss provision on loans and advances to customers.
54 55

04Loans and advances neither having past dues nor subject to impairmentThe credit quality of the loans and advances portfolio that neither have past dues nor are subject to impairment is evaluated based on the internal rating of the Bank.
3.1.6 Loans and advances
Loans and advances to customers at 31 December 2017
Retail
Credit cards Personal loans Overdrafts Real estate
loans
Performing 498,262,741 3,416,402,858 612,566,500 188,631,084
Total 498,262,741 3,416,402,858 612,566,500 188,631,084
Loans and advances to customers at 31 December 2017
Corporate
Overdrafts anddirect loans
Syndicated loans Other loans
Performing 11,956,758,035 5,105,481,846 252,868,956
Regular monitoring 3,381,923,171 834,157,349 296,043,363
Special monitoring 470,017,460 139,583,032 -
Total 15,808,698,666 6,079,222,227 548,912,319
Loans that are backed by collateral are not considered impaired for the non-performing category, taking into consideration the collectability of the collateral.
Loans and advances to customers at 31 December 2016
Retail
Credit cards Personal loans Overdrafts Real estate
loans
Performing 464,003,847 3,354,955,966 470,473,044 201,156,707
Total 464,003,847 3,354,955,966 470,473,044 201,156,707
Loans and advances to customers at 31 December 2016
Corporate
Overdrafts anddirect loans
Syndicated loans Other loans
Performing 12,479,227,580 5,621,525,482 701,291,171
Regular monitoring 1,975,672,115 1,699,940,108 77,405,981
Special monitoring 32,502,623 635,854,469 –
Total 14,487,402,318 7,957,320,059 778,697,152
Loans that are backed by collateral are not considered impaired for the non-performing category, taking into consideration the collectability of the collateral.
FINANCIALS
Loans and advances with past dues but not subject to impairmentLoans and advances that have past dues until 90 days but are not considered impaired unless there is information that proves otherwise. Loans and advances having past dues but not impaired, and the fair value of the related collaterals are as follows:
Balance at 31 December 2017
Retail Corporate Net loans and advances to
customers Creditcards
Personalloans
Real estateloans
Overdrafts anddirect loans
Syndicatedloans
Past dues up to 30 days 51,077,408 386,899,383 41,927,011 961,625,007 – 1,441,528,809
Past dues from
to 60 days 30
20,876,281 142,813,194 1,680,813 476,816,820 – 642,187,108
Past dues from
to 90 days 60
12,509,110 47,559,654 – 424,940,120 – 485,008,884
Total 84,462,799 577,272,231 43,607,824 1,863,381,947 – 2,568,724,801
Fair value of collaterals 3,231,362 123,181,826 – 385,006,366 – 511,419,554
Balance at 31 December 2016
Retail Corporate Net loans and advances to
customersCredit cards Personal
loans Real estate
loans
Overdrafts and direct
loans
Syndicatedloans
Past dues up to 30 days 30,993,485 260,728,750 7,449,034 143,788,164 15,587,937 458,547,370
Past dues from
to 60 days 30 11,121,653 81,088,177 1,400,282 200,709,096 – 294,319,208
Past dues from
to 90 days 60 5,800,610 34,488,619 – 1,600,347,556 – 1,640,636,785
Total 47,915,748 376,305,546 8,849,316 1,944,844,816 15,587,937 2,393,503,363
Fair value of collaterals 2,209,886 39,184,234 – – – 41,394,120
Upon the initial recognition of loans and advances, the fair value of collaterals is assessed based on valuation methods commonly used for similar assets. In subsequent periods, the fair value is updated to reflect the market price or the price of similar assets.
Loans and advances subject to impairmentA.Loans and advances to customers individually The individually impaired loans and advances to customers before taking into consideration cash flows from collaterals amounted to EGP 440,803,902 at 31 December 2017 against EGP 452,723,604 at 31 December 2016.
56 57
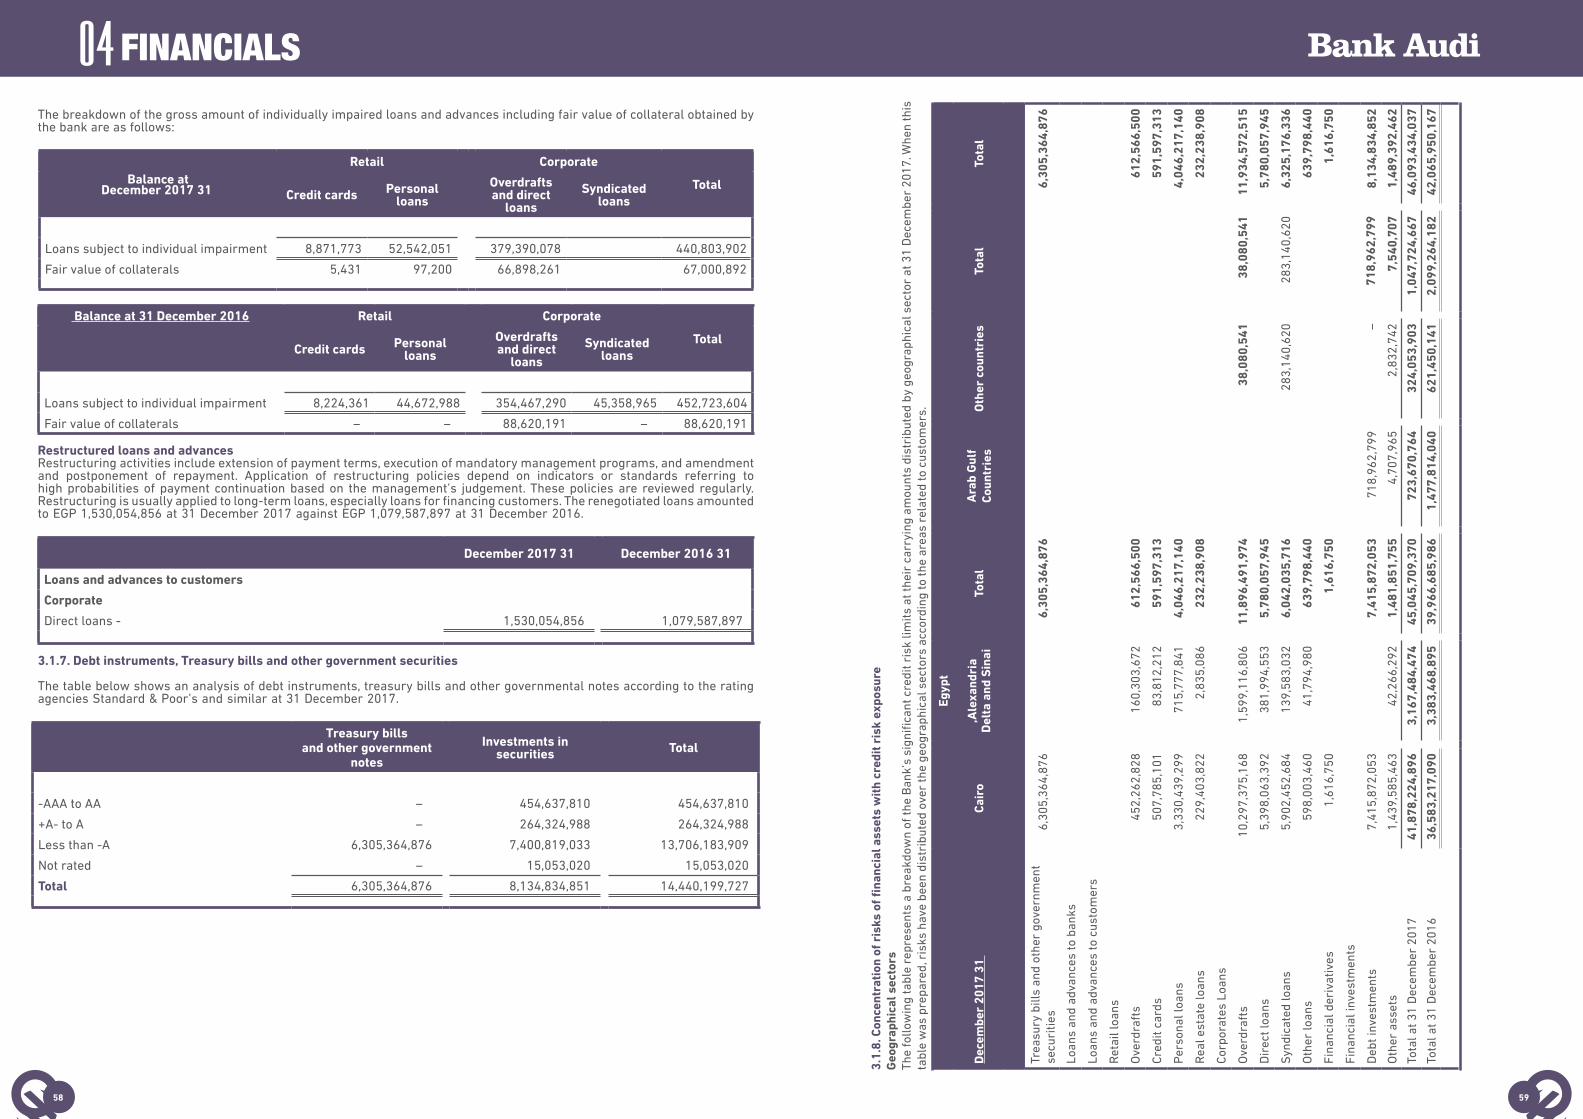
04The breakdown of the gross amount of individually impaired loans and advances including fair value of collateral obtained by the bank are as follows:
Balance atDecember 2017 31
Retail Corporate
TotalCredit cards Personal
loans Overdrafts and direct
loans Syndicated
loans
Loans subject to individual impairment 8,871,773 52,542,051 379,390,078 440,803,902
Fair value of collaterals 5,431 97,200 66,898,261 67,000,892
Balance at 31 December 2016 Retail Corporate
TotalCredit cards Personal
loans Overdrafts and direct
loans Syndicated
loans
Loans subject to individual impairment 8,224,361 44,672,988 354,467,290 45,358,965 452,723,604
Fair value of collaterals – – 88,620,191 – 88,620,191
Restructured loans and advancesRestructuring activities include extension of payment terms, execution of mandatory management programs, and amendment and postponement of repayment. Application of restructuring policies depend on indicators or standards referring to high probabilities of payment continuation based on the management’s judgement. These policies are reviewed regularly. Restructuring is usually applied to long-term loans, especially loans for financing customers. The renegotiated loans amounted to EGP 1,530,054,856 at 31 December 2017 against EGP 1,079,587,897 at 31 December 2016.
December 2017 31 December 2016 31
Loans and advances to customers
Corporate
Direct loans - 1,530,054,856 1,079,587,897
3.1.7. Debt instruments, Treasury bills and other government securities
The table below shows an analysis of debt instruments, treasury bills and other governmental notes according to the rating agencies Standard & Poor’s and similar at 31 December 2017.
Treasury bills and other government
notes
Investments insecurities Total
-AAA to AA – 454,637,810 454,637,810
+A- to A – 264,324,988 264,324,988
Less than -A 6,305,364,876 7,400,819,033 13,706,183,909
Not rated – 15,053,020 15,053,020
Total 6,305,364,876 8,134,834,851 14,440,199,727
FINANCIALS
3.1.
8. C
once
ntra
tion
of r
isks
of fi
nanc
ial a
sset
s w
ith
cred
it r
isk
expo
sure
Geo
grap
hica
l sec
tors
The
follo
win
g ta
ble
repr
esen
ts a
bre
akdo
wn
of th
e B
ank’
s si
gnifi
cant
cre
dit r
isk
limits
at t
heir
car
ryin
g am
ount
s di
stri
bute
d by
geo
grap
hica
l sec
tor
at 3
1 D
ecem
ber
2017
. Whe
n th
is
tabl
e w
as p
repa
red,
ris
ks h
ave
been
dis
trib
uted
ove
r th
e ge
ogra
phic
al s
ecto
rs a
ccor
ding
to th
e ar
eas
rela
ted
to c
usto
mer
s.
Egyp
t
Dec
embe
r 20
17 3
1 Ca
iro
,Ale
xand
ria
Del
ta a
nd S
inai
Tota
l A
rab
Gul
fCo
untr
ies
Oth
er c
ount
ries
Tota
lTo
tal
Tre
asur
y bi
lls a
nd o
ther
gov
ernm
ent
secu
ritie
s6,
305,
364,
876
6,30
5,36
4,87
66,
305,
364,
876
Loan
s an
d ad
vanc
es to
ban
ks
Loan
s an
d ad
vanc
es to
cus
tom
ers
Ret
ail l
oans
Ove
rdra
fts
452,
262,
828
160,
303,
672
612,
566,
500
612,
566,
500
Cre
dit c
ards
507,
785,
101
83,8
12,2
1259
1,59
7,31
359
1,59
7,31
3
Per
sona
l loa
ns3,
330,
439,
299
715,
777,
841
4,04
6,21
7,14
04,
046,
217,
140
Rea
l est
ate
loan
s22
9,40
3,82
22,
835,
086
232,
238,
908
232,
238,
908
Cor
pora
tes
Loan
s
Ove
rdra
fts
10,2
97,3
75,1
681,
599,
116,
806
11,8
96,4
91,9
7438
,080
,541
38,0
80,5
4111
,934
,572
,515
Dir
ect l
oans
5,39
8,06
3,39
238
1,99
4,55
35,
780,
057,
945
5,78
0,05
7,94
5
Syn
dica
ted
loan
s5,
902,
452,
684
139,
583,
032
6,04
2,03
5,71
628
3,14
0,62
028
3,14
0,62
06,
325,
176,
336
Oth
er lo
ans
598,
003,
460
41,7
94,9
8063
9,79
8,44
063
9,79
8,44
0
Fina
ncia
l der
ivat
ives
1,61
6,75
01,
616,
750
1,61
6,75
0
Fina
ncia
l inv
estm
ents
Deb
t inv
estm
ents
7,41
5,87
2,05
37,
415,
872,
053
718,
962,
799
–71
8,96
2,79
98,
134,
834,
852
Oth
er a
sset
s1,
439,
585,
463
42,2
66,2
921,
481,
851,
755
4,70
7,96
52,
832,
742
7,54
0,70
71,
489,
392,
462
Tota
l at 3
1 D
ecem
ber
2017
41,8
78,2
24,8
963,
167,
484,
474
45,0
45,7
09,3
7072
3,67
0,76
432
4,05
3,90
31,
047,
724,
667
46,0
93,4
34,0
37
Tota
l at 3
1 D
ecem
ber
2016
36,5
83,2
17,0
903,
383,
468,
895
39,9
66,6
85,9
861,
477,
814,
040
621,
450,
141
2,09
9,26
4,18
242
,065
,950
,167
58 59

04
Egyp
t
31 D
ecem
ber
2016
Cair
o A
lexa
ndri
a, D
elta
and
Sin
aiTo
tal
Ara
b G
ulf
Coun
trie
sO
ther
cou
ntri
esTo
tal
Tota
l
Tre
asur
y bi
lls a
nd o
ther
gove
rnm
ent s
ecur
ities
1,98
7,88
6,91
9–
1,
987,
886,
919
–
–
–
1,98
7,88
6,91
9
Loan
s an
d ad
vanc
es to
ban
ks–
–
–
–
14
6,13
2,00
014
6,13
2,00
014
6,13
2,00
0
Loa
ns a
nd a
dvan
ces
tocu
stom
ers
Ret
ail l
oans
Ove
rdra
fts
391,
820,
752
78,6
52,2
9247
0,47
3,04
4–
–
–
47
0,47
3,04
4
Cre
dit c
ards
444,
044,
273
76,0
99,6
8352
0,14
3,95
6–
–
–
52
0,14
3,95
6
Per
sona
l loa
ns3,
126,
631,
547
649,
302,
953
3,77
5,93
4,50
0–
–
–
3,
775,
934,
500
Rea
l est
ate
loan
s20
8,09
2,73
81,
913,
285
210,
006,
023
–
–
–
210,
006,
023
Corp
orat
es L
oans
Ove
rdra
fts
9,50
7,95
9,74
72,
129,
355,
882
11,6
37,3
15,6
29–
51
,004
,841
51,0
04,8
4111
,688
,320
,470
Dir
ect l
oans
4,74
2,28
9,26
330
7,12
9,65
85,
049,
418,
921
–
–
–
5,04
9,41
8,92
1
Syn
dica
ted
loan
s6,
832,
494,
008
105,
124,
492
6,93
7,61
8,50
081
2,85
9,25
131
2,90
9,93
81,
125,
769,
189
8,06
3,38
7,68
9
Oth
er lo
ans
834,
139,
087
666,
473
834,
805,
560
–
–
–
834,
805,
560
Fina
ncia
l der
ivat
ives
477,
464
477,
464
–
2,82
62,
826
480,
291
Fina
ncia
l inv
estm
ents
Deb
t inv
estm
ents
7,04
7,03
4,85
5–
7,
047,
034,
855
659,
399,
826
109,
872,
998
769,
272,
824
7,81
6,30
7,67
9
Oth
er a
sset
s1,
460,
346,
437
35,2
24,1
781,
495,
570,
615
5,55
4,96
31,
527,
537
7,08
2,50
01,
502,
653,
115
Tota
l at 3
1 D
ecem
ber
2016
36,5
83,2
17,0
903,
383,
468,
896
39,9
66,6
85,9
861,
477,
814,
040
621,
450,
140
2,09
9,26
4,18
142
,065
,950
,167
Tota
l at 3
1 D
ecem
ber
2015
28,5
16,1
23,3
562,
188,
748,
622
30,7
04,8
71,9
7863
2,81
4,66
830
4,79
0,17
593
7,60
4,84
331
,642
,476
,821
FINANCIALS
Indu
stry
sec
tors
The
Follo
win
g ta
ble
repr
esen
ts a
naly
sis
of th
e m
ost i
mpo
rtan
t cre
dit r
isk
limit
for
the
bank
at b
ook
valu
e di
stri
bute
d ac
cord
ing
to th
e bu
sine
ss s
egm
ent o
f ban
k’s
cust
omer
s.
31
Dec
embe
r 20
17 F
inan
cial
inst
itut
ions
Indu
stri
al in
stit
utio
ns R
eal e
stat
eac
tivi
ty R
etai
l tra
dean
d w
hole
sale
Gov
ernm
ent
sect
orO
ther
act
ivit
ies
Ret
ail
Tota
l
Tre
asur
y bi
lls a
nd o
ther
gov
ernm
ent
secu
ritie
s–
––
–6,
305,
364,
876
––
6,30
5,36
4,87
6
Loa
ns a
nd a
dvan
ces
toba
nks
––
––
––
––
Loa
ns a
nd a
dvan
ces
tocu
stom
ers
––
––
––
––
Ret
ail l
oans
––
––
––
––
Ove
rdra
fts
––
––
––
612,
566,
500
612,
566,
500
Cre
dit c
ards
––
––
––
591,
597,
313
591,
597,
313
Per
sona
l loa
ns–
––
––
–4,
046,
217,
140
4,04
6,21
7,14
0
Rea
l est
ate
loan
s–
––
––
–23
2,23
8,90
823
2,23
8,90
8
Cor
pora
tes
Loan
s
Ove
rdra
fts
331,
683,
582
6,25
4,69
0,07
81,
297,
807,
612
2,95
3,75
1,41
361
4,34
8,34
748
2,29
1,48
3–
11,9
34,5
72,5
15
Dir
ect l
oans
1,28
2,43
7,98
82,
093,
701,
868
921,
322,
568
823,
175,
773
206,
897,
299
452,
522,
449
–5,
780,
057,
945
Syn
dica
ted
loan
s–
2,71
3,72
8,48
217
1,09
2,13
82,
906,
681,
948
533,
673,
768
–6,
325,
176,
336
Oth
er lo
ans
–13
3,75
8,43
919
,872
,697
261,
679,
321
89,7
55,5
0613
4,73
2,47
7–
639,
798,
440
Fina
ncia
l der
ivat
ives
511,
365
1,10
5,38
5–
––
––
1,61
6,75
0
Fina
ncia
l inv
estm
ents
Deb
t inv
estm
ents
203,
772,
670
––
–7,
400,
819,
034
530,
243,
148
–8,
134,
834,
852
Oth
er a
sset
s33
,256
,820
36,1
74,5
0131
,476
,045
6,89
9,25
432
7,11
9,17
41,
001,
089,
218
53,3
77,4
501,
489,
392,
462
Tot
al a
t 31
Dec
embe
r20
171,
851,
662,
425
11,2
33,1
58,7
532,
441,
571,
060
4,04
5,50
5,76
117
,850
,986
,184
3,13
4,55
2,54
35,
535,
997,
311
46,0
93,4
34,0
37
Tot
al a
t 31
Dec
embe
r20
162,
652,
493,
536
9,95
1,66
5,73
03,
610,
338,
024
3,42
1,33
6,82
214
,487
,446
,836
2,92
6,98
9,04
15,
015,
680,
178
42,0
65,9
50,1
67
60 61
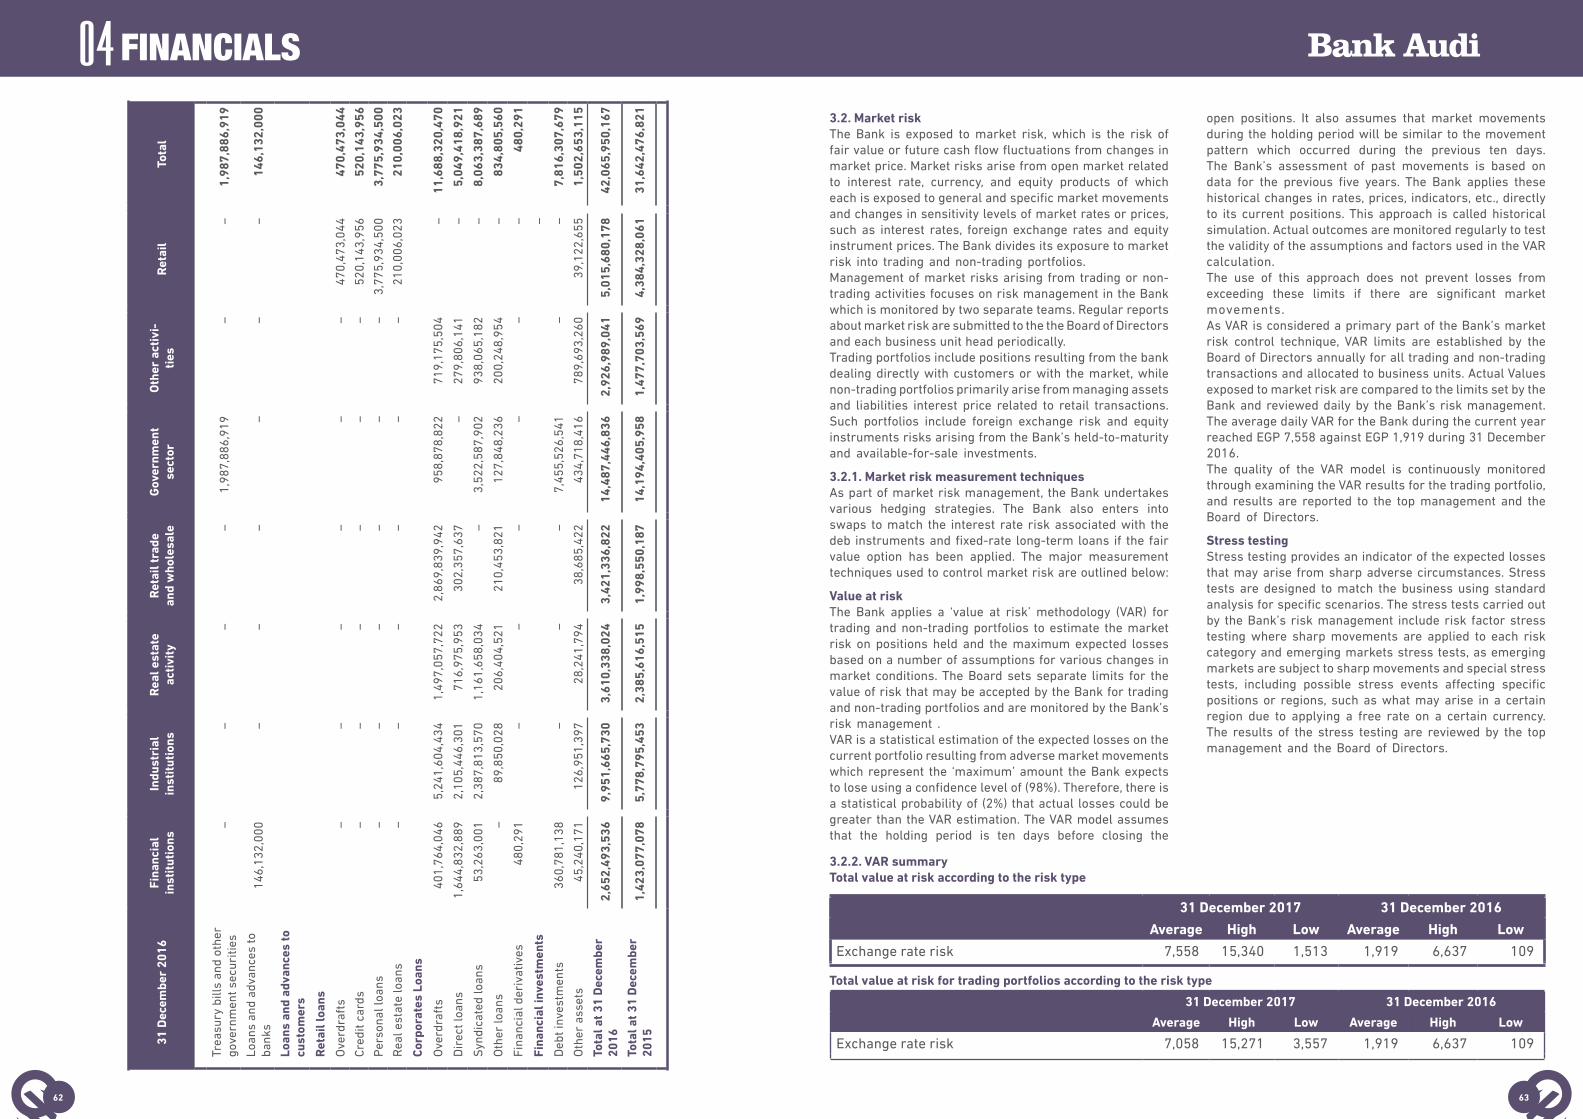
04
31 D
ecem
ber
2016
Fina
ncia
l in
stit
utio
nsIn
dust
rial
in
stit
utio
nsR
eal e
stat
e ac
tivi
tyR
etai
l tra
de
and
who
lesa
leG
over
nmen
t se
ctor
Oth
er a
ctiv
i-ti
esR
etai
lTo
tal
Tre
asur
y bi
lls a
nd o
ther
gove
rnm
ent s
ecur
ities
––
––
1,98
7,88
6,91
9–
–1,
987,
886,
919
Loa
ns a
nd a
dvan
ces
toba
nks
146,
132,
000
––
––
––
146,
132,
000
Loa
ns a
nd a
dvan
ces
tocu
stom
ers
Ret
ail l
oans
Ove
rdra
fts
––
––
––
470,
473,
044
470,
473,
044
Cre
dit c
ards
––
––
––
520,
143,
956
520,
143,
956
Per
sona
l loa
ns–
––
––
–3,
775,
934,
500
3,77
5,93
4,50
0
Rea
l est
ate
loan
s–
––
––
–21
0,00
6,02
321
0,00
6,02
3
Corp
orat
es L
oans
Ove
rdra
fts
401,
764,
046
5,24
1,60
4,43
41,
497,
057,
722
2,86
9,83
9,94
295
8,87
8,82
271
9,17
5,50
4–
11,6
88,3
20,4
70
Dir
ect l
oans
1,64
4,83
2,88
92,
105,
446,
301
716,
975,
953
302,
357,
637
–27
9,80
6,14
1–
5,04
9,41
8,92
1
Syn
dica
ted
loan
s53
,263
,001
2,38
7,81
3,57
01,
161,
658,
034
–3,
522,
587,
902
938,
065,
182
–8,
063,
387,
689
Oth
er lo
ans
–89
,850
,028
206,
404,
521
210,
453,
821
127,
848,
236
200,
248,
954
–83
4,80
5,56
0
Fina
ncia
l der
ivat
ives
480,
291
––
––
––
480,
291
Fina
ncia
l inv
estm
ents
–
Deb
t inv
estm
ents
360,
781,
138
––
–7,
455,
526,
541
––
7,81
6,30
7,67
9
Oth
er a
sset
s45
,240
,171
126,
951,
397
28,2
41,7
9438
,685
,422
434,
718,
416
789,
693,
260
39,1
22,6
551,
502,
653,
115
Tot
al a
t 31
Dec
embe
r20
162,
652,
493,
536
9,95
1,66
5,73
03,
610,
338,
024
3,42
1,33
6,82
214
,487
,446
,836
2,92
6,98
9,04
15,
015,
680,
178
42,0
65,9
50,1
67
Tot
al a
t 31
Dec
embe
r20
151,
423,
077,
078
5,77
8,79
5,45
32,
385,
616,
515
1,99
8,55
0,18
714
,194
,405
,958
1,47
7,70
3,56
94,
384,
328,
061
31,6
42,4
76,8
21
FINANCIALS
3.2. Market riskThe Bank is exposed to market risk, which is the risk of fair value or future cash flow fluctuations from changes in market price. Market risks arise from open market related to interest rate, currency, and equity products of which each is exposed to general and specific market movements and changes in sensitivity levels of market rates or prices, such as interest rates, foreign exchange rates and equity instrument prices. The Bank divides its exposure to market risk into trading and non-trading portfolios.Management of market risks arising from trading or non-trading activities focuses on risk management in the Bank which is monitored by two separate teams. Regular reports about market risk are submitted to the the Board of Directors and each business unit head periodically.Trading portfolios include positions resulting from the bank dealing directly with customers or with the market, while non-trading portfolios primarily arise from managing assets and liabilities interest price related to retail transactions. Such portfolios include foreign exchange risk and equity instruments risks arising from the Bank’s held-to-maturity and available-for-sale investments.
3.2.1. Market risk measurement techniquesAs part of market risk management, the Bank undertakes various hedging strategies. The Bank also enters into swaps to match the interest rate risk associated with the deb instruments and fixed-rate long-term loans if the fair value option has been applied. The major measurement techniques used to control market risk are outlined below:
Value at riskThe Bank applies a ‘value at risk’ methodology (VAR) for trading and non-trading portfolios to estimate the market risk on positions held and the maximum expected losses based on a number of assumptions for various changes in market conditions. The Board sets separate limits for the value of risk that may be accepted by the Bank for trading and non-trading portfolios and are monitored by the Bank’s risk management . VAR is a statistical estimation of the expected losses on the current portfolio resulting from adverse market movements which represent the ‘maximum’ amount the Bank expects to lose using a confidence level of (98%). Therefore, there is a statistical probability of (2%) that actual losses could be greater than the VAR estimation. The VAR model assumes that the holding period is ten days before closing the
open positions. It also assumes that market movements during the holding period will be similar to the movement pattern which occurred during the previous ten days. The Bank’s assessment of past movements is based on data for the previous five years. The Bank applies these historical changes in rates, prices, indicators, etc., directly to its current positions. This approach is called historical simulation. Actual outcomes are monitored regularly to test the validity of the assumptions and factors used in the VAR calculation.The use of this approach does not prevent losses from exceeding these limits if there are significant market movements.As VAR is considered a primary part of the Bank’s market risk control technique, VAR limits are established by the Board of Directors annually for all trading and non-trading transactions and allocated to business units. Actual Values exposed to market risk are compared to the limits set by the Bank and reviewed daily by the Bank’s risk management. The average daily VAR for the Bank during the current year reached EGP 7,558 against EGP 1,919 during 31 December 2016.The quality of the VAR model is continuously monitored through examining the VAR results for the trading portfolio, and results are reported to the top management and the Board of Directors.
Stress testingStress testing provides an indicator of the expected losses that may arise from sharp adverse circumstances. Stress tests are designed to match the business using standard analysis for specific scenarios. The stress tests carried out by the Bank’s risk management include risk factor stress testing where sharp movements are applied to each risk category and emerging markets stress tests, as emerging markets are subject to sharp movements and special stress tests, including possible stress events affecting specific positions or regions, such as what may arise in a certain region due to applying a free rate on a certain currency. The results of the stress testing are reviewed by the top management and the Board of Directors.
3.2.2. VAR summaryTotal value at risk according to the risk type
31 December 2017 31 December 2016
Average High Low Average High Low
Exchange rate risk 7,558 15,340 1,513 1,919 6,637 109
Total value at risk for trading portfolios according to the risk type
31 December 2017 31 December 2016
Average High Low Average High Low
Exchange rate risk 7,058 15,271 3,557 1,919 6,637 109
62 63

043.
2.3.
For
eign
exc
hang
e vo
lati
lity
risk
The
Ban
k is
exp
osed
to
the
effec
ts o
f vo
latil
ity in
the
pre
vaili
ng f
orei
gn c
urre
ncy
exch
ange
rat
es o
n its
bal
ance
she
et a
nd c
ash
flow
s. T
he B
oard
of
Dir
ecto
rs s
ets
limits
fo
r fo
reig
n ex
chan
ge w
ith t
he a
ggre
gate
val
ue f
or e
ach
posi
tion
at t
he e
nd o
f th
e da
y as
wel
l as
dur
ing
the
day,
whi
ch is
con
trol
led
on t
imel
y ba
sis.
The
fol
low
ing
tabl
e su
mm
ariz
es t
he B
ank’
s ex
posu
re t
o fo
reig
n ex
chan
ge v
olat
ility
ris
k at
31
Dec
embe
r 20
17. T
he f
ollo
win
g ta
ble
incl
udes
the
car
ryin
g am
ount
s of
the
fina
ncia
l ins
trum
ents
in
the
ir c
urre
ncie
s: Fina
ncia
l Ass
ets:
Egyp
tian
P
ound
sU
SD
G
BP
Euro
Oth
ers
Tota
l
Cas
h an
d ba
lanc
e w
ith th
e C
entr
al B
ank
of E
gypt
3,49
9,91
5,21
226
6,04
7,62
520
,922
,848
73,5
35,3
0835
,376
,900
3,89
5,79
7,89
3
Due
from
ban
ks1,
000,
005,
376
3,93
2,22
4,00
945
,960
,167
800,
692,
133
6,31
3,07
75,
785,
194,
762
Trea
sury
bill
s an
d ot
her
gove
rnm
ent s
ecur
ities
6,30
5,36
4,87
6–
–
–
–
6,
305,
364,
876
Loan
s an
d ad
vanc
es to
cus
tom
ers
21,3
89,4
88,3
007,
500,
570,
055
2,40
250
6,21
3,94
712
,880
29,3
96,2
87,5
84
Fina
ncia
l der
ivat
ives
1,61
6,75
0–
–
–
–
1,
616,
750
Fina
ncia
l inv
estm
ents
ava
ilabl
e-fo
r-sa
le30
3,06
7,05
172
3,04
0,16
9–
–
–
1,
026,
107,
220
Hel
d-to
-mat
urity
inve
stm
ents
7,11
4,56
5,10
2–
–
–
–
7,
114,
565,
102
Oth
er fi
nanc
ial a
sset
s68
8,96
6,79
547
,880
,061
–
90,7
65–
73
6,93
7,62
1
Tota
l fina
ncia
l ass
ets
40,3
02,9
89,4
6212
,469
,761
,919
66,8
85,4
171,
380,
532,
153
41,7
02,8
5754
,261
,871
,808
Fina
ncia
l lia
bilit
ies
Due
to b
anks
262,
688,
705
82,0
52,5
58–
–
41
234
4,74
1,67
5
Cus
tom
ers’
dep
osits
36,5
34,2
85,9
539,
732,
000,
623
99,9
01,3
2097
9,52
1,09
427
,677
,939
47,3
73,3
86,9
29
Oth
er lo
ans
–
1,24
0,93
9,00
0–
–
–
1,
240,
939,
000
Fina
ncia
l der
ivat
ives
4,58
2,99
3–
–
–
–
4,
582,
993
Oth
er fi
nanc
ial l
iabi
litie
s66
3,75
5,91
591
,348
,836
51,9
2393
1,77
5–
75
6,08
8,44
9
Tota
l Fin
anci
al li
abili
ties
37,4
65,3
13,5
6611
,146
,341
,017
99,9
53,2
4398
0,45
2,86
927
,678
,351
49,7
19,7
39,0
46
Net
fina
ncia
l pos
itio
n2,
837,
675,
896
1,32
3,42
0,90
2(3
3,06
7,82
6)40
0,07
9,28
414
,024
,507
4,54
2,13
2,76
2
Cred
it r
elat
ed c
omm
itm
ents
514,
121,
231
36,1
28,2
8555
0,24
9,51
6
31 D
ecem
ber
2016
Tot
al fi
nanc
ial a
sset
s36
,601
,054
,719
15,8
78,5
79,6
241,
154,
415,
452
84,8
14,2
9638
,933
,539
53,7
57,7
97,6
30
Tota
l Fin
anci
al li
abili
ties
35,3
05,0
71,1
2813
,242
,699
,596
1,15
7,04
9,33
314
7,04
7,88
329
,676
,087
49,8
81,5
44,0
28
Net
fina
ncia
l pos
itio
n1,
295,
983,
591
2,63
5,88
0,02
8(2
,633
,881
)(6
2,23
3,58
7)9,
257,
452
3,87
6,25
3,60
2
FINANCIALS
3.2.4. Interest rate riskThe Bank is exposed to the effects of fluctuations in the interest rates prevailing in the market, which is the risk of cash flows of the interest rate represented in fluctuation of future cash flows for a financial instrument due to changes in the interest rate of the instrument. Fair value interest rate risk is the risk that the value of a financial instrument will fluctuate because of changes in market interest rates. The interest margin may increase due to these changes; however, revenues may decrease in case unexpected movements arise. The Board sets limits on the level of mismatch of interest rate repricing that the Bank may maintain, which is monitored daily by the Bank’s Risk management.
64 65

043.
2.4
Inte
rest
rat
e ri
sk (c
onti
nued
)Th
e ta
ble
belo
w s
umm
aris
es th
e B
ank’
s ex
posu
re to
inte
rest
rat
e vo
latil
ity r
isk.
It in
clud
es th
e fi
nanc
ial i
nstr
umen
ts’ c
arry
ing
amou
nts
cate
gori
sed
by th
e ea
rlie
r re
pric
ing
or m
atur
ity d
ates
:
31 D
ecem
ber
2017
Up
to 1
mon
thM
ore
than
1
mon
th u
p to
3
mon
ths
Mor
e th
an 3
m
onth
s up
to
year
1 ye
ar to
5
year
s M
ore
than
5
year
sN
on-i
nter
est
bear
ing
Tota
l
Cas
h an
d ba
lanc
es w
ith th
e C
entr
al B
ank
of
Egyp
t3,
895,
797,
893
3,89
5,79
7,89
3
Due
from
ban
ks3,
572,
161,
750
1,85
9,68
8,91
335
3,34
4,09
95,
785,
194,
762
Trea
sury
bill
s an
d ot
her
gove
rnm
ent s
ecur
ities
84,4
20,2
2171
0,19
1,65
85,
510,
752,
997
6,30
5,36
4,87
6
Loan
s an
d ad
vanc
es to
cus
tom
ers
3,39
7,75
3,39
816
,683
,786
,006
5,05
9,38
7,99
94,
130,
537,
940
393,
263,
359
(268
,441
,118
)*29
,396
,287
,584
Loan
s an
d ad
vanc
es to
ban
ks
Fina
ncia
l der
ivat
ives
1,61
6,75
01,
616,
750
Fina
ncia
l inv
estm
ents
ava
ilabl
e-fo
r-sa
le26
4,32
4,98
975
0,89
1,73
910
,890
,492
1,02
6,10
7,22
0
Hel
d-to
-mat
urity
inve
stm
ents
1,31
4,81
3,14
331
3,72
9,74
35,
061,
413,
906
549,
818,
316
(125
,210
,006
)**
7,11
4,56
5,10
2
Oth
er fi
nanc
ial a
sset
s73
6,93
7,62
173
6,93
7,62
1
Tota
l fina
ncia
l ass
ets
7,05
4,33
5,36
920
,568
,479
,720
11,1
48,1
95,7
289,
942,
843,
585
943,
081,
675
4,60
4,93
5,73
154
,261
,871
,808
Fina
ncia
l lia
bilit
ies
Due
to b
anks
250,
000,
000
94,7
41,6
7534
4,74
1,67
5
Cus
tom
ers’
dep
osits
6,53
0,62
5,51
27,
879,
988,
458
20,0
42,3
52,1
078,
648,
473,
148
8,79
2,00
04,
263,
155,
704
47,3
73,3
86,9
29
Fina
ncia
l der
ivat
ives
4,58
2,99
34,
582,
993
Oth
er lo
ans
1,06
3,66
2,00
017
7,27
7,00
01,
240,
939,
000
Oth
er fi
nanc
ial l
iabi
litie
s75
6,08
8,44
975
6,08
8,44
9
Tota
l Fin
anci
al li
abili
ties
6,78
0,62
5,51
28,
943,
650,
458
20,2
19,6
29,1
078,
648,
473,
148
8,79
2,00
05,
118,
568,
821
49,7
19,7
39,0
46
Re-
pri
cing
gap
273,
709,
857
11,6
24,8
29,2
62(9
,071
,433
,379
)1,
294,
370,
437
934,
289,
675
(513
,633
,090
)4,
542,
132,
762
31 D
ecem
ber
2016
To
tal fi
nanc
ial a
sset
s8,
504,
840,
244
21,4
75,5
13,9
639,
945,
210,
183
9,35
6,31
5,56
51,
929,
287,
961
2,24
5,75
3,50
753
,757
,797
,630
Tota
l Fin
anci
al li
abili
ties
11,9
78,2
84,8
615,
837,
944,
245
16,3
09,0
47,3
1510
,624
,893
,070
14,1
90,0
005,
117,
184,
536
49,8
81,5
44,0
27
Inte
rest
re-
pri
cing
gap
(3,4
73,4
44,6
17)
15,6
37,5
69,7
18(6
,363
,837
,132
)(1
,268
,577
,505
)1,
915,
097,
961
(2,8
71,4
31,0
29)
3,87
6,25
3,60
3
* Th
e am
ount
of E
GP
(268
,441
,118
) rep
rese
nts
the
valu
e re
venu
es c
olle
cted
in a
dvan
ce a
nd a
mor
tised
ove
r th
e lif
e of
cus
tom
ers’
loan
s.**
The
am
ount
EG
P (1
25,2
10,0
06) i
s br
oken
dow
n in
to E
GP
(135
,210
,006
) whi
ch r
epre
sent
s th
e re
valu
atio
n of
the
avai
labl
e fo
r sa
le fi
nanc
ial i
nves
tmen
ts th
at h
ave
been
FINANCIALS
reclassified to held-to-maturity financial investments, and the amount of EGP 10,000,000 pounds which represents the worth of investment in funds.
3.3. Liquidity riskLiquidity risk is the risk that the bank is unable to meet its obligations associated with its financial liabilities when they fall due and to replace funds when they are withdrawn. The consequence may be the failure to meet obligation to repay depositors and fulfil commitments to lend.
3.3.1. Liquidity risk managementThe Bank’s liquidity management process carried out by the Bank’s risk management includes:* Daily funding managed by monitoring future cash flows to ensure that all requirements can be met when due. This includes liquidation of funds as they due or when lent to customers. To ensure that the Bank reaches its objective, the Bank maintains an active presence in global money markets.* Maintaining a portfolio of highly marketable assets that are assumed to be easily liquidated in the event of an unforeseen interruption of cash flows.* Monitoring liquidity ratios in comparison with the Bank’s internal requirements and CBE requirements.* Managing loans’ concentration and dues.For monitoring and reporting purposes, cash flows for the day, week, and the following month are measured and projected. Such periods are the key periods for liquidity management. The starting point of calculating these expectations is analysing the contractual maturities of financial liabilities and expected financial assets collections.The risk management monitors the incompatibility between medium-term assets, the level and nature of unused loans commitments, overdraft utilisations, and the effect of contingent liabilities such as letters of guarantees and letters of credit.
3.3.2. Funding approachSources of liquidity are regularly reviewed by a separate team in the Bank’s risk management to maintain a wide diversification by currency, geography, provider, product and term.
3.3.3. Non-derivative cash flowsThe table below presents the cash flows payable by the Bank under non-derivative financial liabilities by remaining contractual maturities at the date of financial position. The amounts disclosed in the table are the contractual undiscounted cash flows.The Bank manages the liquidity risk based on expected undiscounted and un-contractual cash inflows, and were not disclosed in accordance with contractual cash flows as they did not enable the current automated systems to use these amounts accurately.
66 67
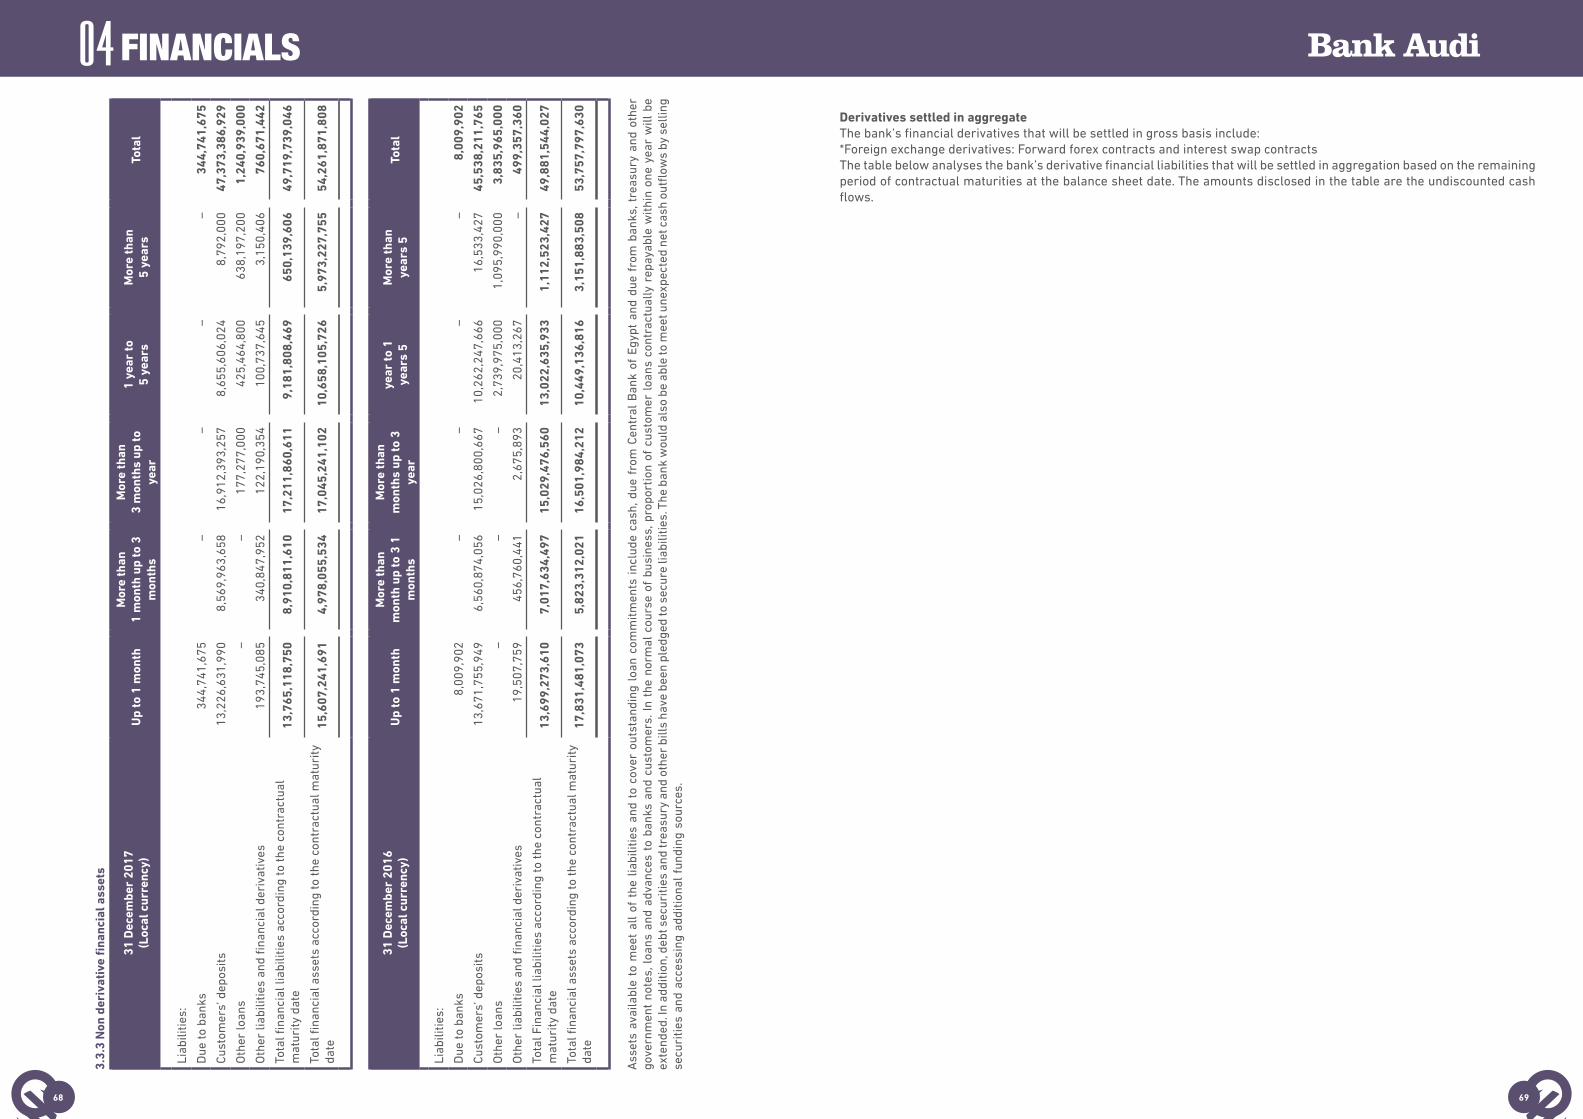
043.
3.3
Non
der
ivat
ive
fina
ncia
l ass
ets
31 D
ecem
ber
2017
(Loc
al c
urre
ncy)
Up
to 1
mon
thM
ore
than
1
mon
th u
p to
3
mon
ths
Mor
e th
an
3 m
onth
s up
to
year
1 ye
ar to
5
year
sM
ore
than
5
year
sTo
tal
Liab
ilitie
s:
Due
to b
anks
344,
741,
675
––
––
344,
741,
675
Cus
tom
ers’
dep
osits
13,2
26,6
31,9
908,
569,
963,
658
16,9
12,3
93,2
578,
655,
606,
024
8,79
2,00
047
,373
,386
,929
Oth
er lo
ans
––
177,
277,
000
425,
464,
800
638,
197,
200
1,24
0,93
9,00
0
Oth
er li
abili
ties
and
fina
ncia
l der
ivat
ives
193,
745,
085
340,
847,
952
122,
190,
354
100,
737,
645
3,15
0,40
676
0,67
1,44
2
Tot
al fi
nanc
ial l
iabi
litie
s ac
cord
ing
to th
e co
ntra
ctua
lm
atur
ity d
ate
13,7
65,1
18,7
508,
910,
811,
610
17,2
11,8
60,6
119,
181,
808,
469
650,
139,
606
49,7
19,7
39,0
46
Tot
al fi
nanc
ial a
sset
s ac
cord
ing
to th
e co
ntra
ctua
l mat
urity
date
15,6
07,2
41,6
914,
978,
055,
534
17,0
45,2
41,1
0210
,658
,105
,726
5,97
3,22
7,75
554
,261
,871
,808
31 D
ecem
ber
2016
(Loc
al c
urre
ncy)
Up
to 1
mon
th M
ore
than
mon
th u
p to
3 1
mon
ths
Mor
e th
an m
onth
s up
to 3
year
yea
r to
1 ye
ars
5 M
ore
than
year
s 5
Tota
l
Liab
ilitie
s:
Due
to b
anks
8,00
9,90
2–
––
–8,
009,
902
Cus
tom
ers’
dep
osits
13,6
71,7
55,9
496,
560,
874,
056
15,0
26,8
00,6
6710
,262
,247
,666
16,5
33,4
2745
,538
,211
,765
Oth
er lo
ans
––
–2,
739,
975,
000
1,09
5,99
0,00
03,
835,
965,
000
Oth
er li
abili
ties
and
fina
ncia
l der
ivat
ives
19,5
07,7
5945
6,76
0,44
12,
675,
893
20,4
13,2
67–
499,
357,
360
Tot
al F
inan
cial
liab
ilitie
s ac
cord
ing
to th
e co
ntra
ctua
lm
atur
ity d
ate
13,6
99,2
73,6
107,
017,
634,
497
15,0
29,4
76,5
6013
,022
,635
,933
1,11
2,52
3,42
749
,881
,544
,027
Tot
al fi
nanc
ial a
sset
s ac
cord
ing
to th
e co
ntra
ctua
l mat
urity
date
17,8
31,4
81,0
735,
823,
312,
021
16,5
01,9
84,2
1210
,449
,136
,816
3,15
1,88
3,50
853
,757
,797
,630
Ass
ets
avai
labl
e to
mee
t al
l of
the
lia
bilit
ies
and
to c
over
out
stan
ding
loa
n co
mm
itmen
ts i
nclu
de c
ash,
due
fro
m C
entr
al B
ank
of E
gypt
and
due
fro
m b
anks
, tre
asur
y an
d ot
her
gove
rnm
ent
note
s, l
oans
and
adv
ance
s to
ban
ks a
nd c
usto
mer
s. I
n th
e no
rmal
cou
rse
of b
usin
ess,
pro
port
ion
of c
usto
mer
loa
ns c
ontr
actu
ally
rep
ayab
le w
ithin
one
yea
r w
ill b
e ex
tend
ed. I
n ad
ditio
n, d
ebt s
ecur
ities
and
trea
sury
and
oth
er b
ills
have
bee
n pl
edge
d to
sec
ure
liabi
litie
s. T
he b
ank
wou
ld a
lso
be a
ble
to m
eet u
nexp
ecte
d ne
t cas
h ou
tflow
s by
sel
ling
secu
ritie
s an
d ac
cess
ing
addi
tiona
l fu
ndin
g so
urce
s.
FINANCIALS
Derivatives settled in aggregateThe bank’s financial derivatives that will be settled in gross basis include:*Foreign exchange derivatives: Forward forex contracts and interest swap contracts The table below analyses the bank’s derivative financial liabilities that will be settled in aggregation based on the remaining period of contractual maturities at the balance sheet date. The amounts disclosed in the table are the undiscounted cash flows.
68 69

043.3.3 Non derivative financial assets
31 December 2017 Up to 1 month More than 1
month up to 3months
More than 3 months up to
yearTotal
Derivatives held-for-trade
Foreign exchange derivatives
Cash Outflows 544,376,853 35,977,680 12,459,991 592,814,524
Cash Inflows 540,908,025 36,429,848 12,510,408 589,848,281
Total cash outflows 544,376,853 35,977,680 12,459,991 592,814,524
Total cash inflows 540,908,025 36,429,848 12,510,408 589,848,281
31 December 2016 Up to 1 month More than 1
month up to 3months
More than 3 months up to
yearTotal
Derivatives held-for-trade
Foreign exchange derivatives
Cash Outflows 94,323,913 33,883,831 – 128,207,744
Cash Inflows 92,529,323 33,353,359 – 125,882,682
Total cash outflows 94,323,913 33,883,831 – 128,207,744
Total cash inflows 92,529,323 33,353,359 – 125,882,682
Off-balance sheet itemsAccording to the table below and note (33)
31 December 2017Not later than 1
year
More than 1 year and less than 5 years
More than 5 years
Total
Loans commitments 5,032,491 545,217,025 – 550,249,516
Financial collaterals, accepted bills and other financial advances 4,402,070,614 749,391,726 53,775,764 5,205,238,104
Capital commitments resulting from the acquisition of fixed assets* 34,718,438 – – 34,718,438
Total 4,441,821,543 1,294,608,751 53,775,764 5,790,206,058
31 December 2016Not later than 1
year
More than 1 year and less than 5 years
More than 5 years
Total
Loans commitments 97,815,642 147,824,055 19,888,363 265,528,060
Financial collaterals, accepted bills and other financial advances 3,092,537,111 725,062,655 111,154,585 3,928,754,351
Capital commitments resulting from the acquisition of fixed assets* 259,009,648 – – 259,009,648
Total 3,449,362,401 872,886,710 131,042,948 4,453,292,059
* Note (33-b)
FINANCIALS
3.3.4. Fair value of financial assets and liabilitiesFinancial instruments measured at fair value using valuation methodsThe change in the estimated fair value using valuation techniques at 31 December 2017 amounted to EGP (2,927,700) against EGP (27,200,833) at 31 December 2016.Financial instruments not measured at fair valueThe table below summarizes the current value and the fair value for financial assets and liabilities not presented in the Bank’s balance sheet at their fair value:
Fair valueCarrying amountFinancial assets
31 December 201631 December 201731 December 201631 December 2017
6,881,073,0216,849,814,0757,039,421,2287,114,565,102Held-to-maturity investments
Due from BanksFair value of placements and deposits bearing variable interest rate for one day is its current value. The expected fair value for deposits bearing variable interest is estimated based on the discounted cash flows using the rate interest rate prevailing in the financial markets for debts with similar asset of similar credit risk and due dates.
Loans and advances to banksLoans and advances to banks are represented in borrowings other than deposits at banks. The expected fair value of loans and advances represents the discounted value of future cash flows expected to be collected. The cash flows are discounted using the current market interest rate to determine the fair value.
Loans and advances to customersLoans and advances are recognised net of the provision for impairment losses. The expected fair value of loans and advances represents the discounted value of future cash flows expected to be collected. The cash flows are discounted using the current market interest rate to determine the fair value.
Investments in securitiesInvestments in securities shown in the above table include only held-to-maturity, interest-bearing assets. Available-for-sale assets are evaluated at fair value except for equity instruments which the Bank has been unable to reliably estimate their fair value. Fair value of held-to-maturity financial assets is determined based on market prices or brokers prices. Fair value is estimated using quoted market prices for securities with similar credit, maturity date, and rates characteristics where information is not available.
Due to other banks and customersThe estimated fair value of deposits of indefinite maturity, which includes interest-free deposits, is the amount that will be paid on call.The fair value of fixed interest-bearing deposits and other loans not traded in an active market is determined based on discounted cash flows using interest rates for new debts of similar maturity dates.
Debt instruments in issue The aggregate fair value is calculated based on quoted market prices. For those notes whose quoted market prices are not available, a discounted cash flow model is used based on a current yield curve appropriate for the remaining term to maturity.
3.3.5. Capital managementThe Bank’s objectives behind managing capital include elements in addition to the equity shown in the balance sheet are represented in the following: - To comply with the capital requirements set by Arab Republic of Egypt and countries in which Bank branches operate. - Protecting the Bank’s ability to continue as a going concern and enabling it to generate return for shareholders and other parties dealing with the Bank.- Maintaining a strong capital base to enhance business growth. - Capital adequacy and uses are reviewed according to the regulatory authority’s requirements (CBE) by the Bank’s management through models based on the instructions of Basel committee for banking supervision. The required data is submitted to CBE on a quarterly basis. CBE requires the following from the Bank: - Maintaining EGP 500 million as a minimum requirement for the issued and paid-up capital.- Maintaining a ratio between the capital’s elements and the assets and contingent liabilities elements weighted by risk weights at 10 % or more.The Bank’s branches which operate outside the Arab Republic of Egypt are subject to the banking business regulators’ supervising rules in countries which they operate.
70 71

043.3.5 Capital managementAccording to Basel II requirements, the nominator of capital adequacy is composed on the following two tiers:
Tier 1 : A. The basic going concern capital which consists of the following:Issued and paid up capital, the legal reserve, formal reserve, capital reserve, and retained earnings (carried forward losses) excluding the following: - Treasury shares.- Goodwill.- Bank’s investment in financial institutions (Banks and Companies) and insurance companies (more than 10 % of the issued capital of the company).- The increase of the bank’s investment in which each single investment is less than 10 % of company’s issued capital than 10 % of basic going concern capital after regulatory adjustments( basic capital before excluding investments in financial intuitions and insurance companies). The following elements are not considered:- Fair value reserve balance of financial investments available for sale (if negative).- Foreign currency translation difference reserve (if negative).Where the above mentioned items deducted from basic capital if the balance is negative, while its negligible if positive.B. Additional basic capital which consists of the following: Permanent preferred non-cumulative shares, quarterly interim gains (losses), minority interest and the difference between the nominal value and the present value of the subordinated loan /deposit.Interim profits is recognized only after being approved by the auditor and the approval of General Assembly of dividends, and the approval of the Central Bank, the interim losses is deducted unconditionally.
Tier 2:The subordinate capital which consists of the following:
- 45% of the increase in the fair value and carrying amount for financial investments (fair value reserve if positive, held-to-maturity investments, investments in subsidiaries and associates).- 45% of the special reserve.- 45% of the positive foreign currency translation differences reserve. - Hybrid financial instruments.- Subordinated loans (deposits).
3. Financial risk management (continued)3.3 Liquidity risk (continued)3.3.5 Capital management (continued)- Provision for impairment losses for loans, facilities, and regular contingent liabilities (not exceeding 1.25% of total credit risks of assets and regular contingent liabilities applying the risk weights. The provision for impairment losses for loans, credit facilities, and irregular contingent liabilities should be adequate to meet all liabilities for which the provision was formed).
Deducted 50% of Tier 1 and 50% of Tier 2: - Investments in non-financial companies - each company alone, which amount to 15% or more of basic going concern capital of the bank before regulatory amendments. - The total value of the bank’s investments in non-financial companies - each company alone less than 15% more of the basic going concern capital before regulatory amendments provided that these investments combined exceed 60% of the basic capital by regulatory amendments.- Securitization portfolios. Regarding the value of the assets that reverted to the bank as a debt settlement in the general banking risk reserve. When calculating the total numerator of capital adequacy standard, it should be cautioned that subordinated loans/ deposits should not be greater than 50 % of basic capital after eliminations. Assets and contingent liabilities are weighted by credit risk, market risk and operational risk.
FINANCIALS
Assets and contingent liabilities are weighted by credit risk, market risk and operational risk.
31 December 2017 31 December 2016
Paid up capital (000 EGP) Tier 1 (Basic capital)
Share capital 2,152,447 2,152,447
Legal reserve 195,972 101,810
Other reserves 648 585
Retained earnings and Interim earnings 2,707,729 412,105
Total disposals from basic capital (352,442) (331,295)
Total basic capital after disposals 4,704,354 2,335,652
December 2017 31 December 2016 31
Tier 2 after disposals (Subordinate capital)
Provisions of impairment losses of performing loans and advances, and contingent liabilities
419,996 327,800
45% of the fair value reserve of available for sale financial investments
433 1,751
45% of the increase of fair value over the carrying amount of held to maturity financial investments
4,646 2,937
Subordinated loans (deposits). 1,063,662 1,095,990
Total subordinated capital 1,488,737 1,428,478
Total capital 6,193,091 3,764,130
Total credit risk 33,602,277 34,139,018
Total market risk – 122,485
Total operating risk 3,658,143 2,997,695
Total risk weighted assets and contingent liabilities in order to cover credit, market and operational risks
37,260,420 37,259,198
Capital adequacy ratio 16.621% 10.103%
3.3.6. Leverage ratioThe Central Bank of Egypt Board of Directors had approved in its meeting held on 7 July 2015 special supervisory instructions related to leverage ratio of maintaining a minimum level of leverage ratio of (3%) to be reported on a quarterly basis as follows:- As a guidance ratio starting from the end of September 2015 until 2017.- As an obligatory ratio starting from the year 2018. This ratio will be included in Basel requirement Tier 1 in order to maintain the effectiveness of the Egyptian Banking system, as well as keep up with the best international regulatory practices. The financial leverage reflects the relationship between tier 1 of capital that is used in capital adequacy standard (after disposals) and the Bank’s assets (on and off balance sheet) that are not risk weighted assets.
Ratio elements- The numerator elements:The numerator consists of the tier 1 for capital that is used in capital adequacy ratio (after exclusions) in accordance with the requirements of the Central Bank of Egypt. - The denominator elements:The denominator consists of all the Bank’s assets (on and off-balance sheet items) according to the financial statements, called “Bank Exposures” including the following totals: 1. On Balance Sheet exposure items after deducting Tier 1 exclusions for capital base .2. Derivatives contracts exposures.3. Exposures resulting from financing securities.4. Off-balance sheet exposures “weighted exchange transactions”.
72 73

04The table below summarises the financial leverage ratio at 31 December 2017:Financial leverage ratio
31 December 2017 31 December 2016
First: Tier I Capital after disposals 4,704,354 2,335,652
Second: Total exposures on & off-balance sheet items
Cash and balance with the Central Bank of Egypt (Reserve and other balances)
6,522,754 1,774,981
Current accounts and deposits at banks 3,158,238 11,286,606
Loans and advances to banks – 146,132
Treasury bills 6,942,800 2,131,600
Financial investments available-for-sale 1,026,107 785,770
Held-to-maturity investments 7,114,565 7,039,421
Loans and credit facilities 30,305,963 30,773,762
Impairment losses of loans and non-performing facilities (341,228) (325,958)
Fixed assets ( net) 691,503 627,811
Other assets 1,756,196 1,559,248
The amount of deducted exposures (some exclusions of tier 1 of capital base)
(217,232) (36,997)
Total exposures of on-balance sheet items after deducting Tier 1 exclusions
56,959,666 55,762,376
Exposures resulting from derivatives contracts
Replacement cost 1,296 433
Expected future value 433,270 126,578
Total exposures resulting from derivatives contracts 434,566 127,011
Total exposures of on- balance sheet items , financial derivatives transactions and financing securities (1)
57,394,232 55,889,387
Total contingent liabilities
Letters of credit - import 47,846 54,791
Letters of credit - export 238
Letters of guarantee 2,006,860 1,703,321
Letters of guarantee demanded by non-resident banks 222,877 67,202
Accepted bills 231,460 113,754
Total contingent liabilities 2,509,281 1,939,068
Capital Commitments 34,718 253,598
Commitments for loans and advances to banks/ customers (unused portion) with original maturity period
Irrevocable - more than one year 275,125 132,764
Irrevocable - one year or less –
Revocable without conditions at any time by the bank and without advanced note or includes cancellation terms
1,470,137 1,067,096
Total commitments 1,779,980 1,453,458
Total off-balance sheet exposures (2) 4,289,262 3,392,526
Total exposures on & off-balance sheet items (1)+(2) 61,683,494 59,281,913
Leverage ratio 7.63% 3.94%
FINANCIALS
4. Critical accounting estimates and assumptionsThe Bank makes estimates and assumptions that affect the reported amounts of assets and liabilities disclosed in the next financial period. Estimations and assumptions are continually evaluated on the basis of historical experience and other factors, including the expectations of future events that are believed to be reasonable through the available information and circumstances.
4.1. Impairment losses for loans and advancesThe bank reviews its loan portfolios to assess impairment at least on a quarterly basis. The Bank shall use the mechanisms assigned to it and determined by the system of work in determining whether an impairment loss should be recorded in the statement of income, the bank makes judgements as to whether there is any observable data indicating an impairment trigger followed by measurable decrease in the estimated future cash flows from a portfolio of loans before the decrease can be identified with that portfolio. This evidence may include observable data indicating that there has been an adverse change in the payment status of borrowers’ portfolio, or national or local economic conditions that correlate with defaults on assets in the Bank. Management uses estimates based on historical loss experience for assets with credit risk characteristics and objective evidence of impairment similar to those in the portfolio when scheduling its future cash flows. The method and assumptions used to estimate the amount and the timing of future cash flows are reviewed on a regular basis in order to reduce any difference between the expected and the actual loss based on experience, if the variance of the net current value of the expected cash flows reaches +/-5%, the impairment losses provision will be higher by 3,422,103 or lower by EGP (3,422,103) than the formed provision
4.2. Impairment of available-for-sale equity investmentsThe Bank recognises the impairment of investments in available-for-sale equity instruments when there is a significant or prolonged decline in the fair value below its cost. A judgement is required to determine that the decline is significant or prolonged. In making this judgement, the Bank evaluates the regular volatility in share price, among other factors. In addition, impairment may occur when there is evidence of deterioration in the investee’s financial position or operating/finance cash flow, industry or sector performance, or changes in technology.
4.3. Held-to-maturity investmentsNon-derivative financial assets with fixed or determinable payments and fixed maturity are classified as held-to-maturity investments which requires a high degree of judgement. In order to make this decision, the Bank evaluates the intention and ability to hold such investments to maturity. If the Bank fails to hold such investments until maturity except for certain circumstances such as selling an insignificant amount of held-to-maturity investments near to maturity date, then all held-to-maturity investments should be reclassified as available-for-sale, which will be measured at fair value instead of amortised cost. In addition, the Bank should suspend classifying any investments under that item. If using the classification of held-to-maturity investments is
suspended, the carrying amount shall increase or decrease to reach its fair value by recording an amount in the fair value reserve under equity.
4.4. Income taxesThe Bank is subject to income tax which requires the use of significant estimates to calculate the total income tax provision. There are a number of processes and calculations of which the final income tax would be hard to determine accurately. The Bank records liabilities related to the tax inspection estimated results based on the estimates that additional taxes may arise. When there is a difference between the final result of the tax and the amounts previously recorded by the Bank, such differences will affect the income tax and the deferred tax provision in the period the difference was determined.
5. Segment analysisActivity segment analysisSegment activity involves operating activities; assets used in providing banking services, and risk and return management associated with this activity, which might differ from other activities. Segment analysis for the banking operations involves the following: Large, medium, and small enterprisesIncludes activities of current accounts, deposits, overdrafts, loans, credit facilities, and financial derivatives.InvestmentIncludes activities of merging companies, purchase of investments, financing companies’ restructuring, and financial instruments.IndividualsIncludes activities of current accounts, saving accounts, deposits, credit cards, personal loans, and mortgage loans.Other activitiesIncludes other banking operations, such as fund management.Transactions among segments are performed according to the Bank’s operating cycle, and include assets and operating liabilities as presented in the Bank’s balance sheet.
74 75

045.Segment analysis31 December 2017:Revenues and expenses by business segment
TotalRetailInvestment Medium
and smallcorporates
Large financialinstitutions
7,372,730,9981,663,417,2041,856,400,464453,114,9403,399,798,390 Income of segmental activities
(6,046,682,536)(1,436,985,474)(1,487,888,860)(359,304,426)(2,762,503,776) Expenses of segmental activities
1,326,048,462226,431,730368,511,60493,810,514637,294,614 Results of businesssegments
(305,107,776)(50,947,139)(89,724,983)(21,107,366)(143,391,288)Taxation
1,020,877,686175,484,591278,786,62172,703,148493,903,326Profit for the year
Assets and liabilities according to segmental activities
55,971,015,9205,438,994,49226,574,728,3383,297,760,67120,659,532,419 Assets of segmentalactivities
Other items of segmental activities
(83,747,399)(16,942,342)(38,772,566)(5,029,367)(23,003,124)Depreciation
(10,005,798)–––(10,005,798)
Impairment and effect of other provisions on thestatement of income
31 December 2016:Revenues and expenses by business segment
TotalRetailInvestment Medium and
small corporates Large financial
institutions
6,339,169,0671,306,858,9682,723,723,124100,298,3222,208,288,653 Income of segmentalactivities
(3,843,033,279)(1,023,589,750)(864,930,293)(27,105,852)(1,927,407,384) Expenses of segmentalactivities
2,496,135,788283,269,2181,858,792,83173,192,470280,881,269Results of business segments
(612,817,671)(70,817,304)(453,481,931)(18,298,117)(70,220,319)Taxation
1,883,318,117212,451,9141,405,310,90054,894,353210,660,950Profit for the year
Assets and liabilities according to segmental activities
55,193,512,3774,934,433,06725,207,855,9561,371,096,42823,680,126,926Assets of segmental activ-ities
Other items of segmentalactivities
(61,755,457)(13,290,043)(30,862,182)(2,669,950)(14,933,282)Depreciation
(446,493)– – – (446,493) Impairment and effect of other provisions on thestatement of income
FINANCIALS
31 D
ecem
ber
2017
:R
even
ues
and
expe
nses
by
geog
raph
ical
seg
men
ts
Egyp
tL.
E.
Cair
oA
lexa
ndri
a,
Del
ta a
nd S
inai
Tota
lA
rab
Gul
f Co
untr
ies
Oth
er
coun
trie
sTo
tal
Rev
enue
of g
eogr
aphi
cal s
egm
ents
6,72
9,41
7,62
556
5,56
0,68
17,
294,
978,
306
10,7
91,4
5066
,315
,536
7,37
2,08
5,29
2
Expe
nses
of g
eogr
aphi
cal s
egm
ents
(5,1
39,2
84,9
05)
(675
,268
,511
)(5
,814
,553
,416
)(1
38,6
97)
(80,
286,
124)
(5,8
94,9
78,2
37)
Res
ults
of b
usin
ess
segm
ents
1,59
0,13
2,72
0(1
09,7
07,8
30)
1,32
4,93
5,62
510
,652
,753
(13,
970,
588)
1,4
77,1
07,0
55
Unc
lass
ified
exp
ense
s–
–
–
–
–
(1
51,0
58,5
93)
Pro
fit b
efor
e ta
x fo
r th
e ye
ar–
–
–
–
–
1,
326,
048,
462
Taxa
tion
–
–
–
–
–
(305
,170
,776
)
Pro
fit f
or th
e ye
ar–
–
–
–
–
1,
020,
877,
686
Ass
ets
and
liabi
litie
s by
geo
grap
hica
l seg
men
ts
Ass
ets
of g
eogr
aphi
cal s
egm
ents
49,0
51,4
53,9
043,
502,
892,
565
52,5
54,3
46,4
691,
261,
810,
540
2,30
4,94
2,75
956
,121
,099
,768
Unc
lass
ified
ass
ets
–
–
–
–
–
(150
,083
,848
)
Tota
l ass
ets
49,0
51,4
53,9
043,
502,
892,
565
52,5
54,3
46,4
691,
261,
810,
540
2,30
4,94
2,75
955
,971
,015
,920
Liab
ilitie
s of
geo
grap
hica
l seg
men
ts43
,331
,870
,816
5,69
2,68
0,86
949
,024
,551
,685
10,1
62,6
481,
329,
018,
578
50,3
63,7
32,9
11
Unc
lass
ified
liab
ilitie
s44
,166
,720
Tota
l Lia
bilit
ies
43,3
31,8
70,8
165,
692,
680,
869
49,0
24,5
51,6
8510
,162
,648
1,32
9,01
8,57
850
,407
,899
,631
Oth
er it
ems
of g
eogr
aphi
cal s
egm
ents
Dep
reci
atio
ns(7
5,98
3,40
7)(7
,763
,992
)(8
3,74
7,39
9)–
–
(8
3,74
7,39
9)
Impa
irm
ent a
nd e
ffec
t of o
ther
pro
visi
ons
on
the
stat
emen
t of i
ncom
e(4
4,79
2,22
1)–
(4
4,79
2,22
1)–
–
(4
4,79
2,22
1)
76 77

0431
Dec
embe
r 20
16:
Rev
enue
s an
d ex
pens
es b
y ge
ogra
phic
al s
egm
ents
Egyp
tL.
E.
Cair
oA
lexa
ndri
a,
Del
ta a
nd S
inai
Tota
lA
rab
Gul
f Co
untr
ies
Oth
er c
ount
ries
Tota
l
Rev
enue
of g
eogr
aphi
cal s
egm
ents
5,80
0,40
2,80
836
9,84
0,41
26,
170,
243,
220
41,8
26,2
0411
4,51
9,83
86,
326,
589,
262
Expe
nses
of g
eogr
aphi
cal s
ecto
rs(3
,192
,363
,716
)(4
26,5
35,1
95)
(3,6
18,8
98,9
11)
(211
,886
)(6
3,68
2,00
4)(3
,682
,792
,801
)
Res
ults
of b
usin
ess
segm
ents
2,60
8,03
9,09
2(5
6,69
4,78
3)2,
551,
344,
309
41,6
14,3
1850
,837
,834
2,64
3,79
6,46
1
Unc
lass
ified
exp
ence
s–
–
–
–
–
(1
47,6
60,6
73)
Pro
fit b
efor
e ta
x fo
r th
e ye
ar–
–
–
–
–
2,
496,
135,
788
Taxa
tion
–
–
–
–
–
(612
,817
,671
)
Pro
fit f
or th
e ye
ar–
–
–
–
–
1,
883,
318,
117
31 D
ecem
ber
2016
Ass
ets
and
liabi
litie
s by
geo
grap
hica
l seg
men
ts
Ass
ets
of g
eogr
aphi
cal s
ecto
rs46
,792
,217
,245
3,58
3,75
1,93
950
,375
,969
,184
2,22
6,84
0,98
52,
891,
578,
418
55,4
94,3
88,5
87
Unc
lass
ified
ass
ets
–
–
–
–
–
(300
,876
,209
)
Tota
l ass
ets
46,7
92,2
17,2
453,
583,
751,
939
50,3
75,9
69,1
842,
226,
840,
985
2,89
1,57
8,41
855
,193
,512
,378
Liab
ilitie
s of
geo
grap
hica
l seg
men
ts40
,964
,138
,443
5,68
0,46
1,48
246
,641
,693
,713
10,6
83,7
023,
862,
752,
096
50,5
15,1
29,5
11
Unc
lass
ified
liab
ilitie
s–
–
–
–
–
29
,829
,911
Tota
l Lia
bilit
ies
40,9
64,1
38,4
435,
680,
461,
482
46,6
41,6
93,7
1310
,683
,702
3,86
2,75
2,09
650
,544
,959
,422
Oth
er it
ems
of g
eogr
aphi
cal s
eg-
men
ts
Dep
reci
atio
ns(5
5,66
6,19
2)(6
,089
,264
)(6
1,75
5,45
6)–
–
(6
1,75
5,45
6)
Impa
irm
ent a
nd e
ffec
t of o
ther
pro
- v
isio
ns o
n th
e st
atem
ent o
f inc
ome
(108
,348
,399
)(4
3,36
6,86
2)(1
51,7
15,2
61)
–
–
(151
,715
,261
)
FINANCIALS
6. Net interest income
Interest income on loans and similar income : 2017 2016
Loans and advances:
- To banks 5,495,603 5,329,112
- To customers 4,483,419,640 2,809,370,376
4,488,915,243 2,814,699,488
Treasury bills 1,497,078,676 1,261,883,665
Deposits and current accounts with bank 827,077,769 228,152,359
Investments in debt instruments held to maturity and available for sale 23,402,928 13,628,758
Assumed financial instruments and purchases of financial instruments with a commitment of resale
4,392,299 –
Others 1,069,891 248,162
Total 6,841,936,806 4,318,612,432
Deposits’ cost and similar costs: 2017 2016
Deposits and current accounts:
- To banks (101,905,076) (1,050,071)
- To customers (4,756,351,878) (2,763,700,294)
(4,858,256,954) (2,764,750,365)
Other loans (80,280,578) (62,639,622)
Others – –
Total (4,938,537,532) (2,827,389,987)
Net 1,903,399,274 1,491,222,445
7. Net fees and commission income
Fees and commission income 2017 2016
Fees and commissions related to credit 359,774,581 252,281,748
Fees related to corporate financing services 21,853,823 22,814,370
Custody fees 8,212,613 5,672,759
Other fees 122,497,286 176,795,145
Total 512,338,303 457,564,022
Fees and commission expenses
Brokerage fees paid (1,768,551) (1,011,003)
Other fees paid (28,216,355) (24,755,669)
Total (29,984,906) (25,766,672)
Net income from fees and commissions 482,353,397 431,797,350
78 79
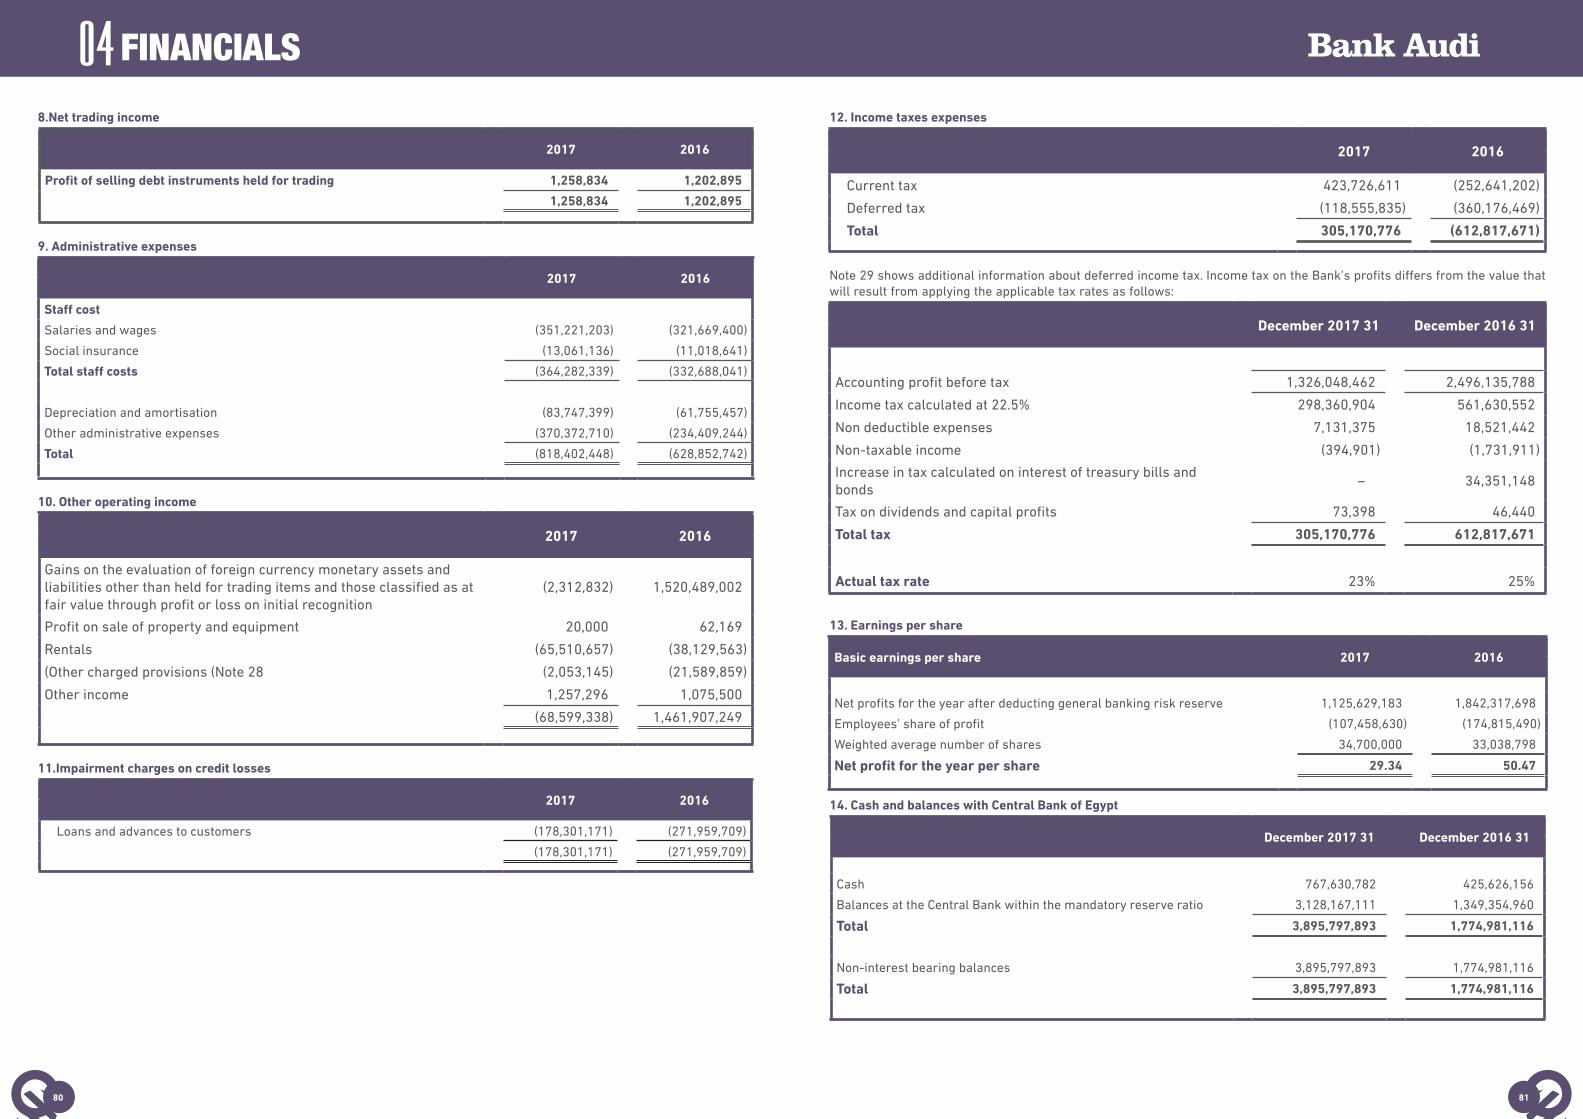
048.Net trading income
2017 2016
Profit of selling debt instruments held for trading 1,258,834 1,202,895
1,258,834 1,202,895
9. Administrative expenses
2017 2016
Staff cost
Salaries and wages (351,221,203) (321,669,400)
Social insurance (13,061,136) (11,018,641)
Total staff costs (364,282,339) (332,688,041)
Depreciation and amortisation (83,747,399) (61,755,457)
Other administrative expenses (370,372,710) (234,409,244)
Total (818,402,448) (628,852,742)
10. Other operating income
2017 2016
Gains on the evaluation of foreign currency monetary assets and liabilities other than held for trading items and those classified as at fair value through profit or loss on initial recognition
(2,312,832) 1,520,489,002
Profit on sale of property and equipment 20,000 62,169
Rentals (65,510,657) (38,129,563)
(Other charged provisions (Note 28 (2,053,145) (21,589,859)
Other income 1,257,296 1,075,500
(68,599,338) 1,461,907,249
11.Impairment charges on credit losses
2017 2016
Loans and advances to customers (178,301,171) (271,959,709)
(178,301,171) (271,959,709)
FINANCIALS
12. Income taxes expenses
2017 2016
Current tax 423,726,611 (252,641,202)
Deferred tax (118,555,835) (360,176,469)
Total 305,170,776 (612,817,671)
Note 29 shows additional information about deferred income tax. Income tax on the Bank’s profits differs from the value that will result from applying the applicable tax rates as follows:
December 2017 31 December 2016 31
Accounting profit before tax 1,326,048,462 2,496,135,788
Income tax calculated at 22.5% 298,360,904 561,630,552
Non deductible expenses 7,131,375 18,521,442
Non-taxable income (394,901) (1,731,911)
Increase in tax calculated on interest of treasury bills andbonds
– 34,351,148
Tax on dividends and capital profits 73,398 46,440
Total tax 305,170,776 612,817,671
Actual tax rate 23% 25%
13. Earnings per share
Basic earnings per share 2017 2016
Net profits for the year after deducting general banking risk reserve 1,125,629,183 1,842,317,698
Employees’ share of profit (107,458,630) (174,815,490)
Weighted average number of shares 34,700,000 33,038,798
Net profit for the year per share 29.34 50.47
14. Cash and balances with Central Bank of Egypt
December 2017 31 December 2016 31
Cash 767,630,782 425,626,156
Balances at the Central Bank within the mandatory reserve ratio 3,128,167,111 1,349,354,960
Total 3,895,797,893 1,774,981,116
Non-interest bearing balances 3,895,797,893 1,774,981,116
Total 3,895,797,893 1,774,981,116
80 81

0415. Due from banks
December 2017 31 December 2016 31
Current accounts 353,344,099 367,435,143
Deposits 5,431,850,663 10,919,170,742
Total 5,785,194,762 11,286,605,885
Balances at the Central Bank other than those undermandatory reserve ratio 2,626,956,513 8,141,213,294
Local banks 643,286,977 273,664,452
Foreign banks 2,514,951,272 2,871,728,139
Total 5,785,194,762 11,286,605,885
Non-interest bearing balances 353,344,099 367,435,143
Fixed interest balances 5,431,850,663 10,919,170,742
Total 5,785,194,762 11,286,605,885
Current balances 4,614,510,638 10,069,545,523
Non-current assets 1,170,684,124 1,217,060,362
Total 5,785,194,762 11,286,605,885
16. Treasury bills and other government securities
December 2017 31 December 2016 31
Treasury bills (net) 6,305,364,876 1,987,886,919
Treasury bills represent:
December 2017 31 December 2016 31
Treasury bills 91 days maturity 300,000 –
Treasury bills 182 days maturity 827,625,000 21,450,000
Treasury bills 273 days maturity 2,977,225,000 1,400,150,000
Treasury bills 364 days maturity 3,137,650,000 710,000,000
Less: Unearned interest (637,435,124) (143,713,081)
Treasury bills 6,305,364,876 1,987,886,919
FINANCIALS
17. Loans and advances to banks
December 2017 31 December 2016 31
Term loans – 146,132,000
Non-current assets – 146,132,000
Current balances – –
– 146,132,000
Loans to banks at 31 December 2016 amounted to USD 8 million for the value of purchased certificates of Bank Audi S.A.L against a subordinated loan granted to ODEA Bank - Turkey, affiliated to the Group. The certificates mature in October 2024 with annual interest rate of 6.5% payable quarterly.
During 2017 the bank settled the amount due on the loan.
18. Loans and advances to customers
Retail: December 2017 31 December 2016 31
Overdrafts 612,566,500 470,473,044
Credit cards 591,597,313 520,143,956
Personal loans 4,046,217,140 3,775,934,500
Real estate loans 232,238,908 210,006,023
Total 5,482,619,861 4,976,557,523
Corporates, including small loans for economic activities:
Overdrafts 11,934,572,515 11,688,320,470
Direct loans 5,780,057,945 5,049,418,921
Syndicated loans 6,325,176,336 8,063,387,689
Other loans 639,798,440 834,805,560
Total 24,679,605,236 25,635,932,640
Total loans and advances to customers 30,162,225,097 30,612,490,163
Less:
Provision for impairment losses (765,937,513) (626,833,742)
Net balance, distributed as follows: 29,396,287,584 29,985,656,421
Current balances 17,666,008,973 19,129,636,016
Non-current balances 11,730,278,611 10,856,020,405
29,396,287,584 29,985,656,421
During the financial period ended 31 December 2017, the Bank has accepted quoted securities with a fair value amounting to EGP 3,432,558,289 against EGP 2,836,408,846 at the date of the comparison as a commercial loan guarantee.
82 83
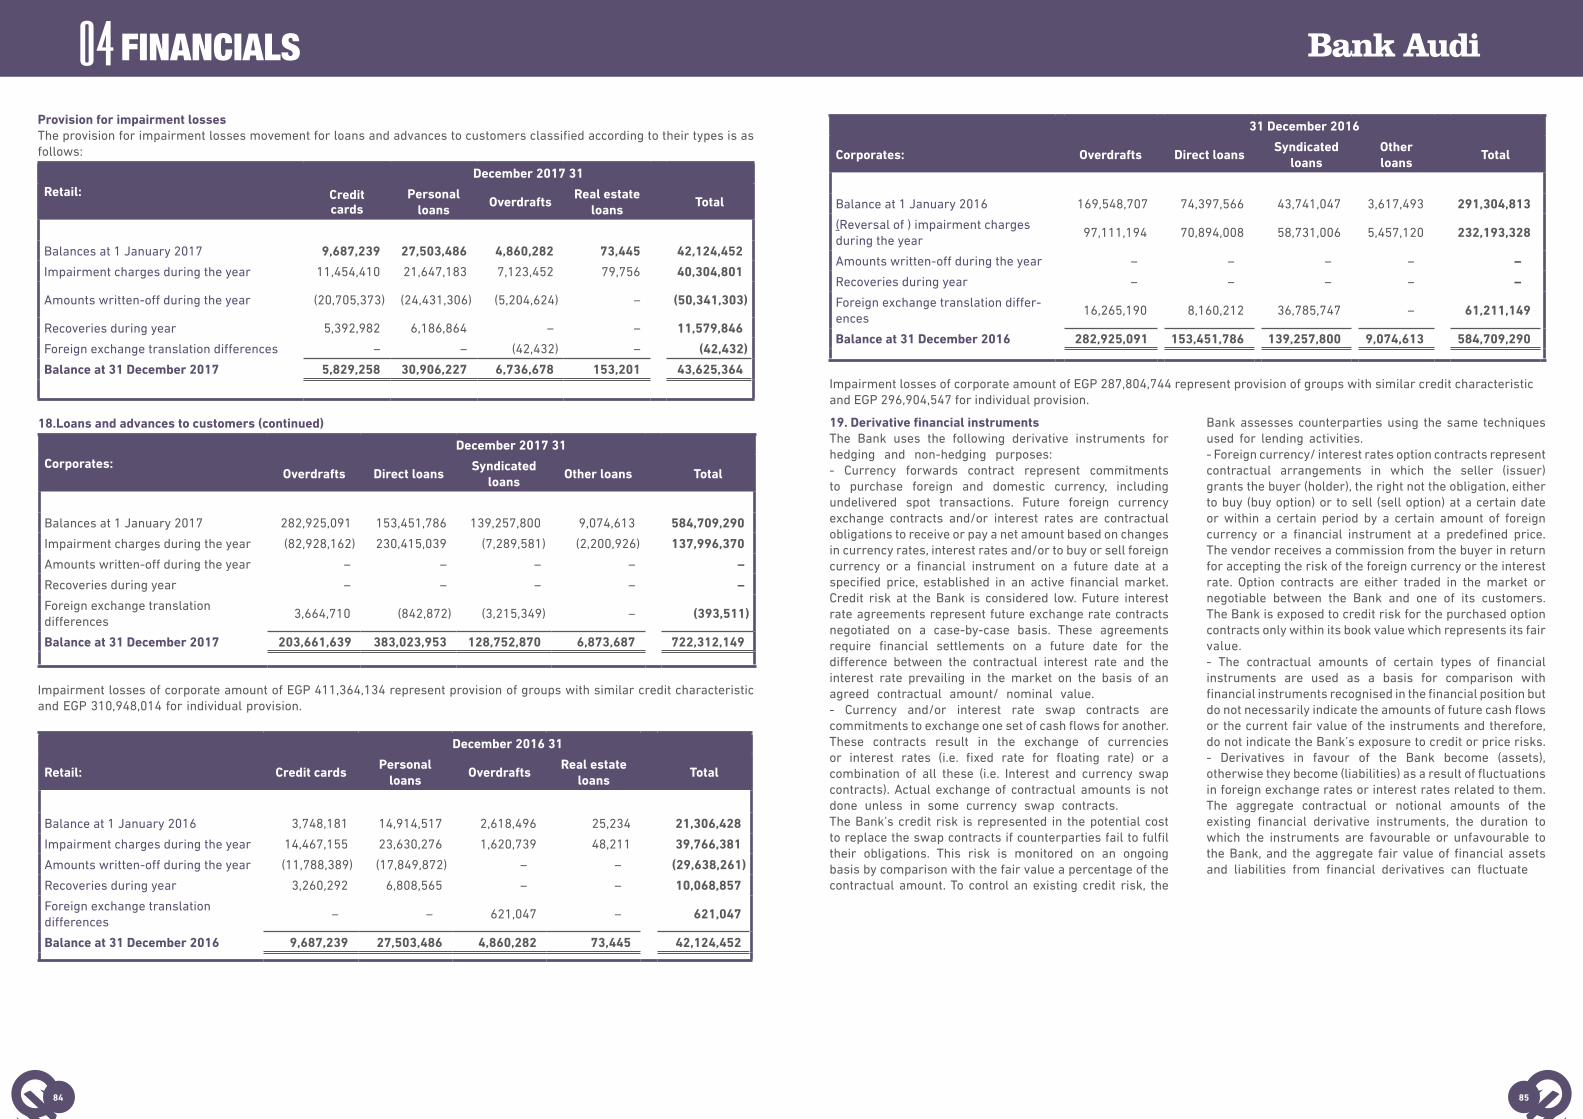
04Provision for impairment lossesThe provision for impairment losses movement for loans and advances to customers classified according to their types is as follows:
Retail:December 2017 31
Creditcards
Personalloans
Overdrafts Real estate
loansTotal
Balances at 1 January 2017 9,687,239 27,503,486 4,860,282 73,445 42,124,452
Impairment charges during the year 11,454,410 21,647,183 7,123,452 79,756 40,304,801
Amounts written-off during the year (20,705,373) (24,431,306) (5,204,624) – (50,341,303)
Recoveries during year 5,392,982 6,186,864 – – 11,579,846
Foreign exchange translation differences – – (42,432) – (42,432)
Balance at 31 December 2017 5,829,258 30,906,227 6,736,678 153,201 43,625,364
18.Loans and advances to customers (continued)
Corporates: December 2017 31
Overdrafts Direct loans Syndicated
loansOther loans Total
Balances at 1 January 2017 282,925,091 153,451,786 139,257,800 9,074,613 584,709,290
Impairment charges during the year (82,928,162) 230,415,039 (7,289,581) (2,200,926) 137,996,370
Amounts written-off during the year – – – – –
Recoveries during year – – – – –
Foreign exchange translation differences
3,664,710 (842,872) (3,215,349) – (393,511)
Balance at 31 December 2017 203,661,639 383,023,953 128,752,870 6,873,687 722,312,149
Impairment losses of corporate amount of EGP 411,364,134 represent provision of groups with similar credit characteristic and EGP 310,948,014 for individual provision.
December 2016 31
Retail: Credit cards Personal
loansOverdrafts
Real estateloans
Total
Balance at 1 January 2016 3,748,181 14,914,517 2,618,496 25,234 21,306,428
Impairment charges during the year 14,467,155 23,630,276 1,620,739 48,211 39,766,381
Amounts written-off during the year (11,788,389) (17,849,872) – – (29,638,261)
Recoveries during year 3,260,292 6,808,565 – – 10,068,857
Foreign exchange translation differences
– – 621,047 – 621,047
Balance at 31 December 2016 9,687,239 27,503,486 4,860,282 73,445 42,124,452
FINANCIALS
31 December 2016
Corporates: Overdrafts Direct loans Syndicated
loans Otherloans
Total
Balance at 1 January 2016 169,548,707 74,397,566 43,741,047 3,617,493 291,304,813
(Reversal of ) impairment charges during the year
97,111,194 70,894,008 58,731,006 5,457,120 232,193,328
Amounts written-off during the year – – – – –
Recoveries during year – – – – –
Foreign exchange translation differ-ences
16,265,190 8,160,212 36,785,747 – 61,211,149
Balance at 31 December 2016 282,925,091 153,451,786 139,257,800 9,074,613 584,709,290
Impairment losses of corporate amount of EGP 287,804,744 represent provision of groups with similar credit characteristic and EGP 296,904,547 for individual provision.
19. Derivative financial instrumentsThe Bank uses the following derivative instruments for hedging and non-hedging purposes:- Currency forwards contract represent commitments to purchase foreign and domestic currency, including undelivered spot transactions. Future foreign currency exchange contracts and/or interest rates are contractual obligations to receive or pay a net amount based on changes in currency rates, interest rates and/or to buy or sell foreign currency or a financial instrument on a future date at a specified price, established in an active financial market. Credit risk at the Bank is considered low. Future interest rate agreements represent future exchange rate contracts negotiated on a case-by-case basis. These agreements require financial settlements on a future date for the difference between the contractual interest rate and the interest rate prevailing in the market on the basis of an agreed contractual amount/ nominal value. - Currency and/or interest rate swap contracts are commitments to exchange one set of cash flows for another. These contracts result in the exchange of currencies or interest rates (i.e. fixed rate for floating rate) or a combination of all these (i.e. Interest and currency swap contracts). Actual exchange of contractual amounts is not done unless in some currency swap contracts. The Bank’s credit risk is represented in the potential cost to replace the swap contracts if counterparties fail to fulfil their obligations. This risk is monitored on an ongoing basis by comparison with the fair value a percentage of the contractual amount. To control an existing credit risk, the
Bank assesses counterparties using the same techniques used for lending activities.- Foreign currency/ interest rates option contracts represent contractual arrangements in which the seller (issuer) grants the buyer (holder), the right not the obligation, either to buy (buy option) or to sell (sell option) at a certain date or within a certain period by a certain amount of foreign currency or a financial instrument at a predefined price. The vendor receives a commission from the buyer in return for accepting the risk of the foreign currency or the interest rate. Option contracts are either traded in the market or negotiable between the Bank and one of its customers. The Bank is exposed to credit risk for the purchased option contracts only within its book value which represents its fair value.- The contractual amounts of certain types of financial instruments are used as a basis for comparison with financial instruments recognised in the financial position but do not necessarily indicate the amounts of future cash flows or the current fair value of the instruments and therefore, do not indicate the Bank’s exposure to credit or price risks.- Derivatives in favour of the Bank become (assets), otherwise they become (liabilities) as a result of fluctuations in foreign exchange rates or interest rates related to them. The aggregate contractual or notional amounts of the existing financial derivative instruments, the duration to which the instruments are favourable or unfavourable to the Bank, and the aggregate fair value of financial assets and liabilities from financial derivatives can fluctuate
84 85
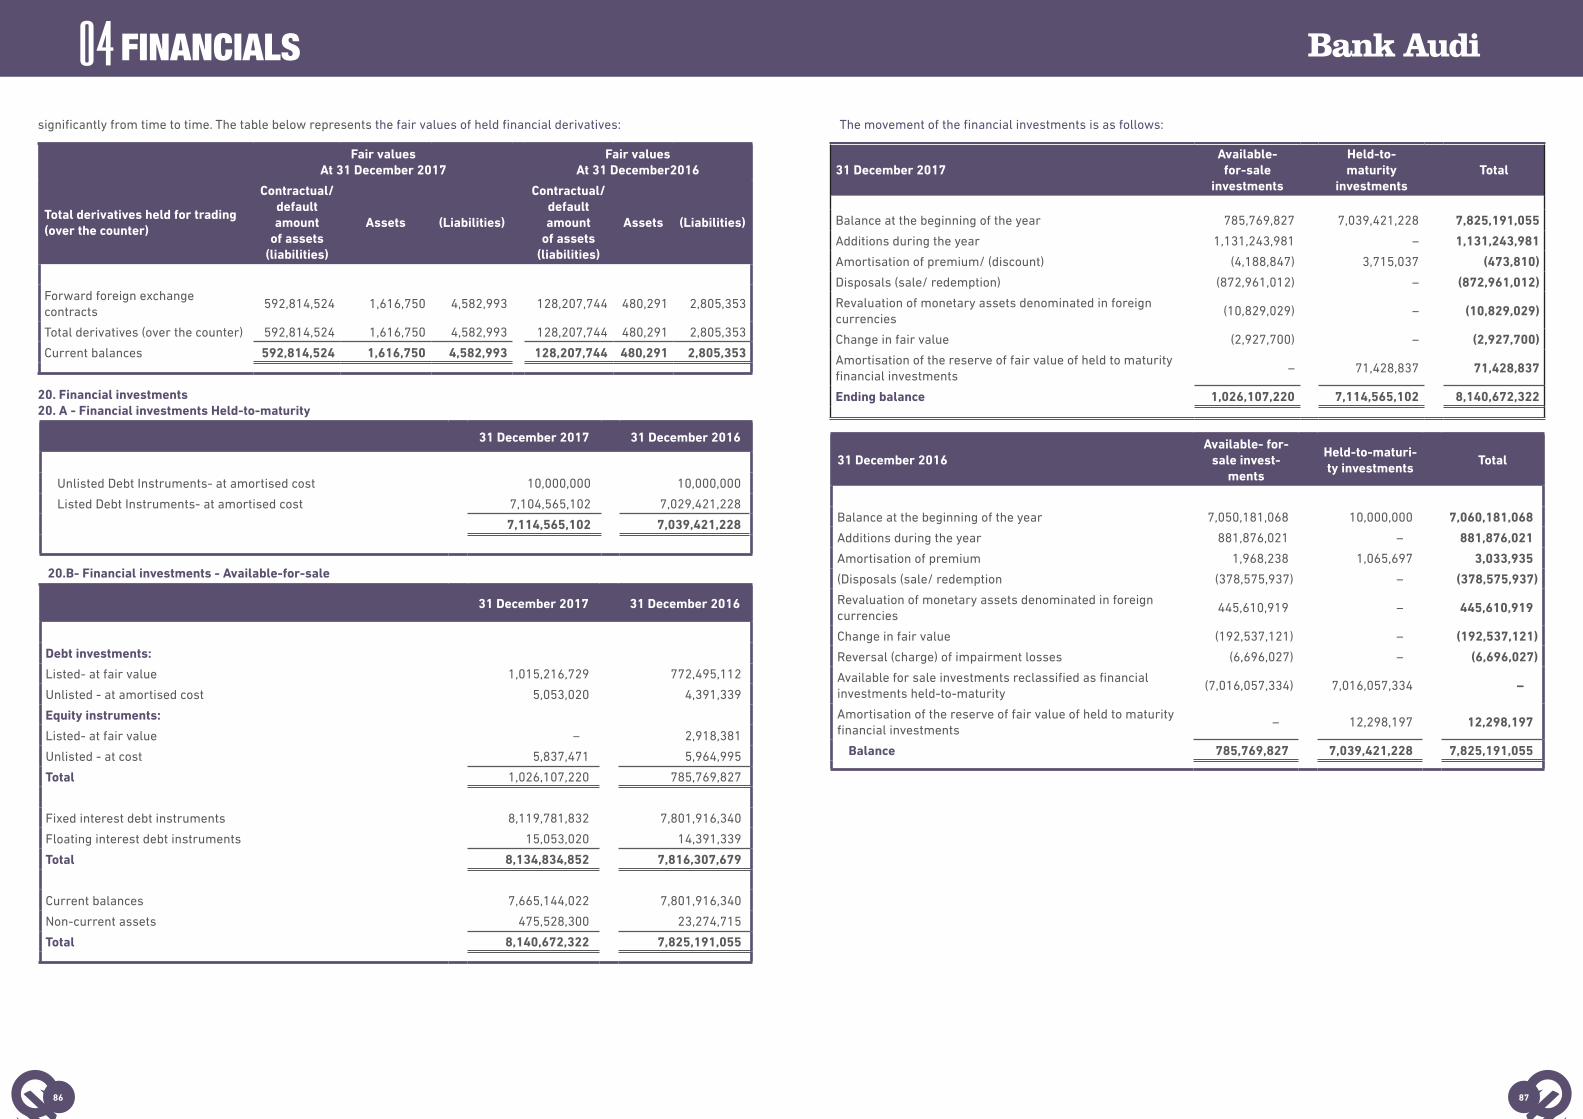
04
20. Financial investments20. A - Financial investments Held-to-maturity
31 December 2017 31 December 2016
Unlisted Debt Instruments- at amortised cost 10,000,000 10,000,000
Listed Debt Instruments- at amortised cost 7,104,565,102 7,029,421,228
7,114,565,102 7,039,421,228
FINANCIALS
significantly from time to time. The table below represents the fair values of held financial derivatives:
Fair valuesAt 31 December2016
Fair valuesAt 31 December 2017
(Liabilities)Assets
Contractual/ default amount
of assets (liabilities)
(Liabilities)Assets
Contractual/ default amount
of assets (liabilities)
Total derivatives held for trading (over the counter)
2,805,353480,291128,207,7444,582,9931,616,750592,814,524Forward foreign exchange contracts
2,805,353480,291128,207,7444,582,9931,616,750592,814,524Total derivatives (over the counter)
2,805,353480,291128,207,7444,582,9931,616,750592,814,524Current balances
20.B- Financial investments - Available-for-sale
31 December 2017 31 December 2016
Debt investments:
Listed- at fair value 1,015,216,729 772,495,112
Unlisted - at amortised cost 5,053,020 4,391,339
Equity instruments:
Listed- at fair value – 2,918,381
Unlisted - at cost 5,837,471 5,964,995
Total 1,026,107,220 785,769,827
Fixed interest debt instruments 8,119,781,832 7,801,916,340
Floating interest debt instruments 15,053,020 14,391,339
Total 8,134,834,852 7,816,307,679
Current balances 7,665,144,022 7,801,916,340
Non-current assets 475,528,300 23,274,715
Total 8,140,672,322 7,825,191,055
The movement of the financial investments is as follows:
31 December 2017Available-
for-sale investments
Held-to-maturity
investmentsTotal
Balance at the beginning of the year 785,769,827 7,039,421,228 7,825,191,055
Additions during the year 1,131,243,981 – 1,131,243,981
Amortisation of premium/ (discount) (4,188,847) 3,715,037 (473,810)
Disposals (sale/ redemption) (872,961,012) – (872,961,012)
Revaluation of monetary assets denominated in foreign currencies
(10,829,029) – (10,829,029)
Change in fair value (2,927,700) – (2,927,700)
Amortisation of the reserve of fair value of held to maturity financial investments
– 71,428,837 71,428,837
Ending balance 1,026,107,220 7,114,565,102 8,140,672,322
31 December 2016Available- for-
sale invest-ments
Held-to-maturi-ty investments
Total
Balance at the beginning of the year 7,050,181,068 10,000,000 7,060,181,068
Additions during the year 881,876,021 – 881,876,021
Amortisation of premium 1,968,238 1,065,697 3,033,935
(Disposals (sale/ redemption (378,575,937) – (378,575,937)
Revaluation of monetary assets denominated in foreigncurrencies
445,610,919 – 445,610,919
Change in fair value (192,537,121) – (192,537,121)
Reversal (charge) of impairment losses (6,696,027) – (6,696,027)
Available for sale investments reclassified as financialinvestments held-to-maturity
(7,016,057,334) 7,016,057,334 –
Amortisation of the reserve of fair value of held to maturityfinancial investments
– 12,298,197 12,298,197
Balance 785,769,827 7,039,421,228 7,825,191,055
86 87

042017 2016
Gain on financial investments
Gain (losses) on sale of available-for-sale financial investments (2,382,124) 19,522,166
Gain (loss) on sale of available for sale equity instruments 720,865 (2,930,618)
Gains on sale of treasury bills 5,234,287 447,274
Losses of impairment of available-for-sale equity investments – (6,696,027)
Total 3,573,028 10,342,795
21.Intangible assets
31 December 2017 31 December 2016
Computer software
Net book value at the beginning of the year 56,114,684 17,705,057
Additions 230,862,873 46,516,626
Amortisation (21,791,218) (8,106,999)
Net book value at the end of the year 265,186,339 56,114,684
FINANCIALS
22. Other assets
31 December 2017 31 December 2016
Accrued revenues 501,610,600 725,938,900
Prepaid expenses 42,726,021 36,577,284
Advance payments for purchase of fixed assets 702,114,912 650,427,592
Insurance and custody 4,738,308 9,654,593
Assets reverted to the Bank in settlement of debts 2,875,600 2,875,600
Others 235,327,021 77,179,146
Total 1,489,392,462 1,502,653,115
23. Fixed assets
Land and buildings
Leased assets’improvements
Machineries and
equipmentOther assets Total
Cost at 1 January 2016 377,263,777 38,762,206 48,969,205 257,278,284 722,273,472
Accumulated depreciation (40,890,911) (23,179,961) (29,292,984) (131,223,369) (224,587,225)
Net book value at 1 Jan 2016 336,372,866 15,582,245 19,676,221 126,054,915 497,686,247
Additions during the year 99,110,156 5,632,360 28,586,083 50,604,236 183,932,835
Disposal during the year – – (8,250) (492,583) (500,832)
Amortisation during the year (10,588,689) (4,222,755) (7,294,603) (31,542,411) (53,648,458)
Accumulated depreciation for thedisposals during the year – – 8,250 332,850 341,100
Net book value at 31 December2016 424,894,333 16,991,850 40,967,701 144,957,007 627,810,892
Cost at 1 January 2017 476,373,933 44,394,566 77,547,038 307,389,937 905,705,475
Accumulated depreciation (51,479,600) (27,402,716) (36,579,337) (162,432,930) (277,894,583)
Net book value at 1 Jan 2017 424,894,333 16,991,850 40,967,701 144,957,007 627,810,892
Additions during the year 43,377,969 723,545 5,556,272 76,045,436 125,703,221
Disposals during the year – – (440,000) – (440,000)
Adjustment – – – – –
Amortisation during the year (12,267,917) (4,521,275) (8,366,788) (36,800,201) (61,956,181)
Accumulated depreciation for thedisposals during the year – – 385,000 – 385,000
Net book value at 31 December2017 456,004,385 13,194,120 38,102,185 184,202,242 691,502,932
Cost at 31 December 2017 519,751,902 45,118,111 82,663,310 383,435,373 1,030,968,696
Accumulated depreciation (63,747,517) (31,923,991) (44,561,125) (199,233,131) (339,465,764)
Net book value as at 31December 2017 456,004,385 13,194,120 38,102,185 184,202,242 691,502,932
Fixed assets (after depreciation) include assets amounted to EGP 221,39 million at the balance sheet date as of 31 December 2017 (compared to EGP 183,02 million at 31 December 2016), which represents the assets that have not been registered in the Bank’s name yet. Legal procedures are currently being undertaken to register those assets.
88 89

0424 .Due to banks
31 December 2017 31 December 2016
Deposits 250,000,000 –
Current accounts 94,741,675 8,009,902
Total 344,741,675 8,009,902
Local banks 250,000,411 –
Foreign banks 94,741,264 8,009,902
Total 344,741,675 8,009,902
Fixed interest balances 250,000,000 –
Non-interest bearing balances 94,741,675 8,009,902
Total 344,741,675 8,009,902
Current balances 344,741,675 8,009,902
25. Customers’ deposits
31 December 2017 31 December 2016
Demand deposits 11,279,469,012 9,654,088,983
Time and call deposits 24,275,415,299 25,502,758,267
Certificates of saving and deposit 7,971,951,729 7,093,557,340
Saving Deposits 2,808,817,929 1,941,302,876
Other Deposits 1,037,732,960 1,346,504,299
Total 47,373,386,929 45,538,211,765
Corporate deposits 28,561,145,812 28,497,690,809
Retail deposits 18,812,241,117 17,040,520,956
Total 47,373,386,929 45,538,211,765
Non-interest bearing balances 4,263,155,704 4,612,622,627
Variable interest bearing balances 10,869,587,860 8,511,394,408
Fixed interest balances 32,240,643,365 32,414,194,730
Total 47,373,386,929 45,538,211,765
Current balances 38,708,988,905 35,259,430,672
Non-current balances 8,664,398,024 10,278,781,093
Total 47,373,386,929 45,538,211,765
FINANCIALS
26. Other loans
Interest rate 31 December 2017 31 December 2016
Bank Audi Lebanon “S.A.L” - a loan amounted to USD 100 million dated 27 April 2015, due on.26 April 2018
LIBOR 3 months + 2.5% – 1,826,650,000
Bank Audi Lebanon “S.A.L” - a loan amounted to USD 20 million dated 13 March 2015, due on.12 March 2018
LIBOR 3 months + 0.75% – 365,330,000
Bank Audi Lebanon ““S.A.L” - a subordinated loan amounted to USD 60 million dated 30.December 2015, due on 30 December 2025
LIBOR 3 months + 3% 1,063,662,000 1,095,990,000
Bank Audi Lebanon “S.A.E” - a loan amounted to USD 30 million dated 11 Jan 2015, due on 10.Jan 2018
LIBOR 3 months + 0.75% – 547,995,000
European Bank for Reconstruction and Development - a loan amounted to USD 10million, due on January 2022
LIBOR 6 months + 3% 177,277,000 –
Total other loans 1,240,939,000 3,835,965,000
Non-current assets 1,240,939,000 3,835,965,000
27. Other liabilities
31 December 2017 31 December 2016
Accrued interest 356,608,470 385,880,302
Advance revenue 53,151,808 58,557,949
Accrued expenses 40,899,724 46,215,238
Other credit balances 399,479,979 110,671,704
Total 850,139,981 601,325,193
28. Other provisions
31 December 2017
Provisions ofpossible claims
Provision for legal claims
Provision of contingent**liabilities
Total
Balance at the beginning of the year 71,667,575 601,499 27,623,401 99,892,475
(Provision formed during the year (Note 10 – 371,319 17,547,081 17,918,400
Used during the year (4,824,617) (140,840) – (4,965,457)
(Provisions no longer required (Note 10 (15,865,255) – – (15,865,255)
Foreign exchange differences – – (304,060) (304,060)
Balance at the end of the year 50,977,703 831,978 44,866,422 96,676,103
** Provision of contingent liabilities represented in EGP 699,704 against individual provision and a collective provision for groups with similar credit characteristics amounted to EGP 44,166,719.
90 91

0431 December 2016
Provisions ofpossible claims
Legal provisionProvision of contingent liabilities *
Total
Balance at the beginning of the year 67,349,737 831,944 5,375,780 73,557,461
(Provision formed during the year (Note 10 4,322,133 – 17,347,368 21,669,501
Used during the year (4,295) (150,803) – (155,098)
Provisions no longer required – (79,642) – (79,642)
Foreign exchange differences – – 4,900,253 4,900,253
Balance at the end of the year 71,667,575 601,499 27,623,401 99,892,475
* Provision of contingent liabilities represented in EGP 699,704 against individual provision and a collective provision for groups with similar credit characteristics amounted to EGP 26,923,697.
29. Deferred tax liabilitiesDeferred tax has been calculated on all temporary tax differences using the liabilities method and using the effective tax rate 22.5% for the current financial period.Deferred tax assets resulting from carried forward tax losses are not recognized unless it is probable that there are future tax profits to utilize the forward carried tax losses.Offset between deferred tax assets and deferred tax liabilities is done if there is a legal reason to offset the current assets tax and against the current liabilities tax, and when the deferred income taxes belong to the same tax department.Deferred tax assets and liabilitiesBelow is the movement of deferred tax assets and liabilities:
Deferred tax assets and liabilities balances
Deferred tax assets Deferred tax liabilities
2017 2016 2017 2016
Fixed assets 13,390,689 – (66,819,860) (34,958,253)
Provisions (other than Provision for loan (impairment
– 9,013,276 – –
Foreign exchange revaluation gain of monetary assets and liabilities
– – (202,451,400) (348,491,430)
Fair value differences – – – –
Total tax arising from an asset (liability) 13,390,689 9,013,276 (269,271,260) (383,449,683)
Net tax resulting in an obligation – – (255,880,571) (374,436,407)
Movement of deferred tax assets and liabilities
Deferred tax assets Deferred tax liabilities
31 December 2017
31 December 2016
31 December 2017
31 December 2016
Balance at beginning of the year 12,147,375 13,748,445 (386,583,782) (28,809,303)
Tax recognised in statement of income 4,377,413 (1,601,070) 114,178,423 (358,575,399)
Tax recognised in equity – 800,920
Balance at the end of the year 16,524,788 12,147,375 (272,405,359) (386,583,782)
.
FINANCIALS
30. CapitalThe authorised, issued and paid-up capital at October 23, 2012 amounted to USD 235 million equivalent to the amount of EGP 1,337,024,865, divided among 23,500,000 shares, the value of each share is USD 10 and all the issued shares were paid in full.
On April 23, 2013, the Extraordinary General Assembly approved to increase the authorised and issued capital by an amount of USD 30 million equivalent to the amount EGP 206,334,000. Shareholders paid such increase in cash, so the authorised and issued capital amounted USD 265 million, equivalent to the amount of EGP 1,543,358,865, divided among 26,500,000 shares, the value of each share is USD 10 and all the issued shares were paid in full. On 21 November 2013, the capital increase was registered in the commercial register.
On March 20, 2014, the Extraordinary General Assembly approved to increase the authorised and issued capital by an amount of USD 42 million equivalent to the amount EGP 299,884,200, which was from the Shareholders’ share of dividends for the year 2013 amounting to EGP 317 million. The authorised and issued capital amounted USD 307 million, equivalent to the amount of EGP 1,843,243,065 divided among 30,700,000 shares, the value of each share is USD 10 and all the issued shares were paid in full. On 25 September 2014, the capital increase was registered in the commercial register.
On 14 December 2015, the Bank’s Extraordinary General Assembly approved to increase the authorised and issued capital by an amount of USD 40 million that is paid directly by the shareholders. The authorised and issued capital amounted USD 347 million, divided among 34,700,000 shares; the value of each share is USD 10 equivalent to EGP 2,152,447,065. On May 30 2016, the capital increase was registered in the commercial register.
The shareholders’ structure is as follows:
Name of shareholder Number of Shares Nominal value in USD Payment currency
Bank Audi “S.A.L.” Lebanon 34,699,998 346,999,980 USD
Bank Audi “S.A.L.” - Private Services-Lebanon 1 10 USD
Bank Audi “S.A.L”. -Businesses- Lebanon 1 10 USD
Total 34,700,000 347,000,000 USD
31. Reserves and retained earnings
31 December 2017 31 December 2016
Reserves
Special reserve 81,099,789 81,099,789
General banking risk reserve during the year 156,102,816 260,874,317
Legal reserve 195,972,487 101,809,690
Capital reserve 647,436 585,267
Fair value reserve - Available for sale investments 962,839 3,890,539
Fair value reserve- financial investments transferred to held to maturity
(135,210,000) (206,638,837)
IFRS9 reserve 336,022,770 –
Total reserves at the end of the year 635,598,137 241,620,765
Reserves movements are as follows:
31 December 2017 31 December 2016
A.Special reserve
Beginning balance of the year 81,099,789 81,099,789
Ending Balance of the year 81,099,789 81,099,789
92 93

In accordance with Central Bank of Egypt’s rules relating to the preparation and presentation of financial statements and measurement and recognition bases approved by its Board of Directors on 16 December 2008, the method of measurement of the impairment of loans, facilities and other debt instruments has been changed , as a result ;the general provision for the loans and advances has been deleted and replaced by total provisions include group of assets that bear credit risk and similar characteristics or individual provisions and the total increase in the current provisions has been formed on 1 January 2009 in accordance with the former basis of evaluation previously used in the provisions as per the new method to special reserve in the owner’s equity. This reserve is not available for distribution unless approved by the Central Bank of Egypt.
31 December 2017 31 December 2016
B.General banking risk reserve
Beginning balance of the year 260,874,317 219,936,068
Transferred from retained earnings (104,771,501) 40,938,249
Balance at the end of the year 156,102,816 260,874,317
This represents the difference between loans impairment provision calculated on the basis of credit worthiness and provisions making as issued by the Central Bank of Egypt, and the loan impairment provision charged to the financial statements after the initial recognition at the beginning of the first year of the application of the changes made to accounting policy.The CBE regulations require banks to form a general banking risk reserve to meet unexpected risks. Such reserve is not distributable except after obtaining the approval of the CBE.In accordance with Central Bank of Egypt’s rules relating to the preparation and presentation of financial statements and measurement and recognition bases approved by its Board of Directors on 16 December 2008.
31 December 2017 31 December 2016
C.Legal reserve
Beginning balance of the year 101,809,690 72,518,218
Transferred from profits of the year 94,162,797 29,291,472
Balance at the end of the year 195,972,487 101,809,690
According to the local laws, a provision of 5% of net annual profits of the year shall be transferred to a non-distributable statutory reserve until it reaches 50% of the bank’s issued capital.
31 December 2017 31 December 2016
D.Capital reserve
Beginning balance of the year 585,267 137,507
Formed from the profit of the year 62,169 447,760
Balance at the end of the year 647,436 585,267
In accordance with the requirements and instructions of the Central Bank of Egypt, the capital reserve is made from the capital profits realised from sale of fixed assets before the distribution of dividends.
04 FINANCIALS
31 December 2017 31 December 2016
E.Fair value reserve of available-for-sale financial asset
Beginning balance of the year 3,890,539 (23,310,294)
Net gain from change in fair value (2,927,700) (175,945,573)
Net gains transferred to the statement of income due to disposal – (16,591,548)
Transfer of reserve balance of available for sale treasury bonds that was reclassified to held-to-maturity
– 218,937,034
(Deferred tax (Note 29 – 800,920
Balance at the end of the year 962,839 3,890,539
31 December 2017 31 December 2016
F.Fair value reserve of available-for-sale financial investments reclassified to held-to-maturity investments
Beginning balance of the year (206,638,837) –
Transfer of reserve balance of available for sale treasury bonds reclassified to held-to-maturity
– (218,937,034)
Amortisation of the reserve balance of available for sale treasury bills reclassified to held-to-maturity
71,428,837 12,298,197
Balance at the end of the year (135,210,000) (206,638,837)
31 December 2017 31 December 2016
G.Retained earnings
Beginning balance of the year 2,254,485,126 487,633,965
Net profit for the year 1,020,877,686 1,883,318,117
Employees’ profit share for the year 2016 (174,815,490) (45,789,473)
Transferred to capital reserve (62,169) (447,761)
Transferred to general banking risk reserve 104,771,501 (40,938,250)
Transferred to legal reserve (94,162,797) (29,291,472)
IFRS9 reserve (336,022,770) –
Balance at the end of the year 2,775,071,087 2,254,485,126
31 December 2017 31 December 2016
H. IFRS9 reserve
Beginning balance of the year – –
Formed from the profit of the year 336,022,770 –
Balance at the end of the year 336,022,770 –
The risk reserve of IFRS 9 is set at 1% of the total risk weighted risk ratio as per the Central Bank’s instructions dated 28 January 2018 to support the Bank’s financial position to meet the expected increase in provisions due to the expected risk-taking approach taking into consideration the future outlook economic conditions.
94 95

32. Cash and cash equivalents
For the purpose of presenting the statement of cash flows, cash and cash equivalents include the following balances of maturity dates not exceeding three months from the date of acquisition.
31 December 2017 31 December 2016
Cash and balances with the Central Bank other than mandatory reserve ratio
767,630,782 425,626,156
Due from banks 4,138,238,249 6,634,392,592
Treasury bills and other government securities 294,846 –
Total 4,906,163,877 7,060,018,748
33.Contingent liabilities and commitments A. Legal claimsSeveral lawsuits were made against the Bank and are still outstanding as of 31 December 2017, provision amounted to EGP 831,978 has been formed against these lawsuits. B. Capital Commitments:The Bank’s capital commitments amounted to EGP 34,72 million as of 31 December 2017 against EGP 259,01 million at the comparison date. These represent commitments by the Bank for the purchase of fixed assets. Management is sufficiently confident that net profit shall be realized and finance shall be made available to cover these commitments. C. The Bank’s commitments related to loans, guarantees, and facilities are represented in the following:
31 December 2017 31 December 2016
Commitments for loans and other irrevocable liabilities related to credit 550,249,516 265,528,060
Letters of acceptances 233,750,126 138,310,543
Letters of guarantee 4,701,590,774 3,734,865,756
Letters of credit - import 268,705,323 355,024,001
Letters of credits - export 1,191,881 –
Total 5,755,487,620 4,493,728,360
34. Related party transactionsThe Bank is subsidiary of the parent company Bank Audi (SAL) (Lebanon) which owns 99.99999% of the Bank’s ordinary shares whereas the remaining percentage of 0.00001% is owned by other shareholders. Related parties transactions and balances at the year ended at 31 December 2017 are as follows:
Loans and advances from related parties31 December 2017
000 EGP
31 December 2016
000 EGP
Outstanding loans at the beginning of the year 3,835,965 1,623,321
Currency valuation differences (32,328) 2,212,644
Loans paid during the year (2,739,975) –
Outstanding loans at the end of the year 1,063,662 3,835,965
04 FINANCIALS34. Related party transactionsLoans and advances granted from the parent company are non-secured, with floating interest rate as they are recoverable at the end of contract. Loans and advances to related parties
Senior management members Other parties
31 December 2017
000 EGP
31 December 2016
000 EGP
31 December 2017
000 EGP
31 December 2016
000 EGP
Outstanding loans at the beginning of theyear
16,901 16,410 146,132 61,841
Loans issued during the year 77,845 21,483 – –
Loans paid during the year (67,864) (20,992) (146,132) –
Currency valuation differences – – – 84,291
Outstanding loans at the end of the year 26,882 16,901 – 146,132
Deposits from related parties
Senior management members Other parties
Due to customers
31 December 2017
000 EGP
31 December 2016
000 EGP
31 December 2017
000 EGP
31 December 2016
000 EGP
At the beginning of the year 25,472 24,194 19,737 19,615
Deposits placed during the year 354,850 355,143 – 1,326,463
Deposits repaid during the year (357,155) (357,713) (19,737) (1,339,477)
Currency valuation differences (4,070) 3,848 – 13,136
Deposits at the end of the year 19,097 25,472 – 19,737
Deposits’ cost and similar costs 1,469 2,027 – 1,214
Other transaction with related parties31 December 2017
000 EGP
31 December 2016
000 EGP
Due from banks 214,376 10,604
Due to banks 94,760 8,010
Letters of guarantee 91,174 136,530
Accepted securities – 8,630
Benefits to the Board and senior management31 December 2017
000 EGP
31 December 2016
000 EGP
Salaries and short- term benefits 3,145 1,601
The monthly average of net salaries and benefits for top twenty employees with the largest salaries and benefits reached EGP 4,363,410 during the current financial year ended 31 December 2017 against EGP 3,868,132 for the financial year ended 31 December 2016.
96 97

35. Tax positionOn September 4, 2014, law No.44 for year 2014 was issued, this law imposes an extra 5% tax to be paid annually for three years starting from the current tax period. This extra tax is to be paid on amounts exceed 1 million EGP from the taxable income for both individuals and corporate. They are assessed and collected in accordance with these provisions. This Law was effective starting from September 5, 2014. On 30 of June 2014, Law No.53 for 2014 was issued. This law included provisions to amend some articles of the Income Tax Law promulgated by Law No. 91 of 2005; the most important amendments were as follows:1. Imposing taxes on dividends.2. Imposing tax on capital gains resulting from the sale of securities. On April 6, 2015, the Ministerial Decree No. 172 for 2015 was issued. This law included a ruling to amend some articles of the Income Tax Law issued by the decree of the Minister of Finance No.991 for 2005. On 20 of August 2015 a presidential by decree law No. 96 for year 2015 was issued. This law included a ruling to amend some articles of The Income Tax Law No. 91 for 2015 to impose of a temporary additional tax on income. This decree shall take effect from the day following its publication. The following are the main changes in the decree:1. Reduce the tax rate on income to be 22.5% of the annual net profits.2. Adjust temporary tax imposition period of 5%.3. Adjust taxes on profit dividends.4. Discontinuation of the imposition of the capital tax on the output of dealing in securities listed for two years starting from May 17, 2015.The bank is subject to the Egyptian corporate income tax, and this requires significant estimates while assessing the reserve required for corporate income tax, and there are transactions and treatments whose tax effects are difficult to determine accurately in the normal course of business. The bank recorded liabilities for the expected differences that may arise from the tax inspection based on estimate of what may arise from the extra due taxes. If the final result of these differences differs from the amounts previously recorded, such differences will be recognized as income taxes and tax provisions in the period in which they are determined.Below is a summary of the Company’s tax position:
Corporate Income tax:- The final settlement was made up to 2012 . The Bank has a credit balance as a result of tax loss carried over for the following periods.- Years 2013 and 2014 were inspected. Objection was made to the result of inspection and the file is transferred to the appeal committee to study the points of conflict.- It was agreed in the internal committee on the years 2009/2012. An amount was paid on account until the result of appeal is issued for the years 2007 and 2008 to deduct the carried forward losses. - Years 2013 and 2014 were inspected. Objection was made to the result of inspection and the file is transferred to the
appeal committee to study the points of conflict.Tax on earnings- Final settlement was made until 2012.- Inspection of the years 2013 and 2014 is currently under process.
Stamp duty tax- Final settlement was made until 2002.- Periods from January 1, 2003 to July 31, 2006 were inspected. Objection was made to the result of inspection and the file is transferred to the appeal committee to study the points of conflict.-Periods from August 1, 2006 to March 31, 2013 were inspected. Tax amount was agreed based on the agreement signed between the Federation of Egyptian Banks and the Public Taxes Authority in December 2015, according to the re-inspection and pending assessment forms.-The year 2016 is being inspected.
Sales taxThe position was settled with the Tax Authority until 2013, there is no obligation due from the bank, and inspection is under process.36.Mutual fundsMutual fundsThe mutual fund is one of the licensed activities of the Bank by the virtue of the provisions of Capital Market law no.95 for the year 1992 and its executive regulations. (a) Bank Audi Monetary Mutual fund in EGP (with Daily Cumulative Interest)The Fund is managed by EFG-Hermes Mutual Fund Management Company. The fund has a total investment of 110 million certificates that amounts to EGP 1100 million. The Bank has a total of 500,000 certificates (nominal value of EGP 5 million) undertake the Fund’s activities.The Bank has purchased 500 thousand certificates amounting to EGP 500 thousand, with a redeemable value of EGP 11,159,300 at 31 December 2017, and the redeemable value of the certificate is EGP 22.32 at 31 December 2017. The Fund’s existing certificates at the same date reached 13,591,176 certificates. On July 15, 2014; the Central Bank of Egypt approved to increase the Fund’s size to reach 110 million certificates by the value of EGP 1,100 million, as well as increasing the Bank’s contribution value to the capital of this fund to reach EGP 22 million according to Article No. (150) of the Executive Regulations of Capital Market law No.95 for the year 1992, which stipulates that “The maximum limit of money invested in the Fund shall not exceed fifty times its capital, which in turn must not be less than EGP five million, paid in cash”. The contribution of the Bank at 31 December 2017 amounted to 5.34% of the total issued certificates at that date.In accordance with the fund’s management contract and the subscription prospectus, Bank Audi receives fees and commissions against its supervision of the Fund and other administrative services it performs. The total commissions amounted to EGP 931,426 for the year ended 31 December 2017 included in the fees and commissions item/ Other commissions in the statement of income.
04 FINANCIALS36.Mutual funds(b)Bank Audi Monetary Mutual Fund “Ezdhar” in EGP with daily accumulated interests and variable periodic interestThe Fund is managed by Acumen Co. for the establishment and management of the portfolios of securities and mutual funds. The Fund’s total number of outstanding investment certificates at 31 December 2016 reached 250 thousand at a total value of EGP 25 million; out of which 50 thousand certificates ( with value of EGP 5 million) were allocated to the Bank to undertake the Fund’s activities. The Bank has purchased 50 thousand certificates amounting to EGP 5 million, with a redeemable value of EGP 9,165,510 at 31 December 2017, and the redeemable value
of the certificate is EGP 183,310,200 at 31 December 2017. The Fund’s outstanding certificates at the same date were 153,419 certificates. In accordance with the fund’s management contract and the subscription prospectus, Bank Audi receives fees and commissions against its supervision of the Fund and other administrative services it performs. The total commissions amounted to EGP 78,770 for the year ended 31 December 2017 included in the fees and commissions item/ Other commissions in the statement of income.
37. Corresponding figuresCertain Corresponding figures in the financial statements at 31 December 2016 have been adjusted to conform to the current presentation of the consolidated financial
statements and are presented better as follows:
Reclassification in the balance sheet 2016Before reclassification Classification 2016
After reclassification
Loans and advances 29,933,402,318 52,254,103 29,985,656,421
Other liabilities 549,071,091 52,254,103 601,325,194
98 99


PEOPLE05
Board of Directors
Mr. Hatem Sadek Chairman of the Board
Mr. Mohamed Abbas Chief Executive Officer & Managing Director
Mr. Mohamed Bedeir Deputy Managing Director & Chief Banking Services Officer
Mr. Afdal Naguib Chief Risk Officer
Mr. Samir Hanna Non-Executive
Mr. Aristidis Vourakis Non-Executive
Dr. Emad Etani Non-Executive
Mr. Khalil El Debs Non-Executive
Mr. Mounir Fakhry Abdel Nour Independent
Senior Management
Mr. Mohamed A. FayedChief Executive Officer & Managing DirectorTel: +202 35343896Email: [email protected]
Mr. Mohamed BedeirDeputy Managing Director & Chief Banking Services OfficerTel: +202 35343506Email: [email protected]
Mr. Mohamed ShawkyChief Financial officerTel: +202 35343310Email: [email protected]
Mr. Khaled BeshirHead of OperationsTel: +202 35343403Email: [email protected]
Mr. Maher HamedChief Information TechnologyTel: +202 35343332Email: [email protected]
Mr. Hany Ramzy Head of MISTel: +202 35343328Email: [email protected]
Mr. Afdal NaguibChief Risk OfficerTel: +202 35343562Email: [email protected]
Mr. Karim HosniDeputy CRO & Head of Credit RiskTel: +202 35343453Email: [email protected]
Mr. Mohamed TalaatHead of Operations RiskTel: +202 35343465Email: [email protected]
Mr. Moataz MounirHead of Market RiskTel: +202 35343465Email: [email protected]
Mr. Mohamed LatifChief Institutional & Islamic Banking OfficerTel: +202 35343407Email: [email protected]
Mr. Mohamed HassanHead of Islamic BankingTel: +202 35343517Email: [email protected]
Mr. Rasha Abdel-RassoulHead of Financial InstitutionsTel: +202 35343499Email: [email protected]
Mr. Mahmoud AranshoHead of Capital Markets & InvestmentsTel: +202 35343561Email: [email protected]
Mr. Khaled HamzaHead of Marketing and CommunicationsTel: +202 35343380Email: [email protected]
Mr. Manal El SeminHead of Public RelationsTel: +202 35343391Email: [email protected]
Mr. Sherif SabryChief Corporate Banking OfficerTel: +202 35343363Email: [email protected]
Mr. Mohammed Sabry
Head of Large Corporate, Syndication & Structured FinanceTel: +202 35343361Email: [email protected]
Mr. Tamer El OrabyHead of Large CorporateTel: +202 35343367Email: [email protected]
Mr. Hazem Abdel AzizHead of Large CorporateTel: +202 35343430Email: [email protected]
Mr. Tamer Mounir
Head of Corporate Banking - Alexandria and Delta regionTel: +202 35343078Email: [email protected]
Mr. Amr MehesenHead of Commercial BankingTel: +202 35343665Email: [email protected]
Mr. Amr KamalHead of SME Tel: +202 35343922Email: [email protected]
Mr. Mohamed AfifiHead of Corporate Business DevelopmentTel: +202 [email protected]
Mr. Mahmoud Abou TalebHead of GTSTel: +202 35343493Email: [email protected]
102 103

PEOPLE05
Mr. Ahmed KhallafActing Head of TreasuryTel: +202 35343524Email: [email protected]
Mr. Ahmed OssamaHead of Fixed Income & Money Market DeskTel: +202 35343522Email: [email protected]
Mr. Bassel KeladaHead of Retail RiskTel: +202 35343585Email: [email protected]
Mr. Hesham RagabSenior Legal CounselorTel: +202 35343016Email: [email protected]
Mr. Amr El-GueziryHead of AuditTel: +202 35343535Email: [email protected]
Mr. Ali AmerHead of ComplianceTel: +202 35343511Email: [email protected]
Mr. Ahmed FouadHead of Strategic Support & BoD SecretaryTel: +202 35343505Email: [email protected]
Ms. Asmaa OmaraHead of Service ExcellenceTel: +202 35343895Email: [email protected]
Mr. Hazem El ShaarawyHead of Market ResearchTel: +202 35343497Email: [email protected]
Ms. Nevine El MahdyHead of Branch NetworkTel: +202 35343544Email: [email protected]
Ms. Iman BadrActing Head of Retail BankingTel: +202 35343670Email: [email protected]
Mr. Helal OmarChief Non-Banking Services OfficerTel: +202 35343677Email: [email protected]
Mr. Muhammed SelimHead of Human Resources & AdministrationEmail: [email protected]
Mr. Rafik Abou SaraHead of EngineeringTel: +202 35343437Email: [email protected]
Mr. Mohamed KamelHead of ProcurementTel: +202 35343455Email: [email protected]
Ms. Afaf AliHead of General ServicesTel: +202 35343432Email: [email protected]
Mr. Mohamed Gamal SarhanHead of Security Services & Governmental RelationsTel: +202 35343863Email: [email protected]
Ms. Mariam ElsamnyChief Consumer Banking and Delivery Channels OfficerTel: +202 35343451Email: [email protected]
Mr. Mohamed LabibGovernmental Entities and Public Sector DivisionTel: +202 35343600Email: [email protected]
104 105

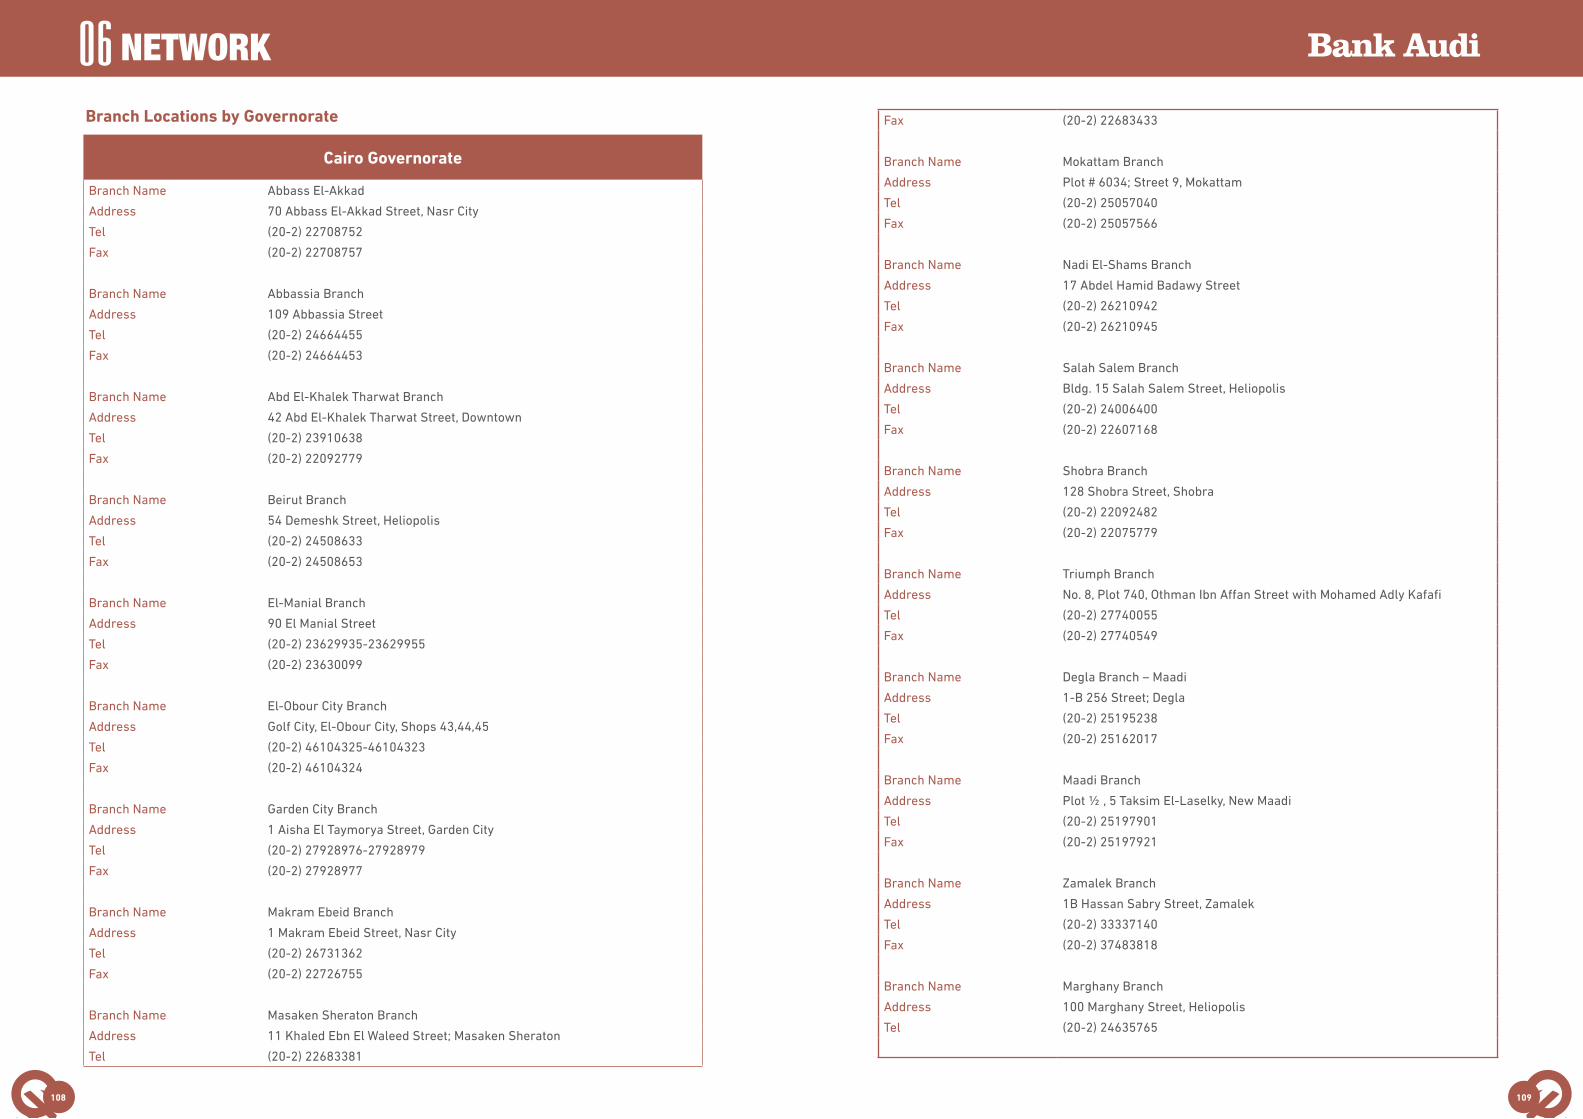
NETWORK06Branch Locations by Governorate
Cairo Governorate
Branch Name Abbass El-Akkad
Address 70 Abbass El-Akkad Street, Nasr City
Tel (20-2) 22708752
Fax (20-2) 22708757
Branch Name Abbassia Branch
Address 109 Abbassia Street
Tel (20-2) 24664455
Fax (20-2) 24664453
Branch Name Abd El-Khalek Tharwat Branch
Address 42 Abd El-Khalek Tharwat Street, Downtown
Tel (20-2) 23910638
Fax (20-2) 22092779
Branch Name Beirut Branch
Address 54 Demeshk Street, Heliopolis
Tel (20-2) 24508633
Fax (20-2) 24508653
Branch Name El-Manial Branch
Address 90 El Manial Street
Tel (20-2) 23629935-23629955
Fax (20-2) 23630099
Branch Name El-Obour City Branch
Address Golf City, El-Obour City, Shops 43,44,45
Tel (20-2) 46104325-46104323
Fax (20-2) 46104324
Branch Name Garden City Branch
Address 1 Aisha El Taymorya Street, Garden City
Tel (20-2) 27928976-27928979
Fax (20-2) 27928977
Branch Name Makram Ebeid Branch
Address 1 Makram Ebeid Street, Nasr City
Tel (20-2) 26731362
Fax (20-2) 22726755
Branch Name Masaken Sheraton Branch
Address 11 Khaled Ebn El Waleed Street; Masaken Sheraton
Tel (20-2) 22683381
Fax (20-2) 22683433
Branch Name Mokattam Branch
Address Plot # 6034; Street 9, Mokattam
Tel (20-2) 25057040
Fax (20-2) 25057566
Branch Name Nadi El-Shams Branch
Address 17 Abdel Hamid Badawy Street
Tel (20-2) 26210942
Fax (20-2) 26210945
Branch Name Salah Salem Branch
Address Bldg. 15 Salah Salem Street, Heliopolis
Tel (20-2) 24006400
Fax (20-2) 22607168
Branch Name Shobra Branch
Address 128 Shobra Street, Shobra
Tel (20-2) 22092482
Fax (20-2) 22075779
Branch Name Triumph Branch
Address No. 8, Plot 740, Othman Ibn Affan Street with Mohamed Adly Kafafi
Tel (20-2) 27740055
Fax (20-2) 27740549
Branch Name Degla Branch – Maadi
Address 1-B 256 Street; Degla
Tel (20-2) 25195238
Fax (20-2) 25162017
Branch Name Maadi Branch
Address Plot ½ , 5 Taksim El-Laselky, New Maadi
Tel (20-2) 25197901
Fax (20-2) 25197921
Branch Name Zamalek Branch
Address 1B Hassan Sabry Street, Zamalek
Tel (20-2) 33337140
Fax (20-2) 37483818
Branch Name Marghany Branch
Address 100 Marghany Street, Heliopolis
Tel (20-2) 24635765
108 109

NETWORK06Branch Name Tayaran Branch
Address 40 El Tayaran Street, Nasr City
Tel (20-2) 24048619
Branch Name Madinaty Branch
Address Block No. 6, Banking Area, Madinaty project, New Cairo
Branch Name Tagamoa El Khames Branch
AddressPhase One, Waterway Compound, Block CFS4-CGS4 El Mostathmreen El Shamaleya, New Cairo
Giza Governorate
Branch Name Dokki Branch - Main
Address 104 El Nile Street, Dokki
Tel (20-2) 33337137
Fax (20-2) 37483818
Branch Name El Batal Ahmed Abdel Aziz
Address 44 El Batal Ahmed Abdel Aziz Street, Mohandessin
Tel (20-2) 33332000
Branch Name Haram Islamic Branch
Address 42 El-Haram Street, El Haram
Tel (20-2) 33865056
Fax (20-2) 33865103
Branch Name Lebanon Branch
Address 60 Lebanon Street (Lebanon Tower), Lebanon Square, Mohandessin
Tel (2-02) 33319553
Fax (2-02) 33026454
Branch Name Tahrir Street Branch
Address 94 Tahrir Street, Dokki
Tel (20-2) 33319500
Fax (20-2) 37486310
Branch Name Pyramids Heights Branch
Address Pyramids Heights Office Park, Km 22 Cairo-Alexandria Desert Road
Tel (20-2) 35343660
Fax (20-2) 35362053
Branch Name Sixth of October Branch
Address Plot # 2/23 - Central District, Sixth of October
Tel (2-02) 38353783
Fax (20-2) 38353780
Branch Name Shooting Club Branch
Address 13 Nadi El Seid Street
Tel (20-2) 37486427
Fax (20-2)37486546
Branch Name Mossadak Islamic Branch
Address 56 Mossadak Street, Dokki
Tel (20-2) 37603520
Fax (20-2) 37480242
Branch Name El Sheikh Zayed Branch
Address B3, Capital Business Park, Units 101-102. ,El Sheikh Zayed
Tel 2/3/ 38653550 )202(
Fax (202) 38653551
Alexandria Governorate
Branch Name El Sultan Hussein Branch
Address 38 El Sultan Hussein Street
Tel (20-2) 4880500
Fax (20-2) 37480242
Branch Name Gleem Branch
Address 1 Mostafa Fahmy Street, Gleem
Tel (20-3) 5816000
Fax (20-3) 5825866
Branch Name Smouha Branch
Address 35 (Repeated) Victor Emmanuel Square
Tel (20-3) 4193728
Fax (20-3) 4244510
Branch Name Alexandria Downtown Branch
Address Villa 1- Miroza Resort-Alexandria-Cairo Desert Road
Tel (20-3) 3671300
Fax (20-3) 3681377
Branch Name Miami Islamic Branch
Address 379 Gamal Abdel Nasser Street, Miami
Tel (20-3) 5505212
Branch Name San Stefano Branch
Address 413, El-Geish Road, Loran
Tel (20-3) 5817025
Fax (20-2) 5859790
110 111

NETWORK06Daqahlia Governorate
Branch Name Mansoura Branch
Address 26 Saad Zaghloul Street, Toreil
Tel (20-50) 2281600
Fax (20-50) 2309782
Gharbia GovernorateBranch Name Tanta Branch
Address Intersection of El-Geish Street & El-Nahda Street
Tel (20-40) 3389637
Fax (20-40) 3403100
Sharkiya GovernorateBranch Name Zagazig Branch
Address 95 Saad Zaghloul Street, Zagazig, El Sharkiya
Tel (20-55) 2369782
Port Said GovernorateBranch Name Port Said Branch
Address 27A, 23rd of July Street & Qaitbay, El Sharq District
Tel (20-66) 3239933
Fax (20-66) 3239935
Assiut GovernorateBranch Name Assiut Branch
Address Mahmoud Fahmy Nokrashy Street
Tel (20-) 2286133
Fax (20-) 2286136
Damietta GovernorateBranch Name Damietta Branch
Address 49 Kornish El Nile –Damietta
Tel (20-) 2367080
South Sinai GovernorateBranch Name Naema Bay Branch - Sharm El-Sheikh
Address 207 Rabwet Khaleeg Naema
Tel (20-69) 3604515
Fax (20-69) 3604520
Daqahlia GovernorateBranch Name Mansoura Branch
Address 26 Saad Zaghloul Street, Toreil
Tel (20-50) 2281600
Fax (20-50) 2309782
Gharbia GovernorateBranch Name Tanta Branch
Address Intersection of El-Geish Street & El-Nahda Street
Tel (20-40) 3389637
Fax (20-40) 3403100
Sharkiya GovernorateBranch Name Zagazig Branch
Address 95 Saad Zaghloul Street, Zagazig, El Sharkiya
Tel (20-55) 2369782
Port Said GovernorateBranch Name Port Said Branch
Address 27A, 23rd of July Street & Qaitbay, El Sharq District
Tel (20-66) 3239933
Fax (20-66) 3239935
Assiut GovernorateBranch Name Assiut Branch
Address Mahmoud Fahmy Nokrashy Street
Tel (20-) 2286133
Fax (20-) 2286136
Damietta GovernorateBranch Name Damietta Branch
Address 49 Kornish El Nile –Damietta
Tel (20-) 2367080
112 113

NETWORK06Call Center 16555
ATM Locations by Governorate
ATM Name Address
Cairo GovernorateAl Ahram Newspaper Al Ahram Building: El-Galaa Street, Cairo
Mokattam Branch Plot # 6034, Street 9, Mokattam, Cairo
Wadi Degla Club Wadi Degla Club – Maadi, Cairo
Makram Ebeid Branch 1 1 Makram Ebeid Street, Nasr City, Cairo
Makram Ebeid Branch 2 1 Makram Ebeid Street, Nasr City, Cairo
ExxonMobil Hassan El Maamoun6th Hassan El Sherif (Hassan El Maamoun) Street, Nasr City, Cairo
On the Run JW Marriot Ring Road - El-Nour Station, Cairo
On The Run El-Tagamoa El Khames Behind Courts Complex- El-Tagamoa El Khames, New Cairo
Beirut Branch 54 Demeshk Street, Heliopolis, Cairo
Kheir Zaman Takaa Plot No. 14, Block 6, Area 11, Nasr City, Cairo
On The Run Roxy 72 El Khalifa El Maamoun Street, Heliopolis, Cairo
Shoubra Branch 128 Shoubra Street, Shoubra, Cairo
Nady El Shams Branch 17 Abdel Hamid Badawy Street, Heliopolis, Cairo
Masaken Sheraton Branch11 Khaled Ibn El-Waleed Street, Masaken Sheraton, Cairo
On The Run Rehab City Gate 13 - Rehab City, Cairo
ExxonMobil Autostrad Behind Masaken Sheraton, Nasr City, Cairo
Degla Branch 1-B, 256 Street, Degla, Maadi, Cairo
ExxonMobil Farid SemekaFared Semeka Street Heliopolis – Near to El Shams Club, Cairo
Abbassia Branch 109 Abbassia Street, Cairo
General Company for Silos and Storage (Sawamea) 1 Sawah Square, Saray El Koba, Cairo
El Obour City Branch Golf City, Obour City, Shops 43,44,45
Exxon Mobil – Gesr El Suez19 Beginning of Cairo-Ismailia Road in front of El Her-afeyeen City
Triumph BranchNo. 8, Plot 740, Othman IBillion Affan Street with Mo-hamed Adly Kafafi, Heliopolis, Cairo
On The Run El Nozha 66 El Nozha Street, Almaza, Cairo
El Manial Branch 90 El Manial Street, Cairo
On the Run El Manial 59 El Manial Street, Cairo
Tharwat Branch 42 Abdel Khalek Tharwat Street, Cairo
Salah Salem Branch Bldg. 15 Salah Salem Street, Cairo
New Maadi Branch Plot 1, 2 D/5 Taksim El Laselky, New Maadi, Cairo
Abbass El Akkad Branch 70 Abbass El Akkad Street, Nasr City, Cairo
Garden City Branch 1 Aisha El Taymorya Street, Garden City, Cairo
Exxon Mobil El Tagamoaa El Khames (Rear 90th Street)
Rear 90th Street New Cairo 5th Settlement – El Tag-amoa El Khames, New Cairo
Cairo Festival City MallCairo Festival City Mall – El Tagamoa El Khames, New Cairo
Total Madinaty Cairo – Suez Desert Road - at Entrance 2 Shorouk City
Zamalek Branch 1B Hasan Sabry Street, Zamalek
Total El Lasilki22 El Lasilki street – New Maadi – beside Metro super-market, Cairo
Total AutostradAutostrad Road – Maadi Degla entrance – beside Torah prison, Cairo
Spinneys Mokattam 361 Street No. 9 – Al Mokattam, Cairo
Swan Lake CompoundSwan Lake – El Tagamoa El Khames (Club House), New Cairo
Marghany Branch 100 Marghany Street, Heliopolis, Cairo
Tayaran Branch 40 El Tayaran Street, Nasr City, Cairo
Tayaran Branch 2 40 El-Tayaran Street, Nasr City, Cairo
Tagamoa Branch (WaterWay)Phase One, WaterWay Compound, Block CFS4-CGS4 – El Tagamoa El Khames, New Cairo
PickUp Market Zamalek 13 Brazil Street, Zamalek, Cairo
Madinaty Branch Block No. 6, Banks Area, Madinaty
Carrefour Helwan 41 Rayeel Street, Helwan, Cairo
Nile City Mall Nile City Mall – Bolak, Cairo
Spinneys Maxim MallPiece 23 – El Tagamoa El Khames - Maxim Mall, New Cairo
La Siesta CaféBlock 88 – El Shatr 13, Zahraa El Maadi, in front of Dina Farms, Maadi, Cairo
Mini Metro SheratonPiece 1174 - Masaken Sheraton - behind Arab Acad-emy, Cairo
B Tech Shoubra 61 Shoubra Street, Cairo
Petromin Nasr City 16 Zaker Hussein Street, 9th District, Nasr City, Cairo
Petromin Obour City Obour City
Carrefour Sun City Mall Sun City Mall, Nasr Road, Nozha, Heliopolis
Carrefour Obour City Golf City Mall, Obour City
Carrefour Baron Mall Baron Mall - Ring Road, Maadi, Cairo
Carrefour Hadayek El Koba 16 Waley El Ahd Street, Hadayek El Koba, Cairo
114 115

NETWORK06
6th of October Branch Plot # 2/23, Central District, 6th of October City
Dar El Mona Cairo – Alexandria Desert Road, KM 15
Dreamland Sheraton Dream 6th of October
Hyper OneExtension of Mehwar 26th of July, Entrance of El Sheikh Zayed City
Seoudi MarketIn front of Hadayek Mohandeseen Compound gate 9 – El Sheikh Zayed
Seasons Country Club Cairo – Alexandria Desert Road, KM 17
Spinneys City Scape 6th of October after El Hosery
Pyramids Heights 1 Cairo – Alexandria Desert Road, KM 22
Pyramids Heights 2 Cairo – Alexandria Desert Road, KM 22
Hazem Hassan Cairo – Alexandria Desert Road, KM 22
Spinney’s Mall of Arabia Mall of Arabia, 6th of October
Arkan Mall Arkan Mall, El Sheikh Zayed
Haram CityTamr Henna Mall, Haram City, Wahat Road, 6th of October
EFG Hermes Smart Village
Total Marioteya Al Kom Al Akhdar, Giza
Hyper One 2 Hyper One second Floor
Unionaire 4 3rd Industrial Zone piece No. 609, 6th of October
Zamzam Mall BUILD 71, El Hay 7, 6th of October
Spinneys - Haram 46 Al-Haram Street, Galaxy – Marioteya, Haram
Shooting Club Branch 13 Nadi El Seid Street, Dokki, Giza
Royal Language SchoolElHay 4, Megawra 3 behind El-Madina Trade Center, 6th of October City
Al-Nahar ChannelEgyptian Media Production City (EMPC), October, 6th of October
Saudi Beverly HillsKilo 38 Cairo – Alexandria Desert Road - Seoudi Market, Beverly Hills – El Sheikh Zayed
Spinneys SmouhaStreet 364 – Victor Emmanuel Square, Smouha, Alex-andria
Carrefour Green Plaza Green Plaza Mall, Alexandria
Downtown Alex Branch Downtown, Alexandria
Carrefour Royal PlazaMalik Hefni Kebly Street next to Misr T’ameer Towers, Montazah, Alexandria
Daqahlia GovernorateEl Mansoura Branch 26 Saad Zaghloul Street, Toreil, El Mansoura
Kheir Zaman El Mansoura Suez Canal Street, El Nour Building, El Mansoura
Carrefour El Mansoura Street No. 20, El Mansoura
Gharbia GovernorateTanta Branch Intersection of El Geish & El Nahda Streets, Tanta
Metro Tanta 32 Said Street, Couchner Square, Tanta
Red Sea Governorate
El Gouna BranchService Area # Fba-12e, El Balad District, Gouna, Hurghada
Bostan El Gouna ATM El Gouna, Hurghada
Spinneys Senzo Mall Senzo Mall, Hurghada
Sheraton Road Branch23 Taksim El Hadaba El Shamaleya, 167 Sheraton Road, Hurghada
Spinneys Hurghada – El Dahar El Nasr Street, El-Dahar, Hurghada
Giza GovernorateHaram Branch 42 El Haram Street, Giza
Mossadak Islamic Branch 1 56 Mossadak Street, Dokki, Giza
Dokki (Main Branch) 104 El Nile Street, Dokki, Giza
ExxonMobil On the Run Dokki 50 Giza Street, in front of Magles El Dawla, Giza
Lebanon Branch 2Lebanon Tower, 60 Lebanon Street, Lebanon Square, Mohandeseen, Giza
Lebanon Branch 1Lebanon Tower, 60 Lebanon Street, Lebanon Square, Mohandeseen, Giza
Samcrete 8 El Mansouria Road, El Haram, next to Koki Park
El Batal Ahmed Abdel Aziz Branch44 El Batal Ahmed Abdel Aziz Street, Mohandeseen, Cairo
Tahrir Branch 94 Tahrir Street, Dokki, Giza
ExxonMobil On the Run Gamet El Dowal 63 Gamet El Dowal Street, Mohandeseen, Giza
Unionaire 1 3rd Industrial Zone piece No. 609, 6th of October
Unionaire 2 3rd Industrial Zone piece No. 609, 6th of October
Unionaire 3 3rd Industrial Zone piece No. 609, 6th of October
Zayed BranchFirst Stage of Capital Project, Units No. 002 and 101, Building B3, Capital Business Park, El Sheikh Zayed
Mini Metro October26th July Street, in front of Misr University, 6th of Oc-tober
Unionaire 5 3rd Industrial Zone piece No. 609, 6th of October
Alexandria GovernorateSmouha Branch 35 Victor Emmanuel Square, Alexandria
ExxonMobil Merghem Merghem, Alexandria – Cairo Desert Road
Miami Branch 4 Street 489, Montazah Division, Alexandria
Gleem Branch 1 Mostafa Fahmy Street, Gleem, Alexandria
Metro Loran25 & 27 Serhank Pasha Street, Loran, El Raml Awal, Alexandria
Metro Roshdy – Alex 33B Syria Street, Roshdy, Alexandria
Total MarinaKM 104 Alex – Matrouh Road, Between Marina gates 5 – 6
New El Sultan Hussein Branch 33 Sultan Hussein Street, Alexandria
San Stefano Branch 413 El Geish Road, Alexandria
La Passage - Alex 52 El-Horeya Road, El Atareen, Alexandria
Old Sultan Hussein 33 Sultan Hussein Street, Alexandria
116 117
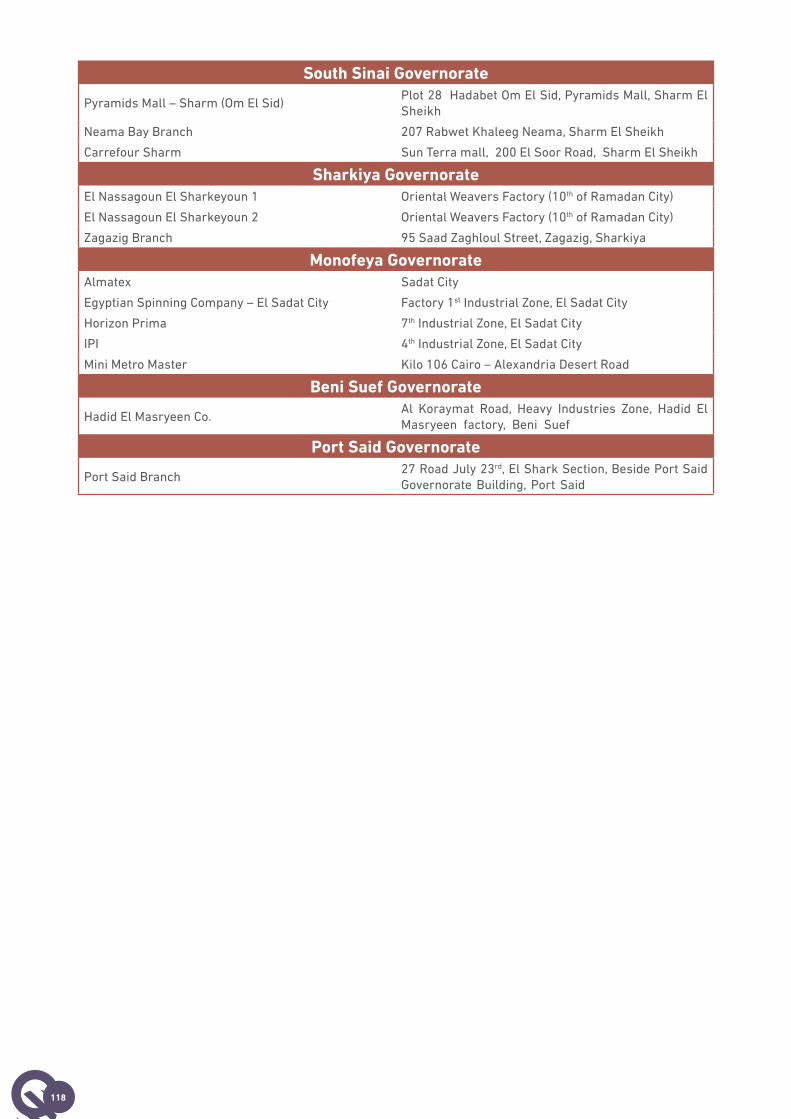
South Sinai Governorate
Pyramids Mall – Sharm (Om El Sid)Plot 28 Hadabet Om El Sid, Pyramids Mall, Sharm El Sheikh
Neama Bay Branch 207 Rabwet Khaleeg Neama, Sharm El Sheikh
Carrefour Sharm Sun Terra mall, 200 El Soor Road, Sharm El Sheikh
Sharkiya GovernorateEl Nassagoun El Sharkeyoun 1 Oriental Weavers Factory (10th of Ramadan City)
El Nassagoun El Sharkeyoun 2 Oriental Weavers Factory (10th of Ramadan City)
Zagazig Branch 95 Saad Zaghloul Street, Zagazig, Sharkiya
Monofeya GovernorateAlmatex Sadat City
Egyptian Spinning Company – El Sadat City Factory 1st Industrial Zone, El Sadat City
Horizon Prima 7th Industrial Zone, El Sadat City
IPI 4th Industrial Zone, El Sadat City
Mini Metro Master Kilo 106 Cairo – Alexandria Desert Road
Beni Suef Governorate
Hadid El Masryeen Co.Al Koraymat Road, Heavy Industries Zone, Hadid El Masryeen factory, Beni Suef
Port Said Governorate
Port Said Branch27 Road July 23rd, El Shark Section, Beside Port Said Governorate Building, Port Said
118