overview - doing business 2 doing business 2018 register online for value added tax; this costs...
TRANSCRIPT
Doing Business 2018
� Doing Business uses 11 indicator sets to measure aspects of business regulation that matter for entrepreneurship.
� Although good regulatory practices can be found around the world, they are most common in OECD high-income economies and the economies of Europe and Central Asia.
� Sub-Saharan Africa has the widest variation in performance among the areas measured by Doing Business, with Mauritius standing at 25 in the ranking and Somalia at 190.
� South Asia is the only region not represented in the top 50 ranking for ease of doing business. However, India stands out this year as one of the 10 economies that improved the most in the areas measured by Doing Business.
� The regions with the highest share of reforming economies in Doing Business 2018 are Europe and Central Asia, South Asia and Sub-Saharan Africa.
� Crises are opportunities for reform; economies are more likely to implement regulatory reforms in the areas measured by Doing Business when there is fiscal distress. Evidence shows that an economic crisis creates a stronger motivation for reform than a change of government.
� Better performance in Doing Business is associated with lower levels of unemployment and poverty.
This year marks the 15th Doing Business report. Since the inception of the project in 2003, the global business regulatory environment has changed dramatically. Governments around the world have embraced and nurtured advances in information technology to reduce bureaucratic hurdles and increase transparency. Today, in 65 of the 190 economies covered by Doing Business, entrepreneurs can complete at least one business incorporation procedure online, compared with only nine of the 145 economies measured in Doing Business 2004. Furthermore, in 31 economies it is now possible to initiate a commercial dispute online. This kind of progress can also be observed in the other areas measured by Doing Business.
Doing Business measures aspects of business regulation and their impli-cations for firm establishment and operations. It does not include all the issues that are relevant for busi-nesses’ decisions, but it does cover important areas that are under the control of policy makers. Governments worldwide recognize the economic and political benefits of improved business regulation. In fact, 119 of the 190 economies measured by Doing Business 2018 enacted at least one business regulation reform in 2016/17. Of these, 79.8% implemented at least one reform for a second consecutive year and 64.7% for a third.
Business regulation can enable new ideas to come to life. When a software engineer realizes that she can develop a better and less-expensive product than is currently available, she may choose to start her own company to develop the idea. She will be more likely to become an entrepreneur in an economy where the rules governing start-ups are accessible, transparent
and predictable. Conversely, in an economy where business regula-tion is cumbersome or ambiguous, she may be less willing to start her own company. In this case, the economy forfeits a new entrepreneur —as well as the associated capital investment and job creation. In turn, consumers have fewer, lower quality and more expensive product choices. Such a scenario highlights the way in which cumbersome regulation can distort resource allocation by stifling entrepreneurial endeavors in favor of maintaining a less optimal status quo.
Consider the case of the potential software entrepreneur. If she were a national of Canada, it would take just two procedures, one and a half days and less than 1% of income per capita to start her business in Toronto. First, she would need to file for federal incor-poration and provincial registration online via Industry Canada’s Electronic Filing Centre; this costs 200 Canadian dollars ($159) and is completed within a day. Second, she would need to
Overview
DOING BUSINESS 20182
register online for value added tax; this costs nothing and is completed within half a day. She can perform these steps online from the comfort of her home. As her business expands and becomes profitable, she would be expected to pay 20.9% of her commercial profits in taxes and contributions annually. However, if the same entrepreneur were a national of the Philippines, living in Quezon City, the business incorporation process would require 16 procedures, take 28 days and cost around 16% of income per capita. She would need to make 20 different tax and contribution payments and visit multiple agencies in person. Furthermore, her business would be expected to pay 42.9% of its commercial profits in taxes and contributions annually. Cumbersome business regulatory structures such as these constrain the ability of entre-preneurs to transform their ideas into viable businesses.
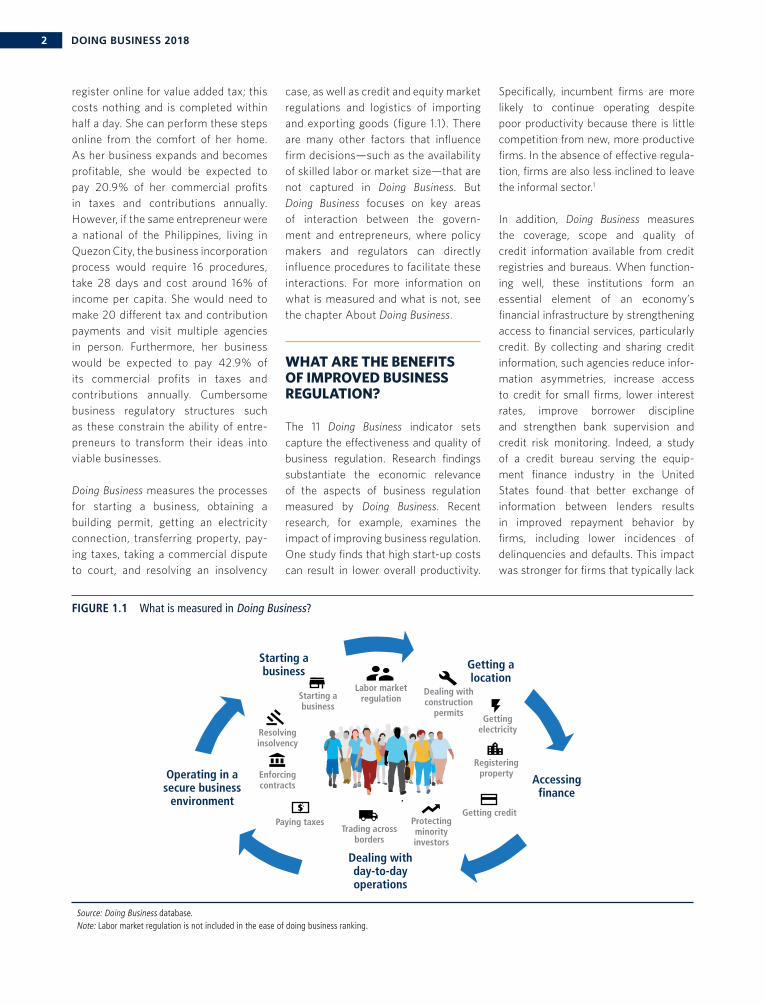
Doing Business measures the processes for starting a business, obtaining a building permit, getting an electricity connection, transferring property, pay-ing taxes, taking a commercial dispute to court, and resolving an insolvency
case, as well as credit and equity market regulations and logistics of importing and exporting goods (figure 1.1). There are many other factors that influence firm decisions—such as the availability of skilled labor or market size—that are not captured in Doing Business. But Doing Business focuses on key areas of interaction between the govern-ment and entrepreneurs, where policy makers and regulators can directly influence procedures to facilitate these interactions. For more information on what is measured and what is not, see the chapter About Doing Business.
WHAT ARE THE BENEFITS OF IMPROVED BUSINESS REGULATION?
The 11 Doing Business indicator sets capture the effectiveness and quality of business regulation. Research findings substantiate the economic relevance of the aspects of business regulation measured by Doing Business. Recent research, for example, examines the impact of improving business regulation. One study finds that high start-up costs can result in lower overall productivity.
Specifically, incumbent firms are more likely to continue operating despite poor productivity because there is little competition from new, more productive firms. In the absence of effective regula-tion, firms are also less inclined to leave the informal sector.1
In addition, Doing Business measures the coverage, scope and quality of credit information available from credit registries and bureaus. When function-ing well, these institutions form an essential element of an economy’s financial infrastructure by strengthening access to financial services, particularly credit. By collecting and sharing credit information, such agencies reduce infor-mation asymmetries, increase access to credit for small firms, lower interest rates, improve borrower discipline and strengthen bank supervision and credit risk monitoring. Indeed, a study of a credit bureau serving the equip-ment finance industry in the United States found that better exchange of information between lenders results in improved repayment behavior by firms, including lower incidences of delinquencies and defaults. This impact was stronger for firms that typically lack
FIGURE 1.1 What is measured in Doing Business?
Operating in asecure business
environment
Starting abusiness Getting a
location
Accessingfinance
Dealing withday-to-dayoperations
Resolvinginsolvency
Enforcingcontracts
Paying taxesTrading across
borders
Protectingminorityinvestors
Getting credit
Registeringproperty
Gettingelectricity
Labor marketregulationStarting a
business
Dealing withconstruction
permits
Source: Doing Business database.Note: Labor market regulation is not included in the ease of doing business ranking.

3OVERVIEW
informational transparency, such as small and young firms.2
Doing Business places emphasis on the quality of legal infrastructure and the strength of legal institutions. The pro-tecting minority investors indicator set, for example, measures the protection of minority shareholders. For businesses to secure equity finance, legal mechanisms are needed to prevent the use of corporate assets by company insiders for personal gain—especially during financial crises or times of market distress. Research has shown that during the 2008 global financial crisis, for example, companies in economies with better investor protec-tions and stronger corporate governance experienced a smaller decrease in their market value. Conversely, firms in econo-mies with weak legal structures saw a more significant decline in value.3
The Doing Business indicators on resolv-ing insolvency provide evidence of a strong relationship between regula-tory quality and efficient outcomes. The indicator set measures the qual-ity of regulation as the recovery rate for secured creditors and the extent to which domestic law has incorporated certain internationally-accepted prin-ciples on liquidation and reorganization proceedings. Efficient outcomes occur when viable businesses are given a chance to survive, while loss-prone, inefficient firms exit the market, putting resources to better use elsewhere in the economy. In the absence of strong legal bankruptcy legislation, however, the balance between firm survival and efficient exit is distorted. This distortion was highlighted by research using data from Hungary, where the majority of firms in bankruptcy were preserved and allowed to continue operating as going concerns—despite generating sub-stantial operating losses and resulting in low recovery rates for creditors. The main cause of this distortion was the inadequate allocation of control rights between secured and unsecured credi-tors, which decreased the recovery value
by not allowing creditors to take impor-tant decisions related to the company assets during insolvency procedures. Another cause was the establishment of a compensation scheme for agents man-aging bankruptcy proceedings based on assets sold and operating revenues of a firm, which created a significant increase in the cost of bankruptcy procedures and reduced creditors’ recovery rate.4
In the area of cross-border trade, Doing Business measures the effectiveness of trade logistics. Several studies have underscored the importance of port automation and efficiency for both trade facilitation and regional economic development. These studies have found that ports that are more automated require less maintenance, are more cost-effective and ensure better worker safety. Furthermore, a study of the determinants of shipping costs from Latin America to the United States found that—for most exporting econo-mies—high transportation costs pose even greater barriers to trade than import tariffs, and that port inefficien-cies significantly add to these costs. One of the most striking findings is that by improving port efficiency from the 25th to the 75th percentile, shipping costs are lowered by 12%, substantially increasing the volume of bilateral trade.5 One of the principal causes of port inefficiency is excessive regulation—precisely what Doing Business advocates to curb.
WHERE IS BUSINESS REGULATION BETTER?
The overall measure of the ease of doing business gives an indication of where it is easier for domestic small and medium-size firms to do business. Although the economies with the most business-friendly regulation in this year’s ease of doing business ranking are relatively diverse, the economies within the top 20 share some common features. Fourteen of the top 20 are OECD high-income economies; three are from Europe and
Central Asia and three from East Asia and the Pacific. Eighteen of the top 20 are classified as high-income economies. The top 5 performers are New Zealand, Singapore, Denmark, the Republic of Korea and Hong Kong SAR, China. The former Yugoslav Republic of Macedonia is the only upper-middle-income economy on the list, while Georgia is the only low-er-middle-income one (table 1.1). To date, no low-income economy has reached the top 20 group. However, being wealthy does not guarantee a front-runner posi-tion in the ease of doing business ranking; many high-income economies still have room for progress. Having few bureau-cratic hurdles, robust legal institutions and laws and regulations that are based on international good practices is what matters most for a good performance in the ease of doing business ranking.
Among the top 20 economies, Georgia, with a ranking of 9, has implemented the highest number of business regulation reforms since the launch of Doing Business in 2003—a total of 47. With 41, FYR Macedonia has carried out the second highest number of reforms among the top 20. During the same period, Latvia and Lithuania have also actively reformed their business regulatory environments, with 28 and 31 reforms respectively. Among other reforms, Lithuania has made six reforms to its business incor-poration processes, five reforms to bankruptcy proceedings and four reforms to its taxation system. Many other top-ranked economies have followed this pat-tern of continuous reform, demonstrating that comprehensive reform efforts can lead to considerable improvements in an economy’s regulatory and business envi-ronment. Another feature that the top 20 economies have in common—albeit not measured by Doing Business—is that on average they have higher labor force participation rates and lower levels of income inequality. Indeed, the average Gini coefficient6 of the top 20 economies is 0.3 (with 0 representing perfect equal-ity and 1 representing perfect inequality), compared to 0.4 for the lowest 20.7

DOING BUSINESS 20184
TABLE 1.1 Ease of doing business ranking
DB 2018 Rank Economy
DTF score
DTF change
DB 2018 Rank Economy
DTF score
DTF change
DB 2018 Rank Economy
DTF score
DTF change
1 New Zealand 86.55 -0.18 65 Albania 68.70 + 0.96 129 St. Vincent and the Grenadines 55.72 +0.012 Singapore 84.57 +0.04 66 Bahrain 68.13 +0.01 130 Palau 55.58 +0.463 Denmark 84.06 -0.01 67 Greece 68.02 +0.01 131 Nicaragua 55.39 +0.094 Korea, Rep. 83.92 0.00 68 Vietnam 67.93 +2.85 132 Barbados 55.20 -0.095 Hong Kong SAR, China 83.44 +0.29 69 Morocco 67.91 -0.03 133 Lebanon 54.67 -0.106 United States 82.54 -0.01 70 Jamaica 67.27 +0.57 134 St. Kitts and Nevis 54.52 +0.187 United Kingdom 82.22 -0.12 71 Oman 67.20 +0.08 135 Cambodia 54.47 +0.238 Norway 82.16 -0.25 72 Indonesia 66.47 +2.25 136 Maldives 54.42 +0.649 Georgia 82.04 +2.12 73 El Salvador 66.42 +3.54 137 Tanzania 54.04 +0.11
10 Sweden 81.27 +0.03 74 Uzbekistan 66.33 +4.46 138 Mozambique 54.00 +0.9711 Macedonia, FYR 81.18 -0.21 75 Bhutan 66.27 +1.06 139 Côte d'Ivoire 53.71 +2.0412 Estonia 80.80 +0.05 76 Ukraine 65.75 +1.90 140 Senegal 53.06 +3.7513 Finland 80.37 -0.11 77 Kyrgyz Republic 65.70 +0.54 141 Lao PDR 53.01 +0.4314 Australia 80.14 0.00 78 China 65.29 +0.40 142 Grenada 52.94 -0.1115 Taiwan, China 80.07 +0.41 79 Panama 65.27 +1.25 143 Mali 52.92 +0.3016 Lithuania 79.87 +1.05 80 Kenya 65.15 +2.59 144 Niger 52.34 +2.2617 Ireland 79.51 -0.19 81 Botswana 64.94 +0.07 145 Nigeria 52.03 +3.8518 Canada 79.29 -0.09 82 South Africa 64.89 -0.08 146 Gambia, The 51.92 -0.0119 Latvia 79.26 -0.79 83 Qatar 64.86 +0.61 147 Pakistan 51.65 +0.7120 Germany 79.00 -0.19 84 Malta 64.72 +0.43 148 Burkina Faso 51.54 +0.2021 United Arab Emirates 78.73 +1.87 85 Zambia 64.50 +3.92 149 Marshall Islands 51.45 +0.0322 Austria 78.54 -0.15 86 Bosnia and Herzegovina 64.20 +0.42 150 Mauritania 50.88 +1.5623 Iceland 78.50 +0.01 87 Samoa 63.89 +2.06 151 Benin 50.47 +1.8524 Malaysia 78.43 +0.96 88 Tunisia 63.58 -0.20 152 Bolivia 50.18 +0.3225 Mauritius 77.54 +2.09 89 Tonga 63.43 +0.50 153 Guinea 49.80 +0.3226 Thailand 77.44 +5.68 90 Vanuatu 63.08 +0.02 154 Djibouti 49.58 +3.9927 Poland 77.30 +0.18 91 St. Lucia 62.88 +0.01 155 Micronesia, Fed. Sts. 48.99 +0.0128 Spain 77.02 0.00 92 Saudi Arabia 62.50 +2.92 156 Togo 48.88 +0.6429 Portugal 76.84 -0.14 93 San Marino 62.47 -0.03 157 Kiribati 48.74 -0.3130 Czech Republic 76.27 +0.03 94 Uruguay 61.99 +0.35 158 Comoros 48.52 +0.4731 France 76.13 -0.06 95 Seychelles 61.41 +1.01 159 Zimbabwe 48.47 +0.8032 Netherlands 76.03 +0.51 96 Kuwait 61.23 +1.52 160 Sierra Leone 48.18 -0.0633 Switzerland 75.92 +0.19 97 Guatemala 61.18 -0.43 161 Ethiopia 47.77 +2.0834 Japan 75.68 +0.07 98 Dominica 60.96 +0.34 162 Madagascar 47.67 +3.0535 Russian Federation 75.50 +0.81 99 Dominican Republic 60.93 +2.52 163 Cameroon 47.23 +2.1836 Kazakhstan 75.44 +1.06 100 India 60.76 +4.71 164 Burundi 46.92 +0.0637 Slovenia 75.42 +0.99 101 Fiji 60.74 +0.04 165 Suriname 46.87 +0.1138 Belarus 75.06 +0.55 102 Trinidad and Tobago 60.68 -0.19 166 Algeria 46.71 -0.0139 Slovak Republic 74.90 -0.25 103 Jordan 60.58 +2.38 167 Gabon 46.19 +1.3340 Kosovo 73.49 +4.98 104 Lesotho 60.42 +0.54 168 Iraq 44.87 +0.4841 Rwanda 73.40 +3.21 105 Nepal 59.95 +2.35 169 São Tomé and Príncipe 44.84 +0.3942 Montenegro 73.18 +1.64 106 Namibia 59.94 +0.54 170 Sudan 44.46 +0.1743 Serbia 73.13 +0.26 107 Antigua and Barbuda 59.63 +0.98 171 Myanmar 44.21 +0.3044 Moldova 73.00 +0.20 108 Paraguay 59.18 +0.06 172 Liberia 43.55 +3.1045 Romania 72.87 +0.17 109 Papua New Guinea 59.04 +0.17 173 Equatorial Guinea 41.66 +1.7746 Italy 72.70 +1.15 110 Malawi 58.94 +6.33 174 Syrian Arab Republic 41.55 +0.0847 Armenia 72.51 +0.59 111 Sri Lanka 58.86 +0.13 175 Angola 41.49 +1.3848 Hungary 72.39 +0.26 112 Swaziland 58.82 +0.25 176 Guinea-Bissau 41.45 +0.2349 Mexico 72.27 +0.18 113 Philippines 58.74 +0.42 177 Bangladesh 40.99 +0.1550 Bulgaria 71.91 +0.10 114 West Bank and Gaza 58.68 +3.80 178 Timor-Leste 40.62 -0.0751 Croatia 71.70 +0.05 115 Honduras 58.46 -0.07 179 Congo, Rep. 39.57 -0.5252 Belgium 71.69 -0.23 116 Solomon Islands 58.13 -0.01 180 Chad 38.30 -0.2853 Cyprus 71.63 -0.49 117 Argentina 58.11 +0.07 181 Haiti 38.24 +0.0154 Israel 71.42 +0.05 118 Ecuador 57.83 -0.01 182 Congo, Dem. Rep. 37.65 +0.2255 Chile 71.22 +0.37 119 Bahamas, The 57.47 +0.82 183 Afghanistan 36.19 -1.8056 Brunei Darussalam 70.60 +5.83 120 Ghana 57.24 +0.34 184 Central African Republic 34.86 +0.7857 Azerbaijan 70.19 +3.12 121 Belize 57.11 +0.03 185 Libya 33.21 +0.0358 Peru 69.45 +0.01 122 Uganda 56.94 +0.42 186 Yemen, Rep. 33.00 +0.0659 Colombia 69.41 -0.11 123 Tajikistan 56.86 +0.93 187 South Sudan 32.86 -0.3360 Turkey 69.14 +1.16 124 Iran, Islamic Rep. 56.48 +0.26 188 Venezuela, RB 30.87 -0.7961 Costa Rica 69.13 +1.23 125 Brazil 56.45 +0.38 189 Eritrea 22.87 +0.4262 Mongolia 69.03 +1.27 126 Guyana 56.28 +0.39 190 Somalia 19.98 -0.3163 Luxembourg 69.01 +0.35 127 Cabo Verde 56.24 +0.4264 Puerto Rico (U.S.) 68.85 +0.05 128 Egypt, Arab Rep. 56.22 +0.10
Source: Doing Business database.Note: The DB 2018 rankings are benchmarked to June 2017 and based on the average of each economy’s distance to frontier (DTF) scores for the 10 topics included in the aggregate ranking. For the economies for which the data cover two cities, scores are a population-weighted average for the two cities. A positive change indicates an improvement in the score between 2016 and 2017 (and therefore an improvement in the overall business environment as measured by Doing Business), while a negative change indicates a deterioration and 0.00 indicates no change in the score.

5OVERVIEW
What can the Doing Business 2018 data tell us about global patterns? Good regulatory practices are present in almost all of the world’s regions. Aside from 28 OECD high-income economies, the 50 highest-ranked economies include 13 from Europe and Central Asia, five from East Asia and the Pacific, two from Sub-Saharan Africa and one each from the regions of Latin America and the Caribbean and the Middle East and North Africa. Each region also has a relatively wide spectrum of strong and weak performers. Economies are ranked based on the distance to frontier score. This measure shows the distance of each economy to the “frontier,” which represents the best performance observed on each of the indicators across all econo-mies in the Doing Business sample (box 1.1). In OECD high-income economies, for example, New Zealand, Denmark and Korea have the highest overall distance to frontier scores at 86.55, 84.06 and 83.92, respectively. Conversely, Greece, Luxembourg and Chile have the lowest scores in this group, at 68.02, 69.01 and 71.22. However, the OECD high-income group has the smallest gap between the highest and the lowest scores, of only 18.53 percentage points (figure 1.2). Sub-Saharan Africa has the widest gap (57.56 percentage points), with a regional average score of only 50.43—the lowest
across all regions. Among the economies of Sub-Saharan Africa, Mauritius has the highest distance to frontier score (77.54), while Somalia the lowest (19.98).
Regional rankings across different Doing Business indicator sets also show large variations. South Asia, for example—the only region not represented in the top 50 list—scores comparatively well for starting a business, with an average distance to frontier score of 83.27. In contrast, South Asia’s regional average score for resolving
insolvency is only 33.04. Indeed, Doing Business data show considerable varia-tion in performance between economies within the same region and within the same regulatory area. Within South Asia, India has the highest score (80) for pro-tecting minority investors compared to Afghanistan’s score of 10. Similarly, there is a substantial difference in scores between economies in the Middle East and North Africa region. Malta, for example, has a distance to frontier score for trading across borders of 91.01, while Algeria only scores 24.15. Interestingly, all regions have at least one economy in the top 20 ranking on the protecting minority inves-tors indicators and all regions—except the OECD high-income group—have at least one economy in the bottom 20 ranking on the protecting minority investors indica-tors. These patterns indicate that there is further room for improvement across all regions and at all income levels.
WHICH ECONOMIES IMPROVED THE MOST IN DOING BUSINESS 2018?
Doing Business 2018 captures 264 busi-ness regulation reforms across the 10 measured indicator sets. As in previous years, Sub-Saharan Africa is the region
BOX 1.1 What is the distance to frontier score?Doing Business measures many different dimensions of business regulation. To combine measures with different units such as the number of days to obtain a construction permit and the number of procedures to start a business into a sin-gle score, Doing Business computes the distance to frontier score. The distance to frontier score captures the gap between an economy’s current performance and the best practice across the entire sample of 41 indicators across 10 Doing Business indicator sets. For example, according to the Doing Business database across all economies and over time, the least time to start a business is 0.5 days while in the worst 5% of cases it takes more than 100 days to incorporate a company. Half a day is, therefore, considered the frontier of best performance, while 100 days is the worst. Higher distance to frontier scores show absolute better ease of doing business (as the frontier is set at 100 percentage points), while lower scores show absolute poorer ease of doing business (the worst performance is set at 0 per-centage points). The percentage point distance to frontier scores of an economy on different indicators are averaged to obtain an overall distance to frontier score. For more details, see the chapter on the distance to frontier and ease of doing business ranking.
FIGURE 1.2 Where it is easier to do business and where it is more difficult
0
20
40
60
80
100
Distance to frontier score (0–100)
Highest score Lowest score Average score
OECDhigh income
Europe &Central Asia
East Asia& Pacific
Middle East& North Africa
Latin America& Caribbean
South Asia Sub-SaharanAfrica
Source: Doing Business database.

DOING BUSINESS 20186
with the highest number of reforms (83 in total), followed by East Asia and the Pacific (45) and Europe and Central Asia (44). The regions with the highest share of reforming economies are Europe and Central Asia (79%), South Asia (75%) and Sub-Saharan Africa (79%), while the OECD high-income group has the lowest share (46%). The indicator sets for start-ing a business and getting credit record the highest number of reforms (38 each) in 2016/17. They are closely followed by the trading across borders indicator set with 33 reforms. The least-reformed areas as captured by Doing Business continue to be the indicators with a legal focus—for example, resolving insolvency (13 reforms) and enforcing contracts (20). Legal reforms are typically slow to advance, mainly because they require long-term political commitments, sub-stantial resources and close collaboration between multiple regulatory agencies and rulemaking institutions.
It is important to look at both the num-ber of reforms and their impact on the distance to frontier score because they provide different information. The number of reforms indicates how many areas an
economy chose to target for improve-ment, while the change in the distance to frontier score indicates the size of the impact those changes had on the Doing Business data. Across all economies, the average distance to frontier score increase is 0.76 percentage points, with the highest regional increase in Sub-Saharan Africa (1.18), although this region does not have the highest percentage of economies implementing at least one business regulatory reform. Nevertheless, there is a strong correlation between the number of reforms and the actual improvement in the distance to frontier score.8 Doing Business data show that it has become easier for small and medium-size enterprises to do business in 62.6% of economies worldwide (or 119 of the 190 economies measured by Doing Business).
While economies in the Sub-Saharan Africa region show the highest aver-age increase in the distance to frontier score, economies in the OECD high-income group have the lowest average increase (0.11 percentage points). This is not surprising as most OECD high-income economies are already near to global good practices. The Doing Business
indicator sets capturing the most busi-ness regulation reforms across regions in 2016/17 are paying taxes and trading across borders. Indeed, the reform agen-das of OECD high-income and East Asia and the Pacific economies appear to be dominated by regulatory changes cap-tured by the paying taxes indicator set (figure 1.3). Lower-middle-income econo-mies have the highest average reform count at 1.9 reforms each; low-income economies are second highest at 1.3 reforms. Unsurprisingly, high-income economies recorded the lowest average reform count (1).
Of the 10 economies showing the most improvement in performance on the Doing Business indicators, three are from Sub-Saharan Africa, two from East Asia and the Pacific, two from Europe and Central Asia, one from Latin America and the Caribbean, one from the Middle East and North Africa and one from South Asia. Brunei Darussalam, the only high-income economy on the list of top 10 improv-ers, showed the largest advance toward the global good practice frontier after implementing eight reforms in 2016/17; it joins this list for the second year in a
FIGURE 1.3 The average number of reforms per economy is highest in South Asia but the average impact is biggest in Sub-Saharan Africa
0.0
0.5
1.0
1.5
2.0
2.5
3.0
Number of reforms and change in distance to frontier score(average number per economy)
Average number of reforms making it easier to do businessAverage number of reforms making it more difficult to do businessAverage change in distance to frontier score
OECDhigh income
Europe &Central Asia
East Asia &Pacific
SouthAsia
Middle East &North Africa
Latin America &Caribbean
Most commontopic of reform
by region
Sub-SaharanAfrica
Protectingminorityinvestors
Payingtaxes
Registeringproperty
Gettingcredit
Tradingacrossborders
Payingtaxes
Startinga business;
Trading acrossborders
Source: Doing Business database.Note: The average change in the distance to frontier score shows the change between Doing Business 2018 and Doing Business 2017.

7OVERVIEW
row. El Salvador, India, Malawi, Nigeria and Thailand also made impressive strides and joined the 10 top improvers for the first time. Among top improvers, Brunei Darussalam, India and Thailand implemented the highest number of busi-ness regulation reforms in 2016/17, with eight reforms each. The remaining four economies in the list of top improvers are: Kosovo, Uzbekistan, Zambia and Djibouti. For details on the reforms these countries undertook, see the chapter on reforming the business environment in 2016/17.
The database of Doing Business reforms indicates differences in reform momen-tum, both within topics and across regions. Why are reforms more common in some years than others? When do economies tend to reform in the areas covered in Doing Business? Two main theories explain the timing of regulatory reform. The first suggests that economies reform when they must—that is, when there is no choice but to implement a regulatory change. In this case, an increase in reforms would be more likely during crises.9 A sec-ond theory argues that economies reform when they can—that is, when govern-ments are recently elected and are in the “honeymoon period.”10
Doing Business data can be used to explore which theory is more likely to hold true in practice. Recent research shows that governments are more likely to reform business regulation when their economy is experiencing a fiscal crisis.11 This is particularly true for regulation concern-ing resolving insolvency, which showed a spike in reform activity in 2010/11,12 a couple of years after the 2008/09 finan-cial crisis. The reason is that these kinds of reforms take time to be implemented and captured by Doing Business (figure 1.4). However, the effect of fiscal crises on reform intensity is less robust when public debt is lower. When a fiscal crisis can be solved—albeit temporar-ily—by increasing borrowing, the need for reform becomes less urgent. In contrast, the “honeymoon” theory of reforms has less evidence to support
it. In general, political change is not associated with more reform unless the political change takes place after the fiscal crisis. Indeed, economies tend to reform when they must, rather than when they can.
WHAT IMPACT DOES BUSINESS REGULATION HAVE ON EMPLOYMENT AND POVERTY?
Many factors explain poverty. These can include vulnerability to natural disasters, remoteness, quality of gov-ernance, property rights, availability of infrastructure and services, proximity to markets, social relationships, the gender of the head of household, employment status, hours worked, property owned and educational attainment.13 Several of these factors have a direct link to the areas measured in Doing Business since the Doing Business indicators measure factors such as the quality of governance and property rights. Furthermore, Doing Business can have an indirect link to these factors as improvements to business regulation can drive additional job cre-ation. And ultimately, as a reliable source of income, employment can lift people out of poverty.
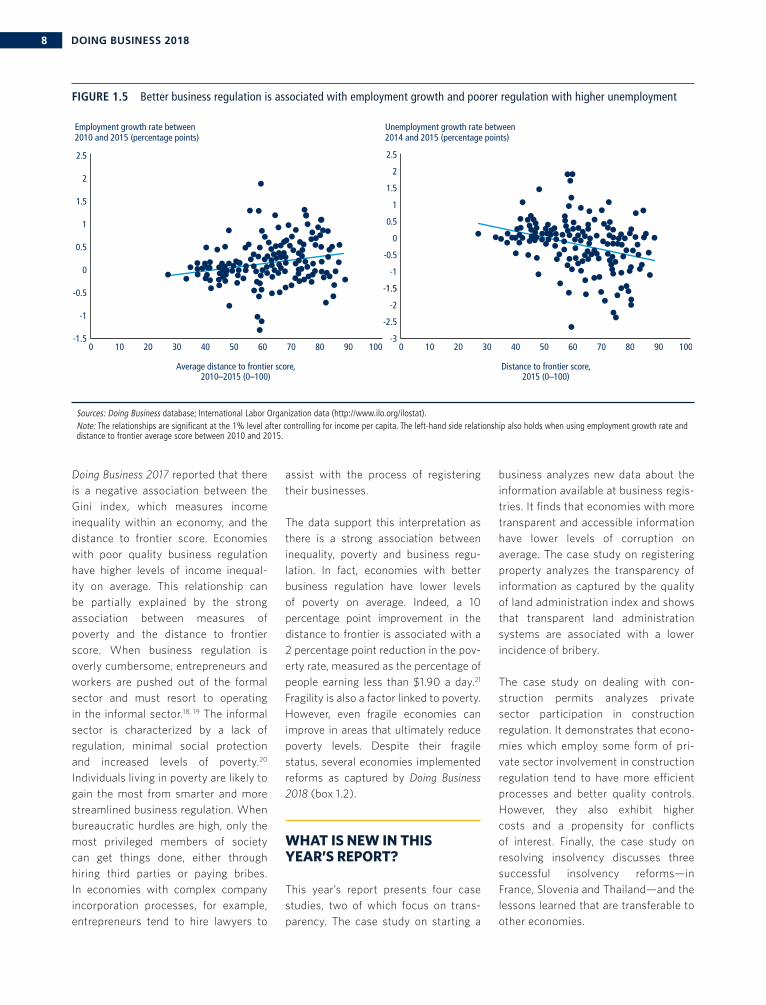
Reforming in the areas measured by Doing Business can be particularly ben-eficial to employment creation when those reforms take place in the areas of starting a business and labor market regulation.14 Such an assertion, how-ever, is made with some caveats from other research exploring causal relation-ships between business entry regulation and job creation.15 Nonetheless, one of the mechanisms through which busi-ness regulation can impact employment directly is the simplification of business start-up regulations. Across economies there is a significant positive association between employment growth and the distance to frontier score (figure 1.5). While this result shows an association, and cannot be interpreted in a causal fashion, it is reassuring to see that economies with better business regula-tion, as measured by Doing Business, also tend to be the economies that are creating more job opportunities.16 When it comes to unemployment, the expected opposite result is evident. Economies with less streamlined busi-ness regulation are those with higher levels of unemployment on average. In fact, a one-point improvement in the distance to frontier score is associated with a 0.02 percentage point decline in unemployment growth rate.17
FIGURE 1.4 Reform intensity tends to rise in response to crises
0.00
0.02
0.04
0.06
0.08
0.10
0.12
0.14
0.16
0.18
DB20
05
DB20
06
DB20
07
DB20
08
DB20
09
DB20
10
DB20
11
DB20
12
DB20
13
DB20
14
DB20
15
DB20
16
DB20
17
DB20
18
Resolving insolvency reforms(average number per economy)
Source: Djankov, Georgieva and Ramalho 2017a.
DOING BUSINESS 20188
Doing Business 2017 reported that there is a negative association between the Gini index, which measures income inequality within an economy, and the distance to frontier score. Economies with poor quality business regulation have higher levels of income inequal-ity on average. This relationship can be partially explained by the strong association between measures of poverty and the distance to frontier score. When business regulation is overly cumbersome, entrepreneurs and workers are pushed out of the formal sector and must resort to operating in the informal sector.18, 19 The informal sector is characterized by a lack of regulation, minimal social protection and increased levels of poverty.20
Individuals living in poverty are likely to gain the most from smarter and more streamlined business regulation. When bureaucratic hurdles are high, only the most privileged members of society can get things done, either through hiring third parties or paying bribes. In economies with complex company incorporation processes, for example, entrepreneurs tend to hire lawyers to
assist with the process of registering their businesses.
The data support this interpretation as there is a strong association between inequality, poverty and business regu-lation. In fact, economies with better business regulation have lower levels of poverty on average. Indeed, a 10 percentage point improvement in the distance to frontier is associated with a 2 percentage point reduction in the pov-erty rate, measured as the percentage of people earning less than $1.90 a day.21 Fragility is also a factor linked to poverty. However, even fragile economies can improve in areas that ultimately reduce poverty levels. Despite their fragile status, several economies implemented reforms as captured by Doing Business 2018 (box 1.2).
WHAT IS NEW IN THIS YEAR’S REPORT?
This year’s report presents four case studies, two of which focus on trans-parency. The case study on starting a
business analyzes new data about the information available at business regis-tries. It finds that economies with more transparent and accessible information have lower levels of corruption on average. The case study on registering property analyzes the transparency of information as captured by the quality of land administration index and shows that transparent land administration systems are associated with a lower incidence of bribery.
The case study on dealing with con-struction permits analyzes private sector participation in construction regulation. It demonstrates that econo-mies which employ some form of pri-vate sector involvement in construction regulation tend to have more efficient processes and better quality controls. However, they also exhibit higher costs and a propensity for conflicts of interest. Finally, the case study on resolving insolvency discusses three successful insolvency reforms—in France, Slovenia and Thailand—and the lessons learned that are transferable to other economies.
FIGURE 1.5 Better business regulation is associated with employment growth and poorer regulation with higher unemployment
1
2
0
1.5
2.5
0.5
-0.5
-1
-1.50 10 20 30 40 50 60 70 80 90 100
Employment growth rate between2010 and 2015 (percentage points)
Average distance to frontier score,2010–2015 (0–100)
0
-0.5
1
0.5
1.5
2.5
2
-1
-1.5
-2
-2.5
-30 10 20 30 40 50 60 70 80 90 100
Unemployment growth rate between2014 and 2015 (percentage points)
Distance to frontier score,2015 (0–100)
Sources: Doing Business database; International Labor Organization data (http://www.ilo.org/ilostat).Note: The relationships are significant at the 1% level after controlling for income per capita. The left-hand side relationship also holds when using employment growth rate and distance to frontier average score between 2010 and 2015.

9OVERVIEW
BOX 1.2 Crises as opportunities?
Fragile states, often characterized by weak governance, residual violence, concentrated poverty and inequality, face myriad devel-opment and humanitarian challenges. Depleted human capital, minimal rule of law and violence all contribute to significant—and often extreme—rates of poverty in fragile states.a While fragile states are not home to the majority of the world’s poor, the poor are disproportionately located in fragile states,b underscoring the need to address poverty in these economies. In poor and fragile states, the private sector is often constrained by a lack of infrastructure, political instability, high rates of informality and poor business skills. Private sector job creation is one of the factors that can diminish the incentives to engage in violence, thereby reducing both fragility and poverty.c
Doing Business data show that fragile economies are reforming and approaching crises as opportunities for better business regulations. As a result, the gap with non-fragile economies in some areas of business regulation has been narrowing over time (see figure). In 2016/17, of the 34 economies classified as most vulnerable by the World Bank Group’s 2017 Harmonized List of Fragile Situations,d 14 implemented at least one business regulation reform and six economies implemented two reforms or more. Getting credit was the most reformed area of business regulation, accounting for eight of the 24 reforms implemented by this group. Djibouti recorded five reforms, the highest number among all fragile states. Djibouti reduced the fees associ-ated with starting a business and construction inspections, implemented decennial liability for all professionals involved in construction projects, increased the transparency of its land administration system and established a new credit information system. As a result of these reforms, Djibouti’s distance to frontier score improved by 3.79 percentage points.
Kosovo, the second most-reformed country in the fragile states group, implemented three business regulation reforms. Iraq, Madagascar, Myanmar, and Sierra Leone made two reforms each in 2016/17. Iraq simplified the process of starting a business by combining multiple registration procedures and reducing the time to register a company. It also launched a new credit registry, improving access to credit information. Similarly, Myanmar adopted a regulation that allows the creation of credit bureaus, while Madagascar increased the coverage of its credit registry. Kosovo and Liberia undertook reforms in the area of resolving insolvency in 2016/17. Both of these economies introduced a legal framework for corporate insolvency, making liquidation and reorganization procedures available to debtors and creditors. a. World Bank 2011.b. Burt, Hughes and Milante 2014.c. Collier and Hoeffler 2004. d. The harmonized list also includes Tuvalu, the only economy from the list that is not measured by Doing Business.
Fragile states are converging with non-fragile states on the cost to register property and start a business
Source: Doing Business database.Note: Fragile states are classified based on the World Bank Group’s Harmonized List of Fragile Situations for fiscal year 2017. The sample includes 174 economies where data is available back to Doing Business 2006.
0
2
4
6
8
10
12
14
DB20
06
DB20
07
DB20
08
DB20
09
DB20
10
DB20
11
DB20
12
DB20
13
DB20
14
DB20
15
DB20
16
DB20
17
DB20
18
DB20
06
DB20
07
DB20
08
DB20
09
DB20
10
DB20
11
DB20
12
DB20
13
DB20
14
DB20
15
DB20
16
DB20
17
DB20
18
Average cost to register property(% of property value)
0
100
200
300
400
500
600
Average paid-in minimum capitalrequirement (% of income per capita)
Non-fragile states Fragile states Non-fragile states Fragile states
DOING BUSINESS 201810
NOTES
1. Moscoso Boedo and Mukoyama 2012.2. Doblas-Madrid and Minetti 2013. 3. Enikolopov, Petrova and Stepanov 2014.4. Franks and Loranth 2014.5. Clark, Dollar and Micco 2004.6. The Gini coefficient, the most commonly-
used measure of inequality, is a measure of statistical dispersion intended to represent the income or wealth distribution of an economy’s residents.
7. The relationship is significant at the 1% level after controlling for income per capita.
8. The correlation between the number of reforms and the actual improvement in the distance to frontier score is 0.57.
9. Drazen and Grilli 1993; Ranciere and Tornell 2015.
10. Haggard and Williamson 1994. 11. Djankov, Georgieva and Ramalho 2017a.12. The second peak is explained by substantial
business regulation reforms undertaken by the 17 member states of the Organization for the Harmonization of Business Law in Africa, known by its French acronym OHADA. The organization adopted a revised Uniform Act Organizing Collective Proceedings for Wiping Off Debts in 2015, which introduced
a simplified preventive settlement procedure for small companies and a new reconciliation procedure for companies facing financial difficulties, encouraging an agreement between a debtor and its main creditors. The OHADA Uniform Act also introduced provisions on cross-border insolvency that were implemented in all 17 OHADA member states.
13. Kraay and McKenzie 2014; Banerjee and Duflo 2011; Rodrick, Subramanian and Trebbi 2004; Buvinic and Gupta 1997.
14. Bruhn 2011; Bruhn 2013; Branstetter and others 2014.
15. Bruhn 2013; Fajnzylber, Maloney and Montes-Rojas 2011; Kaplan, Piedra and Seira 2011.
16. The relationship is significant at the 1% level after controlling for income per capita.
17. The relationship is significant at the 1% level after controlling for income per capita and population size; it is shown in figure 1.5.
18. De Soto 1989.19. Dabla-Norris, Gradstein, and Inchauste 2008. 20. Loayza and Serven 2010.21. Djankov, Georgieva and Ramalho 2017b.
This association is significant when using the following indicator sets individually: starting a business, dealing with construction permits, getting credit and enforcing contracts. The relationship holds after controlling for income per capita and government expenditure.