overview & outlook for c i l p/c icommercial p/c insurance
TRANSCRIPT

Overview & Outlook for C i l P/C ICommercial P/C Insurance:
An Industry at the CrossroadsyInsurance Information Institute
F b 1 2012February 1, 2012
Robert P. Hartwig, Ph.D., CPCU, President & EconomistInsurance Information Institute ♦ 110 William Street ♦ New York, NY 10038
Tel: 212.346.5520 ♦ Cell: 917.453.1885 ♦ [email protected] ♦ www.iii.org

Presentation OutlineReview of Recent Events
What in the World is Going On?Summary of P/C Financial PerformanceyCatastrophe Loss Developments & Trends
US, GlobalWill the Market Turn? Four Necessary Criteria:y
Underwriting Loss TrendsCapital/CapacityReinsurance MarketsPricing Discipline
Other Contributing Factors to the Underwriting CycleInvestment EnvironmentTort/Casualty EnvironmentInflation
Economic Overview & Outlook
2
Q&A

What in the World Is Going On?
Is the World Becoming a Riskier Place?Riskier Place?
What Are the Implications for
3
Insurance and Risk Management?

We Are Living in an Age of Elevated Global Economic UncertaintyECONOMIC & POLITICAL CONCERNS
European Sovereign Debt, Bank & Currency CrisesGlobal Economic SlowdownEchoes of the Financial Crisis & Financial Market VolatilityEchoes of the Financial Crisis & Financial Market VolatilityCollapse of Major Financial Institutions U.S. Debt and Budget Crisis, S&P Downgrade & Tax UncertaintyHousing CrisisP i t tl Hi h U l tPersistently High UnemploymentInflation/DeflationEnergy & Commodity Prices VolatilityPolitical Upheaval in the Middle East (Arab Spring, Iran)Regulation & Regulatory UncertaintyNew World Order: China’s Economic and Military Ascendency2012 US Elections & Political Brinksmanship
CATASTROPHIC LOSSJapan, New Zealand, Chile, Haiti EarthquakesNuclear Fears (Japan, Germany, US)Floods (Thailand, US)U.S.: Tornadoes, Flooding, Wildfires, Hurricanes, Winter Storms
Are “Black Swans”
everywhere or does it
4
U.S.: Tornadoes, Flooding, Wildfires, Hurricanes, Winter StormsManmade Disasters (e.g., Deepwater Horizon)Cyber AttacksResurgent Terrorism Risk (Bin Laden, Gadhafi, Kim Jong Il deaths)
or does it just seem that way?

Cost of Risk vs. Commercial Lines Combined Ratio
125 Commercial
The cost of risk cannot continue to fall as actual
results deteriorate
118.8
122.3
$13.
91
13.1
5
4 0.25
5 $13.
50120
125
d R
atio
$12
$14
nue
CommercialCombined RatioCost of Risk
109.4110.2 109.5
112.5110.2
107.6109.7 110.2
108.2111.1
112.3
$1
$11.
94
$11.
55
$10.
68
$10.
35
$10.
02
1
$11.
9 5
$
2
110
115
s C
ombi
ned
$8
$10
1000
Rev
en
104.1102.5
105.4104.1
98.9
102.7102.0$7
.30
$6.4
9
$8.3
0
$8.4
2
3205.71
255.70
$7.7
0
$6.4
0
$6.1
0
100
105
erci
al L
ines
$4
$6
$
t of R
isk/
$1
91.2
93.7
$4.8
3
$5.2$5
$5.2$5$
95
100
Com
me
$2
$4
Cos
9090 91 92 93 94 95 96 97 98 99 00 01 02 03 04 05 06 07 08 09 10 11*
$0
*Insurance Information Institute cost of risk estimate for 2011.Source: 2011 RIMS Benchmark Survey; A.M. Best; Insurance Information Institute

What is Going On in the US and Global Financial Markets?
1. Need for a Binding, Comprehensive Solution to Europe’s Debt Problems15 of 17 Eurozone countries put on negative credit watch by S&P on Dec. 5Current requires construction of a “fiscal union” to save Euro monetary unionRequires rewriting EU treaties to mandate strict Debt/GDP ratios (3%) with sanctions to be imposed on violatorsShort-term Europe needs to build a financial “Firewall” (larger bailout fund) around Italy, Spain, Ireland, Portugal to avoid another “Big, Fat Greek Debt Disaster”S l ti U ifi d t t i il t TARP M t i Bi di fi l tSolution: Unified strategy similar to TARP; Monetary easing; Binding fiscal pactOUTCOME: Europeans will eventually stumble into a resolution
2. Realization that US Economic Growth Will Remain Lackluster Q1 GDP just 0 4%; Q2 only 1 3%; Q3 still a subpar 1 8%; Acceleration likelyQ1 GDP just 0.4%; Q2 only 1.3%; Q3 still a subpar 1.8%; Acceleration likelyJob growth has been anemic for months and unemployment remains high at 8.5%Markets remain extremely volatile and jittery; Housing/Debt hangoverOUTCOME: Tepid growth in the 2% - 2.5% range in 2012; Unemployment: 8% - 8.5%p g g ; p y
3. View that Washington is Dysfunctional and “Rudderless”Lack of coherent, consistent medium and long term plan to deal with basic structural issues in the US economy (debt, taxes, employment, regulation, etc.)No confidence that 2012 political c cle ill resol e these problems
6
No confidence that 2012 political cycle will resolve these problems4. Economic Slowdown in Emerging Markets
China, other economies less able to stimulate global economy than in 2008

Déjà Vu? Lehman II? Is This 2008 All Over Again?
Why Today is Not 2008 All Over AgainThe Situation Today is Very, Very Different from 2008Credit Markets Are Not Seizing; Some Contraction in EuropeCredit Markets Are Not Seizing; Some Contraction in EuropeBank Balance Sheets Are in Much Stronger Shape
Capital up, charge offs fallingWe Will Not Experience the Mega Collapses/Near Collapses Like in 2008We Will Not Experience the Mega-Collapses/Near Collapses Like in 2008
No repeat of Lehman, AIG, Washington Mutual, Wachovia…MF Global is not a “Systemically Important Financial Institution”
Some Additional Regulatory Controls Are Now PlaceSome Additional Regulatory Controls Are Now PlaceWhat Would Be Helpful Now?
Solution to European Bank/Sovereign Debt Problem (Thought We Had One!) Long-Term Fiscal and Monetary Policy DirectionFed on Aug. 9 stated rates would remain low “at least through mid-2013”
This is not only a signal that borrowing costs will remain low over an extended period of time and that inflation will remain muted; Also tells investors that they’ll
7
period of time and that inflation will remain muted; Also tells investors that they ll need to take on risk in order to earn returns in the market.Congress and the Administration need to remove regulatory and tax uncertainty ASAP and drive a pro-growth agenda
P/C Insurance Industry Financial Overview
Profit Recovery Was Set Back i 2011 b Hi h C t t hin 2011 by High Catastrophe
Loss & Other Factors
8

P/C Net Income After Taxes1991–2011:Q3 ($ Millions)
,496
65,7
77
$70 000
$80,000 2005 ROE*= 9.6%2006 ROE = 12.7%
P-C Industry 2011:Q3 profits were down 71% to $8.0B vs. 2010:Q3,
due primarily to high catastrophe losses and as non cat
9
$62,
0
$6
44,1
55
501
$50 000
$60,000
$70,000 2007 ROE = 10.9%2008 ROE = 0.1%2009 ROE = 5.0%2010 ROE = 5.6%2011 Q3 ROAS1 1 9%
losses and as non-cat underwriting results deteriorated
8 316
,598
24,4
04 $36,
81
$30,
773
1,86
5
$30,
029
$34,
670
$28,
672$ 4
,559
$38,
5
$30,000
$40,000
$50,000 2011:Q3 ROAS1 = 1.9%
$14,
178
$5,8
40
$19,
3
$10,
870 $20 $2 $21
3,04
6
3,04
3
$7,9
79
$20
$10,000
$20,000
,
$
$3 $3
-$6,970-$10,000
$0
91 92 93 94 95 96 97 98 99 00 01 02 03 04 05 06 07 08 09 10 11*
* ROE figures are GAAP; 1Return on avg. surplus. Excluding Mortgage & Financial Guaranty insurers yields a 3.0% ROAS for 2011:Q3, 7.5% for 2010 and 7.4% for 2009.Sources: A.M. Best, ISO, Insurance Information Institute

A 100 Combined Ratio Isn’t What ItOnce Was: Investment Impact on ROEsCombined Ratio / ROE
108 215.9%11018%
A combined ratio of about 100 generated ~5.5% ROE in 2009/10,
10% in 2005 and 16% in 1979
97 5100.6 100.1 100.8 101.0
99.3100.8
108.2
9 6%
5 9%14.3%
12.7% 10.9%
100
105
110
12%
15%
97.5
92.795.7 7.5%7.4%
4.4%
9.6%
8.8%90
95
100
6%
9%
3.0%
80
85
19 8 19 9 2003 200 2006 200 2008 2009 2010 2011 Q3*0%
3%
1978 1979 2003 2005 2006 2007 2008 2009 2010 2011:Q3*
Combined Ratio ROE*
Combined Ratios Must Be Lower in Today’s Depressed
* 2008 -2011 figures are return on average surplus and exclude mortgage and financial guaranty insurers. 2011:Q3 combined ratio including M&FG insurers is 109.9, ROAS = 1.9%.
Source: Insurance Information Institute from A.M. Best and ISO data.
Investment Environment to Generate Risk Appropriate ROEs

Profitability Peaks & Troughs in the P/C Insurance Industry, 1975 – 2011*
25%1977:19.0% 1987:17.3%
History suggests next ROE peak will be in 2016-2017
ROE
15%
20%1997:11.6%
2006:12.7%
10%
15%9 Years
2011:3.0%*
5%
-5%
0%
1984: 1.8% 1992: 4.5% 2001: -1.2%1975: 2.4%
75 76 77 78 79 80 81 82 83 84 85 86 87 88 89 90 91 92 93 94 95 96 97 98 99 00 01 02 03 04 05 06 07 08 09 10 11*
*Profitability = P/C insurer ROEs are I.I.I. estimates. 2011 figure is an estimate based on annualized ROAS through Q3 data. Note: Data for 2008-2011 exclude mortgage and financial guaranty insurers. For 2011:Q3 ROAS = 1.9% including M&FG.Source: Insurance Information Institute; NAIC, ISO, A.M. Best.

ROE: Property/Casualty Insurance vs. Fortune 500, 1987–2011:Q3*
20%P/C Profitability Is Both by
Cyclicality and Ordinary Volatility K t i
(Percent)
15%
y y y y Katrina, Rita, Wilma
%
10%
Hugo
Sept. 11
0%
5% Hugo
AndrewNorthridge
Lowest CAT Losses in 15 Years
4 Hurricanes
-5%87 88 89 90 91 92 93 94 95 96 97 98 99 00 01 02 03 04 05 06 07 08 09 10 11:Q3
Northridge Financial Crisis*
12
* Excludes Mortgage & Financial Guarantee in 2008 - 2011.Sources: ISO, Fortune; Insurance Information Institute.

ROE vs. Equity Cost of Capital:U.S. P/C Insurance:1991-2011*
18%The P/C Insurance Industry Fell Well
Short of Its Cost of Capital Every Year Since 2008
(Percent)
12%
14%
16%p y
6%
8%
10%
pts +1
.7 p
ts
+2.3
pts
.0 p
ts
-6.4
pts
-3.2
pts
-2.9
pts
-8.9
pts
2%
4%
6%
-13.
2 p
-9
US P/C Insurers Missed Their Cost of Capital by an Average 6.7 Points from
The Cost of Capital is the Rate of Return Insurers Need to
-
-2%
0%
91 92 93 94 95 96 97 98 99 00 01 02 03 04 05 06 07 08* 09* 10* 11*
Capital by an Average 6.7 Points from 1991 to 2002, but on Target or Better
2003-07, Fell Short in 2008-2010
Insurers Need to Attract and Retain
Capital to the Business
13
* Return on average surplus used as proxy for ROE in 2008-2011 and excluding mortgage and financial guaranty insurers for these years. Change in model methodology in 2011 increased cost of capital by approximately 90 basis points.
Source: The Geneva Association, Insurance Information Institute
ROE Cost of Capital

P/C Insurance Industry ROE vs. Fortune 500, 1975 – 2011*
20%ROE
15%
10%
0%
5%
-5%
0%
75 76 77 78 79 80 81 82 83 84 85 86 87 88 89 90 91 92 93 94 95 96 97 98 99 00 01 02 03 04 05 06 07 08 09 10 11*
For 2011:H1 ROAS.Source: Insurance Information Institute; NAIC, ISO.
Global Catastrophe Loss pDevelopments and Trends
2011 Will Rewrite Catastrophe Loss d I Hi tand Insurance History
But Will Losses Turn the Market?
15

Global Catastrophe Loss Summary: 2011
2011 Was the Highest Loss Year on Record for Economic Losses GloballyExtraordinary accumulation of severe natural catastrophe: Earthquakes, tsunami, floods and tornadoes are the primary causes of lossand tornadoes are the primary causes of loss
$380 Billion in Economic Losses Globally (New Record)New record, exceeding the previous record of $270B in 2005
$105 Billion in Insured Losses Globally2011 losses were 2.5 times 2010 insured losses of $42B
Second only to 2005 on an inflation adjusted basis (new record on a unadjusted basis)y j ( j )
Over 5 times the 30-year average of $19B
$72.8 Billion in Economic Losses in the US$Represents a 129% increase over the $11.8 billion amount through the first half of 2010
$35.9 Billion in Insured Losses in the US Arising from 171 CAT EventsFifth highest year on record
16
Represents 51% increase over the $23.8 billion total in 2010
Source: Munich Re; Insurance Information Institute.
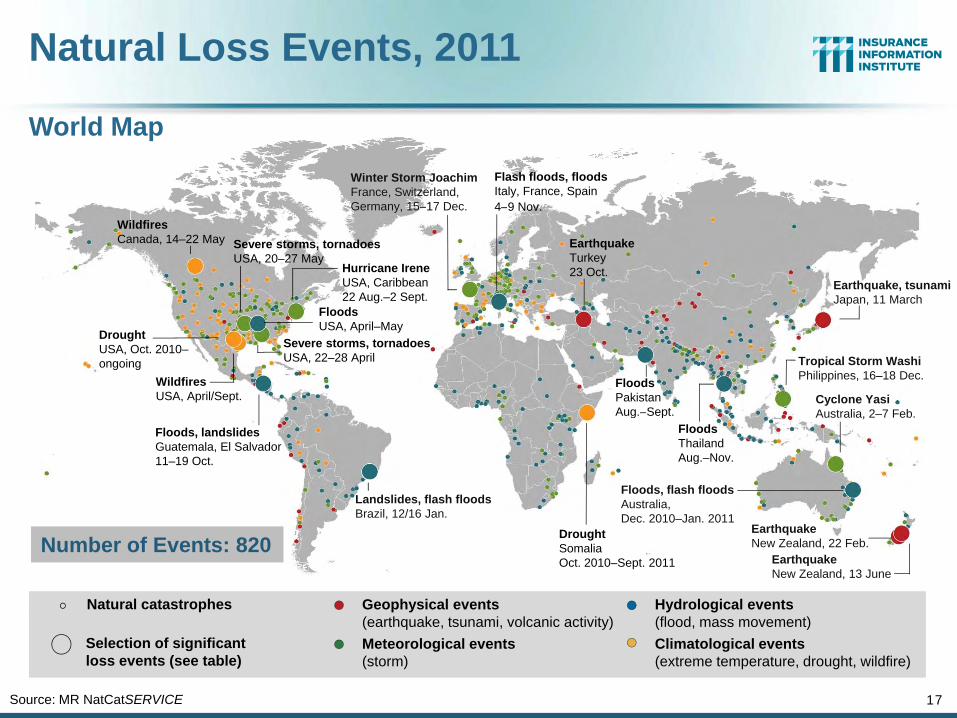
Natural Loss Events, 2011
Flash floods, floodsItaly, France, Spain4 9 Nov
Winter Storm JoachimFrance, Switzerland, Germany 15 17 Dec
World Map
Earthquake, tsunami Japan, 11 March
Severe storms, tornadoesUSA, 20–27 May
Fl d
Hurricane IreneUSA, Caribbean22 Aug.–2 Sept.
WildfiresCanada, 14–22 May Earthquake
Turkey23 Oct.
4–9 Nov.Germany, 15–17 Dec.
Cyclone YasiA t li 2 7 F b
Severe storms, tornadoesUSA, 22–28 April
WildfiresUSA, April/Sept.
FloodsUSA, April–May
DroughtUSA, Oct. 2010–ongoing
FloodsPakistanAug Sept
Tropical Storm WashiPhilippines, 16–18 Dec.
Australia, 2–7 Feb.
Landslides, flash floodsBrazil 12/16 Jan
Floods, flash floods Australia,
Aug.–Sept.FloodsThailandAug.–Nov.
Floods, landslidesGuatemala, El Salvador11–19 Oct.
Geophysical events Hydrological eventsNatural catastrophes
EarthquakeNew Zealand, 22 Feb.
Brazil, 12/16 Jan. Dec. 2010–Jan. 2011
EarthquakeNew Zealand, 13 June
Number of Events: 820Number of Events: 820 DroughtSomaliaOct. 2010–Sept. 2011
(earthquake, tsunami, volcanic activity)Meteorological events (storm)
(flood, mass movement)Selection of significant loss events (see table)
Climatological events(extreme temperature, drought, wildfire)
17Source: MR NatCatSERVICE

Natural Catastrophes Worldwide, 2011
2011 2010 Average of the last 10
Average of the last
Top Year 1981-
Overview and Comparison with Previous Years
the last 10 years
2001-2010
of the last 30 years
1981-2010
1981-2010
Number of events820 970 790 630
2007(1,025)
Overall losses in US$ m(original values)
380,000 152,000 113,000 75,0002005
(227,000)
I d l iInsured losses in US$ m(original values)
105,000 42,000 35,000 19,0002005
(101,000)
Fatalities 2010Fatalities27,000 296,000 106,000 69,000
2010(296,000)
© 2011 Munich Re 18Source: MR NatCatSERVICE

5 Costliest Natural Catastrophes Worldwidein Terms of Insured Losses, 2011 ($Mill)
Overall l
Insured l
Date Region Event Fatalitieslosses US$ m
lossesUS$ m
March 11 JapanEarthquake, tsunami
15,840 210,00035,000-40 000tsunami 40,000
Feb. 22 New Zealand Earthquake 181 16,000 13,000
Aug. 1 –Nov. 15
ThailandFloods, landslides
813 40,000 10,000
Severe storms/ Apr. 22-28 USA
Severe storms/ tornadoes
350 15,000 7,300
Aug. 22 -S 2
USA, C ibb
Hurricane I
55 15,000 7,000Sep. 2 Caribbean Irene
55 15,000 7,000
Source: MR NatCatSERVICE © 2011 Munich Re 19

Natural Catastrophes Worldwide 2011Insured losses US$ 105bn - Percentage distribution per continent
2%
37%
44%
1%
In 2011, just 37% of insured natural
17%
<1%insured natural catastrophe losses
were in the Americas, barely half the average of 66%
th i 30
Continent Insured losses$
over the prior 30 years (1981-2010)
US$ m
America (North and South
America)40,000
Europe 2,000
In 2011, 61% of insured natural catastrophe losses
were in the Asia/Pacific region nearly 3 5 times thep ,
Africa Minor damages
Asia 45,000
Australia/Oceania 18,000 20Source: MR NatCatSERVICE
region, nearly 3.5 times the average of 13% over the
prior 30 years (1981-2010)

Natural Catastrophes Worldwide 1980 – 2011 Insured losses US$ 870bn - Percentage distribution per continent
16%
66%
1%
13%
<1%
5%
Continent Insured losses$US$ m
America (North and South
America)566,000
Europe 146,000
In 2011, 61% of natural catastrophe losses were in the Asia/Pacific region,
nearly 3 5 times thep ,
Africa 2,000
Asia 115,000
Australia/Oceania 41,000 21Source: MR NatCatSERVICE
nearly 3.5 times the average of 13% over the
prior 30 years (1981-2010)

Natural Catastrophes in Asia 1980 – 2011Overall and insured losses in 2011 Dollars
200
($ Billions) 2011 set a record for both overall economic losses
in Asia ($266B) and
160
180insured losses ($45B).
The rapid economic development of Asia and
increased insurance
100
120
140 penetration guarantee that losses will trend higher in the future.
60
80
20
40
1980 1982 1984 1986 1988 1990 1992 1994 1996 1998 2000 2002 2004 2006 2008 20101980 1982 1984 1986 1988 1990 1992 1994 1996 1998 2000 2002 2004 2006 2008 2010
Overall losses (in 2011 values) Insured losses (in 2011 values)
© 2011 Munich Re 22Source: MR NatCatSERVICE

Top 16 Most Costly World Insurance Losses, 1970-2011**
(Insured Losses, 2011 Dollars, $ Billions) 5 of the top 14 most expensive
catastrophes in world
$47.6$45$50
Taken as a single event, the Spring 2011 tornado and
thunderstorm season would th
catastrophes in world history have occurred within the past 2 years
$19 1$21.3$24.0$25.0
$37.5
$25$30$35$40$45 likely become the 5th
costliest event in global insurance history
$10.0$11.9 $13.0$13.1$19.1$21.3
$7.7 $8.1 $8.3 $8.5 $9.3 $9.7
$5$10$15$20$25
$0Hugo (1989)
WinterStormDaria(1991)
ChileQuake(2010)
Ivan (2004)
TyphoonMirielle(1991)
Charley(2004)
ThailandFloods(2011)
Wilma(2005)
NewZealandQuake(2011)
Ike (2008)
Northridge(1994)
SpringTornadoes/
Storms(2011)
WTC TerrorAttack(2001)
Andrew(1992)
JapanQuake,
Tsunami(2011)*
Katrina(2005)
23
*Average of range estimates of $35B - $40B as of 1/4/12; Privately insured losses only.**Figures do not include federally insured flood losses.Sources: Swiss Re sigma 1/2011; Munich Re; Insurance Information Institute research.

Worldwide Natural Disasters,1980 – 2011
Number of Events 1 200
There were 820 events in 2011
800
1 000
600
800
200
400
Meteorological events Hydrological events Climatological eventsGeophysical events
1980 1982 1984 1986 1988 1990 1992 1994 1996 1998 2000 2002 2004 2006 2008 2010
Source: MR NatCatSERVICE 24
Meteorological events(Storm)
Hydrological events(Flood, mass movement)
Climatological events(Extreme temperature, drought, forest fire)
Geophysical events(Earthquake, tsunami, volcanic eruption)
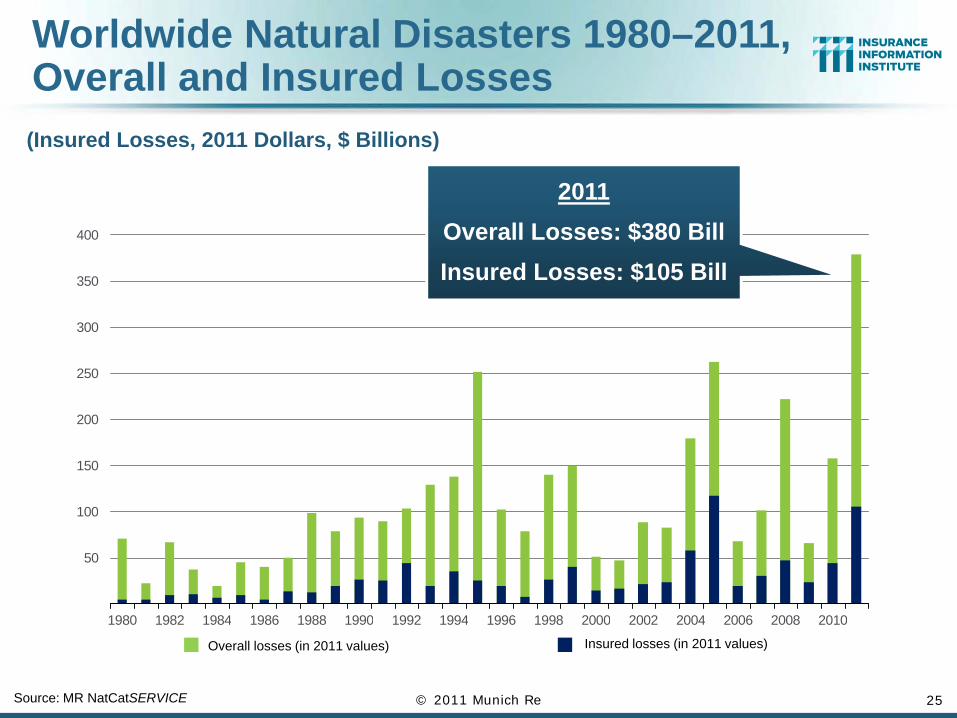
Worldwide Natural Disasters 1980–2011,Overall and Insured Losses
2011
(Insured Losses, 2011 Dollars, $ Billions)
350
400 Overall Losses: $380 BillInsured Losses: $105 Bill
250
300
100
150
200
50
100
1980 1982 1984 1986 1988 1990 1992 1994 1996 1998 2000 2002 2004 2006 2008 2010
25
Overall losses (in 2011 values) Insured losses (in 2011 values)
Source: MR NatCatSERVICE © 2011 Munich Re
1980 1982 1984 1986 1988 1990 1992 1994 1996 1998 2000 2002 2004 2006 2008 2010
U.S. Insured Catastrophe pLoss Update
2011 Was One of the Most Expensive pYears on Record
26

Top 14 Most Costly Disastersin U.S. History
(Insured Losses, 2011 Dollars, $ Billions)
Taken as a single event the Spring$47.6
$40$45$50
Taken as a single event, the Spring 2011 tornado and storm season are is
the 4th costliest event in US insurance history
$13 1$19.1 $21.3 $24.0 $25.0
$20$25$30$35 insurance history
$9.0$11.9 $13.1
$8.5$7.7$6.5$5.5$4.4$4.3
$0$5
$10$15
Irene Jeanne Frances Rita Hugo Ivan Charley Wilma Ike Northridge Spring 9/11 Andrew KatrinaIrene(2011)
Jeanne(2004)
Frances(2004)
Rita (2005)
Hugo (1989)
Ivan (2004)
Charley(2004)
Wilma(2005)
Ike (2008)
Northridge(1994)
SpringTornadoes& Storms*
(2011)
9/11Attack(2001)
Andrew(1992)
Katrina(2005)
Hurricane Irene became the 11th most expense
27
*Losses will actually be broken down into several “events” as determined by PCS. Includes losses for the period April 1 – June 30.Sources: PCS; Insurance Information Institute inflation adjustments.
the 11 most expense hurricane in US history

Natural Disasters in the United States, 1980 – 2011Number of Events (Annual Totals 1980 – 2011)u be o e ts ( ua ota s 980 0 )
300
There were 117 natural disaster events in 2011
200
250 disaster events in 2011
Num
ber
150
N
37
850
100
Geophysical ClimatologicalMeteorological (storm)
51
2
1980 1982 1984 1986 1988 1990 1992 1994 1996 1998 2000 2002 2004 2006 2008 2010
Geophysical (earthquake, tsunami, volcanic activity)
Climatological (temperature extremes, drought, wildfire)
Meteorological (storm)
Hydrological (flood, mass movement)
Source: MR NatCatSERVICE 28

Losses Due to Natural Disasters in the US, 1980–2011 (Overall & Insured Losses)
(2011 Dollars, $ Billions)
2011 was the 5th most
(Overall and Insured Losses)
2011Overall Losses: $72 8 Bill
2011 was the 5th most expensive year on record for insured
catastrophe losses in the US Overall Losses: $72.8 Bill
Insured Losses: $35.9 Billthe US.
Approximately 50% of the overall cost of
catastrophes in the pUS was covered by insurance in 2011
29
Overall losses (in 2011 values) Insured losses (in 2011 values)
Source: MR NatCatSERVICE © 2011 Munich Re

US Insured Catastrophe Losses
$100
.0$120$100 Billion CAT Year is
Coming Eventually($ Billions)
$61.
9
$
$60
$80
$100 Record Tornado Losses Caused
2011 CAT Losses to Surge
2000s: A Decade of Disaster2000s: $193B (up 117%)
1990s: $89B
3 4 0.1
3
$26.
5
9 12.9 $2
7.5
2 7
$27.
1
0.6
13.6
$32.
6
5 $22.
9
5 $16.
9
$20
$40
$60$8
.3
$7.4
$2.6 $1
0
$8.3
$4.6
$5.9 $1 $9.
$6. 7 $10
$1
$7.5
$2.7
$4.7
$5. 5 $
$0
$20
89 90 91 92 93 94 95 96 97 98 99 00 01 02 03 04 05 06 07 08 09 10 11*20??
US CAT Losses Already Exceed Losses from All of 2010. Even Modest Hurricane Losses Will Make 2011 Among the Most
Expensive Ever for CATs
30
*PCS estimate through Sept. 30, 2011.Note: 2001 figure includes $20.3B for 9/11 losses reported through 12/31/01. Includes only business and personal property claims, business interruption and auto claims. Non-prop/BI losses = $12.2B.Sources: Property Claims Service/ISO; Insurance Information Institute.

US Insured Catastrophe Losses
$100
.0$120$100 Billion CAT Year is
Coming Eventually($ Billions, 2011 Dollars)
$71.
7
$
$60
$80
$100 Record Tornado Losses Caused
2011 CAT Losses to Surge
2.3
0.7
14.0
1.3
0
$33.
9
4 $15.
9 $32.
9
0.3
3
$28.
5
1.2
14.1
$32.
6
13.7
8
$36.
9
6
$25.
8
$20
$40
$60$1 $1
0
$3.7 $ 1 $1
$6. 0
$7.4 $
$10
$7.3 $1 $1$1
$4.7
$7.8
$8.6
$0
$20
89 90 91 92 93 94 95 96 97 98 99 00 01 02 03 04 05 06 07 08 09 10 11*20??
US CAT Losses in 2011 Were the 5th Highest in US History on An Inflation Adjusted Basis
31
*PCS estimate through Sept. 30, 2011.Note: 2001 figure includes $20.3B for 9/11 losses reported through 12/31/01 ($25.9B 2011 dollars). Includes only business and personal property claims, business interruption and auto claims. Non-prop/BI losses = $12.2B ($15.6B in 2011 dollars.) Sources: Property Claims Service/ISO; Insurance Information Institute.

Natural Disaster Losses in the United States: 2011
As of Jan. 1, 2012
Number of Events Fatalities
Estimated Overall Losses (US $m)
Estimated Insured Losses (US $m)
SevereThunderstorm 69 617 46,548 25,813
Winter Storm 9 67 2 708 2 017Winter Storm 9 67 2,708 2,017
Flood 14 20 2,705 535
Earthquake 5 1 257 50
Tropical Cyclone 3 0 10,700 5,510
Wildfire 58 15 1,922 855
Other 2 33 8,000 1,000
32Source: MR NatCatSERVICE

2011’s Most Expensive Catastrophes, Insured Losses
$6,900
$7,300Thunderstorms, May 20-27
Thunderstorms, Apr. 22-26
$1,510
$2,000
$5,000
$6,900
Thunderstorms, Apr. 8-11
Thunderstorms, Apr. 3-5
Hurricane Irene, Aug. 26-28**
Includes
$1,000
$1,200
$1,400
Texas Drought, 2011*
Thunderstorms, Jun. 16-22
Thunderstorms, Apr. 14-16Includes
$1.65B in AL, mostly in the Tuscaloosa
andIncludes
approximately
$830
$975
$980
$840Thunderstorms Apr 19-20
Thunderstorms, Aug. 18-19
Winter Storm, Jan. 31-Feb. 3
Thunderstorms, Jul. 10-14 and Birmingham
areas
approximately $2B in losses
for May 22 Joplin tornado
$500
$530
$830
$0 $1 000 $2 000 $3 000 $4 000 $5 000 $6 000 $7 000
Flooding, April*
Wildfire, Sep. 4-19
Thunderstorms, Apr. 19-20
$0 $1,000 $2,000 $3,000 $4,000 $5,000 $6,000 $7,000
**Includes $700 million in flood losses insured through the National Flood Insurance Program.Source: PCS except as noted by “*” which are sourced to Munich Re; Insurance Information Institute.
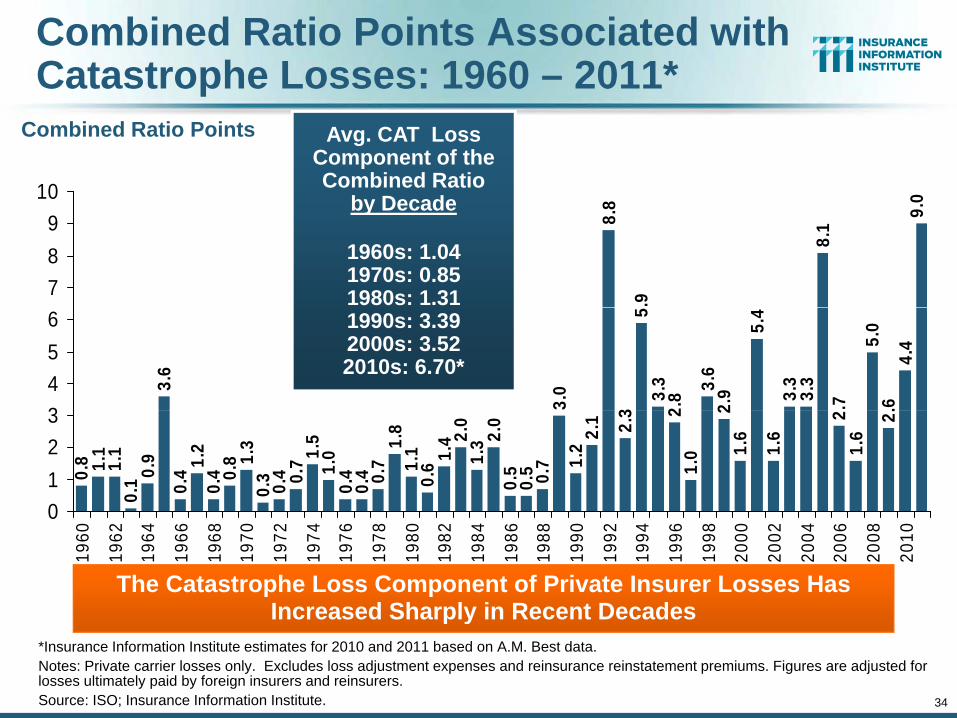
Combined Ratio Points Associated with Catastrophe Losses: 1960 – 2011*
8 .010
Avg. CAT Loss Component of theCombined Ratio
by Decade
Combined Ratio Points
8.8
.9
8.1
9.
789
by Decade
1960s: 1.04 1970s: 0.85 1980s: 1.31
3.0
35
3.3
2.8 3.
62.
9
5.4
3.3
3.3
.7
5.0
.64.
4
3.6
3456 1990s: 3.39
2000s: 3.52 2010s: 6.70*
0.4 1.
20.
4 0.8 1.
30.
3 0.4 0.
7 1.5
1.0
0.4
0.4 0.
71.
81.
10.
6 1.4 2.
01.
3 2.0
0.5
0.5 0.7 1.
22.
1 2.3 2
1.0
21.
6
1.6
21.
6
2.
0.9
0.1
1.1
1.1
0.8
0123
0
1960
1962
1964
1966
1968
1970
1972
1974
1976
1978
1980
1982
1984
1986
1988
1990
1992
1994
1996
1998
2000
2002
2004
2006
2008
2010
The Catastrophe Loss Component of Private Insurer Losses Has Increased Sharply in Recent Decades
34
*Insurance Information Institute estimates for 2010 and 2011 based on A.M. Best data.Notes: Private carrier losses only. Excludes loss adjustment expenses and reinsurance reinstatement premiums. Figures are adjusted for losses ultimately paid by foreign insurers and reinsurers.Source: ISO; Insurance Information Institute.
Increased Sharply in Recent Decades

U.S. Thunderstorm Loss Trends, 1980 – 2011
Thunderstorm losses in 2011 totaled a record
$25.8 billion
Hurricanes get all the headlines, but thunderstorms are consistent
producers of large scale loss.
Average thunderstorm
l
producers of large scale loss. 2008-2011 are the most expensive
years on record.
losses are up more than 5 fold since the early 1980s
35Source: Property Claims Service, MR NatCatSERVICE

U.S. Winter Storm Loss Trends, 1980 – 2011
Insured winter storm losses in 2011 totaled $2.0 billion. Average winter storm losses have nearly doubled
since the early 1980ssince the early 1980s
Source: Property Claims Service, MR NatCatSERVICE 36

U.S. Acreage Burned by Wildfires, 1980 – 2011
8.3 millions acres were burned by wildfires in 2011, one of the worst years on record causingworst years on record, causing
$855 in insured losses
Source: National Forest Service, MR NatCatSERVICE 37
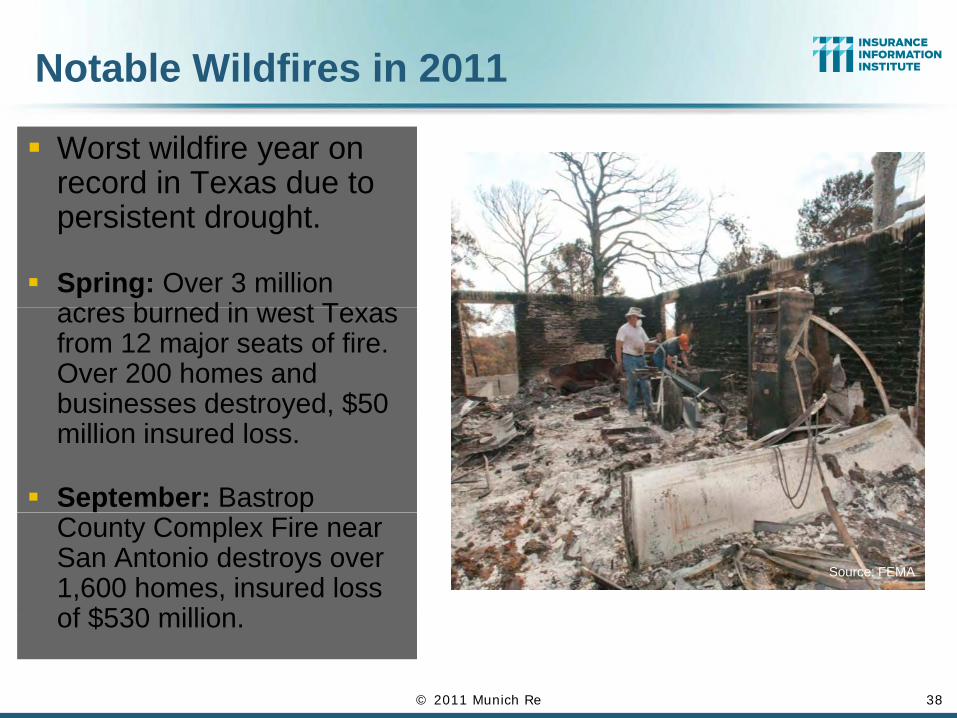
Notable Wildfires in 2011
Worst wildfire year on record in Texas due to
i d h
Worst wildfire year on record in Texas due to
i d hpersistent drought.
Spring: Over 3 million acres b rned in est Te as
persistent drought.
Spring: Over 3 million acres b rned in est Te asacres burned in west Texas from 12 major seats of fire. Over 200 homes and businesses destroyed, $50
acres burned in west Texas from 12 major seats of fire. Over 200 homes and businesses destroyed, $50businesses destroyed, $50 million insured loss.
September: Bastrop
businesses destroyed, $50 million insured loss.
September: Bastrop County Complex Fire near San Antonio destroys over 1,600 homes, insured loss of $530 million
County Complex Fire near San Antonio destroys over 1,600 homes, insured loss of $530 million
Source: FEMA
of $530 million.of $530 million.
38© 2011 Munich Re

U.S. Insured Catastrophe Losses by Cause of Loss, 2011 ($ Millions)
2.8%Hurricanes & Tropical Storms
Wildfires, $855
Wi t St $2 017Geological Events, $50, (0.1%)
Flood , $535, (1.5%) Other, $1,000
1.5%5.6% 15.4%
Hurricanes & Tropical Storms, $5,510Winter Storms, $2,017
Thunderstorm/ Tornado losses were 2.5 times above the 30-
72.1%Thunderstorms (Incl 2011’s insured loss
above the 30-year average
Thunderstorms (Incl. Tornadoes , $25,813
2011 s insured loss distribution was
unusual with tornado and thunderstorm
ti f th
39
.Source: ISO’s Property Claim Services Unit, Munich Re; Insurance Information Institute.
accounting for the vast majority of loss

Inflation Adjusted U.S. Catastrophe Losses by Cause of Loss, 1990–2011:H11
2.4%
Fires (4), $9.0
Geological Events, $18.5
Wind/Hail/Flood (3), $12.7
Other (5), $0.6
0.2%3.4%4.9%
6.6%
Terrorism, $24.9
8.0%42.7%
Hurricanes & Tropical Storms, $160.5
Winter Storms, $30.0
Tornado share of CAT l i
31.8%
T d (2) $119 5
Wind losses are by far cause the most catastrophe losses,
if h i /TS
CAT losses is rising
1. Catastrophes are defined as events causing direct insured losses to property of $25 million or more in 2009 dollars.2 E l d
Tornadoes (2), $119.5 even if hurricanes/TS are excluded.
40
2. Excludes snow.3. Does not include NFIP flood losses4. Includes wildland fires5. Includes civil disorders, water damage, utility disruptions and non-property losses such as those covered by workers compensation.Source: ISO’s Property Claim Services Unit.

2011: Nowhere to Run, Nowhere to Hide
Most of the Country East of the Rockies Suffered Severethe Rockies Suffered Severe Weather in 2011, Impacting
Most Insurers41
Most Insurers
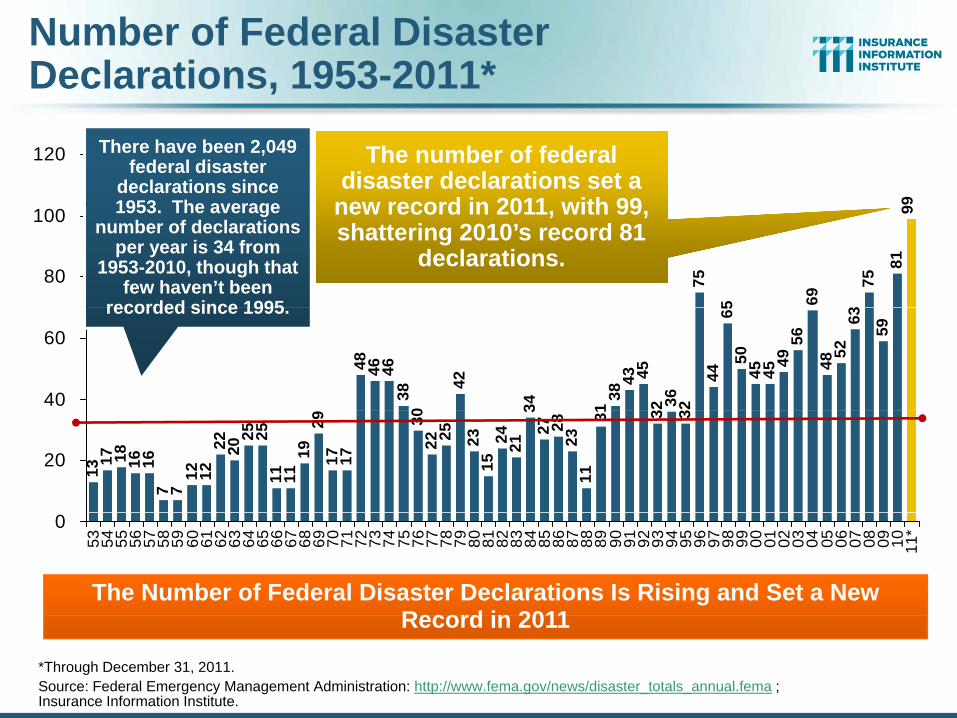
Number of Federal Disaster Declarations, 1953-2011*
9
120 The number of federal disaster declarations set a
new record in 2011 with 99
There have been 2,049 federal disaster
declarations since 1953 The average
75
5 69 375
819
80
100 new record in 2011, with 99, shattering 2010’s record 81
declarations.
1953. The average number of declarations
per year is 34 from 1953-2010, though that
few haven’t been recorded since 1995
48 46 4638
0
42
34 138
452 36 2
4465
5045 45
4956
4852
63
59
43
40
60recorded since 1995.
1317 18 16 16
7 712 12
22 2025 25
11 1119
2917 17
3022 25 23
1524 21
327 28
2311
31 3 3
20
0
53 54 55 56 57 58 59 60 61 62 63 64 65 66 67 68 69 70 71 72 73 74 75 76 77 78 79 80 81 82 83 84 85 86 87 88 89 90 91 92 93 94 95 96 97 98 99 00 01 02 03 04 05 06 07 08 09 10 11*
The Number of Federal Disaster Declarations Is Rising and Set a New Record in 2011
*Through December 31, 2011.Source: Federal Emergency Management Administration: http://www.fema.gov/news/disaster_totals_annual.fema ; Insurance Information Institute.
Record in 2011

Federal Disasters Declarations by State, 1953 – 2011: Highest 25 States*
100
Over the past nearly 60 years,
Texas has had the
8678
0
8090
100
s
Texas has had the highest number of Federal Disaster
Declarations
7065 63
58 55 55 53 53 51 50 50 8 8 7 7 7 6506070
clar
atio
ns
5 5 4 4 47 47 47 46 45 45 44 42 40 39
304050
sast
er D
e
102030
Di
43
0TX CA OK NY FL LA AL KY AR MO IL MS TN IA MN KS NE PA WV OH VA WV ND NC IN
*Through Dec. 31, 2011.Source: FEMA: http://www.fema.gov/news/disaster_totals_annual.fema; Insurance Information Institute.

Federal Disasters Declarations by State, 1953 – 2011: Lowest 25 States*
50Over the past nearly 60 years, Wyoming, Utah
39 3936 36 5
40
s
and Rhode Island had the fewest number of
Federal Disaster Declarations3 3 3
33 3328 27 26 26 25 25 24 24 3
30
ecla
ratio
ns
2 2 23 2220
17 17 16 15 141
20
isas
ter D
e
119 9 910
D
44
0ME SD AK GA WI VT NJ NH OR MA PR HI MI AZ NM ID MD MT NV CT CO SC DE DC RI UT WY
*Through Dec. 31. Includes Puerto Rico and the District of Columbia.Source: FEMA: http://www.fema.gov/news/disaster_totals_annual.fema; Insurance Information Institute.

SPRING 2011 TORNADO &SPRING 2011 TORNADO & SEVERE STORM OUTBREAK
2011 Losses Are Putting Pressure on gUS P/C Insurance and Reinsurance Markets
45

Number of Tornadoes and Related Deaths, 1990 – 2011
6921,819 1,
894
1 800
2,000 600Number of Tornadoes
Number of Deaths
Tornadoes claimed more than 550 lives in 2011, the most since 1925
33 32
1,29
7
173
2 1,23
4
173
48
1,42
4
1,34
5
,216 1,
376
1,26
4
3 8
1,6
56 1,28
2
552
1,400
1,600
1,800
does
400
500
Nu
Number of Deaths
1,13
1,13 1,1
1,08
2 1
1,1
1,14
1,07
1 1 ,
941
1,10
3
1,09
8
1,1
800
1,000
1,200
ber o
f Tor
nad
300
umber of D
eaThere were 1,884
200
400
600
Num
b
100
200
aths
,tornadoes recorded
in the US in 2011
0
200
90 91 92 93 94 95 96 97 98 99 00 01 02 03 04 05 06 07 08 09 10 11P0
Insurers Expect to Pay at Least $2 Billion Each for the April 2011
46Source: U.S. Department of Commerce, Storm Prediction Center, National Weather Service.
Insurers Expect to Pay at Least $2 Billion Each for the April 2011 Tornadoes in Alabama and a Similar Amount for the May Storms in Joplin

U.S. Tornado Count, 2005-2011
There were 1,893 tornadoes in the US in 2011 far abovein the US in 2011 far above
average, but well below 2008’srecord
Deadly andDeadly and costly April/ May spike
47Source: http://www.spc.noaa.gov/wcm/

Insurers Making a Difference in Impacted Communities
Destroyed home in Tuscaloosa. Insurers will pay some 165 000will pay some 165,000
claims totaling $2 billion in the Tuscaloosa/
Birmingham areas alone.
P t ti f h kPresentation of a check to Tuscaloosa Mayor Walt Maddox to the Tuscaloosa Storm
Source: Insurance Information Institute 48
Recovery Fund
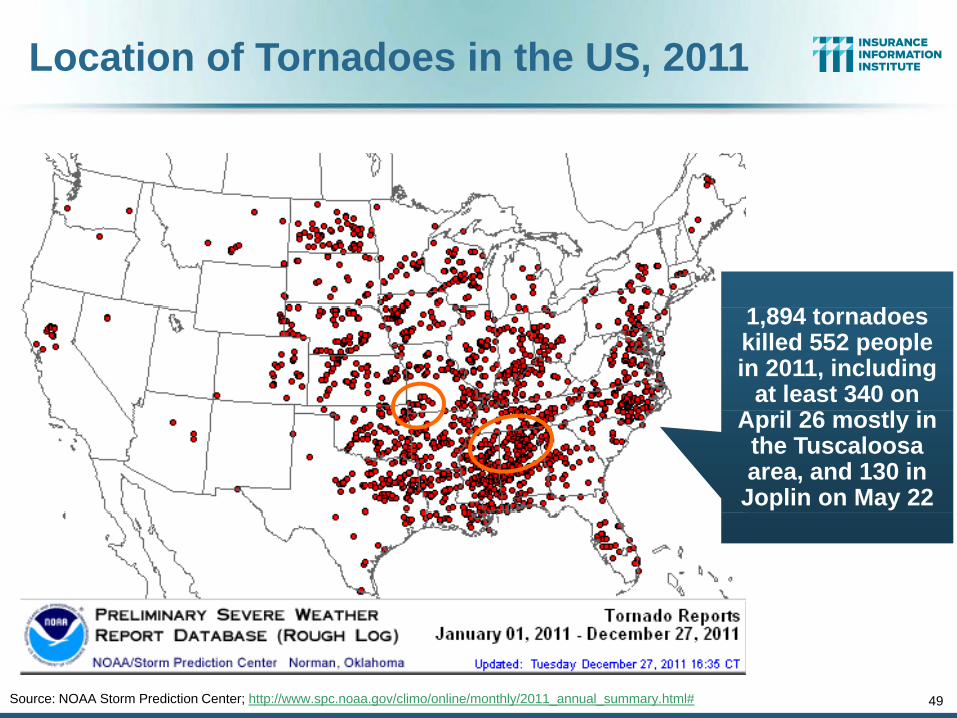
Location of Tornadoes in the US, 2011
1 894 t d1,894 tornadoes killed 552 people in 2011, including
at least 340 on April 26 mostly in
the Tuscaloosa area, and 130 in
Joplin on May 22
Source: NOAA Storm Prediction Center; http://www.spc.noaa.gov/climo/online/monthly/2011_annual_summary.html# 49

Location of Large Hail Reports in the US, 2011
There were 9,417 “Large Hail”
reports in 2011, causing extensivecausing extensive damage to homes,
businesses and vehicles
Source: NOAA Storm Prediction Center; http://www.spc.noaa.gov/climo/online/monthly/2011_annual_summary.html# 50

Location of Wind Damage Reports in the US, 2011
There were 18,685 “Wind Damage” reports through Dec 27 causingDec. 27, causing
extensive damage to homes and,
businesses
Source: NOAA Storm Prediction Center; http://www.spc.noaa.gov/climo/online/monthly/2011_annual_summary.html# 51
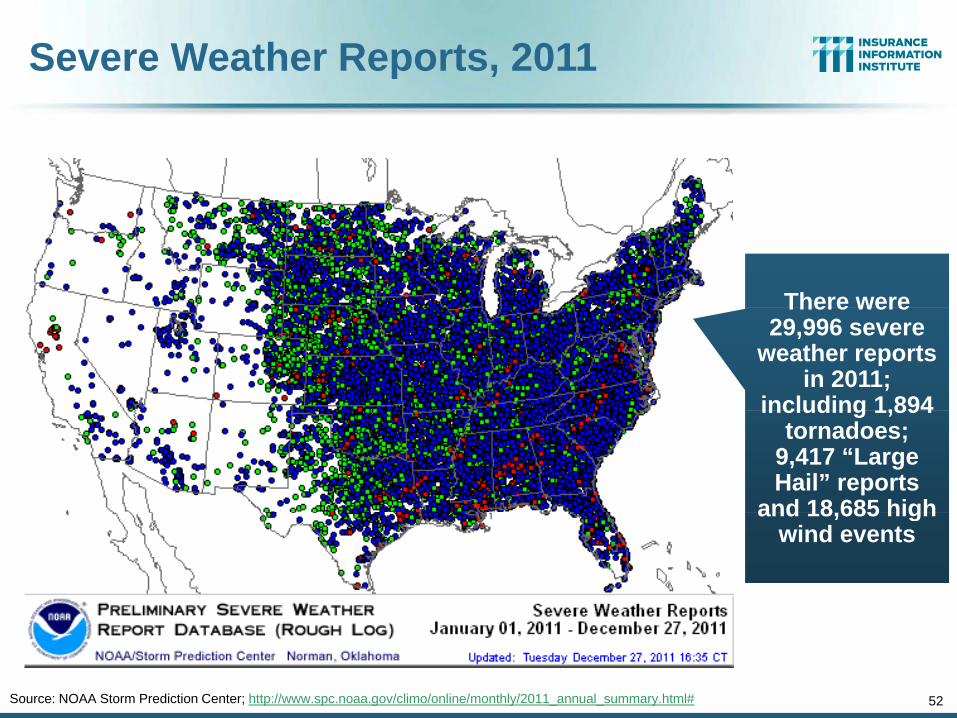
Severe Weather Reports, 2011
There wereThere were 29,996 severe
weather reports in 2011;
including 1,894including 1,894 tornadoes;
9,417 “Large Hail” reports
and 18 685 highand 18,685 high wind events
52Source: NOAA Storm Prediction Center; http://www.spc.noaa.gov/climo/online/monthly/2011_annual_summary.html#

Number of Severe Weather Reports in US, by Type, 2011
Tornadoes, 1,894 , 6%
Large Hail, 9,417 , 31%
TornadoesWind
Damage, 18,685 , 63%
Tornadoes accounted for just 6% of all Severe
Weather Reports but more than 550 18,685 , 63%
deaths in 2011, the most in 75 years
Source: NOAA Storm Prediction Center; http://www.spc.noaa.gov/climo/online/monthly/2011_annual_summary.html#

The BIG Question:When Will the Market Turn?
Are Catastrophes and Other Factors P i I M k t ?Pressuring Insurance Markets?
54

Criteria Necessary for a “Market Turn”:All Four Criteria Must Be Met
Criteria Status Comments
Sustained •Apart from 2011 CAT losses, overall p/c underwriting losses i d tPeriod of
Large Underwriting
Losses Early Stage, Inevitable
remain modest•Combined ratios (ex-CATs) still in low 100s (vs. 110+ at onset of last hard market)•Prior-year reserve releases continue to reduce u/w losses, b t ROE th h d tlInevitable boost ROEs, though more modestly
Material Decline in Surplus/
Entered 2011 At Record
•Surplus hit a record $565B as of 3/31/11•Fell by 4.6% through 9/30/11 (latest available)•Little excess capacity remains in reinsurance marketsSurplus/
Capacity High; Since Fallen
•Little excess capacity remains in reinsurance markets•Weak growth in demand for insurance is insufficient to absorb much excess capacity
Tight Reinsurance Somewhat in
•Much of the global “excess capacity” was eroded by catsReinsurance
MarketSomewhat in
Place•Higher prices in Asia/Pacific•Modestly higher pricing for US risks
Renewed Underwriting Some Firming
•Commercial lines pricing trends have turned from negative to flat or up in some lines (property, WC); Casualty is flat.
55
& Pricing Discipline
esp. inProperty, WC
to flat or up in some lines (property, WC); Casualty is flat.•Competition remains intense as many seek to maintain market share
Sources: Barclays Capital; Insurance Information Institute.

Do the Property Catastrophe Events of 2011 Impact Casualty Markets?
Unlikely that Record 2011 Property CAT Loss Will Impact Casualty Markets in Any Material Way, Including Professional Liability LinesGlobal P/C & Reinsurance Industries Entered 2011 w/ Record CapitalGlobal P/C & Reinsurance Industries Entered 2011 w/ Record Capital
Events so far in 2011 are earnings events, rather than capital events
Natural Catastrophe and Casualty Risks Are Largely UncorrelatedRisks are different
Geographically, mostly distinct primary carriers: Japan-Australia-NZ-US
Casualty markets generally don’t influence property markets
Property and Casualty Risks Are Largely SiloedRecord Property Losses in 2004/2005 Did Not Impact Casualty MktsRecord Property Losses in 2004/2005 Did Not Impact Casualty Mkts.Casualty Markets Have Their Own Issues
Tort environment
56
Inflation
Public policy

1 UNDERWRITING1. UNDERWRITING
Have Underwriting Losses gBeen Large Enough for Long Enough to Turn the Market?
57
Enough to Turn the Market?

P/C Insurance Industry Combined Ratio, 2001–2011:Q3*
As Recently as 2001, Insurers Paid Out
Nearly $1 16 for Every
Relatively Low CAT L
Heavy Use of Reinsurance Lowered Net
Relatively Low CAT Losses, Reserve
Higher CAT
Losses, Shrinking ReserveNearly $1.16 for Every
$1 in Earned Premiums
Losses, Reserve Releases
Lowered Net Losses Reserve
Releases
Avg. CAT
Reserve Releases, Toll of Soft
Market
115.8120
Best Combined
Ratio Since 1949 (87 6)
Cyclical Deterioration
gLosses,
More Reserve Releases
99 3100.8
108.2
101.0100.8100.1
107.5110 1949 (87.6)
95.7
99.3
92.6
98.4
90
100
58
* Excludes Mortgage & Financial Guaranty insurers 2008--2011. Including M&FG, 2008=105.1, 2009=100.7, 2010=102.4, 2011=109.9 Sources: A.M. Best, ISO.
902001 2002 2003 2004 2005 2006 2007 2008 2009 2010 2011*

Underwriting Gain (Loss)1975–2011*
$35 Cumulative underwriting deficit f 1975 th h
($ Billions) Underwriting losses in
2011 at $34.9 through Q3
$5
$15
$25 from 1975 through 2010 is $455B
through Q3 will be
largest since 2001
$25
-$15
-$5
-$45
-$35
-$25
Large Underwriting Losses Are NOT Sustainable
-$5575 76 77 78 79 80 81 82 83 84 85 86 87 88 89 90 91 92 93 94 95 96 97 98 99 00 01 02 03 04 05 06 07 08 09 1011*
* Includes mortgage and financial guaranty insurers in all yearsSources: A.M. Best, ISO; Insurance Information Institute.
in Current Investment Environment

Number of Years with Underwriting Profits by Decade, 1920s–2010s
10
12Number of Years with Underwriting Profits
8
10
76
8
10
3
54
6
4
6
0 0 00
2
1920s 1930s 1940s 1950s 1960s 1970s 1980s 1990s 2000s* 2010s**
Underwriting Profits Were Common Before the 1980s (40 of the 60 Years Before 1980 Had Combined Ratios Below 100) –
But Then They Vanished. Not a Single Underwriting Profit Was Recorded in the 25 Years from 1979 Through 2003
60
* 2009 combined ratio excl. mort. and finl. guar.anty insurers was 99.3, which would bring the 2000s total to 4 years with an u/w profit.**Data for the 2010s includes 2010 and 2011.Note: Data for 1920–1934 based on stock companies only.Sources: Insurance Information Institute research from A.M. Best Data.
Recorded in the 25 Years from 1979 Through 2003

P/C Reserve Development, 1992–2011E
23.2$25
$30
$B)
6
8 Impac
Prior Yr. ReserveDevelopment ($B)
Prior year reserve releases totaled $8.8
billion in the first half of 2010 up from
11.7 13.79.9
7.3$
$10
$15
$20
e R
elea
se ($
2
4
6 ct on Com
b
Impact onCombined Ratio
half of 2010, up from $7.1 billion in the first half of 2009
2.3
-2.1 -2.6-6 6
-4.1
1
6 7 -5$10
-$5
$0
$5
rYr.
Res
erve
-2
0
ined Ratio (
-8.3 -6.6-9.9 -9.8
-6.7-9.5
-14.6-16 -15-$20
-$15
-$10
2 3 4 5 6 7 8 9 0 1 2 3 4 5 6 7 8 9 E E
Prio
r
-6
-4
(Points)
92 9 94 9 9 9 9 9 0 0 02 0 04 0 0 0 0 0
10E
11E
Reserve Releases Are Remained Strong in 2010 But Taper Off in 2011
61
Note: 2005 reserve development excludes a $6 billion loss portfolio transfer between American Re and Munich Re. Including this transaction, total prior year adverse development in 2005 was $7 billion. The data from 2000 and subsequent years excludes development from financial guaranty and mortgage insurance. Sources: Barclay’s Capital; A.M. Best.

P/C Estimated Loss Reserve Deficiency/ (Redundancy), Excl. Statutory Discount
Line of Business 12/31/09 12/31/10
P l A t Li bilit $2 5B $1 3BPersonal Auto Liability -$2.5B -$1.3BHomeowners -$0.3 $1.2Other Liab (incl. Prod Liab) $3.4 $3.7Workers Compensation $1.8 $4.4Commercial Multi Peril $0.9 $2.9Commercial Auto Liability -$0 6 -$0 1Commercial Auto Liability $0.6 $0.1Medical Malpractice -$5.2 -$4.2Reinsurance—Nonprop Assumed $2.6 $3.6All Oth Li $2 5 $1 2All Other Lines -$2.5 -$1.2
Total Core Reserves -$1.9 +$9.4Asbestos & Environmental $13.7 $9.9Total P/C Industry $11.8B $19.3B
Source: A.M. Best as of January 2012; Insurance Information Institute.

Financial Strength & gUnderwriting
Cyclical Pattern is P-C Impairment History is Directly Tied to
Underwriting, Reserving & Pricing
63
g, g g
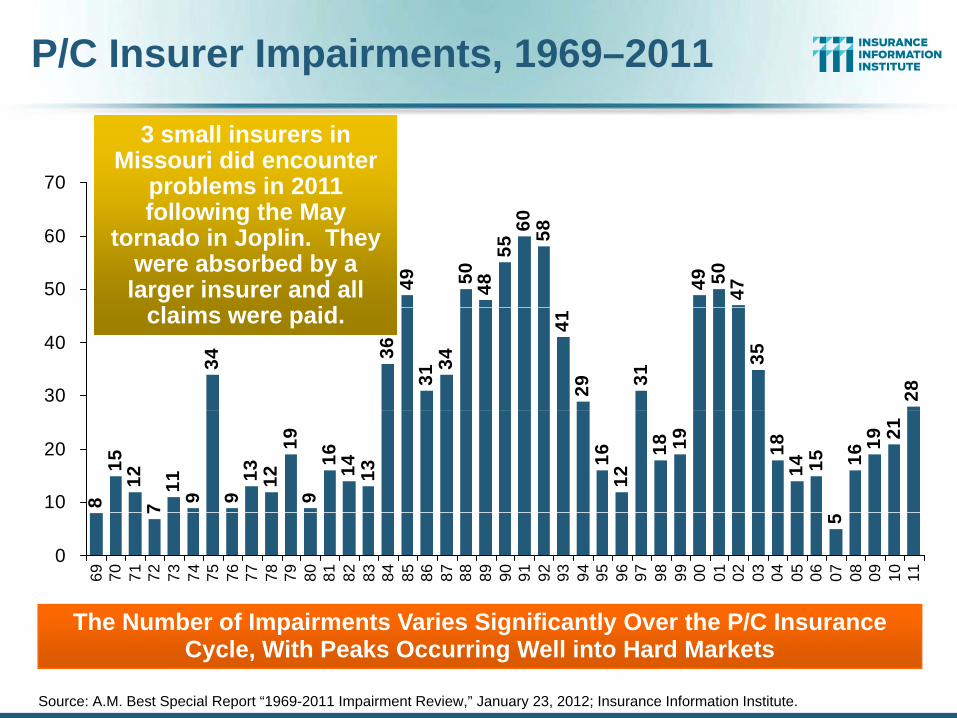
P/C Insurer Impairments, 1969–2011
70
3 small insurers in Missouri did encounter
problems in 2011 f ll i th M
49 50 4855
60 58
49 504750
60following the May
tornado in Joplin. They were absorbed by a larger insurer and all
l i id
34 36
3134
4129 31
35
2830
40claims were paid.
815
127
11 9 913 12
199
16 14 13
1612
18 19 1814 15 16
19 21
10
20
7 5
0
69 70 71 72 73 74 75 76 77 78 79 80 81 82 83 84 85 86 87 88 89 90 91 92 93 94 95 96 97 98 99 00 01 02 03 04 05 06 07 08 09 10 11
Th N b f I i t V i Si ifi tl O th P/C I
Source: A.M. Best Special Report “1969-2011 Impairment Review,” January 23, 2012; Insurance Information Institute.
The Number of Impairments Varies Significantly Over the P/C Insurance Cycle, With Peaks Occurring Well into Hard Markets
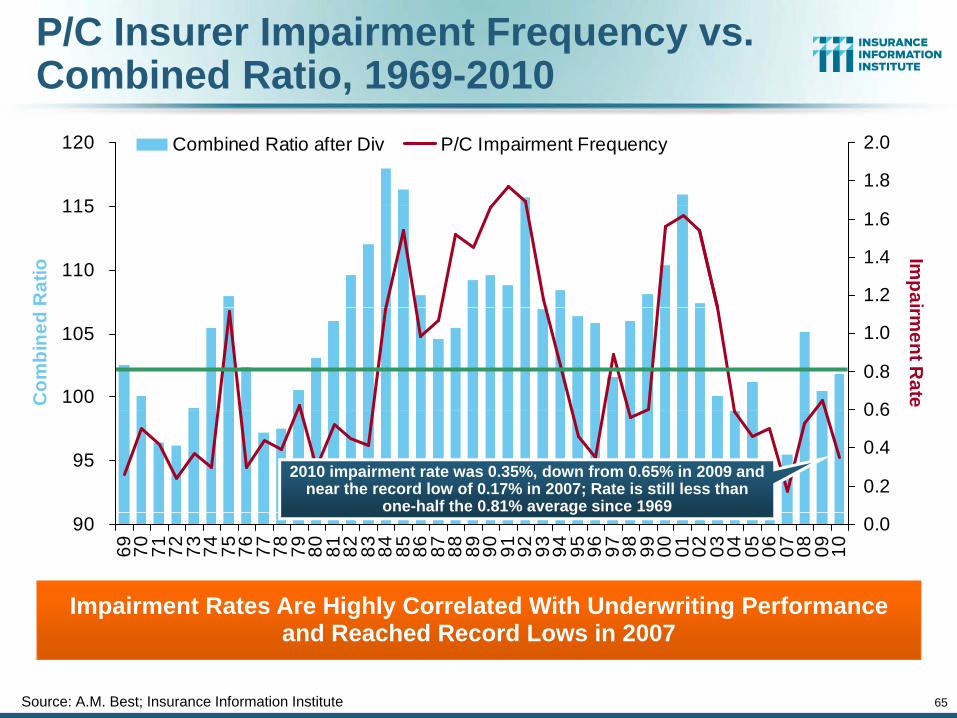
P/C Insurer Impairment Frequency vs. Combined Ratio, 1969-2010
115
120
1.8
2.0Combined Ratio after Div P/C Impairment Frequency
110
115
Rat
io
1.2
1.4
1.6
Impai
100
105
Com
bine
d
0 6
0.8
1.0
rment R
ate
950.2
0.4
0.6
2010 impairment rate was 0.35%, down from 0.65% in 2009 and near the record low of 0.17% in 2007; Rate is still less than
one-half the 0.81% average since 196990
69 70 71 72 73 74 75 76 77 78 79 80 81 82 83 84 85 86 87 88 89 90 91 92 93 94 95 96 97 98 99 00 01 02 03 04 05 06 07 08 09 10
0.0g
Impairment Rates Are Highly Correlated With Underwriting Performance
65Source: A.M. Best; Insurance Information Institute
p g y gand Reached Record Lows in 2007

Reasons for US P/C Insurer Impairments, 1969–2010
Historically, Deficient Loss Reserves and Inadequate Pricing AreBy Far the Leading Cause of P-C Insurer Impairments.
Investment and Catastrophe Losses Play a Much Smaller Role
3.6%4 0%
Investment and Catastrophe Losses Play a Much Smaller Role
Reinsurance Failure
Mi
Sig. Change in Business
4.0%8.6%
7.3%40 3%
Deficient Loss Reserves/Inadequate Pricing
Investment Problems (Overstatement of Assets)
Misc.
7.8%
40.3% Inadequate Pricing
Affiliate Impairment
7.1%
7.8% 13.6%Catastrophe Losses
66Source: A.M. Best: 1969-2010 Impairment Review, Special Report, April 2011.
Rapid GrowthAlleged Fraud

Top 10 Lines of Business for US P/C Impaired Insurers, 2000–2010
Workers Comp and Pvt. Passenger Auto Account for Nearly Half of the Premium Volume of Impaired Insurers Over the Past Decade
2.0%4 4%
Financial Guaranty
SuretyTitle
4.4%4.8%
6.5%
6 9%
26.6%Workers Comp
Other Liability
Med Mal
6.9%
7.7%Commercial Auto Liability
8.1%
10.9%
22.2%Pvt. Passenger Auto
Commercial Multiperil
67Source: A.M. Best: 1969-2010 Impairment Review, Special Report, April 2011.
Homeowners
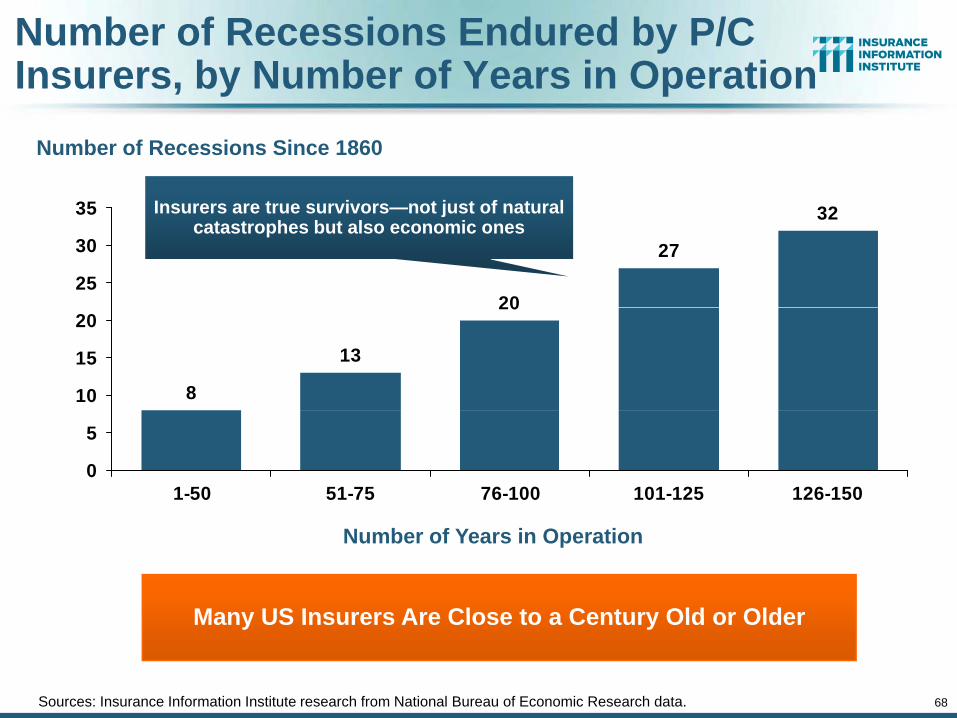
Number of Recessions Endured by P/C Insurers, by Number of Years in Operation
35
Number of Recessions Since 1860
Insurers are true survivors not just of natural 32
27
2025
30
35 Insurers are true survivors—not just of natural catastrophes but also economic ones
20
13
810
15
20
0
5
1-50 51-75 76-100 101-125 126-150
Many US Insurers Are Close to a Century Old or Older
Number of Years in Operation
68Sources: Insurance Information Institute research from National Bureau of Economic Research data.
Many US Insurers Are Close to a Century Old or Older

Performance by Segment:y gCommercial Lines
69
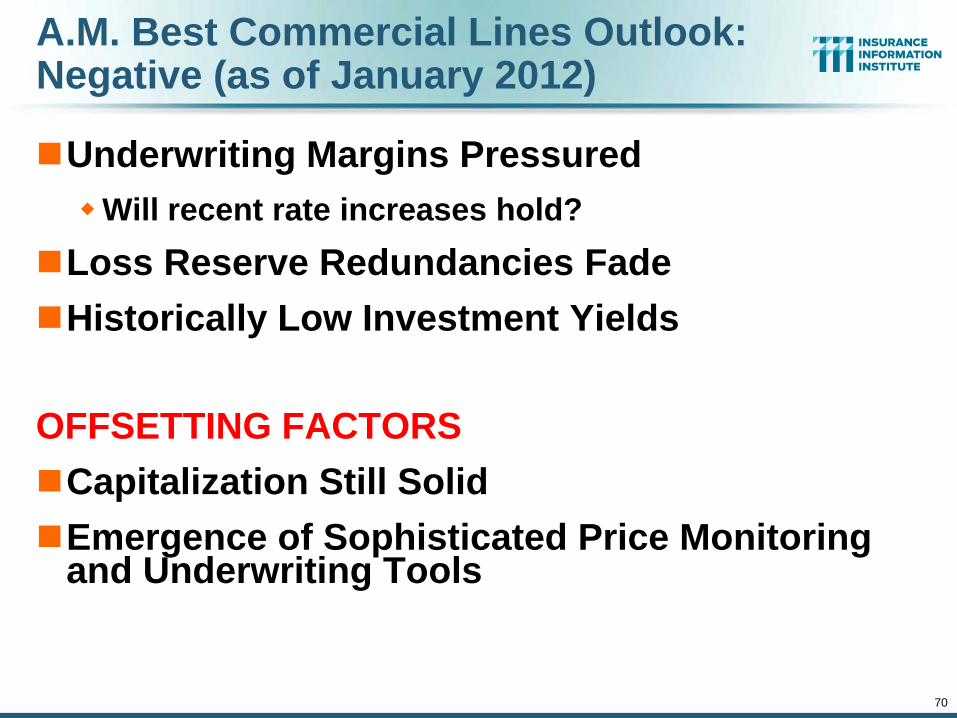
A.M. Best Commercial Lines Outlook: Negative (as of January 2012)
Underwriting Margins PressuredWill recent rate increases hold?Will recent rate increases hold?
Loss Reserve Redundancies FadeHi t i ll L I t t Yi ldHistorically Low Investment Yields
OFFSETTING FACTORSCapitalization Still SolidEmergence of Sophisticated Price Monitoring and Underwriting Tools
70
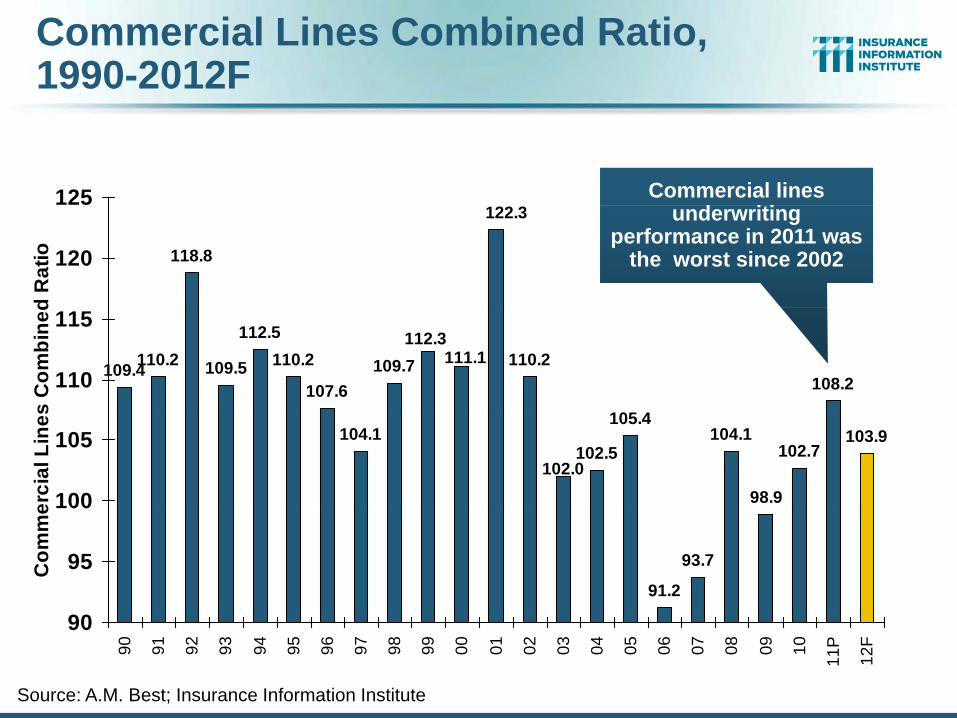
Commercial Lines Combined Ratio, 1990-2012F
125 Commercial lines
118.8
122.3
120
d R
atio
underwriting performance in 2011 was
the worst since 2002
109.4110.2 109.5
112.5110.2
107.6109.7 110.2
108.2111.1
112.3
110
115
s C
ombi
ned
104.1102.5
105.4104.1
98.9
102.7103.9
102.0
100
105
erci
al L
ines
91.2
93.7
90
95Com
me
90
90 91 92 93 94 95 96 97 98 99 00 01 02 03 04 05 06 07 08 09 10
11P
12F
Source: A.M. Best; Insurance Information Institute

Commercial Auto Combined Ratio: 1993–2011E
9 8.1
7 2125
112.
1
112.
0
113.
0
115.
9
2.7
5
118
115.
7
116.
2
110
115
120
102
95.2
92.9
92.1
92.4 94
.3 96.8 99
.5
98.0 10
0.5
95
100
105
9
80
85
90
95 96 97 98 99 00 01 02 03 04 05 06 07 08 09 10 11E
Commercial Auto is Expected to Deteriorate if Loss Frequency and Severity Trends Deteriorate 2010-2012Frequency and Severity Trends Deteriorate 2010 2012
Sources: A.M. Best (history); Insurance Information Institute (2011 estimate).

Commercial Multi-Peril Combined Ratio: 1995–2011P
5.0
4130
CMP-Liability CMP-Non-Liability
119.
0
119.
8
8.5
125
116.
2
116.
1
9 4
116.
8
113.
6
115.
3 122.
4
115.
0
117.
0
8.4
0113.
1
115.
0 121.
0
115120125130
10
104.
9
101.
9
105.
95.4 97
.7
94.2 96
.2100.
7
97.3
0
97.7
93.8
.8
10
98.6 10
2.5
105.
0
95100105110
9
89.0 9
83.8 89
.
80859095
95 96 97 98 99 00 01 02 03 04 05 06 07 08 09 10 11P*
Commercial Multi-Peril Underwriting Performance is Expected to Deteriorate Modestlyis Expected to Deteriorate Modestly
*2011P figure is III estimate for the combined liability and non-liability components.Sources: A.M. Best; Insurance Information Institute.

Inland Marine Combined Ratio: 1999–2011P
101.9105 0 9
92.8
100.2
93.2
89 393.0
89 995
100
83.8
79.5
89.386.1
80.882.5
89.9
80
85
90
77.3
70
75
80
99 00 01 02 03 04 05 06 07 08 09 10 11P
Inland Marine is Expected to Remain Among the Most Profitable of All LinesProfitable of All Lines
Sources: A.M. Best (historical); Insurance Information Institute estimate for 2011.
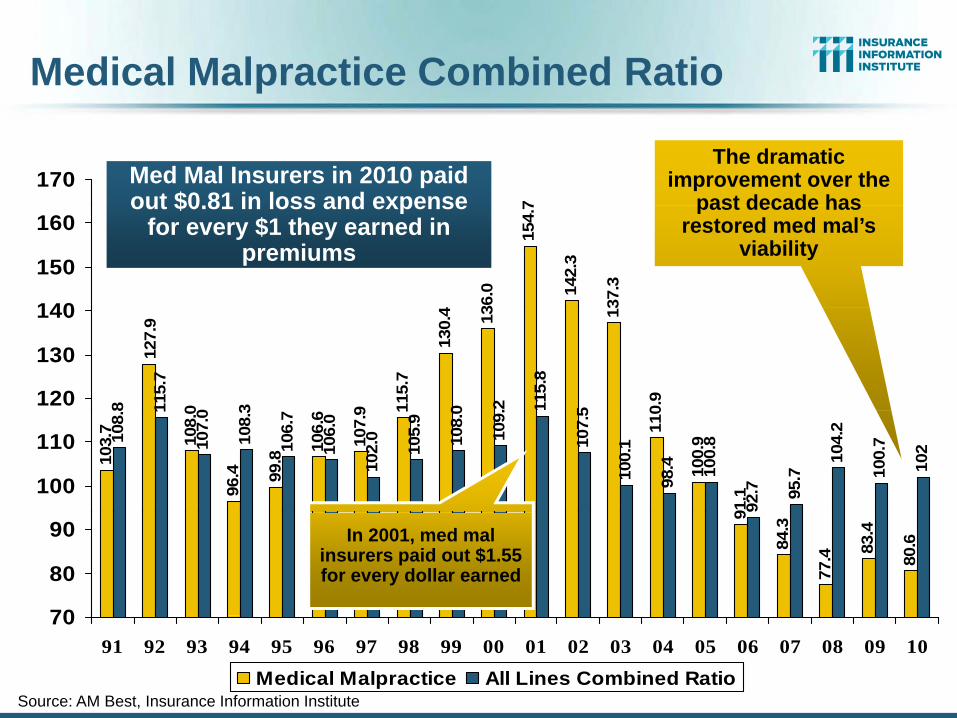
Medical Malpractice Combined Ratio
7
170 Med Mal Insurers in 2010 paid out $0 81 in loss and expense
The dramatic improvement over the
past decade has
4 36.0
154.
7
142.
3
37.3
140
150
160out $0.81 in loss and expense
for every $1 they earned in premiums
past decade has restored med mal’s
viability
0 9 115.
7
130.
4 13 13
0.98 115.
7
0 3 0 .2 115.
8
5
127.
9
120
130
140
103.
7
108.
0
96.4 99
.8
106.
6
107.
9 1
110
100.
9
91.1
108.
8 1
107.
0
108.
3
106.
7
106.
0
102.
0
105.
9
108.
0
109.
107.
5
100.
1
98.4 10
0.8
92.7 95
.7
104.
2
100.
7
102
100
110
9
84.3
77.4 83
.4
80.6
70
80
90 In 2001, med mal insurers paid out $1.55 for every dollar earned
7091 92 93 94 95 96 97 98 99 00 01 02 03 04 05 06 07 08 09 10
Medical Malpractice All Lines Combined RatioSource: AM Best, Insurance Information Institute

Workers Compensation Combined Ratio: 1994–2011P
.7130
110.
9
110.
0
07.0
7 6 .4 110.
6 116.
8
118.
0
121
07.0
115.
3
118.
2
110115120
125
102.
0
97.0 10
0.0
101.
0 1 0
102.
7
98.4 10
3.6
104.10
95100105
110
8085
9095
94 95 96 97 98 99 00 01 02 03 04 05 06 07 08 09 10 11P
Workers Comp Underwriting Results Are Deteriorating Markedly and the Worst TheyDeteriorating Markedly and the Worst They
Have Been in a DecadeSources: A.M. Best (1994-2010); Insurance Information Institute (2011P).

Workers Compensation pOperating Environment
The Weak Economy and Soft Market Have M d th W k C O tiMade the Workers Comp Operating
Increasingly Challenging
77

Workers Comp Medical Claim Costs Continue to Rise
$30 A l Ch 1991 1993 +1 9%
MedicalClaim Cost ($000s)
Average Medical Cost per Lost-Time ClaimDoes smaller pace of
increase suggest that small
$25
$30 Annual Change 1991–1993: +1.9%Annual Change 1994–2001: +8.9%Annual Change 2002-2009: +6.6%
+2.0%+5.4%+5.0%
+6.1%+6.1%
+9 1%
increase suggest that small med-only claims are
becoming lost-time claims?$ $2
$25
$27
$27.
$15
$20Cumulative Change = 238%
(1991-2010p)
+9.1%+5.4%
+7.7%+8.8%
+13.5%
+7 3%
$ $ $ $1
$11
$12
$13.3
$14.2
$16.2
$17.6
$18.9
$20.0
$21.8
$23.1
24.5
5.7
.1 7
$
$10
$15 +7.3%+10.6%
+8.3%+10.1%
+7.4%+5.1%+9.0%-2.1%+1.3%+6.8% $8.2
$8.9
9.4
0.1
1.1 .0 3$8.4
$8.2
$591 92 93 94 95 96 97 98 99 00 01 02 03 04 05 06 07 08 09 10p
Accident YearAccident Year
2010p: Preliminary based on data valued as of 12/31/20101991-2008: Based on data through 12/31/2008, developed to ultimateBased on the states where NCCI provides ratemaking services; Excludes the effects of deductible policies

Workers Comp Indemnity Claim Costs Decline in 2010
IndemnityClaim Cost ($ 000s) Claiming behavior has changed
significantly. Large numbers of lost time,
Average Indemnity Cost per Lost-Time Claim
+5.9%+5.6%21
23
25
-3%+8.2%+0.8%
low severity claims have entered the system—claims that previously were medical only, driving down average
indemnity costs per claim.
$2 $2 $
+10.1%+10.1%
+9.2%+3.1%+4.6%+1.6%+3.4%
+5.6%
15
17
19 Annual Change 1991–1993: -1.7%Annual Change 1994–2001: +7.3%Annual Change 2002–2009: +4.1%
$ $ $ $1
$12
$13.
$15.2
$16.6
$17.1
$17.9
22.8
23.0
22.3
$20.8
$19.9
$18.2
$18.8+1.0%-3.1%-2.8%+4.9%+1.7%+5.9%+7.7%
+9.0%+10.1%
9
11
13
$10.0
$9.7
$9.4
$9.9
$10.1
10.7
11.5
2.5 8
5
7
1991 1992 1993 1994 1995 1996 1997 1998 1999 2000 2001 2002 2003 2004 2005 2006 2007 2008 2009 2010p
2010p: Preliminary based on data valued as of 12/31/20101991–2008: Based on data through 12/31/2008, developed to ultimateBased on the states where NCCI provides ratemaking servicesExcludes the effects of deductible policies
Accident Year

Workers Compensation Premium Continues Its Sharp DeclineNet Written Premium
46.5 47.8 46.544 3
50 State Funds ($ B)
$ Billions
31 0 31 3 32.1
37.7
42.344.3
39.3
34.6 33.840
Private Carriers ($ B)
31.0 31.329.8 30.5
29.126.3
28.2 26.9 25.9 25.0
28.6
20
30
31.0 31.3 29.8 30.5 29.126.3 25.2 24.2 23.3 22.3
25.0 26.129.2 31.1
34.737.8 38.6 37.6
33.830.3 29.9
10
20
01990 1991 1992 1993 1994 1995 1996 1997 1998 1999 2000 2001 2002 2003 2004 2005 2006 2007 2008 20092010p
C l d YCalendar Yearp Preliminary
Source: 1990–2009 Private Carriers, Best's Aggregates & Averages; 2010p, NCCI1996–2010p State Funds: AZ, CA, CO, HI, ID, KY, LA, MD, MO, MT, NM, OK, OR, RI, TX, UT Annual Statements
State Funds available for 1996 and subsequent

Nonfarm Payroll (Wages & Salaries):Quarterly, 2005–2011:Q3
L t t (2011 Q3)y,
Billions$6,750 Peak was 2008:Q1
at $6.60 trillion.
Latest (2011:Q3) was $6.64 trillion,
a new peak
$6,250
$6,500
$6,000Growth rates in 2011
Q2 over Q1: 0 6%
$5 500
$5,750 Recent trough (2009:Q3) was $6.25 trillion, down
5% from prior peak.
Q2 over Q1: 0.6%Q3 over Q2: 0.4%
$5,500
2005
-01-
0120
05-0
4-01
2005
-07-
0120
05-1
0-01
2006
-01-
01
2006
-04-
0120
06-0
7-01
2006
-10-
0120
07-0
1-01
2007
-04-
0120
07-0
7-01
2007
-10-
0120
08-0
1-01
2008
-04-
0120
08-0
7-01
2008
-10-
01
2009
-01-
0120
09-0
4-01
2009
-07-
0120
09-1
0-01
2010
-01-
0120
10-0
4-01
2010
-07-
0120
08-1
0-01
2009
-01-
0120
09-0
4-01
2009
-07-
01
81
Note: Recession indicated by gray shaded column. Data are seasonally adjusted annual ratesSources http://research.stlouisfed.org/fred2/series/WASCUR; National Bureau of Economic Research (recession dates); Insurance Information Institutes.
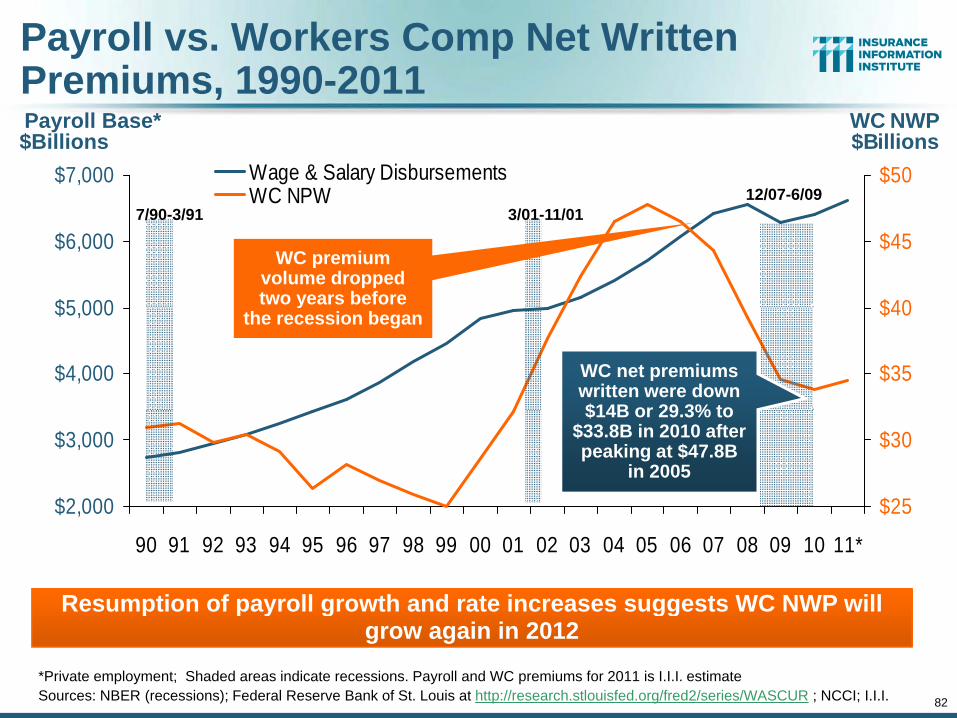
Payroll vs. Workers Comp Net Written Premiums, 1990-2011
$7,000 $50Wage & Salary DisbursementsWC NPW
Payroll Base* WC NWP
12/07-6/09
$Billions $Billions
$5 000
$6,000
$40
$457/90-3/91 3/01-11/01
WC premium volume dropped two years before
$4,000
$5,000
$35
$40ythe recession began
WC net premiums written were down $14B or 29 3% to
$2,000
$3,000
$25
$30$14B or 29.3% to
$33.8B in 2010 after peaking at $47.8B
in 2005
$2,000
90 91 92 93 94 95 96 97 98 99 00 01 02 03 04 05 06 07 08 09 10 11*
$25
Resumption of payroll growth and rate increases suggests WC NWP will
82
*Private employment; Shaded areas indicate recessions. Payroll and WC premiums for 2011 is I.I.I. estimateSources: NBER (recessions); Federal Reserve Bank of St. Louis at http://research.stlouisfed.org/fred2/series/WASCUR ; NCCI; I.I.I.
p p y g gggrow again in 2012

Workers Comp Rate Changes,2008:Q4 – 2011:Q4
The Q4 2011 WC rate h th l t
(Percent Change)
7.5%8%
10%
change was the largest among all major commercial lines
g )
2.6%4.1%
2%
4%
6%
-1.6%-2%
0%
2%
-5.5%-4.6% -4.0% -4.6%
-3.7% -3.9%-5.4%
-3.7% -3.4%
-8%
-6%
-4%
Source: Council of Insurance Agents and Brokers; Information Institute.
08:Q4 09:Q1 09:Q2 09:Q3 09:Q4 10:Q1 10:Q2 10:Q3 10:Q4 11:Q1 11:Q2 11:Q3 11:Q4

Direct Premiums Written: Worker’s CompPercent Change by State, 2005-2010*
Top 25 States
O l 7 ( ll) t t
34.4
23.1
25303540 Only 7 (small) states
showed growth in workers comp premium volume between 2005 and 2010
14.2
10.2
9.0
4.6
1.4
05
101520
chan
ge (%
)
-3.7
-7.3
-9.3
-10.
0
-10.
3
-10.
9
-10.
9
-13.
0
4.7
5.3
5.9 .9 .8-20
-15-10-50
Pece
nt c
- -1 -15
-15
-16
-17 .
-19.
8
-21.
4
-21.
7
-35-30-2520
OK
MT ID LA SD IA KS
NY WI
PA MS IL
NM NJ
NE
MD
NC AL
CT VA SC AR
MN
84*Excludes monopolistic fund states: ND, OH, WA, WY as well as WV, which transitioned to a competitive structure during this period.Sources: SNL Financial LC.; Insurance Information Institute.
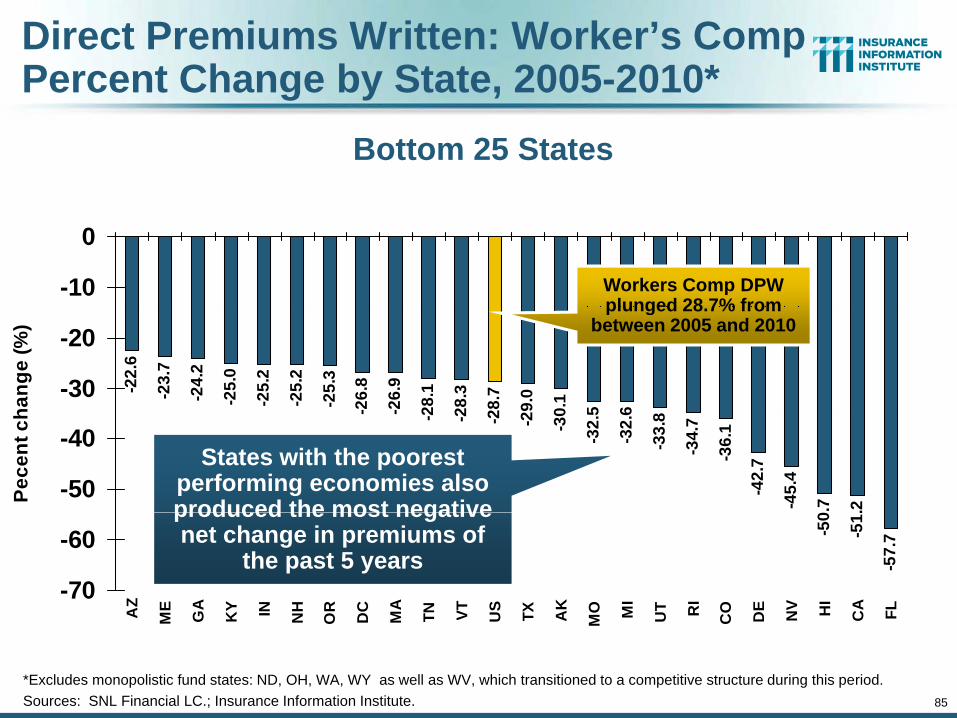
Direct Premiums Written: Worker’s CompPercent Change by State, 2005-2010*
Bottom 25 States
-10
0
Workers Comp DPW plunged 28 7% from
-22.
6
-23.
7
-24.
2
-25.
0
-25.
2
-25.
2
-25.
3
-26.
8
-26.
9
28.1
28.3 8.7
9.0
0.1
5 6
-30
-20
hang
e (%
)
plunged 28.7% from between 2005 and 2010
- - -2 -2 -2 -29
-30
-32.
5
-32.
6
-33.
8
-34.
7
-36.
1
-42.
7
-45.
4
.7 .2
-50
-40
Pece
nt c
h
States with the poorest performing economies also produced the most negative
-50
-51.
-57.
7
-70
-60
AZ
ME
GA
KY IN NH
OR
DC
MA
TN VT US TX AK
MO MI
UT RI
CO DE NV HI
CA FL
produced the most negative net change in premiums of
the past 5 years
85
A M G K I N O D M T V U T A M M U R C D N H C F
*Excludes monopolistic fund states: ND, OH, WA, WY as well as WV, which transitioned to a competitive structure during this period.Sources: SNL Financial LC.; Insurance Information Institute.

Workers Compensation Net Premiums Written and Annual Growth Rates: 1970-2010P
41.8$45 30%WC Net Premiums Written
($ Billions) WC premium growth hit a 40+ year low in
2009 at -13%. Improving labor $4
30.5
$35
$40
tten 20%
25%
Annu
Annual % Change in NPWImproving labor
markets began to help in 2010/11.
$3
$20
$25
$30
emiu
ms
Writ
5%
10%
15%
al % C
hang
$10
$15
$20
WC
Net
Pre
-5%
0%
5% e in WC
NP
$3.5
$0
$5
$
70 72 74 76 78 80 82 84 86 88 90 92 94 96 98 00 02 04 06 08 10-15%
-10%
W
86
70 72 74 76 78 80 82 84 86 88 90 92 94 96 98 00 02 04 06 08 10
Sources: A.M. Best (1973-2009); Insurance Information Institute calculations and estimates for 2010.
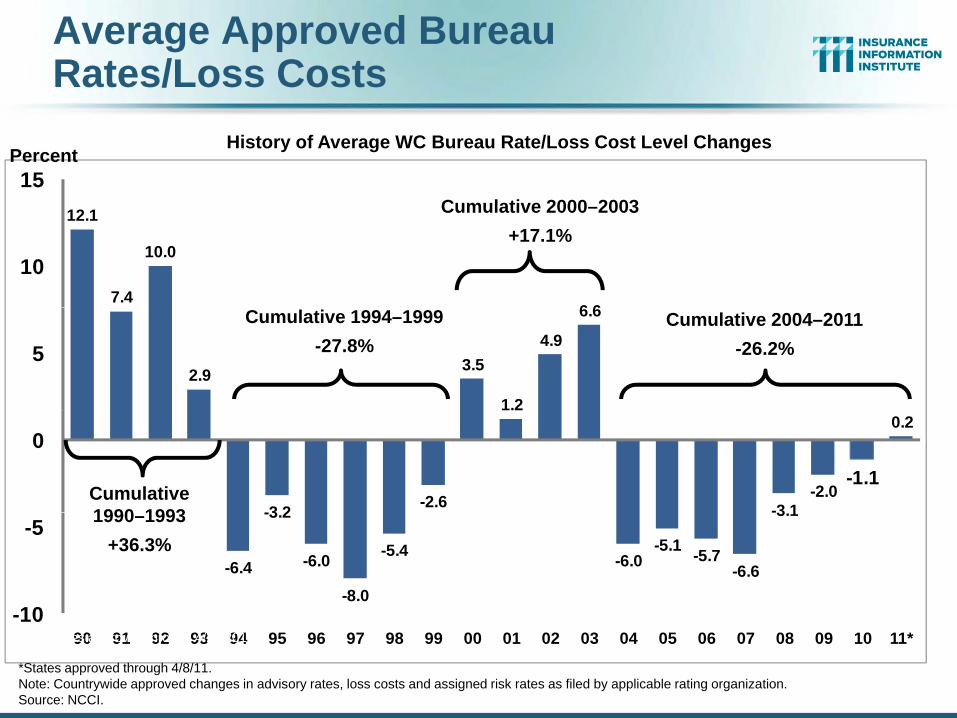
Average Approved BureauRates/Loss Costs
15Percent
Cumulative 2000 2003
History of Average WC Bureau Rate/Loss Cost Level Changes
12.1
7.4
10.0
6 6
10
Cumulative 2000–2003+17.1%
2.9 3.5
1.2
4.9
6.6
5Cumulative 2004–2011
-26.2%Cumulative 1994–1999
-27.8%
-3 2 -2.6
1.2
-3 1-2.0
-1.1
0.20
Cumulative1990 1993
-6.4
-3.2
-6.0
-8.0
-5.4 -6.0-5.1 -5.7
-6.6
-3.1
-10
-5
C l d Y
1990–1993+36.3%
-1090 91 92 93 94 95 96 97 98 99 00 01 02 03 04 05 06 07 08 09 10 11*
Calendar Year* States approved through 4/23/2010Countrywide approved changes in advisory rates, loss costs, and assigned risk rates as filed by the applicable rating organization
*States approved through 4/8/11.Note: Countrywide approved changes in advisory rates, loss costs and assigned risk rates as filed by applicable rating organization.Source: NCCI.

Average Approved BureauRates/Loss Costs
PercentAll States vs. All States Excluding California
Cumulative 2000–2010–13.6% All States–10.4% All States Excl. CA
C l d Y
88
Calendar Year* States approved through 4/8/2011Countrywide approved changes in advisory rates, loss costs, and assigned risk rates as filed by the applicable rating organization
Source: NCCI

Current NCCI Voluntary MarketFiled Rate/Loss Cost ChangesExcludes Law-Only Filingsy g
Ratio
89
States filed through 4/15/2011
•IN and NC filed in cooperation with state rating bureauSource: NCCI

Impact of Discounting on Workers Compensation Premium
Percent NCCI States—Private Carriers
P li Y
90
Policy Yearp PreliminaryDividend ratios are based on calendar year statisticsNCCI benchmark level does not include an underwriting contingency provisionBased on data through 12/31/2010 for the states where NCCI provides ratemaking servicesSource: NCCI

Final Premium vs. Estimated Premium by Policy Effective Quarter: 2006:Q1 – 2009:Q3
7.1%8% Recession6.0%
5.1% 4.7% 4.3%4.6%4%
6%
The recession led to
2.4% 2.3%
1.1%2%
negative premium audit adjustments
-1.3%-2%
0%
-3.4%
-4.6%-3.8% -3.6%
-2.6%
-6%
-4%
91
Note: WC Statistical Plan audited premium compared to policy-estimated premium. Based on states where NCCI provides ratemaking services, including state funds; excludes high deductible policies and mid-term cancellations.Source: NCCI
06:Q1 06:Q2 06:Q3 06:Q4 07:Q1 07:Q2 07:Q3 07:Q4 08:Q1 08:Q2 08:Q3 08:Q4 09:Q1 09:Q2 09:Q3

2 SURPLUS/CAPITAL/CAPACITY2. SURPLUS/CAPITAL/CAPACITY
Have Large Global Losses Reduced C it i th I d t S ttiCapacity in the Industry, Setting
the Stage for a Market Turn?
92
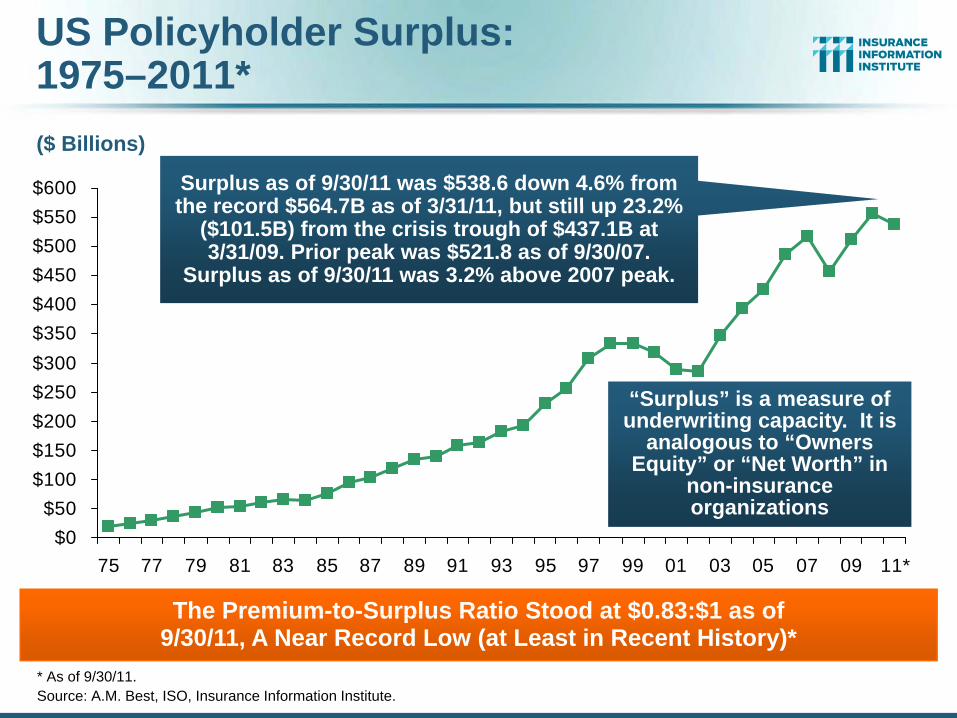
US Policyholder Surplus:1975–2011*
$600
($ Billions)
Surplus as of 9/30/11 was $538.6 down 4.6% from the record $564 7B as of 3/31/11 but still up 23 2%
$400$450$500$550 the record $564.7B as of 3/31/11, but still up 23.2%
($101.5B) from the crisis trough of $437.1B at 3/31/09. Prior peak was $521.8 as of 9/30/07.
Surplus as of 9/30/11 was 3.2% above 2007 peak.
$250$300$350$400
“Surplus” is a measure of
$50$100$150$200 underwriting capacity. It is
analogous to “Owners Equity” or “Net Worth” in
non-insurance organizations
$0$50
75 77 79 81 83 85 87 89 91 93 95 97 99 01 03 05 07 09 11*
organizations
The Premium-to-Surplus Ratio Stood at $0.83:$1 as of
* As of 9/30/11.Source: A.M. Best, ISO, Insurance Information Institute.
The Premium to Surplus Ratio Stood at $0.83:$1 as of9/30/11, A Near Record Low (at Least in Recent History)*

Policyholder Surplus, 2006:Q4–2011:Q3
($ Billions)
$564.7$580
2007:Q3Previous Surplus Peak
$512.8$521.8
$511 5
$540.7$530.5
$544.8$556.9 $559.1
$538.6
$515.6$517.9$520
$540
$560
$
$487.1$496.6
$512.8
$478.5
$455 6$463.0
$490.8
$511.5$505.0
$
$480
$500
$520
Surplus as of 9/30/11 was down 4.6% below its all time The Industry now has $1 of $455.6
$437.1
$420
$440
$460
06:Q4 07:Q1 07:Q2 07:Q3 07:Q4 08:Q1 08:Q2 08:Q3 08:Q4 09:Q1 09:Q2 09:Q3 09:Q4 10:Q1 10:Q2 10:Q3 10:Q4 11:Q1 11:Q2 11:Q3
record high of $564.7B set as of 3/31/11. Further declines are possible.
The Industry now has $1 of surplus for every $0.83 of NPW, close to the strongest claims-
paying status in its history.
06:Q4 07:Q1 07:Q2 07:Q3 07:Q4 08:Q1 08:Q2 08:Q3 08:Q4 09:Q1 09:Q2 09:Q3 09:Q4 10:Q1 10:Q2 10:Q3 10:Q4 11:Q1 11:Q2 11:Q3
Quarterly Surplus Changes Since 2011:Q1 Peak
11:Q2: -$5.6B (-1.0%) 11:Q3: -$26.1B (-4.6%)*Includes $22.5B of paid-in capital from a holding company parent for one
’
94Sources: ISO, A.M .Best.
insurer’s investment in a non-insurance business in early 2010.

Implied Excess (Deficit) Capital Assuming Premium/Surplus Ratio = 0.9:1
Excess/(Deficit) Capital (Policyholder Surplus)
$81.921.6%100 25%
Annual Change in Policyholder Surplus
2000-2002: Tech bubble bursts,
/
2006/07: Low CAT losses, strong underwriting results since 1940s
i it l
2009-10: End of financial crisis,
rising asset prices. modest
u/w losses push capital to
$22.9$42.6$41.713.4% 14.4%50
10%
15%
20%9/11, high
underwriting losses erode capital base
increase capital push capital to record levels
($10.6)
$
($10.8)
($49.2)($32.7)
8.2%
-5.1%
6.2%12.3% 8.9%
-50
0
0%
5%
10%
2008: Financial ($65.4)
($124.6)($103.0)
($76.5)-1.5%
-8.8%-12.0%
-4.6%
-150
-100
-15%
-10%
-5%
2005: Katrina, Rita, Wilma produce record CAT losses
crisis causes sharp drop in
capitalHigh cats, u/w losses push capital down150
2000 2001 2002 2003 2004 2005 2006 2007 2008 2009 2010 2011*15%
Capital Excess (Deficit) Annual Change in CapitalRecord Policyholder Surplus (Capital) Resulted in Significant Excess Capital in the P/C
Insurance Sector in 2010 Deteriorating Underwriting Losses Higher CAT Activity
capital down
Insurance Sector in 2010. Deteriorating Underwriting Losses, Higher CAT Activity, More Modest Market Returns Shrank Excess Capital in 2011 by Nearly Half.
Note: The assumption of a 0.9:1 P/S ratio is derived from a Feb. 2011 announcement by Advisen, Ltd., that the US P/C insurance industry has $74 billion in excess capital. The implied P/S ratio (calculated by III) is 0.88:1, which was rounded to 0.9:1.
Source: Insurance Information Institute calculations from A.M. Best and ISO data. * Net Premiums Written

M&A Activity in the US P/C Insurance Industry, 1997-2011*
9,50
7.0
40 000
45,000
90
100Value of Deals $ Mill)Number of Deals
P/C M&A activity in 2011 is up 60% since 2008, its highest level
$39
9.6
74
87
6669
5630,000
35,000
40,000
Mill
)
70
80
90
Nu
Number of Deals , g(in $ terms) since 2008
130.
5 $18,
142.
5
46.5
$22,
029
9.9 $1
7,34
6.9
$16,
114.
4
48 4753
51
56565552
42
40
20,000
25,000
e of
Dea
ls $
40
50
60
umber of D
ea
$12,
1
$10,
64
4.0
8.7
6.3
$10,
389
$4,7
57.7
$5,5
52.5
$6,9
74.1
$8,8
69.7
24
40
5 000
10,000
15,000
(Val
u
10
20
30
als
$984
$418
$586
0
5,000
97 98 99 00 01 02 03 04 05 06 07 08 09 10 11*0
10
M&A Activity in the P/C Insurance Industry Remains Well
96
*2011 data are through December 1.Source: SNL Securities; Insurance Information Institute.
M&A Activity in the P/C Insurance Industry Remains Well Below its 1990s Peak

M&A Activity Globally Among P/C Insurers Remains Subdued: Little Capacity Leaving
5.1 .2 .4 3.9
6.5
2010
Property-Casualty Life-Annuity Health/Managed Care Distribution Services
.4
$45
8
$1
8
$2
4
$13
.0$1
62010$2
4.
$5.8
$0.8
$9.4
3
$15.2009
$5.5
$2.3
$9.8
$7.6
$30.
3
2008
$51.
8
$13.
8
$15.
3
$6.9
$50.
6
2007
97
$0 $35 $70 $105 $140
Sources: Conning Research; Insurance Information Institute.
$ Billions

Paid-in Capital, 2005–2011:Q3($ Billions)
$30Paid-in capital for insurance
$
$27.4
$22.5
$20
$25 operations rose by $27.4B in 2010, the largest on
record dating back to 1959Virtually no new capital entered the industry in
$10
$15industry in
2011
$14.4
$3.8 $3.2
$12.3$1.5$4.9$6.6
$0
$5
$02005 2006 2007 2008 2009 2010 2011:Q3
In 2010 One Insurer’s Paid-in Capital Rose by $22.5B
98Source: ISO; Insurance Information Institute.
p yas Part of an Investment in a Non-insurance Business
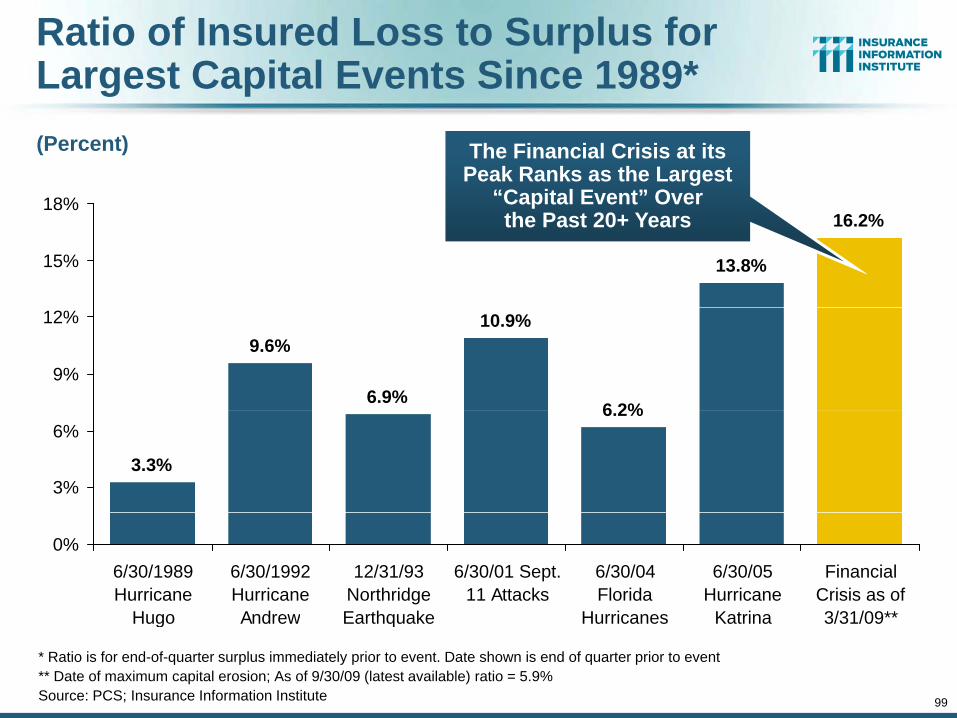
Ratio of Insured Loss to Surplus for Largest Capital Events Since 1989*
18%
The Financial Crisis at its Peak Ranks as the Largest
“Capital Event” Over
(Percent)
13.8%
16.2%
15%
18% pthe Past 20+ Years
9.6%
6.9%
10.9%
6 2%
9%
12%
3.3%
6.2%
3%
6%
0%6/30/1989Hurricane
Hugo
6/30/1992HurricaneAndrew
12/31/93NorthridgeEarthquake
6/30/01 Sept.11 Attacks
6/30/04Florida
Hurricanes
6/30/05Hurricane
Katrina
FinancialCrisis as of3/31/09**
99
* Ratio is for end-of-quarter surplus immediately prior to event. Date shown is end of quarter prior to event** Date of maximum capital erosion; As of 9/30/09 (latest available) ratio = 5.9%Source: PCS; Insurance Information Institute
Hugo Andrew Earthquake Hurricanes Katrina 3/31/09**

Historically, Hard Markets FollowWhen Surplus “Growth” is Negative*
30%
(Percent) Surplus growth was positive until Q1:2011
but is now down slightly
15%
20%
25%
0%
5%
10%
15%
-10%
-5%
0%
2008 surplus plunge did
not lead to a hard market
-15%78 79 80 81 82 83 84 85 86 87 88 89 90 91 92 93 94 95 96 97 98 99 00 01 02 03 04 05 06 07 08 09 10 11
NWP % change Surplus % change
Sharp Decline in Capacity is a Necessary but
100
* 2011 NWP and Surplus figures are % changes as of Q3:11 vs. Q3:10. Sources: A.M. Best, ISO, Insurance Information Institute
Sharp Decline in Capacity is a Necessary butNot Sufficient Condition for a True Hard Market
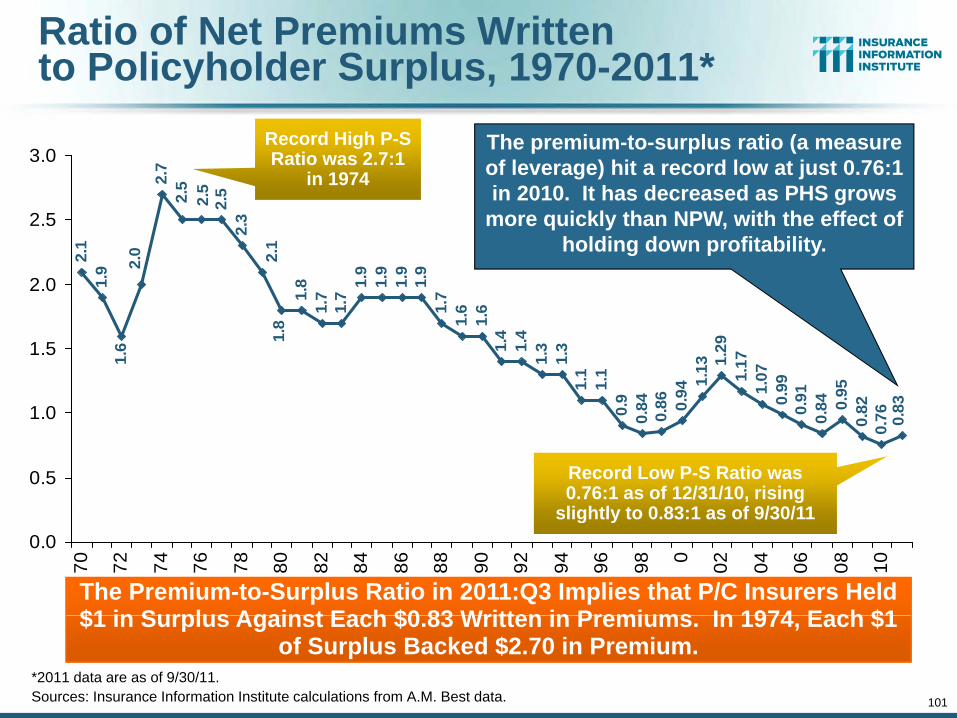
Ratio of Net Premiums Writtento Policyholder Surplus, 1970-2011*
2.7
2.52.52.5
3.0 The premium-to-surplus ratio (a measure of leverage) hit a record low at just 0.76:1 in 2010. It has decreased as PHS grows
Record High P-S Ratio was 2.7:1
in 1974
2.1
1.9
22.
3
1.8
1.7
1.7
1.9
1.9
1.9
1.9
1.7
6 6
2.0
2
2.1
2.0
2.5 more quickly than NPW, with the effect of holding down profitability.
1 1 11.
61.
61.
41.
41.
31.
31.
11.
10.
9 83
1.13
0.94
.8684
1.29
1.17
1.07
0.99
840.91 60.95
82
1.6 1.
8
1 0
1.5
0 0.800.0.8
0.80
0.760.8
0.5
1.0
Record Low P-S Ratio was 0.76:1 as of 12/31/10, rising
slightly to 0 83:1 as of 9/30/110.0
70 72 74 76 78 80 82 84 86 88 90 92 94 96 98 0 02 04 06 08 10
The Premium-to-Surplus Ratio in 2011:Q3 Implies that P/C Insurers Held $1 in Surplus Against Each $0 83 Written in Premiums In 1974 Each $1
slightly to 0.83:1 as of 9/30/11
101
$1 in Surplus Against Each $0.83 Written in Premiums. In 1974, Each $1 of Surplus Backed $2.70 in Premium.
*2011 data are as of 9/30/11.Sources: Insurance Information Institute calculations from A.M. Best data.
3. REINSURANCE MARKET CONDITIONS
R d Gl b lRecord Global Catastrophes Activity is
Pressuring Pricing
102
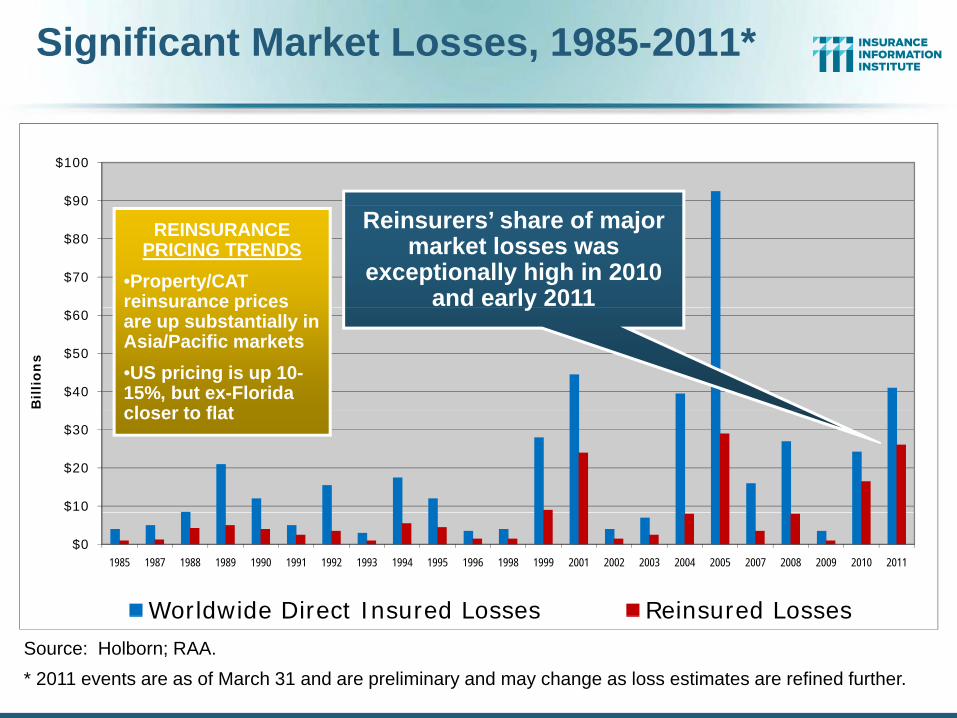
Significant Market Losses, 1985-2011*
$90
$100
$70
$80
$90
Reinsurers’ share of major market losses was
exceptionally high in 2010 and early 2011
REINSURANCE PRICING TRENDS
•Property/CAT reinsurance prices
$40
$50
$60
Bill
ion
s
ye su a ce p cesare up substantially in Asia/Pacific markets•US pricing is up 10-15%, but ex-Florida closer to flat
$10
$20
$30closer to flat
$0
$
1985 1987 1988 1989 1990 1991 1992 1993 1994 1995 1996 1998 1999 2001 2002 2003 2004 2005 2007 2008 2009 2010 2011
Worldwide Direct Insured Losses Reinsured LossesWorldwide Direct Insured Losses Reinsured LossesSource: Holborn; RAA.* 2011 events are as of March 31 and are preliminary and may change as loss estimates are refined further.

Reinsurer Share of Recent Significant Market Losses
Billions of 2011 Dollars
$40 Reinsurer Share
40% Reinsurance share of total insured loss$37.5
$20$25$30$35
Reinsurer SharePrimary Insurer Share
$15.073%
60%95%
$5$10$15$20
$4 0
$22.5 $9.5
$3 5
$13.0
$6.0
$10.0
$7.9
$8.3$2.2$2 8
$5.0
95%44%
$0Japan
Earthquake/Tsunami (Mar
New Zealand Earthquake (Feb
2011)
Thailand Floods(Aug - Nov 2011)
Chile Earthquake(Feb. 2010)
AustraliaCyclone/ Floods(Jan Feb 2011)
$0.4$4.0$3.5 $2.8
Tsunami (Mar2011)
2011) (Jan-Feb 2011)
Reinsurers Paid a High Proportion of Insured Losses Arising from
104
Source: Insurance Information Institute from reinsurance share percentages provided in RAA, ABIR and CEA press release, Jan. 13, 2011.
g p gMajor Catastrophic Events Around the World in Recent Years

Significant Market Losses by Event, 1985-2011*
Reinsurers are bearing a very high
Losses are putting pressure on property cat reinsurance prices in affected
regions. The impact for US property catastrophe pricing is uncertainbearing a very high
share of recent catastrophe losses
catastrophe pricing is uncertain.
Source: Holborn, RAA. *2011 events as of March 31 are preliminary and may change as loss estimates are refined further.

Global Property Catastrophe Rate on Line Index, 1990-2011 YTD (6/1/11)
A modest increase in global property catastrophe reinsurance pricing was evident in June 1 renewals in
the wake of record global catastrophe lossesthe wake of record global catastrophe losses.Jan. 1, 2012 renewals were up modestly (+10%) in
the US but higher in CAT-impacted areas.
Source: Guy Carpenter, GC Capital Ideas.com, September 26, 2011.

Historical Capital Levels of Guy Carpenter Reinsurance Composite, 1998—2Q11
Most excess reinsurance capacity
was removed from the market in 2011,the market in 2011, but there does not
appear to be a shortage, leading relatively flat 2012relatively flat 2012
reinsurance renewals except in areas hit
hard by CATs.
Source: Guy Carpenter, GC Capital Ideas.com, November 23, 2011.

4. RENEWED PRICING4. RENEWED PRICING DISCIPLINE
Is There Evidence of a Broad and Sustained Shift in Pricing?
108

Soft Market Persisted into Early 2011 but Growth Returned: More in 2012?
25%
(Percent)1975-78 1984-87 2000-03
20%
25%
Net Written Premiums Fell 0.7% in 2007 (First Decline
Since 1943) by 2.0% in 2008, d 4 2% i 2009 th Fi t 3
NWP was up 4.1% (est.) in
20112012
expected
10%
15%
and 4.2% in 2009, the First 3-Year Decline Since 1930-33.
2011 expected growth is
4.2%
5%
10%
5%
0%
109
-5%
71 72 73 74 75 76 77 78 79 80 81 82 83 84 85 86 87 88 89 90 91 92 93 94 95 96 97 98 99 00 01 02 03 04 05 06 07 08 09 10 11*
12
*2011 and 2012 figures are A.M. Best EstimatesShaded areas denote “hard market” periodsSources: A.M. Best (historical and forecast), ISO, Insurance Information Institute.
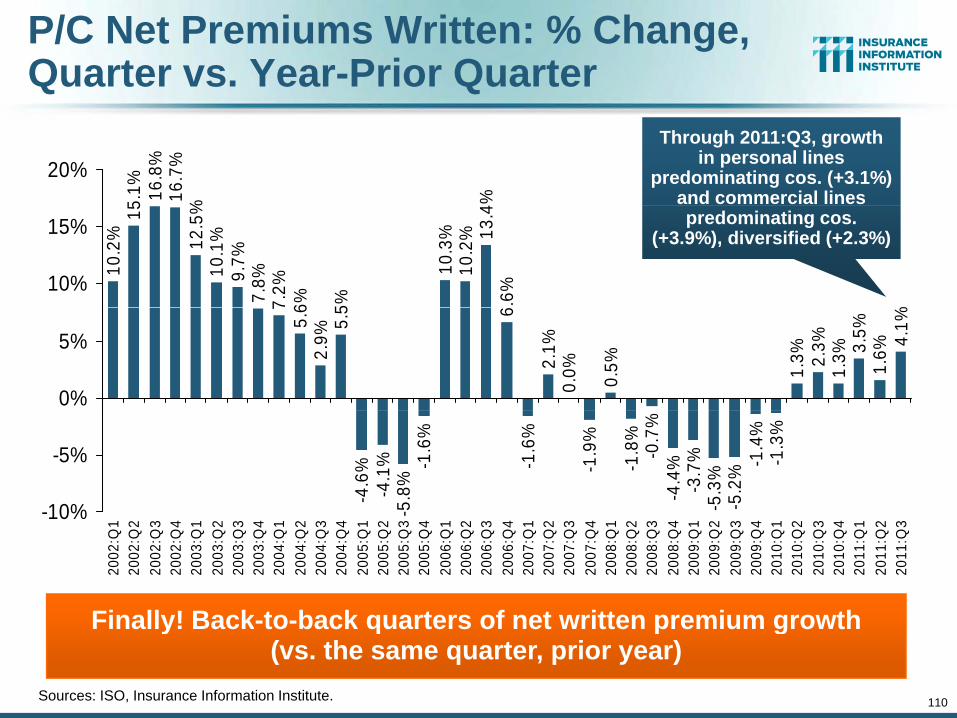
P/C Net Premiums Written: % Change, Quarter vs. Year-Prior Quarter
5.1% 16
.8%
16.7
%% %
20%Through 2011:Q3, growth
in personal lines predominating cos. (+3.1%)
and commercial lines
10.2
%15
12.5
%10
.1%
9.7%
7.8%
7.2%
6% 5%
10.3
%10
.2% 13
.4.6
%
%
10%
15% predominating cos. (+3.9%), diversified (+2.3%)
75.
62.
9%5.
5 6
2.1%
0.0% 0.5% 1.3% 2.
3%1.
3% 3.5%
1.6%
4.1%
0%
5%-4
.6%
-4.1
%-5
.8%
-1.6
%
-1.6
%
-1.9
%
-1.8
%-0
.7%
-4.4
%-3
.7%
-5.3
%-5
.2%
-1.4
%-1
.3%
-10%
-5%
Finally! Back to back quarters of net written premium growth
--10%
2002
:Q1
2002
:Q2
2002
:Q3
2002
:Q4
2003
:Q1
2003
:Q2
2003
:Q3
2003
:Q4
2004
:Q1
2004
:Q2
2004
:Q3
2004
:Q4
2005
:Q1
2005
:Q2
2005
:Q3
2005
:Q4
2006
:Q1
2006
:Q2
2006
:Q3
2006
:Q4
2007
:Q1
2007
:Q2
2007
:Q3
2007
:Q4
2008
:Q1
2008
:Q2
2008
:Q3
2008
:Q4
2009
:Q1
2009
:Q2
2009
:Q3
2009
:Q4
2010
:Q1
2010
:Q2
2010
:Q3
2010
:Q4
2011
:Q1
2011
:Q2
2011
:Q3
110Sources: ISO, Insurance Information Institute.
Finally! Back-to-back quarters of net written premium growth(vs. the same quarter, prior year)

Average Commercial Rate Change,All Lines, (1Q:2004–4Q:2011)
8%4%
Pricing as of Q3:2011 was positive for the first time
since 2003. Slightly stronger gains in Q4
(Percent)
2.8
-0.1
% 0.9%
1%2%
0%
2%gains in Q4.
-3.2
%% 4.
6%-2
.7%
-3.0
%3% %1% .9
%% 6% 3% % 2% 4%
-2.9
%
-0.1
-6%
-4%
-2%
-5.9
%-7
.0%
-9.4
%9.
7% -8.2
%- 4
-5.3
9.6%
% %-6
.4% -5. -4
-5.8
%-5
.6 -5.3
-6.4
% -5.2
-5.4
12%
-10%
-8%
Q2 2011 marked the 30th consecutive- -9 -9
-11.
3%-1
1.8%
-13.
3% -12.
0%-1
3.5%
-12.
9% -11.
0 %-16%
-14%
-12%
4 4 4 4 5 5 5 5 6 6 6 6 7 7 7 7 8 8 8 8 9 9 9 9 0 0 0 0 1 1 1 1
KRW Effect
30th consecutive quarter of price
declines
111
1Q04
2Q04
3Q04
4Q04
1Q05
2Q05
3Q05
4Q05
1Q06
2Q06
3Q06
4Q06
1Q07
2Q07
3Q07
4Q07
1Q08
2Q08
3Q08
4Q08
1Q09
2Q09
3Q09
4Q09
1Q10
2Q10
3Q10
4Q10
1Q11
2Q11
3Q11
4Q11
Source: Council of Insurance Agents & Brokers (1Q04-4Q11); Insurance Information Institute

Change in Commercial Rate Renewals, by Account Size: 1999:Q4 to 2011:Q4Percentage Change (%)
KRW Effect: No Lasting Impact
Pricing turned positive (+0.9%) in Q3:2011, the first increase in
nearly 8 years; Q4:2011 renewals were up 2 8%
Peak = 2001:Q4 +28.5%
renewals were up 2.8%Pricing Turned
Negative in Early 2004 and
Remained that f 7 ½way for 7 ½ years
Trough = 2007:Q3 -13.6%
112Source: Council of Insurance Agents and Brokers; Barclay’s Capital; Insurance Information Institute.

Cumulative Qtrly. Commercial Rate Changes, by Account Size: 1999:Q4 to 2011:Q4
1999:Q4 = 100
Despite Q4:2011 gain ofDespite Q4:2011 gain of 2.8%, pricing today is
where is was in late 2000 (pre-9/11)
Upward pricing pressure is small for largeis small for large accounts, 1.8% in
Q4:2011, vs. 3.1% for small accounts and 3.5%
for medium accounts
113Source: Council of Insurance Agents and Brokers; Barclay’s Capital; Insurance Information Institute.

Global Reinsurance Capital, 2007-2011:H1
Reinsurer Capital % Change
17%18%$500 20%Global reinsurance
$411 $402
$445$470
$420$440$460$480
5%
10%
15%market capacity is down in mid-2011 due to large
catastrophe losses
$411
$342
$402-5%
$360$380$400$420
10%
-5%
0%
5%
$342
-17%$300$320$340
2007 2008 2009 2010 2011 H1-20%
-15%
-10%
2007 2008 2009 2010 2011:H1
Reinsurer Capital Change
High Global Catastrophe Losses Have Had a Modest Adverse Impact on
Source: Aon Reinsurance Market Outlook, September 2011 from Individual Company and AonBenfield Analytics; Insurance Information Institute.
Global Reinsurance Market Capacity
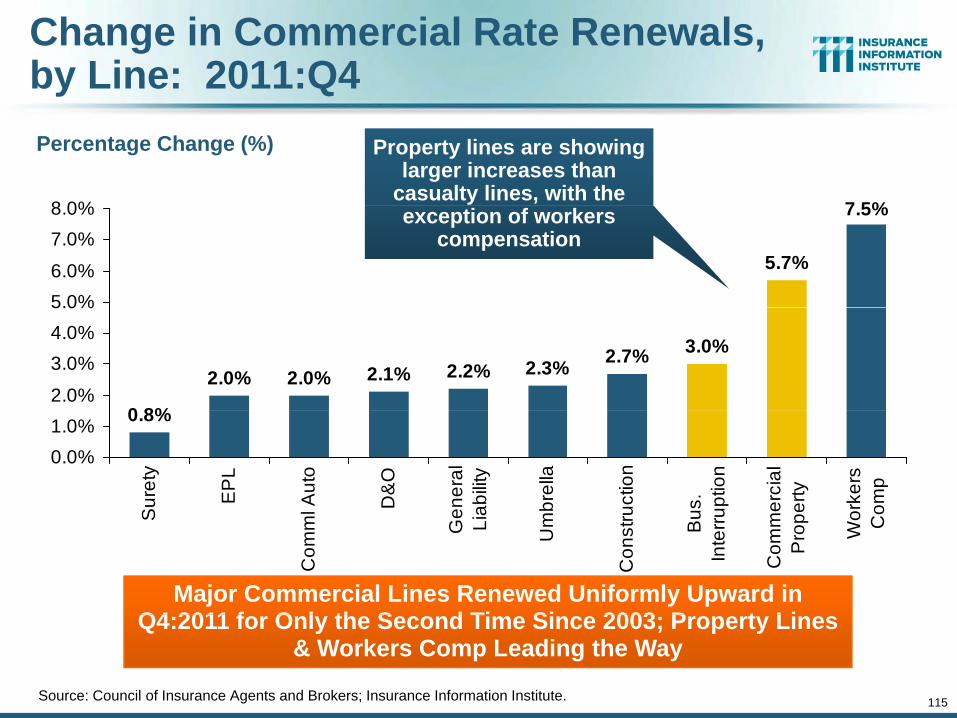
Change in Commercial Rate Renewals, by Line: 2011:Q4Percentage Change (%)
7 5%8 0%
Property lines are showing larger increases than
casualty lines, with the
5.7%
7.5%
5.0%6.0%
7.0%8.0% exception of workers
compensation
2.7% 3.0%
0 8%
2.0% 2.0% 2.1% 2.2% 2.3%2.0%
3.0%4.0%5.0%
0.8%
0.0%1.0%
Sur
ety
EP
L
l Aut
o
D&
O
ener
alab
ility
brel
la
uctio
n
us.
uptio
n
erci
aler
ty
orke
rsom
p
Major Commercial Lines Renewed Uniformly Upward in Q4 2011 f O l th S d Ti Si 2003 P t Li
S
Com
ml
Ge Lia
Um
Con
str u Bu
Inte
rru
Com
mP
rop
Wo Co
115Source: Council of Insurance Agents and Brokers; Insurance Information Institute.
Q4:2011 for Only the Second Time Since 2003; Property Lines & Workers Comp Leading the Way
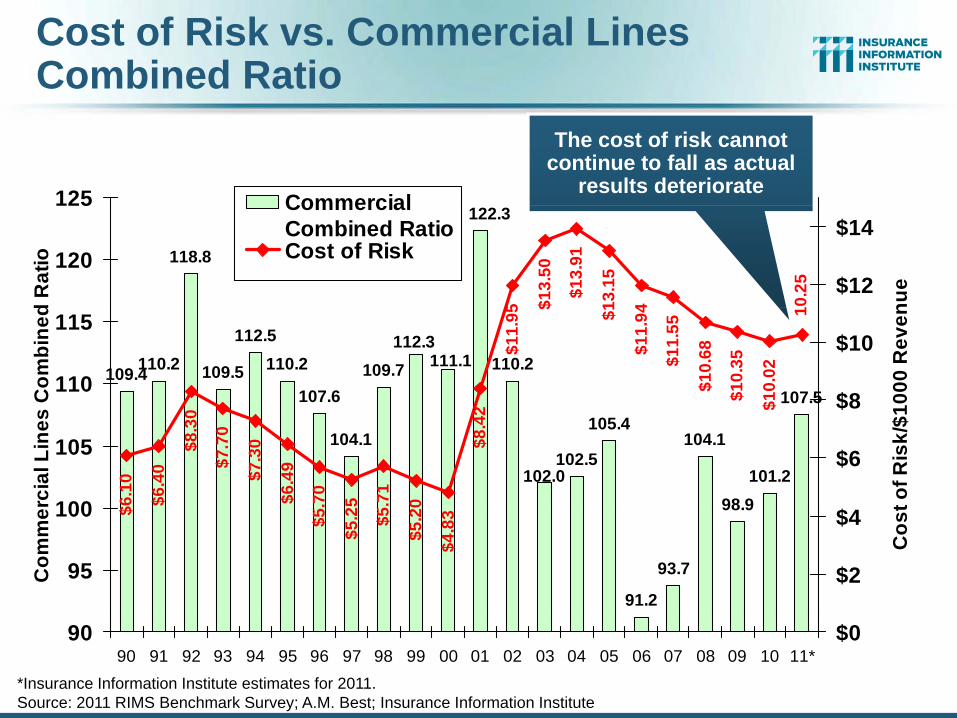
Cost of Risk vs. Commercial Lines Combined Ratio
125 Commercial
The cost of risk cannot continue to fall as actual
results deteriorate
118.8
122.3
$13.
91
13.1
5
4 0.25
5 $13.
50120
125
d R
atio
$12
$14
nue
CommercialCombined RatioCost of Risk
109.4110.2 109.5
112.5110.2
107.6109.7 110.2
107.5
111.1112.3
$1
$11.
94
$11.
55
$10.
68
$10.
35
$10.
02
1
$11.
9 5
$
2
110
115
s C
ombi
ned
$8
$10
1000
Rev
en
104.1102.5
105.4104.1
98.9101.2102.0$7
.30
$6.4
9
$8.3
0
$8.4
2
3205.71
255.70
$7.7
0
$6.4
0
$6.1
0
100
105
erci
al L
ines
$4
$6
$
t of R
isk/
$1
91.2
93.7
$4.8
3
$5.2$5
$5.2$5$
95
100
Com
me
$2
$4
Cos
9090 91 92 93 94 95 96 97 98 99 00 01 02 03 04 05 06 07 08 09 10 11*
$0
*Insurance Information Institute estimates for 2011.Source: 2011 RIMS Benchmark Survey; A.M. Best; Insurance Information Institute

How the Risk Dollar is Spent (2011)
Management & Professional Liability Costs Account for 9% - 13% of the Risk Dollar
Firms w/Revenues < $1 Billion
Liability
Firms w/Revenues > $1 Billion
T t l M tLiability
Li bilit
Liability Retained
Losses, 13%
Liability Premiums,
21%Retained Property
Losses, 3%
Total Mgmt. Liab., 6%
yRetained
Losses, 12%
Liability Premiums,
10%
Retained Property
Property Premiums,
WC Premium
6%
Property Losses, 8%
Total Mgmt. Liab., 5%
Premiums, 21%
WC RetainedTotal Prof.
Liability
Property Premiums,
13%
WC Retained Total Prof.
Liability
Source: 2011 RIMS Benchmark Survey, Advisen; Insurance Information Institute
WC Premiums,
8%
WC Retained Losses, 9%
Liability Costs, 8% Losses, 21%
yCosts, 3%

Direct Premiums Written: All P/C Lines Percent Change by State, 2005-2010
8
Top 25 StatesNorth Dakota is the growth
44.8
354045
North Dakota is the growth juggernaut of the P/C
insurance industry—too bad nobody lives there…
25.4
.8253035
hang
e (%
)
19.
17.3
16.6
14.2
13.9
12.4
12.3
11.9
9.1 .1 .1 1 810
1520
Pece
nt c
h
9 8 8 7.1
6.8
5.4
5.2
4.7
3.8
3.7
3.1
3.0
1.5
1.2
1.1
05
10
ND SD LA WY
OK
WV
KS IA TX MT
NE
DE
MS M SC DC UT AR
NC ID WA AL WI
AK
TN
118
N S L W O W K T M N D M N S D U A N I W A W A T
Sources: SNL Financial LC.; Insurance Information Institute.

Direct Premiums Written: All P/C Lines Percent Change by State, 2005-2010
0.7
0.6 1 .1
5Bottom 25 States
0 0 0. -0.
-0.3
-0.5
-0.8
-1.4
-1.6
-1.7
-2.5
-2.8
-2.9
-3.4
-3.6
4.1
4.5 .7 8-5
0
nge
(%)
- -4 -4 -4.
-4.
-5.7
-5.8
-8
-8.2
-8.3-10
Pece
nt c
han
States with the poorest performing economies also
US Direct Premiums Written declined by 1.6% between 2005
and 2010
-13.
5
-14.
2
-15.
5
-20
-15
P produced the most negative net change in premiums of
the past 5 years
and 2010
20
MD
MO KY IN NY
GA
MN VA US PA OR FL IL CT VT OH RI
CO NJ HI
ME
NH
MA AZ
NV MI
CA
119Sources: SNL Financial LC; Insurance Information Institute.

Other Cycle-Influencing Factors
Could Other Factors Act as a Catalyst to Turn the
Market?120
Market?

INVESTMENTS:INVESTMENTS: THE NEW REALITY
Investment Performance is a Key Driver of ProfitabilityKey Driver of Profitability
Does It Influence U d iti C li lit ?
121
Underwriting or Cyclicality?

Property/Casualty Insurance Industry Investment Gain: 1994–2011:Q31
$64.0$70
($ Billions)
$42.8$47.2
$52.3
$44.4 $45.3$48.9
$59.4$55.7
$39 2
$52.9
$42.0
$58.0$51.9
$56.9
$50
$60
$35.4 $36.0$31.7
$39.2
$20
$30
$40
Investment gains through Q3:2011 were $2.1B above the
$0
$10
$20 same period in 2010—a surprise given falling rates
and flat stock markets
94 95 96 97 98 99 00 01 02 03 04 05* 06 07 08 09 10 11:Q3
Investment Gains through Q3:2011 Were Surprisingly Robust. Investment Gains Recovered Significantly in 2010 Due to Realized Investment Gains;
The Financial Crisis Caused Investment Gains to Fall by 50% in 20081 Investment gains consist primarily of interest, stock dividends and realized capital gains and losses.* 2005 figure includes special one-time dividend of $3.2B.Sources: ISO; Insurance Information Institute.

P/C Insurer Net Realized Capital Gains/Losses, 1990-2011:3Q
9 2 81 $18.
02
3.02 16
.21
$20
($ Billions)$11.2B
positive swing
$2.8
8
$4.8
1 $9.8
9
$9.8
2
$10.
8
$13 $
$6.6
3
$6.6
1
$9.1
3
$9.7
0
$3.5
2 $8.9
2
$5.5
0
$9.2
4
$6.0
0
$1.6
6$5
$10$15$20
-$1.
21
7.98
$5.7
0
$15-$10
-$5$0
-$7 -$
$19.
81-$25-$20-$15
-$
90 91 92 93 94 95 96 97 98 99 00 01 02 03 04 05 06 07 08 09 1011:Q3
Insurers Are Posting Net Realized Capital Gains in 2011 for the First Time Si 2007 R li d C it l L W th P i C
123Sources: A.M. Best, ISO, Insurance Information Institute.
Since 2007. Realized Capital Losses Were the Primary Cause of 2008/2009’s Large Drop in Profits and ROE

U.S. 10-Year Treasury Note Yields:A Long Downward Trend, 1990–2011*g
8%
9%
Yields on 10-Year U.S.
6%
7%Treasury Notes have
been essentially below 4% since January 2008.
4%
5%
2%
3%Yields on 10-Year U.S. Treasury
Notes have been essentially below 5% for nearly a decade.
1%'90 '91 '92 '93 '94 '95 '96 '97 '98 '99 '00 '01 '02 '03 '04 '05 '06 '07 '08 '09 '10 '11
Since roughly 80% of P/C bond/cash investments are in 10-year or shorter durations,
124
*Monthly, through November 2011 Note: Recessions indicated by gray shaded columns.Sources: Federal Reserve Bank at http://www.federalreserve.gov/releases/h15/data/Monthly/H15_TCMNOM_Y10.txtNational Bureau of Economic Research (recession dates); Insurance Information Institutes.
Since roughly 80% of P/C bond/cash investments are in 10 year or shorter durations, most P/C insurer portfolios will have low-yielding bonds for years to come.

Daily Yields, 10-Year U.S. T-Notes vs. Moody’s Seasoned AAAs, 2010-2011*
5.00%
5.50%
3 50%
4.00%
4.50% We saw a slump like this in March
- August 2010
2.50%
3.00%
3.50%
UST 10 Y
1.50%
2.00%
10 10 10 10 10 10 10 10 10 10 10 10 10 11 11 11 11 11 11 11 11 11 11 11
UST 10‐YrMoody's AAA
01/0
1/
01/3
1/
03/0
2/
04/0
1/
05/0
1/
05/3
1/
06/3
0/
07/3
0/
08/2
9/
09/2
8/
10/2
8/
11/2
7/
12/2
7/
01/2
6/
02/2
5/
03/2
7/
04/2
6/
05/2
6/
06/2
5/
07/2
5/
08/2
4/
09/2
3/
10/2
3/
11/2
2/
The spread between the two yields reflects confidence (or lack of it) in the
125
*through 11/30/2011Sources: Federal Reserve Board at http://www.federalreserve.gov/releases/h15/data/Business_day/H15_TCMNOM_Y10.txtand http://www.federalreserve.gov/releases/h15/data/Business_day/H15_AAA_NA.txt
economy’s prospects. A wider spread indicates worry; narrower = confidence.
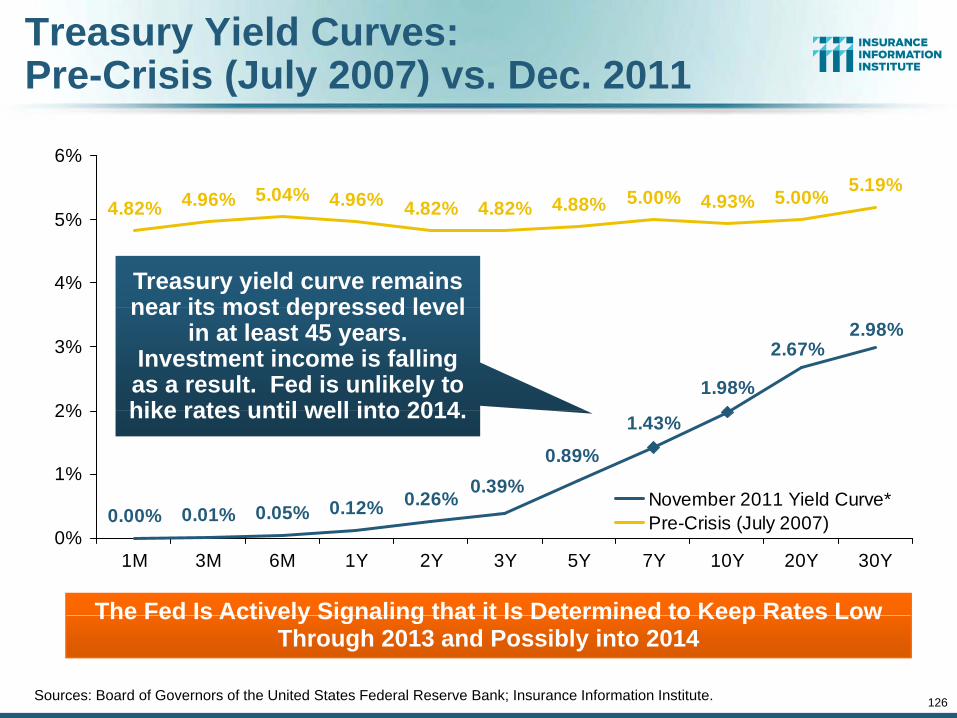
Treasury Yield Curves: Pre-Crisis (July 2007) vs. Dec. 2011
4 82% 4.96% 5.04% 4.96% 4 82% 4 82% 4 88% 5.00% 4 93% 5.00% 5.19%6%
4.82% 4.96% 4.96% 4.82% 4.82% 4.88% 4.93%
4%
5%
Treasury yield curve remains near its most depressed level
1.98%
2.98%2.67%
2%
3%
near its most depressed level in at least 45 years.
Investment income is falling as a result. Fed is unlikely to hike rates until well into 2014
0 00% 0 01% 0 05% 0.12% 0.26%
1.43%0.89%
0.39%1%
2%
November 2011 Yield Curve*
hike rates until well into 2014.
0.00% 0.01% 0.05% 0.12%0%
1M 3M 6M 1Y 2Y 3Y 5Y 7Y 10Y 20Y 30Y
Pre-Crisis (July 2007)
The Fed Is Actively Signaling that it Is Determined to Keep Rates Low
126
The Fed Is Actively Signaling that it Is Determined to Keep Rates Low Through 2013 and Possibly into 2014
Sources: Board of Governors of the United States Federal Reserve Bank; Insurance Information Institute.

Reduction in Combined Ratio Necessary to Offset 1% Decline in Investment Yield to Maintain Constant ROE, by Line*
l Lines
s Autop cia
lAuto Prop Cas Sure
tyy Lin
esl anc
e**
y
Persona
l L
Pvt Pas
s A
Pers Prop
Commerc
i
Comml A
u
CreditCom
m Pro
Comm C
a
Fidelity
/Su
Warranty
Surplus L
i
Med M
al
WC Reinsu
ran
.8%
.8%
.0% .9%
.1%
%
-3%-2%-1%0%
-1 -1 -2.
-3.6
%
-3.3
%
-3.3
%
-3.7
%
-4.3
%
-5.2
%
5.7%
-1 -2.
-3.1
%
-7%-6%-5%-4%
-5 -7.3%-8%
Lower Investment Earnings Place a Greater Burden on Underwriting and Pricing Discipline
127
Underwriting and Pricing Discipline*Based on 2008 Invested Assets and Earned Premiums**US domestic reinsurance onlySource: A.M. Best; Insurance Information Institute.

Shifting Legal Liability & g g yTort Environment
Is the Tort PendulumSSwinging Against Insurers?
128
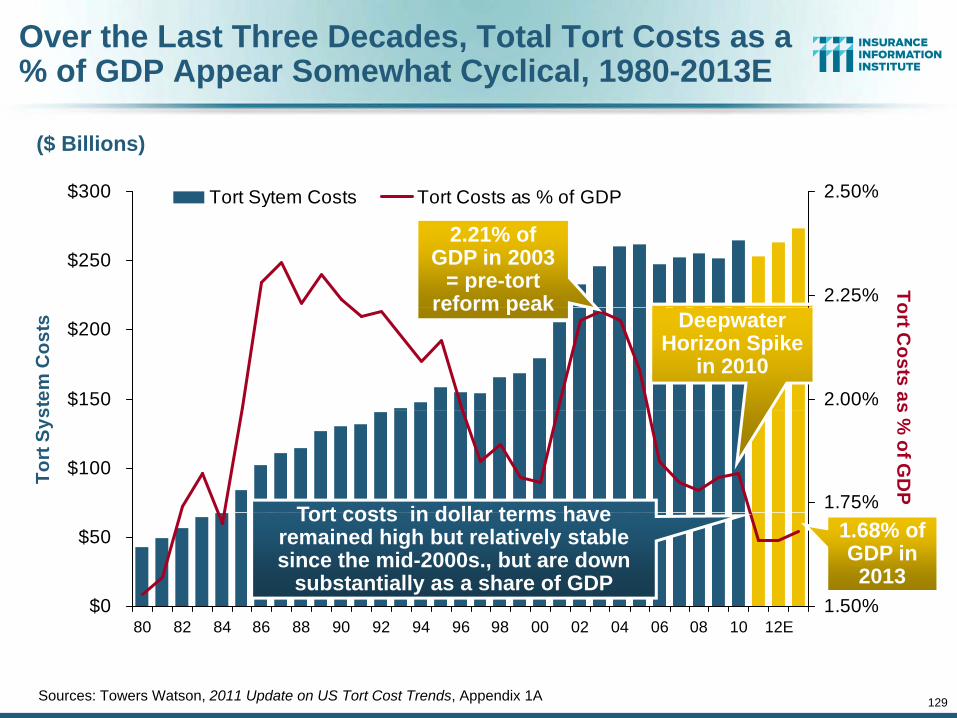
Over the Last Three Decades, Total Tort Costs as a % of GDP Appear Somewhat Cyclical, 1980-2013E
$300 2.50%Tort Sytem Costs Tort Costs as % of GDP
($ Billions)
$250
2.25% To
y
2.21% of GDP in 2003
= pre-tort reform peak
$150
$200
stem
Cos
ts
2.00%
ort Costs as
Deepwater Horizon Spike
in 2010
reform peak
$100Tort
Sys
1.75%
s % of G
DP
Tort costs in dollar terms have
$0
$50
1.50%
Tort costs in dollar terms have remained high but relatively stable since the mid-2000s., but are down
substantially as a share of GDP
1.68% of GDP in 2013
129
80 82 84 86 88 90 92 94 96 98 00 02 04 06 08 10 12E
Sources: Towers Watson, 2011 Update on US Tort Cost Trends, Appendix 1A

Commercial Lines Tort Costs: Insured vs. Self-(Un)Insured Shares, 1973-2010
Billions of Dollars2005: $143.5B 66.4% insured,
33.6% self-(un)insured
$120
$140
$160 Self (Un) Insured ShareInsurer Share$15.0
1973: 1985: $46 6B
1995: $83.6B 69.5% insured,
30.5% self-( )i d
(un)insured
$80
$100
$120
$9.5 $6.0
1973: Commercial Tort Costs
Totaled $6.49B, 94%
1985: $46.6B 74.5% insured,
25.5% self-(un)insured
(un)insured
$20
$40
$60 was insured, 6% self-
(un)insured 2009: $126.5B 64.4% insured,
35.6% self-( )i d
$0
$20
73 74 75 76 77 78 79 80 81 82 83 84 85 86 87 88 89 90 91 92 93 94 95 96 97 98 99 00 01 02 03 04 05 06 07 08 09 10
Tort Costs and the Share Retained by Risks Both Grew Rapidly from
(un)insured
130
Tort Costs and the Share Retained by Risks Both Grew Rapidly from the mid-1970s to mid-2000s, When Tort Costs Began to Fall But Self-
Insurance Shares Continued to RiseSources: Towers Watson, 2011 Update on US Tort Cost Trends, III Calculations based on data from Appendix 4.

Commercial Lines Tort Costs: Insured vs. Self-(Un)Insured Shares, 1973-2010
Percent 2010: $138.1B 56.6% insured, 44.4% self-(un)insured
80%90%
100%( )
(distorted by Deepwater Horizon event with most losses retained by BP)
50%60%70%
1973: 94% was insured,
6% self-( )i d
1985:74.5% insured,
25.5% self- 1995: 69.5% insured
2005: 66.4% insured
20%30%40%
Self (Un) Insured ShareI Sh
(un)insured (un)insured insured, 30.5% self-(un)insured
insured, 33.6% self-(un)insured
0%10%
73 74 75 76 77 78 79 80 81 82 83 84 85 86 87 88 89 90 91 92 93 94 95 96 97 98 99 00 01 02 03 04 05 06 07 08 09 10
Insurer Share
The Share of Tort Costs Retained by Risks Has Been Steadily
131
The Share of Tort Costs Retained by Risks Has Been Steadily Increasing for Nearly 40 Years. This Trend Contributes Has Left
Insurers With Less Control Over Pricing.Sources: Towers Watson, 2011 Update on US Tort Cost Trends, III Calculations based on data from Appendix 4.

Business Leaders Ranking of Liability Systems in 2010
Best States1 Delaware
Worst States41 New Mexico
New in 2010N l N t i1. Delaware
2. North Dakota
3 Nebraska
41. New Mexico
42. Florida
43. Montana
North DakotaMassachusettsSouth Dakota
Newly Notorious
New MexicoMontana3. Nebraska
4. Indiana
5. Iowa
43. Montana
44. Arkansas
45. IllinoisDrop-offs
Arkansas
Rising Above
6. Virginia
7. Utah
46. California
47. Alabama
MaineVermontKansas
TexasSouth CarolinaHawaii
8. Colorado
9. Massachusetts
48. Mississippi
49. LouisianaMidwest/West has mix of
10. South Dakota 50. West Virginia
Source: US Chamber of Commerce 2010 State Liability Systems Ranking Study; Insurance Info. Institute.
good and bad states.

The Nation’s Judicial Hellholes: 2010
West VirginiaIllinoisCook County
Watch ListMadison County, IL
Philadelphia
Atlantic County, NJSt. Landry Parish, LADistrict of Columbia
CaliforniaLos Angeles
NYC and Albany, NYSt. Clair County, ILDishonorable
Mention
Los Angeles and Humboldt
Counties
MentionMI Supreme CourtCity of St. LouisCO Supreme Court
NevadaClark County
CO S p C
133Source: American Tort Reform Association; Insurance Information Institute
South Florida

Avg. Jury Awards 1999 vs. 2003 and 2008
$7,000
$4,8
38
64 $4,8
85$5,4
46
$5 000
$6,000
38 $2,8
87
$
$4,1
$3,4
99
$3,7
17
$3,7
22
$
$
$4,000
$5,0001999 2003 2008
44 9
$2,3 $
99 901
1,04
6
49$2,000
$3,000
$64
$201 $5
8 9$79
$208
$ 9$
$327 $8
$0
$1,000
Overall Vehicular Premises Wrongful Medical ProductsOverall Vehicularliability
Premisesliability
Wrongfuldeath*
Medicalmalpractice
Productsliability
*Award trends in wrongful deaths of adult males.Source: Jury Verdict Research; Insurance Information Institute.
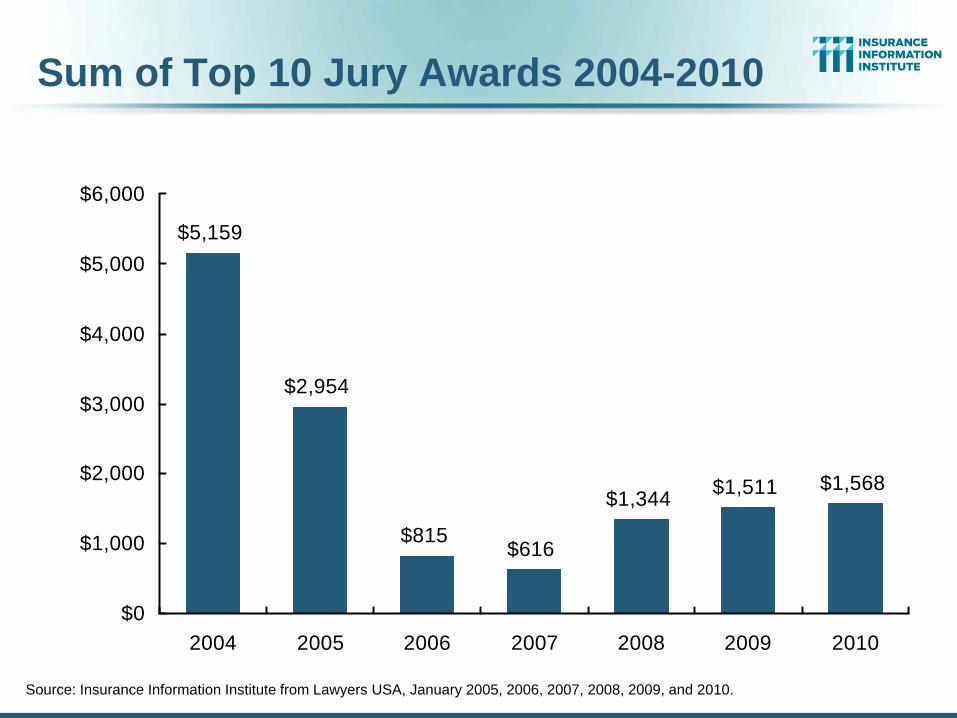
Sum of Top 10 Jury Awards 2004-2010
$6,000
$5,159$5,000
$2,954$3,000
$4,000
$1,344 $1,511 $1,568$2,000
$3,000
$815$616
$0
$1,000
$02004 2005 2006 2007 2008 2009 2010
Source: Insurance Information Institute from Lawyers USA, January 2005, 2006, 2007, 2008, 2009, and 2010.

InflationInflation
Is it a Threat to Claim Cost SSeverities
136
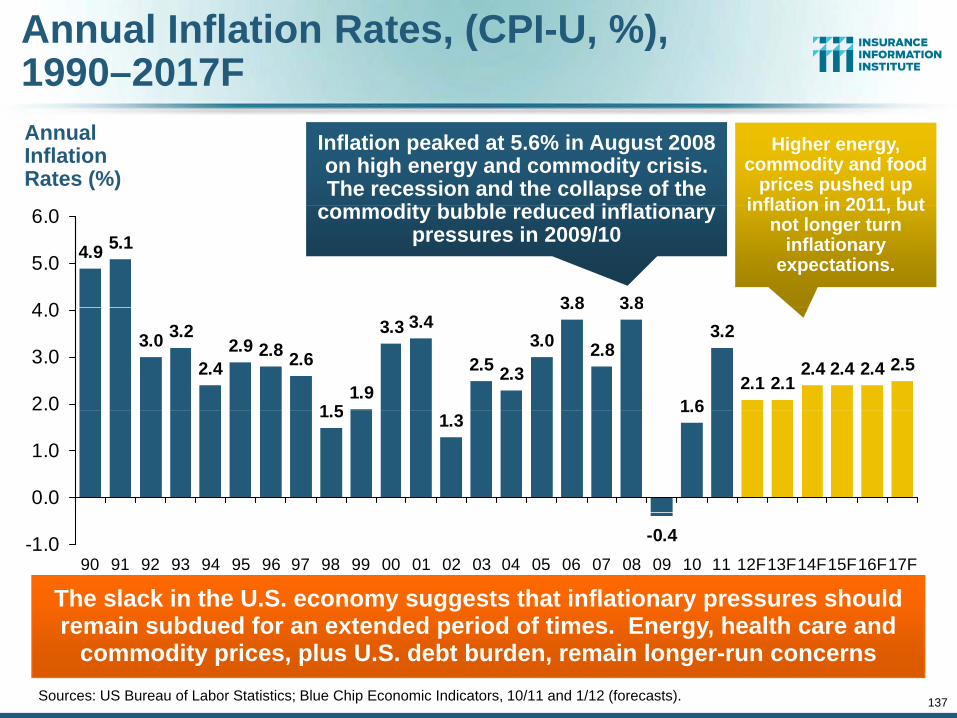
Annual Inflation Rates, (CPI-U, %),1990–2017FAnnual Inflation Rates (%)
Inflation peaked at 5.6% in August 2008 on high energy and commodity crisis. The recession and the collapse of the
dit b bbl d d i fl ti
Higher energy, commodity and food
prices pushed up inflation in 2011 but
3.8 3.8
5.14.9
4 0
5.0
6.0 commodity bubble reduced inflationary pressures in 2009/10
inflation in 2011, but not longer turn
inflationary expectations.
2.8 2.6
1 51.9
3.3 3.4
2.5 2.3
3.0
3.8
2.8
3.8
1.6
3.2
2.1 2.12.4 2.4 2.4 2.5
2.92.4
3.23.0
2.0
3.0
4.0
1.5 1.31.6
0.0
1.0
2.0
-0.4-1.090 91 92 93 94 95 96 97 98 99 00 01 02 03 04 05 06 07 08 09 10 11 12F13F14F15F16F17F
The slack in the U.S. economy suggests that inflationary pressures should
137Sources: US Bureau of Labor Statistics; Blue Chip Economic Indicators, 10/11 and 1/12 (forecasts).
remain subdued for an extended period of times. Energy, health care and commodity prices, plus U.S. debt burden, remain longer-run concerns

P/C Personal Insurance Claim Cost Drivers Grow Faster Than the Core CPI Suggests
8%
Price Level Change, 2011 vs. 2010
6.8%7.1%
6% Excludes Food and Energy
3 2%
5.1%
4.2%
3 2%
5.0%4%
Energy
3.2%
1.7%
3.0% 3.2%
2%
0%Overall CPI "Core" CPI Inpatient
HospitalServices
OutpatientHospitalServices
PrescriptionDrugs
Medical CareCommodities
LegalServices
Motor VehicleParts &
Equipment
ResidentialMaint. &Repair
Sources: Bureau of Labor Statistics; Insurance Information Institute.
q p p
Healthcare costs are a major liability, med pay, and PIP claim cost driver. They are likely to grow faster than the CPI for the next few years, at least
138

P/C Commercial Property Insurance Claim Cost Drivers Grow Faster than the Overall CPI Suggests
9.0%9%
Price Level Change, 2011 vs. 2010
7.1%6% Excludes
Food and5.4%
3 6%3%
Food and Energy
3.2%3.6%
1.7%
3%
0%Overall CPI "Core" CPI Inputs to
ConstructionIndustries
Non-residentialmaintenance &
repair
Asphalt Paving &Roofing Materials
Plumbing Fixtures &Fittings
Sources: Bureau of Labor Statistics; Insurance Information Institute.
p
Copper prices spiked and retreated in 2011. In July its price was 33% higher than a year earlier; by November it cost 8% less than in November 2010.
139

Medical Cost Inflation Has Outpaced Overall Inflation Over 50 Years
1589.81800
All ItemsMedical Care
1500
100) A claim that cost $1,000 in 1961
would cost nearly $16,000 based on
719.8900
1200
alue
(196
1=
would cost nearly $16,000 based on medical cost inflation trends over the
past 50 years.
300
600
Inde
x V
a
0
300
61 66 71 76 81 86 91 96 01 06 1*6 6 7 7 8 8 9 9 0 0 11
*Based on change from Feb. 2011 to Feb. 2010 (latest available) Source: Department of Labor (Bureau of Labor Statistics)

Regulatory Environment & Financial Services Reform
Insurers Not as Impacted as Banks But Dodd FrankBanks, But Dodd-Frank
Implementation Has Been a Concern for Insurers
141
Concern for Insurers
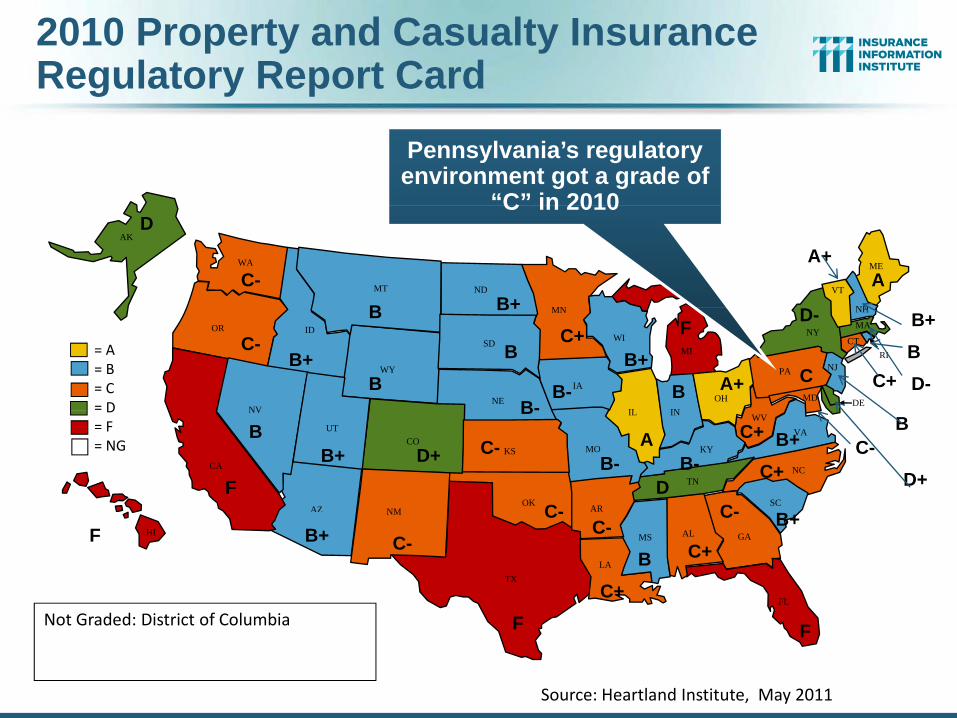
2010 Property and Casualty InsuranceRegulatory Report Card
Pennsylvania’s regulatory environment got a grade of
“C” in 2010
ME
NH
ND
MN
WA
AL
VTMT
AK
B+C-
B
D
A+A
C in 2010
NH
MA
CT
PA
NE
MN
MI
IL
IA
IDOR
NJRI B
DE
NY
MD
SD WI
INOH
NV
WY
= A= B= C= D
B+
B
B+
B+C-
B
B- D-B+
A+B
BC+
B-
C+
C
F D-
WVVA
NC
OK
IL
AZSC
TN
ARNM
KYMOKS
IN
CA
NV
UTCO
D= F= NG
B B+
DB-
B
C+
C-
C-B
C-
C-C+
B+A
B-
B-
D+FD+
Source: James Madison Institute, February 2008.
LATX
HI GAAL
FL
MS
NM
C- B+C-F
C-B+ C- C+B
C+N t G d d Di t i t f C l bi
Source: Heartland Institute, May 2011
F FNot Graded: District of Columbia

Dodd-Frank & Insurance One Year:Status Report
Expectations vs. Reality
143

Dodd-Frank ImplementationStatus Report for Insurers: Slow Start
Financial Stability Oversight Council—Slow to Consider Insurer Concerns
The Dodd-Frank Wall Street Reform and Consumer Protection Act
FSOC deliberates largely behind closed doors
Criteria and process for designation of Systemically Important Financial Institutions (SIFIs) were not announced until October 12, 2011( )
• Possible that small number of US insurers will be designated as SIFIs
Operated/deliberated until late September 2011 without a voting member representing the insurance industryrepresenting the insurance industry
• Roy Woodall, approved by Senate in Sept. 27, 2011, is the sole voting representative for the entire p/c and life insurance industry (was Kentucky Ins. Comm. 1966-1967; Worked in other insurance trade posts, Treasury); p , y)
Two non-voting FSOC members represent insurance interests:
• FIO Director Michael McGraith (started June 1, 2011)
Mi i I Di t J h H ff ( t t d i S t 2010)
144
• Missouri Insurance Director John Huff (started in Sept. 2010)
Not allowed to brief fellow regulators on FSOC discussionsSource: Insurance Information Institute (I.I.I.) updates and research

Dodd-Frank Implementation:SYSTEMIC RISK CRITERIA
All Banks with Assets > $50B Considered Systemically Important
The Dodd-Frank Act and Systemic Importance
Non-Bank Financial Groups with Global Consolidated Assets > $50B Will Be Examined for Systemic Riskiness, But Not Automatically Labeled as a Systemically Important Financial Institution (SIFI)
Foreign firms with assets in the US exceeding $50 billion will also fall under reviewIf Firm Exceeds the $50B Threshold, a 3-Stage Test AppliesSTAGE 1: Non-Banks Financial Groups with $50B+ Assets Will Be Evaluated on Five “Uniform Quantitative Thresholds,” at Least One of Which Will Have to Be Met to Trigger a Further (Stage 2) Review Potentially Leading to a SIFI Designation
Leverage: Would have to be leveraged more than 15:1 (insurers unlikely to trigger)ST Debt-to-Assets: Would have to a ratio of ST debt (less than 12 months to maturity) to consolidate assets exceeding 10%Debt: Have total debt exceeding $20 billion (i.e., loans borrowed and bond issues)Debt: Have total debt exceeding $20 billion (i.e., loans borrowed and bond issues)Derivative Liabilities: Have derivative liabilities exceeding $3.5 billionCredit Default Swaps: Have more than $30 billion CDS outstanding for which the nonbank financial firm is the reference entity (i.e., CDS written against firm’s failure)
Thresholds Considered to Be Guideposts
145
Thresholds Considered to Be GuidepostsNot all companies that breach a barrier will be deemed systemically importantRegulators retain right to include firms that do meet any of the criteria
Source: Financial Stability Oversight Council; Insurance Information Institute (I.I.I.) research.

Dodd-Frank Implementation:SYSTEMIC RISK CRITERIA (continued)
STAGE 2: Analysis of Firms Triggering Uniform Quantitative Thresholds
The Dodd-Frank Act and Systemic Importance
Firms triggering one or more of the quantitative thresholds in Stage 1 will be analyzed using publicly available information in order to conduct a more thorough reviewNo data call will be required at this stageFirms viewed as potentially systemically important (candidate SIFIs) will subject to a Stage 3 analysisFirms viewed as potentially systemically important (candidate SIFIs) will subject to a Stage 3 analysis
STAGE 3: Analysis of Candidate Systemically Important Financial InstitutionsFirms deemed in Stage 2 to be potentially systemically important will be subjected to more detailed analysis including data not available during the Stage 2 analysisS 3 fi ill b ifi d b h FSOC h h d id i d ill h hStage 3 firms will be notified by the FSOC that they are under consideration and will have the opportunity to contest their consideration
SIFI DESIGNATION PROCEDURE: 2-Stage Voting Procedure by FSOC is Required Before a Final SIFI Designation is Made
At the conclusion of the Stage 3, FSOC has the authority to propose a firm be designated as a SIFIRequires 2/3 majority vote of FSOC members, including affirmation of the Chair (Treasury Secretary)Potential SIFI firm will be given written explanation for the determinationFirm can request a hearing to contest the determination
146
Firm can request a hearing to contest the determinationFinal determination requires another 2/3 majority of FSOC members and affirmation of the Chair
Source: Financial Stability Oversight Council; Insurance Information Institute (I.I.I.) research.
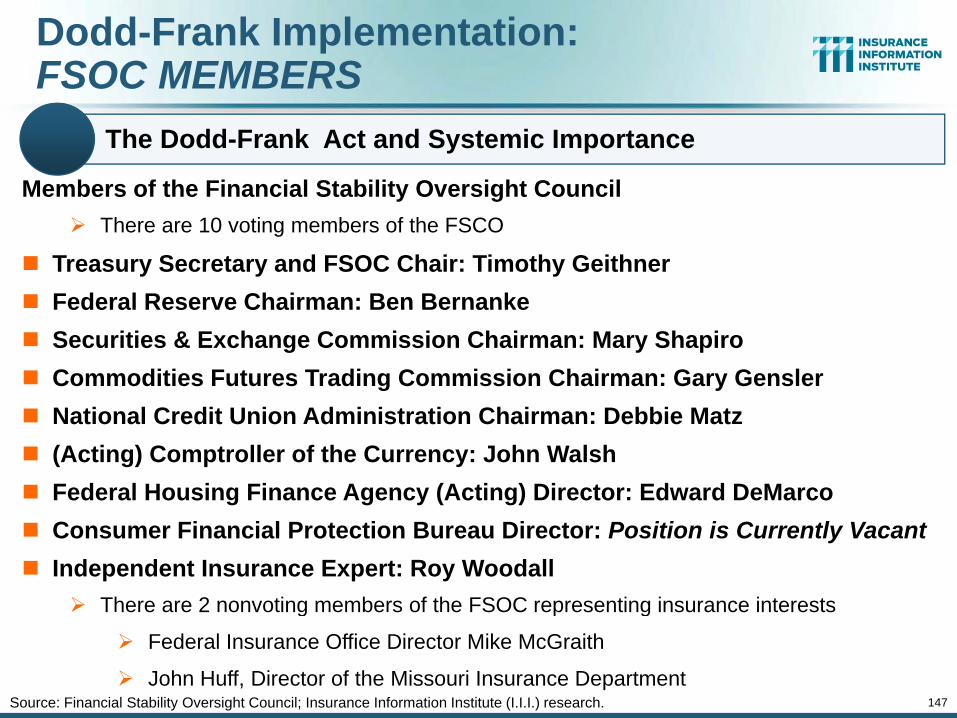
Dodd-Frank Implementation:FSOC MEMBERS
Members of the Financial Stability Oversight Council
The Dodd-Frank Act and Systemic Importance
There are 10 voting members of the FSCO
Treasury Secretary and FSOC Chair: Timothy GeithnerFederal Reserve Chairman: Ben BernankeFederal Reserve Chairman: Ben BernankeSecurities & Exchange Commission Chairman: Mary ShapiroCommodities Futures Trading Commission Chairman: Gary GenslerN ti l C dit U i Ad i i t ti Ch i D bbi M tNational Credit Union Administration Chairman: Debbie Matz(Acting) Comptroller of the Currency: John WalshFederal Housing Finance Agency (Acting) Director: Edward DeMarcoConsumer Financial Protection Bureau Director: Position is Currently VacantIndependent Insurance Expert: Roy Woodall
There are 2 nonvoting members of the FSOC representing insurance interests
147
g p g
Federal Insurance Office Director Mike McGraith
John Huff, Director of the Missouri Insurance DepartmentSource: Financial Stability Oversight Council; Insurance Information Institute (I.I.I.) research.

Dodd-Frank Implementation:FSOC MEMBERS
Members Announced on November 2, 2011:
Members of the Federal Advisory Committee on Insurance
David Birnbaum, Economist and Executive Director, Center for Economic JusticeMichael Consedine, Commissioner, Commonwealth of the Pennsylvania Department of InsuranceJacqueline Cunningham, Commissioner, State of Virginia Bureau of InsuranceJohn Degnan Senior Advisor to the CEO of the Chubb CorporationJohn Degnan, Senior Advisor to the CEO of the Chubb CorporationBrian Duperreault, President and Chief Executive Officer, Marsh & McLennan CompaniesLoretta Fuller, Chief Executive Officer, Insurance Solutions AssociatesScott E. Harrington, Alan B. Miller Professor in the Health Care Management and Insurance and Risk M t d t t t th Wh t S h l U i it f P l iManagement departments at the Wharton School, University of PennsylvaniaBenjamin Lawsky, Superintendent of Financial Services, State of New YorkThomas Leonardi, Commissioner of the Connecticut Department of InsuranceMonica Lindeen, State of Montana Commissioner of Securities and Insurance and State AuditorChristopher Mansfield, Senior Vice President and General Counsel, Liberty Mutual GroupSean McGovern, Director and General Counsel, Lloyd’s North AmericaTheresa Miller, Administrator, State of Oregon Insurance DivisionMichael E Sproule Executive VP and Chief Financial Officer New York Life Insurance Co
148
Michael E. Sproule, Executive VP and Chief Financial Officer, New York Life Insurance Co.Bill White, Commissioner, District of Columbia Department of Insurance
Source: Federal Insurance Office; Insurance Information Institute (I.I.I.) research.

Dodd-Frank Implementation:Federal Insurance Office: Very Quiet
FIO’s First Director Did Not Assume Office Until June 1, 2011
Federal Insurance Office Update: Activity Update
Former Illinois Insurance Director Michael McGraith
Small staff (10-12) and modest budget
McGraith has made few appearances or public commentsMcGraith has made few appearances or public comments
Study on State of Insurance Regulation Due Jan. 21, 2012Report will likely review previously identified inefficiencies and strengths of current
l t t ith t d d i tiregulatory system with an eye toward modernization.
Treasury Will Likely Exert Heavy Influence on the Report
Former President of P/C Insurance at The Hartford
149Source: Insurance Information Institute (I.I.I.) updates and research

The Strength of the Economy Will Influence P/C InsurerWill Influence P/C Insurer
Growth Opportunities
Growth Would Also Help Absorb pExcess Capital
150

US Real GDP Growth*
0% % %% %6%
Real GDP Growth (%) The Q4:2008 decline was the steepest since the Q1:1982 drop of 6.8%
2.7%
0.9%
3.2%
2.3% 2.9%
0.6% 1.
6%5.
03.
9%3.
8%2.
5%2.
3%0.
4% 1.3% 1.8% 3.
1%2.
0% 2.3%
2.3% 2.7%
2.6%
2.7%
2.8% 3.0%4.
1%1.
1% 1.8% 2.
5% 3.6%
3.1%
2%
4%
6%
-0.7
%
%
-0.7
%
-4%
-2%
0%
Recession began in Dec. 2007. Economic toll of credit crunch, housing
l l b k t2011 got off to a sluggish
start but growth is-4
.0%
-6.8
% -4.9
%-8%
-6%
0 2
3
4
5
6 Q 2Q 3Q 4Q Q 2Q 3Q 4Q Q 2Q 3Q 4Q Q 2Q 3Q 4Q Q 2Q 3Q 4Q Q 2Q 3Q 4Q Q 2Q 3Q 4Q
slump, labor market contraction has been
severe but modest recovery is underway
start, but growth is expected to proceed at a
modest pace in 2012-2013
20
00
2001
20
0 2
2003
20
04
2005
20
0607
:107
: 207
:307
:408
:108
: 208
:308
:409
:109
: 209
:309
:410
:110
: 210
:310
:411
:111
: 211
:311
:412
:112
: 212
:312
:413
:113
: 213
:313
:4
Demand for Insurance Continues To Be Impacted by Sluggish Economic Conditions but the Benefits of Even Slow Growth Will Compound and
151
* Estimates/Forecasts from Blue Chip Economic Indicators.Source: US Department of Commerce, Blue Economic Indicators 1/12; Insurance Information Institute.
Conditions, but the Benefits of Even Slow Growth Will Compound and Gradually Benefit the Economy Broadly

2011 Financial Overview State Economic Growth Varied in 2010
Hard hit Midwest and Northeast states finally
entering recovery in 2010
152
Texas had one of the stronger economies in 2010 and has
generally outperformed during the economic downturn
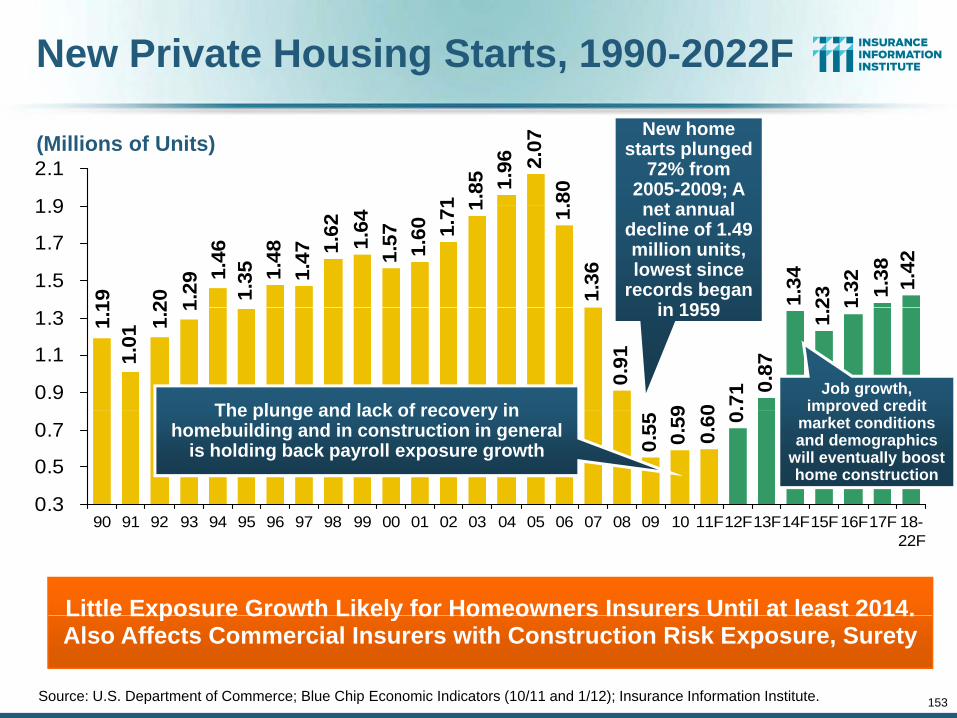
New Private Housing Starts, 1990-2022F
(Millions of Units)
1 1.85 1.
96 2.07
.80
1 9
2.1
New home starts plunged
72% from 2005-2009; A
t l
1.48
1.47 1.
62 1.64
1.57 1.60 1.
71 1 1.1.
36
1.34
23 1.32 1.38 1.42
1.351.
461.
292019
1.5
1.7
1.9 net annual decline of 1.49 million units, lowest since
records began in 1959
0.91
9 0 .71 0.
87
1.21
1.2
1.01
1.1
0.9
1.1
1.3 in 1959
The plunge and lack of recovery inJob growth,
improved credit
0.55 0.59
0.60 0
0.3
0.5
0.7The plunge and lack of recovery in
homebuilding and in construction in general is holding back payroll exposure growth
improved credit market conditions and demographics
will eventually boost home construction
90 91 92 93 94 95 96 97 98 99 00 01 02 03 04 05 06 07 08 09 10 11F12F13F14F15F16F17F 18-22F
Little Exposure Growth Likely for Homeowners Insurers Until at least 2014.
153Source: U.S. Department of Commerce; Blue Chip Economic Indicators (10/11 and 1/12); Insurance Information Institute.
Little Exposure Growth Likely for Homeowners Insurers Until at least 2014. Also Affects Commercial Insurers with Construction Risk Exposure, Surety
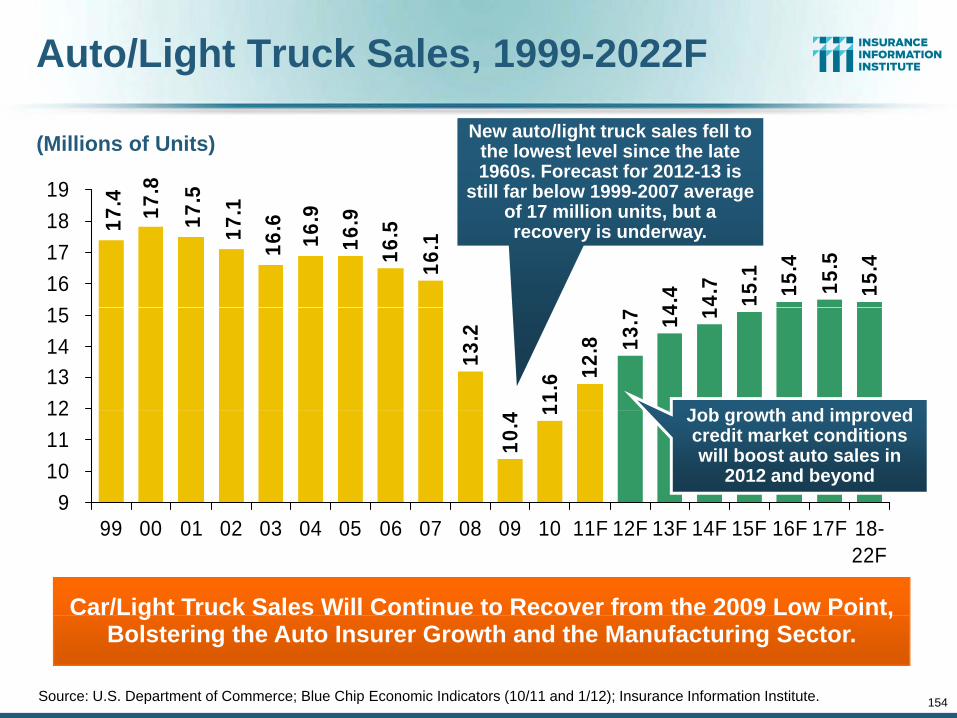
Auto/Light Truck Sales, 1999-2022F
1.57.8
.419
(Millions of Units) New auto/light truck sales fell to the lowest level since the late 1960s. Forecast for 2012-13 is
still far below 1999-2007 average f 17 illi it b t
16.9
16.5
16.1
4.4 4.7
15.1 15.4
15.5
15.4
16.9
16.617
.1171 717.
15161718 of 17 million units, but a
recovery is underway.
13.2
11.6 12
.8 13.7 14 1
12131415
J b th d i d
10.4 1
9101112 Job growth and improved
credit market conditions will boost auto sales in
2012 and beyond
99 00 01 02 03 04 05 06 07 08 09 10 11F 12F 13F 14F 15F 16F 17F 18-22F
Car/Light Truck Sales Will Continue to Recover from the 2009 Low Point,
154Source: U.S. Department of Commerce; Blue Chip Economic Indicators (10/11 and 1/12); Insurance Information Institute.
g ,Bolstering the Auto Insurer Growth and the Manufacturing Sector.

Recovery in Capacity Utilization is a Positive Sign for Commercial Exposures
82%
Percent of Industrial Capacity
Hurricane
“Full Capacity” The US operated at 77.8% of industrial capacity in
Nov. 2011, above the June 2009 low of 68.3% and a
post-crisis high
78%
80%
Hurricane Katrina
74%
76%
The closer the economy is
70%
72%
M h 2001
yto operating at “full
capacity,” the greater the inflationary pressure
68%
70% March 2001-November 2001
recession December 2007-June 2009 Recession
66%
Mar
01
Jun
01
Sep
01
Dec
01
Mar
02
Jun
02
Sep
02
Dec
02
Mar
03
Jun
03
Sep
03
Dec
03
Mar
04
Jun
04
Sep
04
Dec
04
Mar
05
Jun
05
Sep
05
Dec
05
Mar
06
Jun
06
Sep
06
Dec
06
Mar
07
Jun
07
Sep
07
Dec
07
Mar
08
Jun
08
Sep
08
Dec
08
Mar
09
Jun
09
Sep
09
Dec
09
Mar
10
Jun
10
Sep
10
Dec
10
Mar
11
Jun
11
Sep
11
Source: Federal Reserve Board statistical releases at http://www.federalreserve.gov/releases/g17/Current/default.htm. 155
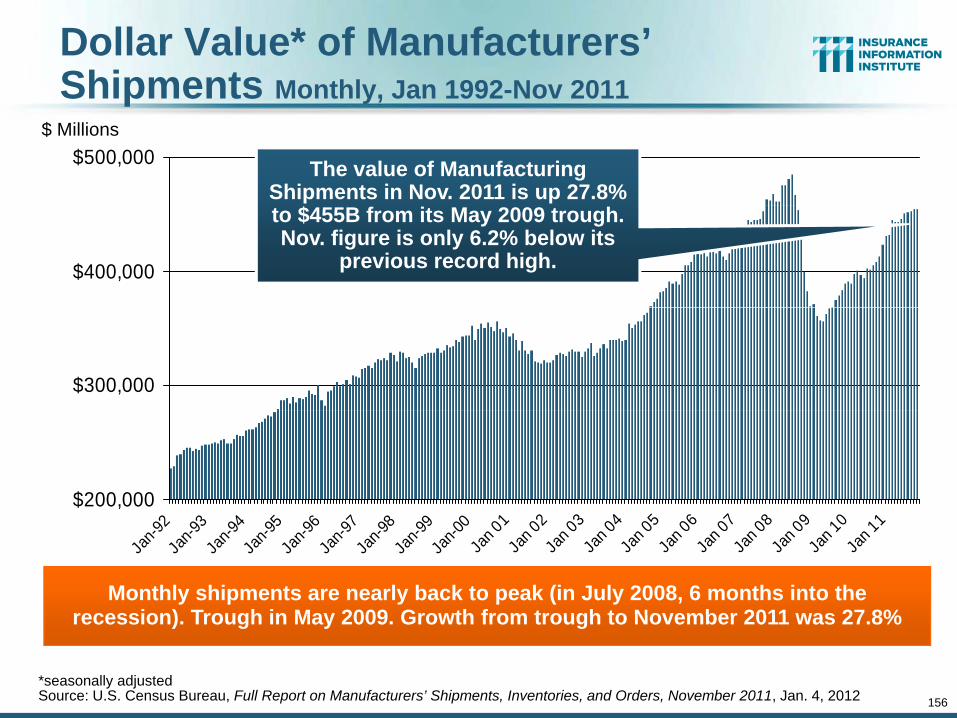
Dollar Value* of Manufacturers’ Shipments Monthly, Jan 1992-Nov 2011
$500,000
p y,$ Millions
The value of Manufacturing Shipments in Nov. 2011 is up 27.8%
$400,000
to $455B from its May 2009 trough. Nov. figure is only 6.2% below its
previous record high.
$300,000
$200,000
3 6 8 9
Jan-9
2Ja
n-93
Jan-9
4Ja
n-95
Jan-9
6Ja
n-97
Jan-9
8Ja
n-99
Jan-0
0Ja
n 01
Jan 0
2Ja
n 03
Jan 0
4Ja
n 05
Jan 0
6Ja
n 07
Jan 0
8Ja
n 09
Jan 1
0Ja
n 11
Monthly shipments are nearly back to peak (in July 2008, 6 months into the recession) Trough in May 2009 Growth from trough to November 2011 was 27 8%
156
*seasonally adjusted Source: U.S. Census Bureau, Full Report on Manufacturers’ Shipments, Inventories, and Orders, November 2011, Jan. 4, 2012
recession). Trough in May 2009. Growth from trough to November 2011 was 27.8%

ISM Manufacturing Index(Values > 50 Indicate Expansion)
0.4 6 0.8
61.4
61.2
0.4
65January 2010 through January 2012
58.3
57.1
60 59.6
57.8
55.3
55.1
55.2
55.3 56
.9 58.2
58.5 6 0 6 6 60
3.5 55
.3
.7 53.9
54.5
55
60
5
50.9
50.6 51
.6
50.8 52
5
50
55
Optimism among f t
40
45manufacturers was
increasing in late 2011
40
Jan-
10
Feb-
10
Mar
-10
Apr
-10
May
-10
Jun-
10
Jul-1
0
Aug
-10
Sep
-10
Oct
-10
Nov
-10
Dec
-10
Jan-
11
Feb-
11
Mar
-11
Apr
-11
May
-11
Jun-
11
Jul-1
1
Aug
-11
Sep
-11
Oct
-11
Nov
-11
Dec
-11
Jan-
12
The manufacturing sector has been expanding and adding jobsThe manufacturing sector has been expanding and adding jobs. The question is whether this will continue.
Source: Institute for Supply Management; January 2012 figure is Bloomberg consensus estimate. Insurance Information Institute.

ISM Non-Manufacturing Index(Values > 50 Indicate Expansion)
4 7
65January 2010 through December 2011
.7 54.1
54.6
54.8
3.5
53.7
2.8 53.9 54.6 56
57.1 59
. 4
59.7
57.3
2.8 54
.6
3.3 .7 3.3
3 2.9 0 .655
60
50.7 52
5 5 5 52
5
52 53 52 5 3 53 52 52.0
52
50
55
Optimism among non-f t
40
45manufacturers was stable in late 2011
40
Jan-
10
Feb-
10
Mar
-10
Apr
-10
May
-10
Jun-
10
Jul-1
0
Aug
-10
Sep
-10
Oct
-10
Nov
-10
Dec
-10
Jan-
11
Feb-
11
Mar
-11
Apr
-11
May
-11
Jun-
11
Jul-1
1
Aug
-11
Sep
-11
Oct
-11
Nov
-11
Dec
-11
Non-manufacturing industries have been expanding and addingNon-manufacturing industries have been expanding and adding jobs. The question is whether this will continue.
Source: Institute for Supply Management; Insurance Information Institute

Consumer Sentiment Survey (1966 = 100)74
.4
3.6
3.6
.2 3.6 76 6 74.5
74.2 77
.5
74.3
575
80January 2010 through December 2011
7 7 7 72. 7
67.8 68.9
68.2
67.7 71
. 6 7 7
67.5 69
.8
7
71.5
63.7
4 0.9 64
.1
69.9
65
70
75
55.7 59
. 4 60
55
60
Optimism among consumers is recovering, in part due to an
40
45
50g, p
improving jobs outlook, after plunging amid the debt debate debacle and S&P downgrade
40
Jan-
10
Feb-
10
Mar
-10
Apr
-10
May
-10
Jun-
10
Jul-1
0
Aug
-10
Sep
-10
Oct
-10
Nov
-10
Dec
-10
Jan-
11
Feb-
11
Mar
-11
Apr
-11
May
-11
Jun-
11
Jul-1
1
Aug
-11
Sep
-11
11-O
ct
11-N
ov
11-D
ec
Consumer confidence has been low for years amid high unemployment, falling home prices and other factors adversely
impact consumers, but improved substantially in late 2011Source: University of Michigan; Insurance Information Institute

Value* of Construction Put In Place,Monthly, Nov ‘08-Nov ‘11
$425
Nonresidential Public Residential Nonresidential PrivateBillionsTotal Construction Spending (Annual Rate)
D 2007 $1 109B
$
$375
$400
$Dec. 2007: $1,109B
Nov. 2011: $807 B
$300
$325
$350
$225
$250
$275
Since the recession started, private residential and nonresidential
$225
Dec '07
Nov '08
Dec '08
Jan '0
9Feb
'09
Mar '09
Apr '09
May '09
Jun '0
9Ju
l '09
Aug '0
9Sep
'09
Oct '09
Nov '09
Dec '09
Jan '1
0Feb
'10
Mar '10
Apr '10
May '10
Jun '1
0Ju
l '10
Aug '1
0Sep
'10
Oct '10
Nov '10
Dec '10
Jan '1
1Feb
'11
Mar '11
Apr '11
May '11
Jun '1
1Ju
l '11
Aug '1
1Sep
'11
Oct '11
Nov '11
160*Seasonally adjusted annual rate Source: http://www.census.gov/const/C30/release.pdf
Since the recession started, private residential and nonresidential construction together are down $302 billion (annual rate), a drop of 27%.
Public construction has hardly moved.

Pct. Change in Private Nonresidential Construction Put in Place* Oct 2010-Oct 2011
18.2% 16.6%14.0% 13.9% 11.9% 10 8%15%
20%
10.8%
0.7%0%5%
10%
-3.3% -4.7%
-15%-10%
-5%
-18.1% -19.0%-20%
Power
Recreati
ondu
catio
nalufac
turing
ommerci
alsp
ortatio
n
Office
ealth
Care
unicati
onLod
ging
Religio
us
Re
Edu
Manuf
Com
Transp
HeaCom
mu R
Outlays for energy exploration (mining, and exploration for petroleum and natural gas) and new power plants (including wind and solar) have
161
*seasonally adjusted annual rate Sources: U.S. Census Bureau; Wells Fargo Securities, Economics Group, Dec. 5, 2011 report; Insurance Information Institute
g ) p p ( g )accounted for 56% of the growth in private nonresidential construction in
the past year.
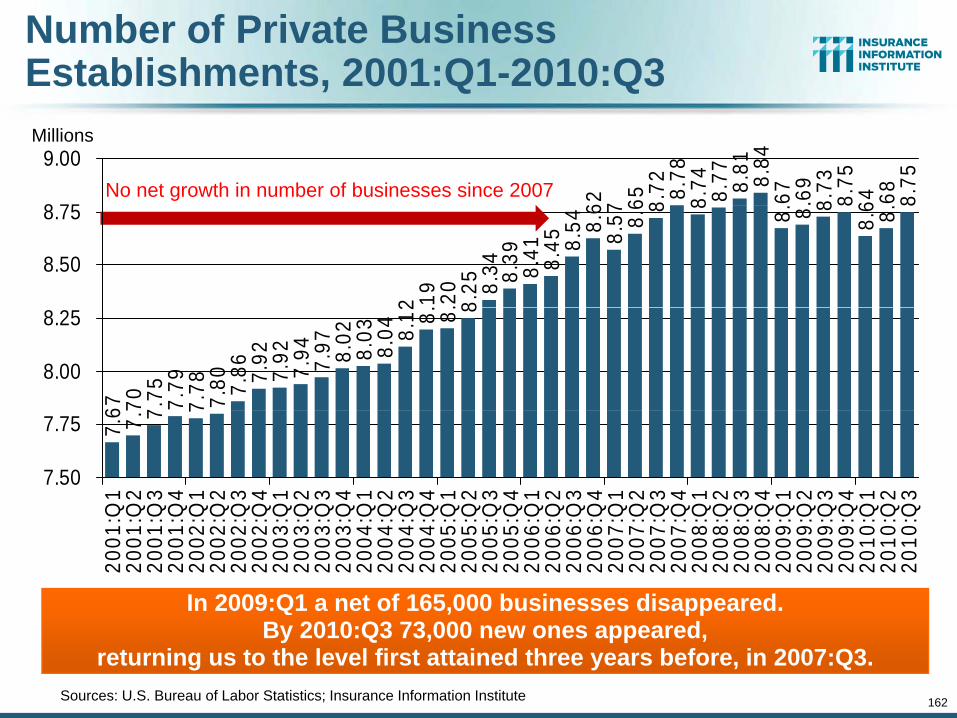
Number of Private Business Establishments, 2001:Q1-2010:Q3
62 7 65 8.72 8.
788.
74 8.77 8.81 8.84
67 .69
8.73 8.75
64 68 8.75
8 75
9.00Millions
No net growth in number of businesses since 2007
2 19 .20
8.25 8.
34 8.39 8.41 8.45 8.
54 8.6
8.57 8.
6 8 8 8. 8 8 88.
6 8.8
8.50
8.75
67 70 7.75 7.79
7.78 7.80 7.
86 7.92
7.92
7.94 7.97 8.02
8.03
8.04 8.
1 2 8. 8 . 8
8.00
8.25
7.6 7.7 7 7
7.50
7.75
Q1
Q2
Q3
Q4
Q1
Q2
Q3
Q4
Q1
Q2
Q3
Q4
Q1
Q2
Q3
Q4
Q1
Q2
Q3
Q4
Q1
Q2
Q3
Q4
Q1
Q2
Q3
Q4
Q1
Q2
Q3
Q4
Q1
Q2
Q3
Q4
Q1
Q2
Q3
2001
:Q20
01:Q
2001
:Q20
01:Q
2002
:Q20
02:Q
2002
:Q20
02:Q
2003
:Q20
03:Q
2003
:Q20
03:Q
2004
:Q20
04:Q
2004
:Q20
04:Q
2005
:Q20
05:Q
2005
:Q20
05:Q
2006
:Q20
06:Q
2006
:Q20
06:Q
2007
:Q20
07:Q
2007
:Q20
07:Q
2008
:Q20
08:Q
2008
:Q20
08:Q
2009
:Q20
09:Q
2009
:Q20
09:Q
2010
:Q20
10:Q
2010
:Q
In 2009:Q1 a net of 165,000 businesses disappeared.
162Sources: U.S. Bureau of Labor Statistics; Insurance Information Institute
ppBy 2010:Q3 73,000 new ones appeared,
returning us to the level first attained three years before, in 2007:Q3.
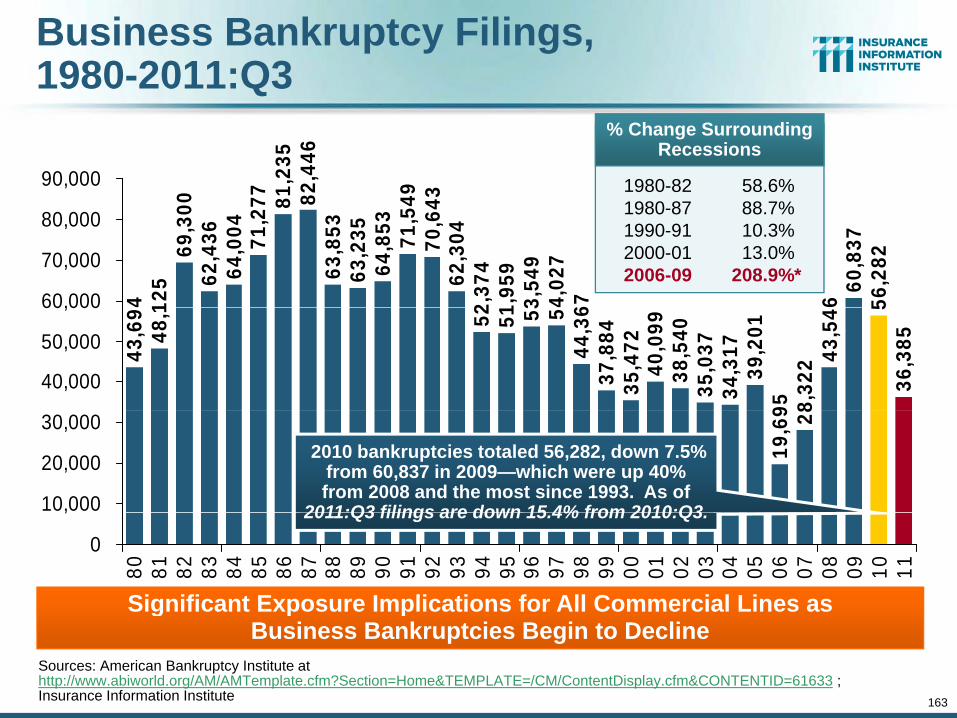
Business Bankruptcy Filings,1980-2011:Q3
0 77 81,2
3582
,446
49 43
90,000
% Change Surrounding Recessions
1980-82 58.6%1980 87 88 7%
4 125
69,3
062
,436
64,0
04 71,2
7 8
63,8
5363
,235
64,8
53 71,5
470
,64
62,3
042,
374
,959
3,54
94,
027
67 660
,837
56,2
82
60,000
70,000
80,000 1980-87 88.7%1990-91 10.3%2000-01 13.0%2006-09 208.9%*
43,6
948
, 1 52 51 5 3 544
,36
37,8
8435
,472
40,0
9938
,540
35,0
3734
,317
39,2
0195 8,
322 43
,54 5
36,3
85
40,000
50,000
60,000
19,6
9 28
10,000
20,000
30,0002010 bankruptcies totaled 56,282, down 7.5%
from 60,837 in 2009—which were up 40% from 2008 and the most since 1993. As of
2011:Q3 filings are down 15 4% from 2010:Q3
0
,
80 81 82 83 84 85 86 87 88 89 90 91 92 93 94 95 96 97 98 99 00 01 02 03 04 05 06 07 08 09 10 11
Significant Exposure Implications for All Commercial Lines as
2011:Q3 filings are down 15.4% from 2010:Q3.
163
Sources: American Bankruptcy Institute at http://www.abiworld.org/AM/AMTemplate.cfm?Section=Home&TEMPLATE=/CM/ContentDisplay.cfm&CONTENTID=61633 ; Insurance Information Institute
g p pBusiness Bankruptcies Begin to Decline

Private Sector Business Starts,1993:Q2 – 2011:Q1*
6 220 22
322
022
022
1
18220
230
(Thousands) Business Starts2006: 872,0002007: 843,0002008: 790,0002009: 697 000
4 199 20
420
295 96 96
206
206
201
198
206
206
203
211
205
212
200 20
520
420
497
203 20
920
1
320
1 204
202
210 21
220
921
6 2 2 221
0 212
204
2 120
920
720
719
93
20020
3
200
210
220 2009: 697,000 2010: 722,000
175
186
7418
018
6 192
188
187 18
918
6 190 19
419
1 19 19 19
192 1
192
192
193
191 19
32 17
618
417
5 179
188
183
180
190
200
722 000 new business starts were recorded in1 17 172
169 1
160
170722,000 new business starts were recorded in
2010, up 3.6% from 697,000 in 2009, which was the slowest year for new business starts since 1993.
Business starts remained weak in early 2011.
15093 94 95 96 97 98 99 00 01 02 03 04 05 06 07 08 09 10 11
Business Starts Were Down Nearly 20% in the Recession,
164
y ,Holding Back Most Types of Commercial Insurance Exposure
* Data through March 31, 2011 are the latest available as of January 16, 2012; Seasonally adjustedSource: Bureau of Labor Statistics, http://www.bls.gov/news.release/cewbd.t08.htm.

11 Industries for the Next 10 Years: Insurance Solutions Needed
Health Sciences
Health Care
Health Sciences
Energy (Traditional)
Alternative EnergyMany
industries are Alternative Energy
Agriculture
Natural Resources
poised for growth, but
many insurers do not write in
these i
Environmental
Technology (incl. Biotechnology)
economic segments
Light Manufacturing
Export-Oriented Industries
165
Shipping (Rail, Marine, Trucking)

Labor Market TrendsLabor Market Trends
Massive Job Losses Sapped the Economy and Commercial/PersonalEconomy and Commercial/Personal
Lines Exposure, But Trend is Improving
166
Improving

Unemployment and Underemployment Rates: Stubbornly High in 2011, But Falling
16
18 Traditional Unemployment Rate U-3
Unemployment + Underemployment Rate U-6U-6 went from 8.0% in March
2007 to 17.5% in O 2009
January 2000 through December 2011, Seasonally Adjusted (%)
12
14
Unemployment
October 2009; Stood at 15.2%
in Dec. 2011Recession ended in
November 2001
Unemployment kept rising for
19 more months
Recession began in
December 2007
8
10
Unemployment stood at 8.5% in
DecemberUnemployment peaked at 10.1% i O t b 2009
4
6
in October 2009, highest monthly rate since 1983.Peak rate in the last 30 years:
2
4
Jan00
Jan01
Jan02
Jan03
Jan04
Jan05
Jan06
Jan07
Jan08
Jan09
Jan10
Jan11
last 30 years: 10.8% in
November -December 1982
Dec 11
167
00 01 02 03 04 05 06 07 08 09 10 11
Source: US Bureau of Labor Statistics; Insurance Information Institute.
Stubbornly high unemployment and underemployment constrain overall economic growth, but the job market might finally be improving

Monthly Change in Private Employment86 21
3
229
3 93 67
261
219
241
73 220
212
4
400January 2008 through November 2011* (Thousands)
1879
265
127
42 1509
-14
65 9723
-12
8 5 -58
75-8
316
62
251 61
117 143
112 1 9
128 1 6
94
2
99 751 7
722
120
134 2
144
0
200-1
0 -
-161
-253 -230
-257
-347
-456
7
-334
-452
-297 -2
15 -186
-262
-
(600)
(400)
(200)
Monthly Losses in 212,000 private sector jobs --5
47-7
34 -667
-806
-707
-744
-649
-(1 000)
(800)
(600) Dec. 08–Mar. 09 Were the Largest in the Post-WW II Period
jwere created in December
(1,000)
Jan-
07Fe
b-07
Mar
-07
Apr
-07
May
-07
Jun-
07Ju
l-07
Aug
-07
Sep
-07
Oct
-07
Nov
-07
Dec
-Ja
n-08
Feb-
08M
ar-0
8A
pr-0
8M
ay-0
8Ju
n-08
Jul-0
8A
ug-0
8S
ep-0
8O
ct-0
8N
ov-0
8D
ec-
Jan-
09Fe
b-09
Mar
-09
Apr
-09
May
-09
Jun-
09Ju
l-09
Aug
-09
Sep
-09
Oct
-09
Nov
-09
Dec
-Ja
n-10
Feb-
10M
ar-1
0A
pr-1
0M
ay-1
0Ju
n-10
Jul-1
0A
ug-1
0S
ep-1
0O
ct-1
0N
ov-1
0D
ec-
Jan-
11Fe
b-11
Mar
-11
Apr
-11
May
-11
Jun-
11Ju
l-11
Aug
-11
Sep
-11
Oct
-11
Nov
-11
Dec
-
Private Employers Added 3.343 million Jobs Since Jan. 2010 After Having Shed 4.66 Million Jobs in 2009 and 3.81 Million in 2008 (State and Local Governments Have Shed Hundreds of Thousands of Jobs
Source: US Bureau of Labor Statistics: http://www.bls.gov/ces/home.htm; Insurance Information Institute

Change in Number Employedin Select Industries, June 2011 vs. June 2010
257343396400600
Thousands Professional Business Services, Health Care, and Trade, Transportation &
Utilities) were the job growth leaders in the past year
27 61
7799223257
0200400 the past year.
-27 -61-190
-382-600-400-200
-666-800
Pro
f.si
ness
Ser
v.C
are
&A
ssis
t.ad
e,po
rt. &
ities
ucat
ion
ctur
ing
inin
g &
oggi
ng
mat
ion
nanc
ial
tiviti
es
ruct
ion
sure
&sp
italit
y
rnm
ent
PB
u SH
ealth
CS
ocia
l ATr
aTr
ans
Util
Ed u
Man
ufa Mi
Lo
Info
rm Fin
Ac
Con
st
Leis
Hos
Gov
er
169Sources: US Bureau of Labor Statistics “Employment Situation, June 2011”; Insurance Information Institute.
There is a great deal of variation in employment growth by industry, indicating a very uneven and slow recovery

Monthly Change Employment*
432600
January 2008 through December 2011* (Thousands)The job gain and loss figures in 2010 were severely distorted by the hiring
64 14 3920
8 313 4
-1
210
9315
268
235
221
217
53 2085 10
4 210
100
120 20
0
0
200
400y y g
and termination of temporary Census workers. In 2010, 1.178 million nonfarm
jobs were created.
-72
-144 -122
-160 -137
-161 -128
-175
-321
-380
8 -387
5 -346
-212
-225
-224 -1
09
-175
-66 -41
600
-400
-200
200,000 f j b-
-597
-681
-779 -7
26-7
53-5
2 8-
-515
-1,000
-800
-600 Monthly Losses in Dec. 08–Mar. 09 Were
the Largest in the Post-WW II Period
nonfarm jobs were created in November
Jan
08Fe
b 08
Mar
08
Apr
08
May
08
Jun
08Ju
l 08
Aug
08
Sep
08
Oct
08
Nov
08
Dec
08
Jan
09Fe
b 09
Mar
09
Apr
09
May
09
Jun
09Ju
l 09
Aug
09
Sep
09
Oct
09
Nov
09
Dec
09
Jan
10Fe
b 10
Mar
10
Apr
10
May
10
Jun
10Ju
l 10
Aug
10
Sep
10
Oct
10
Nov
10
Dec
10
Jan
11Fe
b 11
Mar
11
Apr
11
May
11
Jun
11Ju
l 11
Aug
11
Sep
11
Oct
11
Nov
11
Dec
11
Job Losses Since the Recession Began in Dec. 2007 Peaked at 8 4 Mill i D 09 13 3 Milli P l N D fi d
170Source: US Bureau of Labor Statistics: http://www.bls.gov/ces/home.htm; Insurance Information Institute
8.4 Mill in Dec. 09; 13.3 Million People are Now Defined as Unemployed

Monthly Change in Government EmploymentJanuary 2009 through December 2011
410
400
500
(Thousands)
Census21
200
300
400
27-1
9 -912
3 3 93
3938
-11
263
-14
28 48 2835 -1
526 26 25 24 6 5 6
32-1
0-2
2-2
0 -12
0
100
-
-53
-63 -49 -3 -2 -
257
-142
-169 -1
36
-3 - -2 -2 -2 -2 -4 -55 -4 - - -
(300)
(200)
(100)
9 9 9 9 0 0-2( )
Jan-
09
Mar
-09
May
-09
Jul-0
9
Sep
-09
Nov
-09
Jan-
10
Mar
-10
May
-10
Jul-1
0
Sep
-10
Nov
-10
Jan-
11
Mar
-11
May
-11
Jul-1
1
Sep
-11
Nov
-11
In 2011 employment by government at all levels dropped every monthIn 2011 employment by government at all levels dropped every month except August. Total (net) jobs lost in last twelve months: 280,000.
Source: US Bureau of Labor Statistics: http://www.bls.gov/ces/home.htm; Insurance Information Institute

Unemployment Rates by State, December 2011:Highest 25 States*
614In December, 37 states and the District of Columbia reported over-the-month unemployment rate decreases 3 had
12.
11.1
10.8
10.4
10.4
9.9
9.9 .8 .7 510
12
(%)
unemployment rate decreases, 3 had increases, and 10 had no change.
9 9 9 9. 9.5
9.3
9.1
9.0
9.0
8.9
8.7
8.7
8.5
8.5
8.4
8.2
8.1
8.1
8.0
8.0
7.9
8
10
ent R
ate
(
4
6
nem
ploy
m
0
2
Un
172
0NV CA RI DC MS FL NC IL GA SC MI KY IN NJ OR AZ TN US WA ID CT AL OH MO NY CO
*Provisional figures for December 2011, seasonally adjusted.Sources: US Bureau of Labor Statistics; Insurance Information Institute.

Unemployment Rates By State, December 2011: Lowest 25 States*
10In December, 37 states and the District of
Columbia reported over-the-month
7.9
7.8
7.7
7.6
7.4
7.3 1 08
10
%)
punemployment rate decreases, 3 had
increases, and 10 had no change.7 7 7. 7.0
6.8
6.8
6.8
6.7
6.6
6.6
6.3
6.2
6.1
6.0
5.8
5.7
5.6
5.1
5.16
ent R
ate
(%
4.2
4.1
3.34
empl
oym
e
0
2Une
173
0WV TX AR PA DE AK WI ME LA MA MT MD HI NM KS VA OK UT WY MN IA NH VT SD NE ND
*Provisional figures for December 2011, seasonally adjusted.Sources: US Bureau of Labor Statistics; Insurance Information Institute.
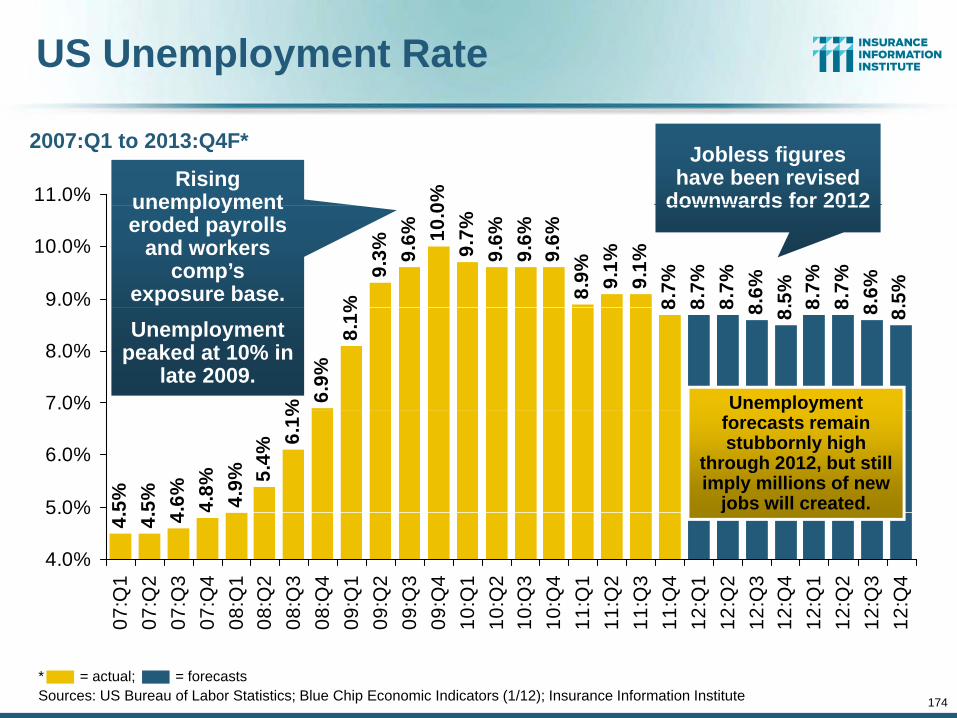
US Unemployment Rate
0%11.0%Rising
unemployment
2007:Q1 to 2013:Q4F* Jobless figures have been revised
downwards for 2012
%9.
3% 9.6% 10
.09.
7%9.
6%9.
6%
8.9% 9.1%
9.1%
8.7%
8.7%
8.7%
8.6% .5%
8.7%
8.7%
8.6% .5%
9.6%
9.0%
10.0%
unemployment eroded payrolls
and workers comp’s
exposure base.
downwards for 2012
% 6.9%
8.1%
8 8 8 8 8 8 8 8 8
7.0%
8.0%Unemployment
peaked at 10% in late 2009.
Unemployment
5% 5% .6%
4.8% 4.9% 5.
4%6.
1 %
5.0%
6.0%
p yforecasts remain stubbornly high
through 2012, but still imply millions of new
jobs will created.
4. 4. 4
4.0%
5.0%
7:Q
17:
Q2
7:Q
37:
Q4
8:Q
18:
Q2
8:Q
38:
Q4
9:Q
19:
Q2
9:Q
39:
Q4
0:Q
10:
Q2
0:Q
30:
Q4
1:Q
11:
Q2
1:Q
31:
Q4
2:Q
12:
Q2
2:Q
32:
Q4
2:Q
12:
Q2
2:Q
32:
Q4
j
174
07 07 07 07 08 08 08 08 09 09 09 09 10 10 10 10 11 11 11 11 12 12 12 12 12 12 12 12
* = actual; = forecastsSources: US Bureau of Labor Statistics; Blue Chip Economic Indicators (1/12); Insurance Information Institute
Insurance Information Institute Online:
www iii orgwww.iii.org
Thank you for your timed tt ti !and your attention!
Twitter: twitter.com/bob_hartwig_ gDownload at www.iii.org/presentations