overeducation, job mobility, and earnings mobility among holders of first degrees in israel aviad...
TRANSCRIPT

Overeducation, Job Mobility, and Earnings Mobility among Holders of First Degrees in Israel
Aviad Tur-Sinai (Israel Central Bureau of Statistics & Tel-Aviv University)
Dmitri Romanov (Israel Central Bureau of Statistics) Galit Eizman (Planning & Budgeting Committee - ICHE)
The Society of Labor Economists Annual Meeting, May 8-9, 2009

To begin with…To begin with…
Over-education is defined as a situation in which an individual
possesses a level of education in excess of what is required for
her/his particular job.

MotivationMotivation - - I I
A steep increase in the tertiary education enrollment and graduation
rates in the last decades in Israel

Students in Isreali Higher Education Institutions
50,821
101,286
163,525
68,236
135,886
213,835
0
80,000
160,000
240,000
1985/86 1988/89 1991/92 1994/95 1997/98 2000/01 2003/04 2006/07
Stu
dent
s
Bachelor's degree Total
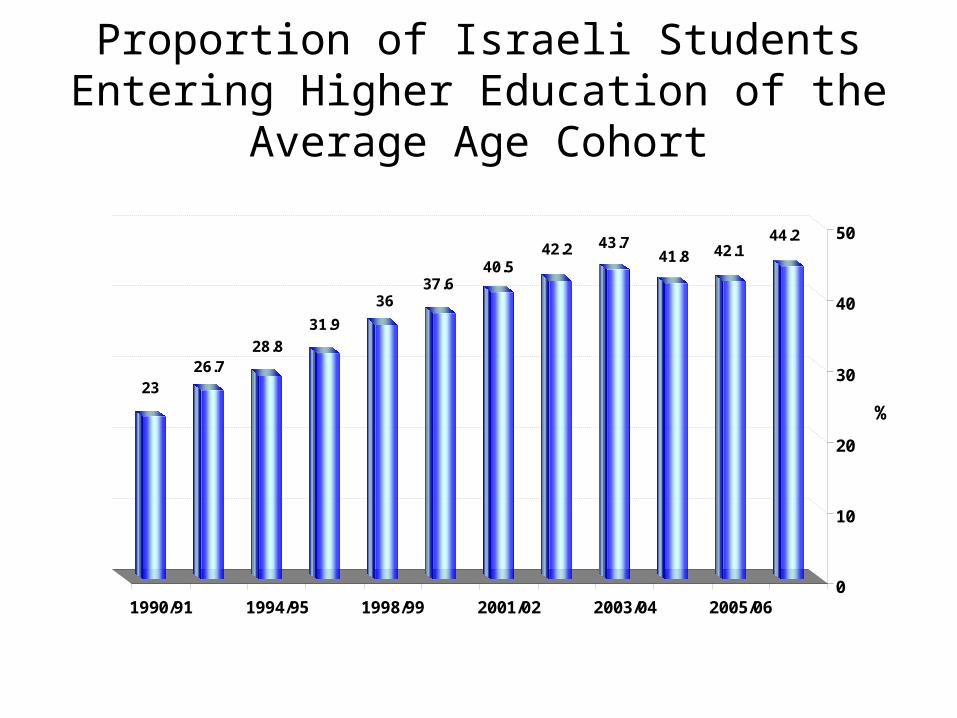
Proportion of Israeli Students Entering Higher Education of the Average Age Cohort
44.242.141.8
43.742.240.5
37.636
31.9
28.826.7
23
0
10
20
30
40
50
%
1990/91 1994/95 1998/99 2001/02 2003/04 2005/06
MotivationMotivation - - I I
A steep increase in the tertiary education enrollment and graduation
rates in the last decade in Israel
This increase has slowed the rate of return on schooling, and even
caused a decline in the return on academic education in certain
fields/professions
Over-education provides a micro-level explanation for this trend
Motivation - Motivation - IIII
learning outcomes
Over-education indicates human capital under-utilization
Higher Education Institutions pay attention to employability (=the
probability of employment) of their graduates;
However, given relatively low rates of unemployment among
graduates, it seems that the major issue is the degree of
education applicability (=match between the acquired
knowledge and job requirements);

Motivation - Motivation - IIIIII

Motivation - Motivation - IIIIII
More than one third of Israeli graduates immediately proceed to
advanced academic studies.

Israeli Advanced Degree Students, 1989/90-2006/7
0
10,000
20,000
30,000
40,000
50,000
1989/90 1992/93 1995/96 1998/99 2001/02 2004/05
Mas
ter'
s S
tude
nts
0
2,000
4,000
6,000
8,000
10,000
12,000
Doc
tora
l Stu
dent
s
Master Degree Doctoral Degree

Israeli Advanced Degree Students, 1989/90-2006/7
0
10,000
20,000
30,000
40,000
50,000
1989/90 1992/93 1995/96 1998/99 2001/02 2004/05
Mas
ter'
s S
tude
nts
0
2,000
4,000
6,000
8,000
10,000
12,000
Doc
tora
l Stu
dent
s
Master Degree Doctoral Degree

Motivation - Motivation - IIIIII
More than one third of Israeli graduates immediately proceed to
advanced academic studies.
Is it a flight from over-education or a trap into over-education
with more years of schooling?

Prior research and open questionsPrior research and open questions

Prior research and open questionsPrior research and open questions
Sicherman & Galor (1990) and Sicherman (1991) claim that over-
education is a temporary phenomenon, while the empirical
studies by Battu et al. (1999) and Dolton & Vignoles (2000) show
this may be a persistent condition.
Question 1: Is over-education a temporary or a long-run
phenomenon ?
Prior research and open questionsPrior research and open questions
Does over-education imply a higher job mobility (occupational
mobility)? Scarce empirical evidence (Alba-Ramirez. 1993) says
‘yes’, but does it happen through intra-firm mobility or by
changing employers?
Question 2: Is over-education associated with a higher job
mobility?

Prior research and open questionsPrior research and open questions
To what degree over-education can be explained by
relatively low (unobserved) cognitive abilities? Dolton & Kidd
(1998) and Dolton & Vignoles (2000) use grades to control for the
abilities, having confused the “sheepskin effect” with abilities’
effect.
Question 3: How do individual’s cognitive abilities affect
the chances of being over- educated and the chances of
escaping from over-education ?

Further QuestionsFurther Questions
• How widespread is over-education among the Israeli graduates?
• What factors affect the chances of being over-educated?
• What wage loss entails over-education?
• Does learning to an advanced degree reduce the probability of
being over-educated ?

DataData
Survey “Recipients of Degrees from the Universities and Other Institutions of
Higher Education”, conducted by the ICBS (on the cohorts 2000/2001 and
2001/2002) :
– Field of study
– Continuing academic studies (mostly to the second degree)
– Information regarding current employment (occupation, employer, job duration)
– Subjective question regarding the relation between the individual’s current job and first-degree studies
– Satisfaction from quality of teaching, facilities and services
Total 8578 graduates of universities and public academic colleges
Data (cont.)Data (cont.)
Employment and wages:
ICBS’s matched employer-employee database for 2000-2005 provides,
for each employee job, with:
Cognitive abilities as measured by the NITE psychometric exams: total
score and its components—verbal thinking, quantitative thinking, and
English.
Annual gross wage Tenure on the job Number of months worked annually Firm’s size

time
t0t-1 t1 t2 t3
Graduation
year
Survey
year
Timetable of eventsTimetable of events
Cohort200020012002200320042005
2001/2002t-1t0 graduation
t1t2survey
t3
2002/2003t-1t0 graduation
t1t2survey
t3

Measuring Over-educationMeasuring Over-education
• Objective Measure: systematic job evaluation, which states the level
of qualifications required to perform a particular job, usually in terms
of occupation vis-à-vis years of schooling.
• Subjective Measure: worker’s self-assessment.
• Empirical Method: workers whose years of schooling lie outside of
the s.d. bound around the mean schooling, by occupation.

Measuring Over-educationMeasuring Over-education
Survey question used as a Subjective Measure:
To what degree is your current job related to your studies? (refer to all your first-degree studies)
[A] A very high degree [B] A high degree
[C] A low degree [D] Not related at all
Defined as Over-educated: if answer [C] or [D]

Estimates of Over-education among Employed First-Degree Graduates, by Occupation (%)
53%
47%
39%
35%
23%21% 21%
16%
0%
10%
20%
30%
40%
50%
60%
Humanities Social sciences Business andadministration
sciences
Physical,biological
sciences andagriculture
Mathematics,statistics, and
computersciences
Law Engineering andarchitecture
Medicine andParamedicalprofessions
%
Mean = 37%

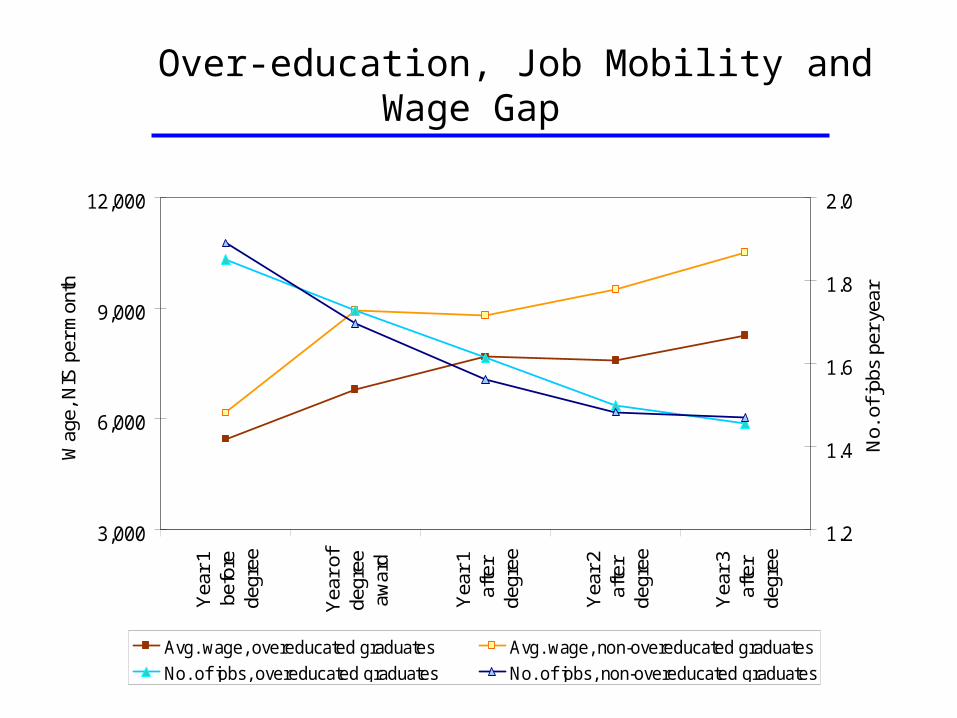
Over-education, Job Mobility and Wage Gap
3,000
6,000
9,000
12,000Y
ear
1be
fore
degr
ee
Yea
r of
degr
eeaw
ard
Yea
r 1
afte
rde
gree
Yea
r 2
afte
rde
gree
Yea
r 3
afte
rde
gree
Wag
e, N
IS p
er m
onth
Avg. wage, overeducated graduates Avg. wage, non-overeducated graduates
Over-education, Job Mobility and Wage Gap
3,000
6,000
9,000
12,000Y
ear
1be
fore
degr
ee
Yea
r of
degr
eeaw
ard
Yea
r 1
afte
rde
gree
Yea
r 2
afte
rde
gree
Yea
r 3
afte
rde
gree
Wag
e, N
IS p
er m
onth
1.2
1.4
1.6
1.8
2.0
No.
of j
obs
per
year
Avg. wage, overeducated graduates Avg. wage, non-overeducated graduates
No. of jobs, overeducated graduates No. of jobs, non-overeducated graduates

Model I: Probability of Being Overeducated
iiikiijijk PastJobsTAbilityXOE 321)1Pr(
where:
OE – indicator of overeducation on the job
X – a an array of the graduate’s demographic traits, the institution that awarded
h/her degree, and the discipline studied
Ability – a proxy for cognitive abilities
T – tenure, number of months on the job
PastJobs – Number of employers in the last 3 years
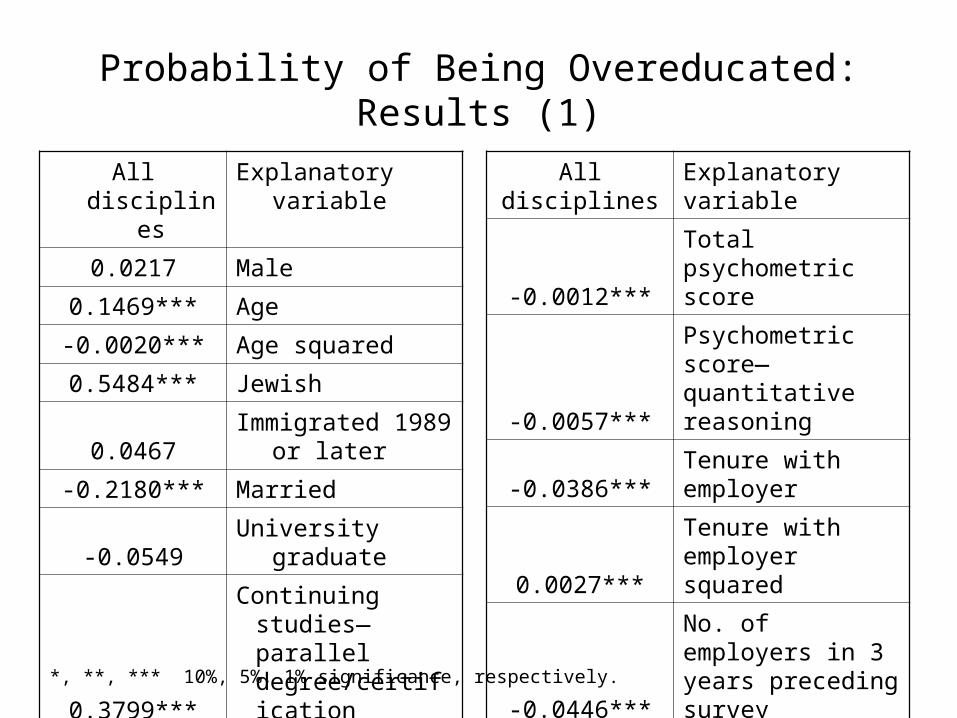
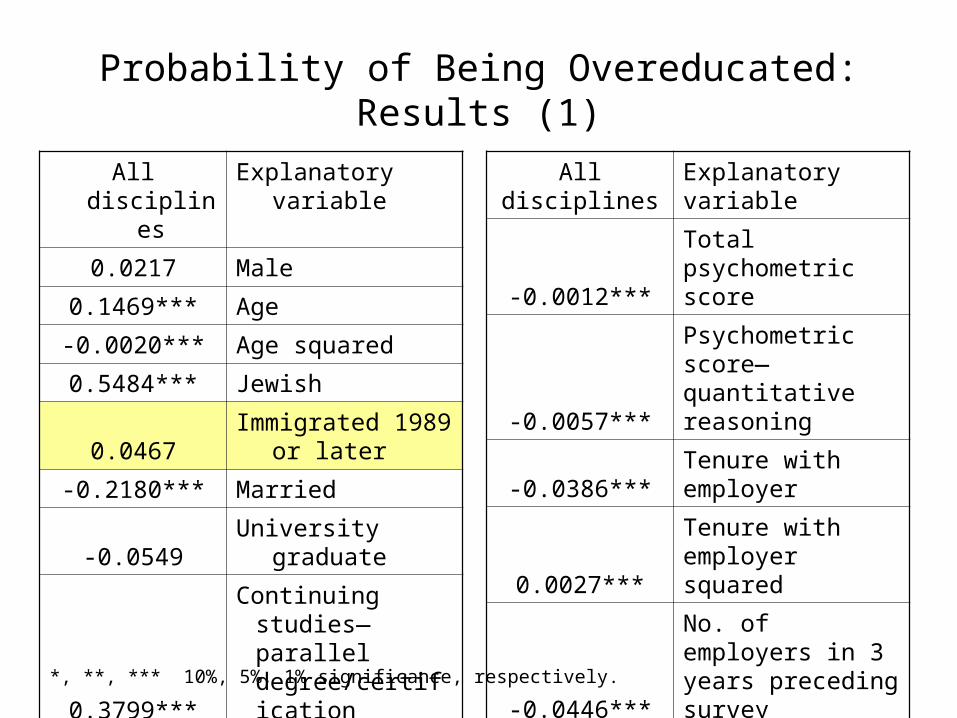
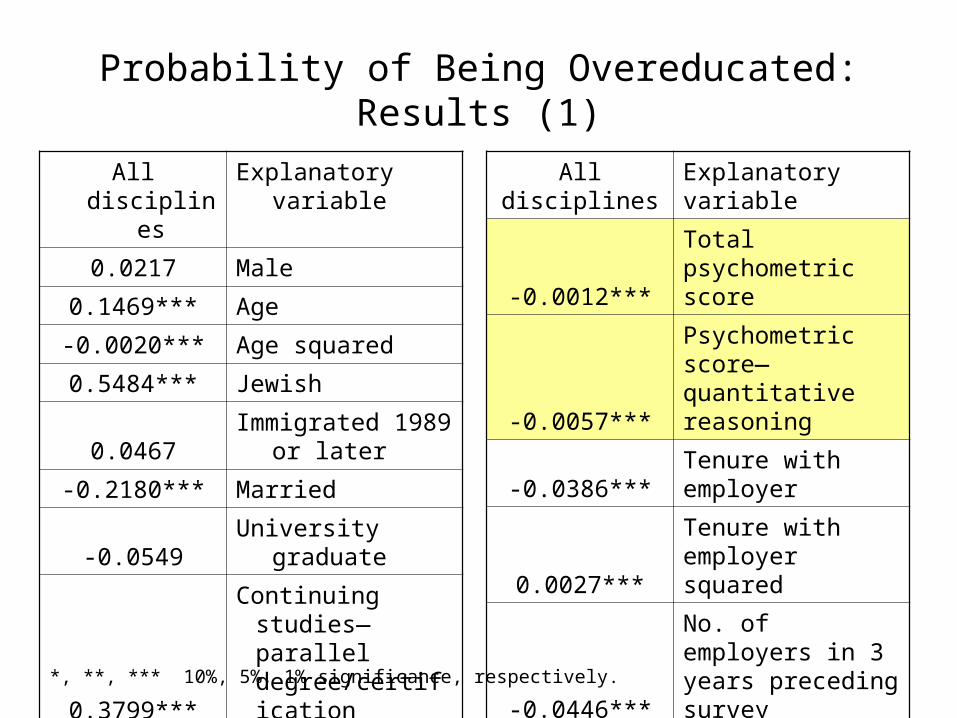
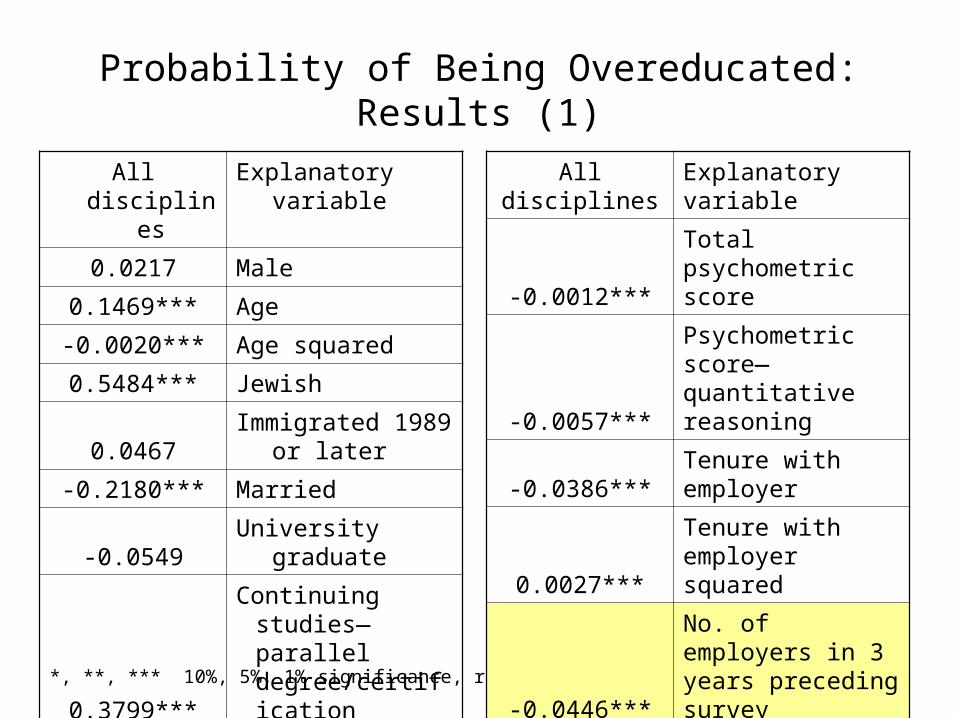
Probability of Being Overeducated: Results (1)
Explanatory variableAll disciplines
Male 0.0217
Age0.1469***
Age squared-0.0020***
Jewish0.5484***
Immigrated 1989 or later0.0467
Married-0.2180***
University graduate-0.0549
Continuing studies—parallel degree/certification0.3799***
Continuing studies—advanced degree-0.0886***
*, **, *** 10%, 5%, 1% significance, respectively.
Explanatory variableAll disciplines
Total psychometric score-0.0012***
Psychometric score—quantitative reasoning-0.0057***
Tenure with employer-0.0386***
Tenure with employer squared0.0027***
No. of employers in 3 years preceding survey-0.0446***
R2 max-rescaled0.3980
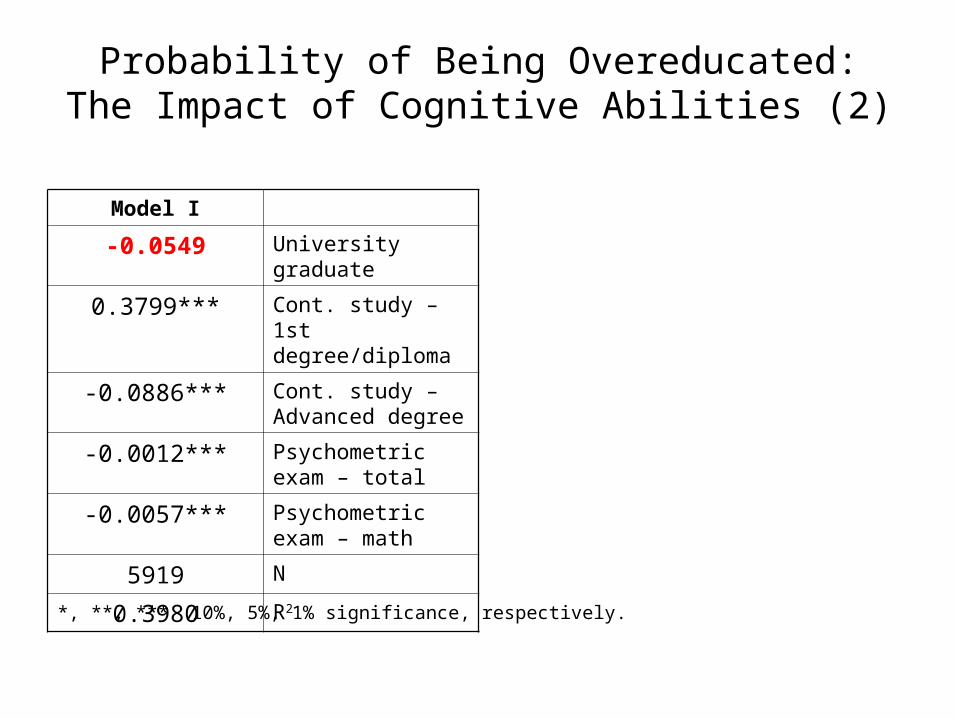
Probability of Being Overeducated:The Impact of Cognitive Abilities (2)
Model I
University graduate-0.0549
Cont. study – 1st degree/diploma
0.3799***
Cont. study – Advanced degree
-0.0886***
Psychometric exam – total
-0.0012***
Psychometric exam – math
-0.0057***
N5919
R2 0.3980
*, **, *** 10%, 5%, 1% significance, respectively.

Probability of Being Overeducated:The Impact of Cognitive Abilities (2)
Model IModel II
University graduate-0.0549-0.1508***
Cont. study – 1st degree/diploma
0.3799***0.3499***
Cont. study – Advanced degree
-0.0886***-0.1178***
Psychometric exam – total
-0.0012***
Psychometric exam – math
-0.0057***
N59196819
R2 0.39800.3689
*, **, *** 10%, 5%, 1% significance, respectively.

Probability of Being Overeducated:The Impact of Cognitive Abilities (2)
Model IModel IIModel III
University graduate-0.0549-0.1508***-0.1688***
Cont. study – 1st degree/diploma
0.3799***0.3499***
Cont. study – Advanced degree
-0.0886***-0.1178***
Psychometric exam – total
-0.0012***
Psychometric exam – math
-0.0057***
N591968196819
R2 0.39800.36890.3629
*, **, *** 10%, 5%, 1% significance, respectively.

Model II: Wage Equation
iitikikijkiktijijkt uJobChangesTTOEEmpXW 42
321)ln(
where:
W – monthly wage in the graduate’s principal job in year t
Emp – employer characteristics: positioning in the public sector and size of business
JobChanges – a measure of job mobility from year of degree award to year t
Note: slope estimate means % changes dY/dx [i.e., (dY/dx)/Y]

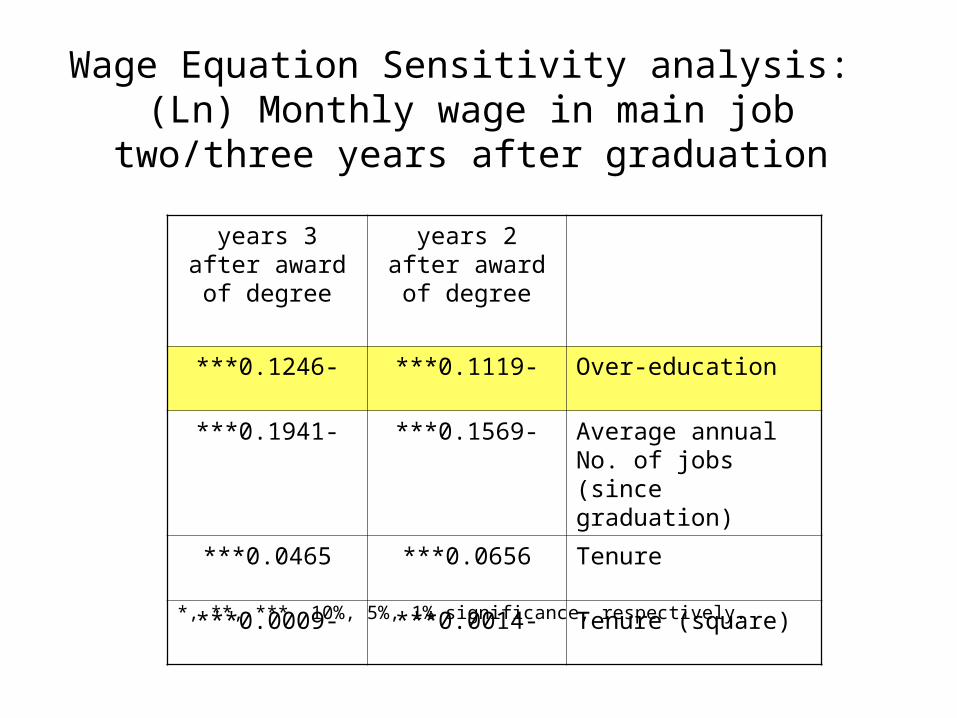
Wage Equation Sensitivity analysis: (Ln) Monthly wage in main job two/three years after
graduation
2 years after award of degree
3 years after award of degree
Over-education-0.1119***-0.1246***
Average annual No. of jobs (since graduation)
-0.1569***-0.1941***
Tenure0.0656***0.0465***
Tenure (square)-0.0014***-0.0009***
*, **, *** 10%, 5%, 1% significance, respectively.

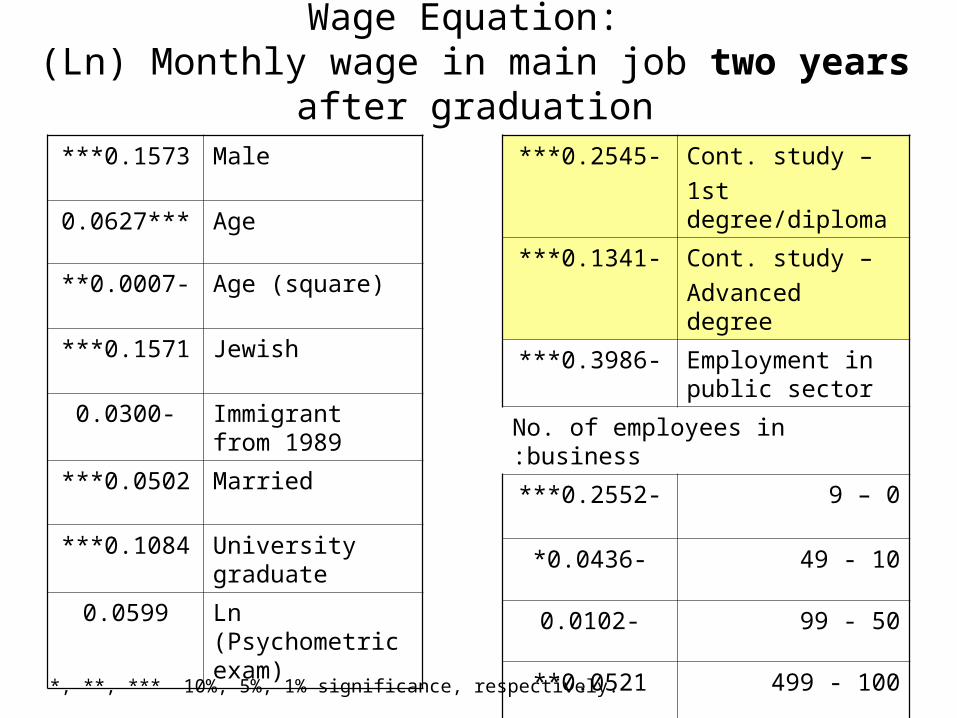
Wage Equation: (Ln) Monthly wage in main job two years after graduation
Male0.1573***
Age***0.0627
Age (square)-0.0007**
Jewish0.1571***
Immigrant from 1989
-0.0300
Married0.0502***
University graduate0.1084***
Ln (Psychometric exam)
0.0599
Cont. study –
1st degree/diploma
-0.2545***
Cont. study –
Advanced degree
-0.1341***
Employment in public sector
-0.3986***
No. of employees in business:
0 – 9-0.2552***
10 - 49-0.0436*
50 - 99-0.0102
100 - 4990.0521**
*, **, *** 10%, 5%, 1% significance, respectively.

Model III: Wage Dynamics
iitijijijt
ijijt JobChangesOEWXWW 3201/1
0 ln1)(
where:
Wt – monthly wage in graduate’s principal job in year t (t=1,2,3)
W0 – monthly wage in graduate’s principal job in year of award of degree
Note: a positive estimator positive impact to wage growth over t years.
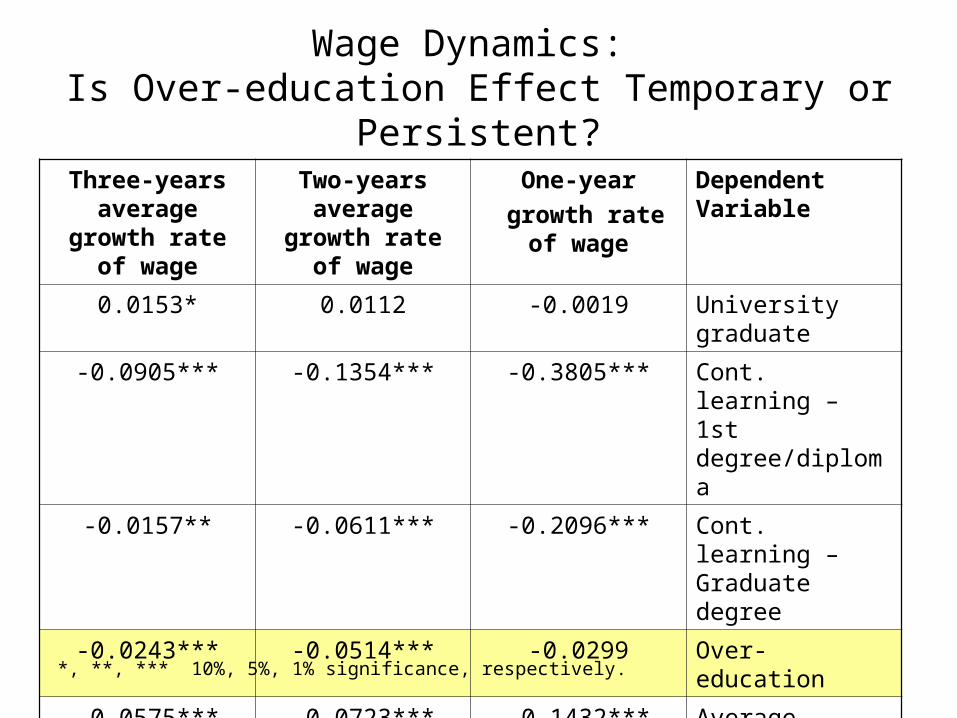
Wage Dynamics: Is Over-education Effect Temporary or Persistent?
Dependent Variable
One-year
growth rate of wage
Two-years average growth rate of
wage
Three-years average growth
rate of wage
University graduate-0.00190.01120.0153*
Cont. learning – 1st degree/diploma
-0.3805***-0.1354***-0.0905***
Cont. learning – Graduate degree
-0.2096***-0.0611***-0.0157**
Over-education-0.0299-0.0514***-0.0243***
Average annual No. of jobs (since graduation)
-0.1432***-0.0723***-0.0575***
N553153635086
R2 0.13550.34840.3883
*, **, *** 10%, 5%, 1% significance, respectively.
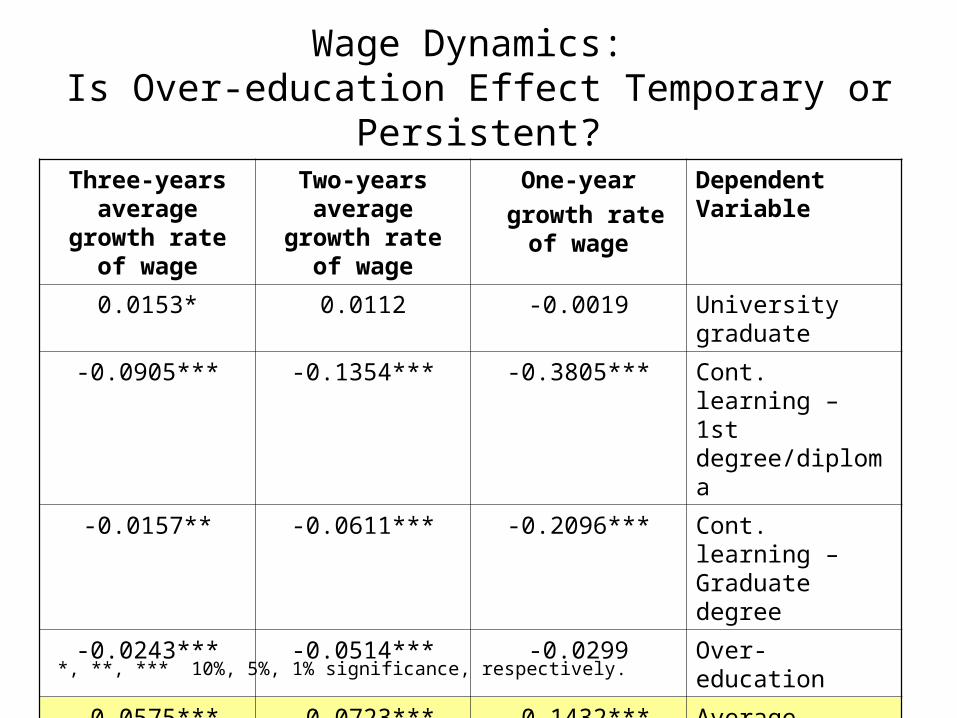
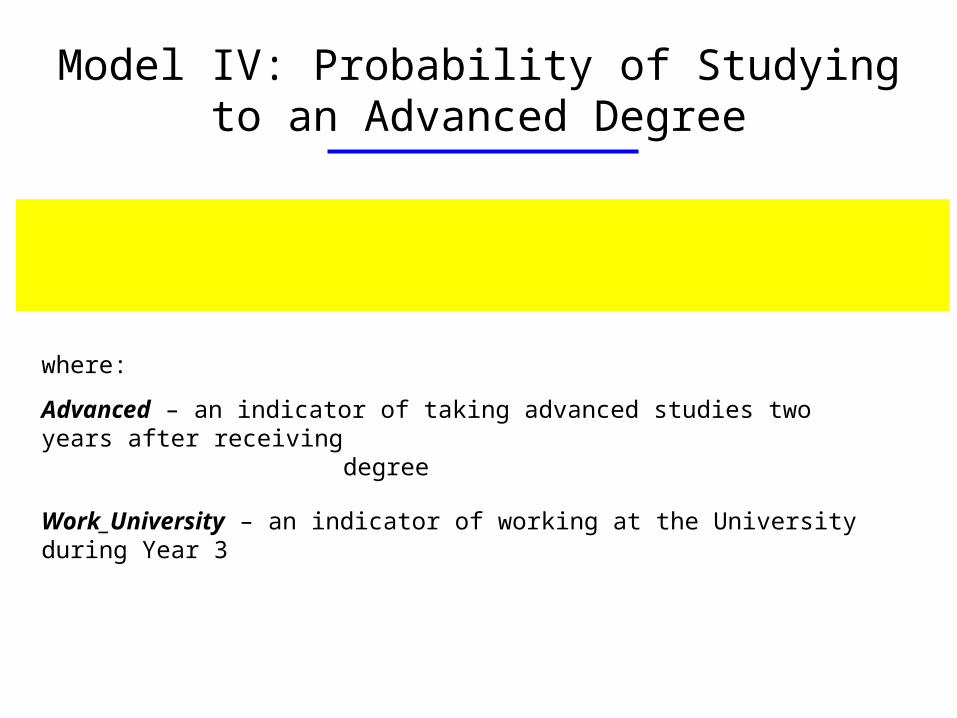
Model IV: Probability of Studying to an Advanced Degree
iijkikiijijk OEUniversityWorkAbilityXAdvanced 321 _)1Pr(
where:
Advanced – an indicator of taking advanced studies two years after receiving degree
Work_University – an indicator of working at the University during Year 3
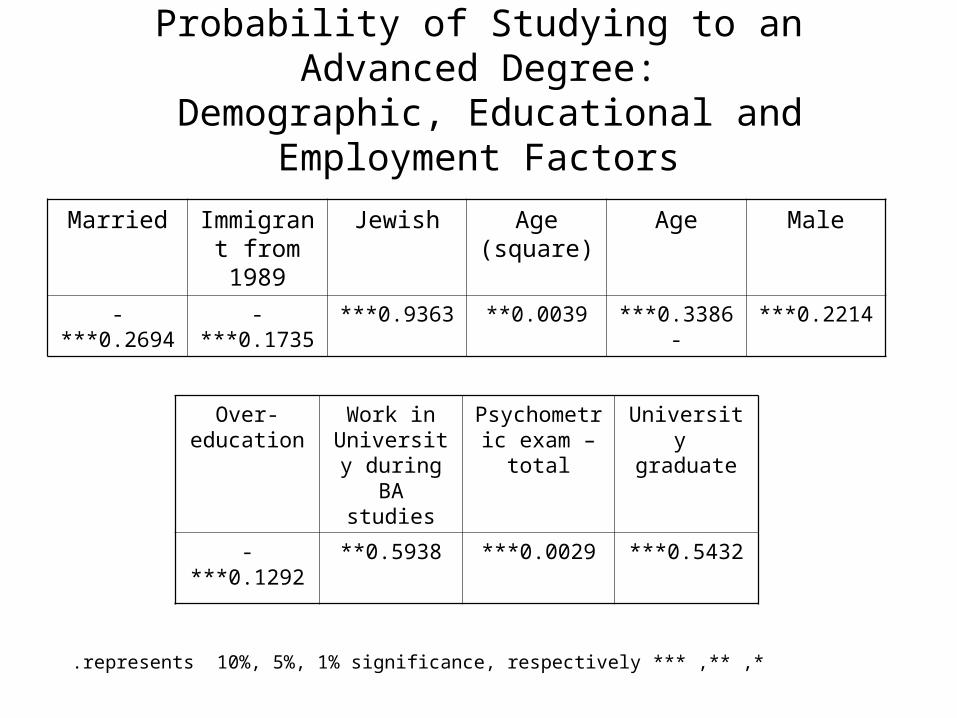
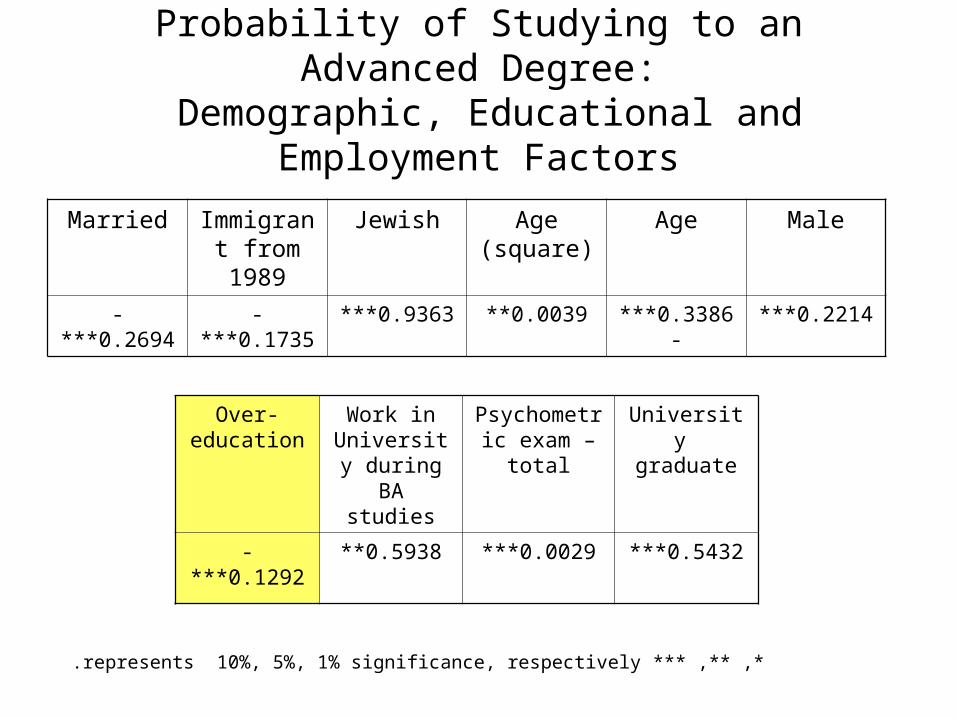
Probability of Studying to an Advanced Degree: Demographic, Educational and Employment Factors
MaleAgeAge (square)
JewishImmigrant from 1989
Married
0.2214***0.3386***-0.0039**0.9363***-0.1735***-0.2694***
University graduate
Psychometric exam – total
Work in University during BA
studies
Over-education
0.5432***0.0029***0.5938**-0.1292***
*** ,** ,*represents 10%, 5%, 1% significance, respectively.
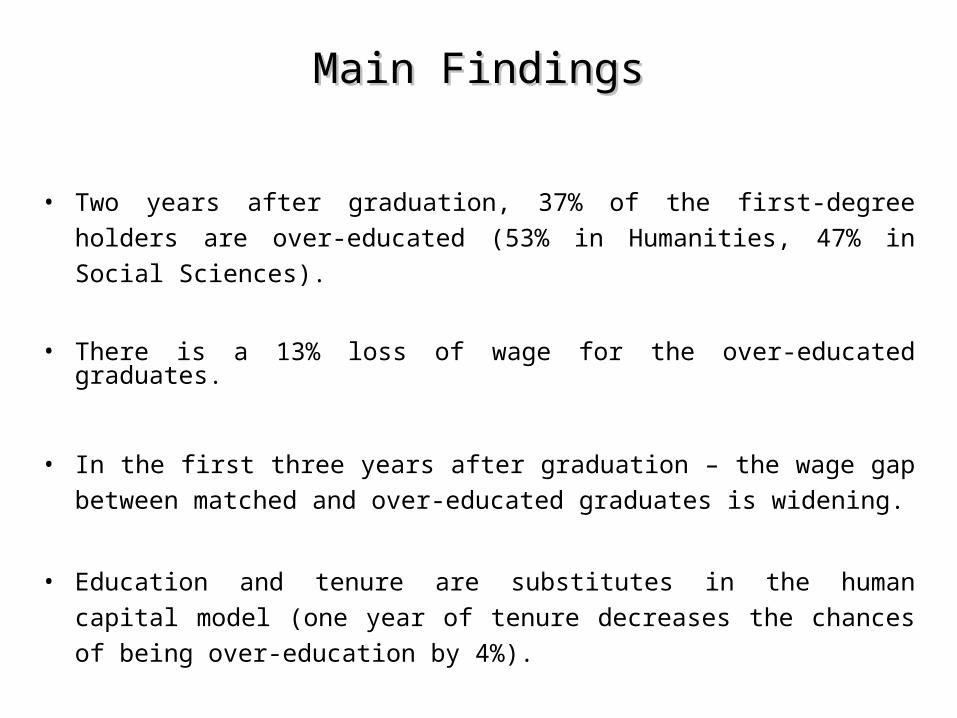
Main FindingsMain Findings
• Two years after graduation, 37% of the first-degree holders are over-educated (53% in Humanities, 47% in Social Sciences).
• There is a 13% loss of wage for the over-educated graduates.
• In the first three years after graduation – the wage gap between matched and over-educated graduates is widening.
• Education and tenure are substitutes in the human capital model (one year of tenure decreases the chances of being over-education by 4%).

Main Findings (cont.)Main Findings (cont.)
• Changing one more job per year (in the first three years after graduation) decreases wage by 19%.
• University graduates seem to have lower chances of over-education – unless individual’s cognitive abilities are explicitly controlled for. That means that the graduating from university variable indicates positive (self)-selectivity into the
universities.
• Over-educated graduates have a lower propensity to study for an advanced degree.

Thank You