overcoming barriers to the growth of ... barriers to the growth of community owned wind farms in...
TRANSCRIPT

OVERCOMING BARRIERS TO THE GROWTH OF COMMUNITY OWNED WIND
FARMS IN VICTORIA.
Student name: Wayne Bowers Student number: 9003094 Program: MC149 M Eng (Sustainable Energy) Course: MIET2133 Energy Design Project II Date: 10/06/11 Academic Supervisor: Dr Petros Lappas & Dr Andrea Bunting External Partners: Alternative Technology Association (ATA) & Hepburn Wind Minor thesis, submitted to fulfil the academic requirements of MC149 – Master of
Engineering, Sustainable Energy.

MIET2133 Energy Design Project II
P a g e | 2 Student #: 9003094 Student: Wayne Bowers

MIET2133 Energy Design Project II
Student: Wayne Bowers Student #: 9003094 P a g e | 3
Table of Contents
ABSTRACT ......................................................................................................................... 5
ACKNOWLEDGEMENTS ...................................................................................................... 6
DEFINITIONS ...................................................................................................................... 6
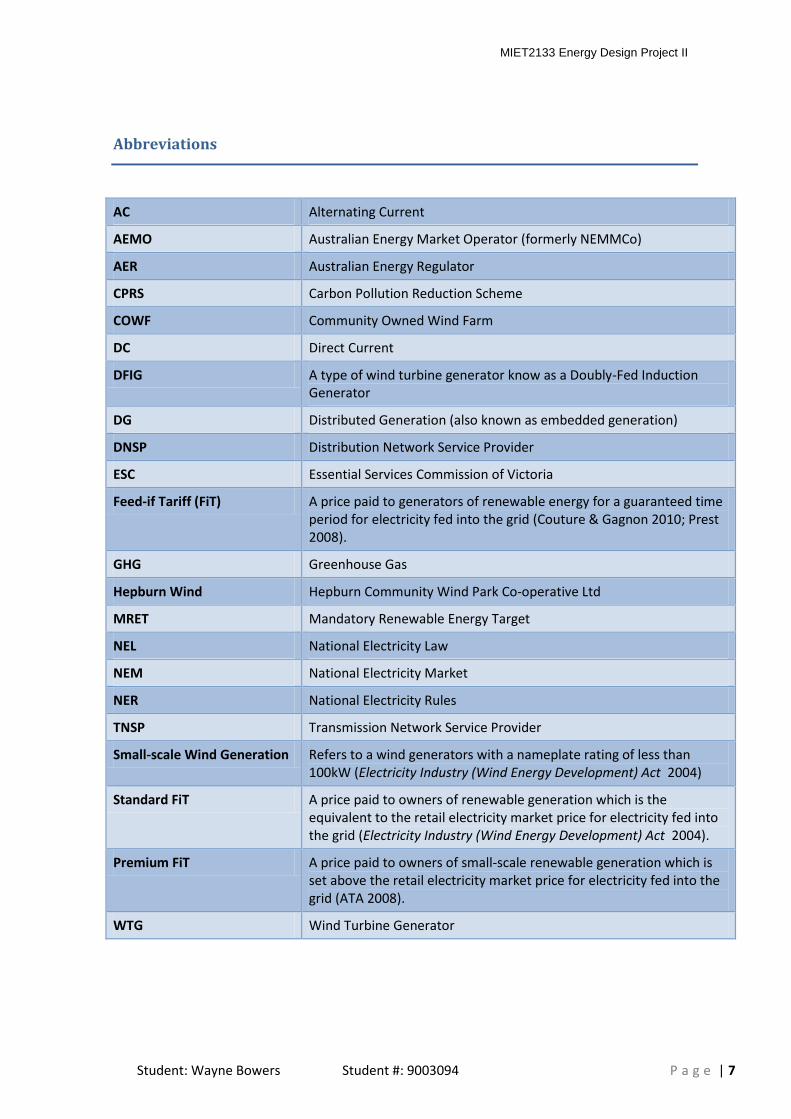
ABBREVIATIONS ................................................................................................................ 7
1 AIM .......................................................................................................................... 9
2 CONTEXT ................................................................................................................ 11
3 WHY SUPPORT COMMUNITY OWNED WIND FARMS? .............................................. 15
3.1 INCREASED ACCEPTANCE AND SUPPORT .............................................................................................. 15
3.2 REDUCED NETWORK LOSSES ............................................................................................................. 17
3.3 NEW SOURCE OF CAPITAL ................................................................................................................. 17
3.4 BENEFITS FOR RURAL COMMUNITIES .................................................................................................. 18
3.5 ETHICAL AND ENVIRONMENTAL COMMITMENT ..................................................................................... 19
3.6 MARKET NICHE .............................................................................................................................. 20
4 TECHNICAL BARRIERS .............................................................................................. 21
4.1 VICTORIA’S RURAL DISTRIBUTION GRID .............................................................................................. 22
4.2 CONNECTION OF A WIND FARM TO THE GRID ...................................................................................... 23
4.3 WHAT IS A WEAK RURAL GRID?.......................................................................................................... 24
4.4 NETWORK VOLTAGE LEVEL ISSUES ..................................................................................................... 24
4.5 OVERCOMING VOLTAGE LEVEL ISSUES ................................................................................................ 29
4.6 NETWORK POWER QUALITY ISSUES .................................................................................................... 30
4.7 TRANSIENT SYSTEM PERFORMANCE ................................................................................................... 32
4.8 GRID PROTECTION .......................................................................................................................... 34
5 INSTITUTIONAL BARRIERS ....................................................................................... 37
5.1 INFORMATION BARRIERS .................................................................................................................. 38
5.2 SPLIT INCENTIVES ............................................................................................................................ 40
5.3 PAYBACK GAPS .............................................................................................................................. 41
5.4 INEFFICIENT PRICING (MISPRICING) .................................................................................................... 43
5.5 REGULATORY BARRIERS ................................................................................................................... 44
5.6 CULTURAL VALUES .......................................................................................................................... 45
5.7 CONFUSION ................................................................................................................................... 47

MIET2133 Energy Design Project II
P a g e | 4 Student #: 9003094 Student: Wayne Bowers
6 RECOMMENDATIONS TO SUPPORT COMMUNITY OWNED WIND FARMS .................. 49
6.1 REGULATORY BASED SUPPORT MECHANISMS ....................................................................................... 50
6.2 NON-REGULATORY BASED SUPPORT MECHANISMS ............................................................................... 63
7 CONCLUSIONS ......................................................................................................... 69
APPENDIX A – WHAT IS A COMMUNITY OWNED WIND FARM? ......................................... 73
APPENDIX B - VICTORIA’S FIRST COMMUNITY OWNED WIND FARM – HEPBURN WIND ..... 79
APPENDIX C – FIT MODELS ............................................................................................... 85
TABLE OF FIGURES ........................................................................................................... 88
REFERENCES..................................................................................................................... 89

MIET2133 Energy Design Project II
Student: Wayne Bowers Student #: 9003094 P a g e | 5
Abstract
This paper begins with the observation that there is a growing interest in community owned
wind farms in Victoria and Australia more broadly. After providing a context for community wind
in Victoria the paper presents a case for the support of community owned wind farms and lists
the potential benefits that are available to rural communities with the courage to embrace such
an initiative. Drawing on the research of distributed generation and wind power, an examination
is conducted of the potential technical and institutional barriers faced by community owned wind
farms in Victoria. The research is combined with input from Australia’s first community owned
wind farm, Hepburn Wind, located near Daylesford in central Victoria. Recommendations are
then proposed in order that the key barriers that have been identified may be overcome.

MIET2133 Energy Design Project II
P a g e | 6 Student #: 9003094 Student: Wayne Bowers
Acknowledgements
I would like to show my gratitude to my supervisors Dr Petros Lappas and Dr Andrea Bunting
for their feedback and support. I would like to acknowledge the support of the Alternative
Technology Association (ATA), in particular Damien Moyse, Craig Memery, and Don Baston for
providing connections and guidance. Thanks are due to Kate Summers for her motivation and
help in order to understand the many aspects of the National Electricity Market (NEM). Lastly I
offer a special thanks to Embark and Hepburn Community Wind Farm for their assistance and
time, in particular the chairman of Hepburn Community Wind, Mr. Simon Holmes à Court.
Definitions
For the purposes of this paper, a community owned wind farm is defined as:
A development in which a group of like-minded individuals with a majority from the
geographical area of the development, through joint ownership and participation, erect a small
number of wind turbines for the benefit of that community.
MIET2133 Energy Design Project II
Student: Wayne Bowers Student #: 9003094 P a g e | 7
Abbreviations
AC Alternating Current
AEMO Australian Energy Market Operator (formerly NEMMCo)
AER Australian Energy Regulator
CPRS Carbon Pollution Reduction Scheme
COWF Community Owned Wind Farm
DC Direct Current
DFIG A type of wind turbine generator know as a Doubly-Fed Induction Generator
DG Distributed Generation (also known as embedded generation)
DNSP Distribution Network Service Provider
ESC Essential Services Commission of Victoria
Feed-if Tariff (FiT) A price paid to generators of renewable energy for a guaranteed time period for electricity fed into the grid (Couture & Gagnon 2010; Prest 2008).
GHG Greenhouse Gas
Hepburn Wind Hepburn Community Wind Park Co-operative Ltd
MRET Mandatory Renewable Energy Target
NEL National Electricity Law
NEM National Electricity Market
NER National Electricity Rules
TNSP Transmission Network Service Provider
Small-scale Wind Generation Refers to a wind generators with a nameplate rating of less than 100kW (Electricity Industry (Wind Energy Development) Act 2004)
Standard FiT A price paid to owners of renewable generation which is the equivalent to the retail electricity market price for electricity fed into the grid (Electricity Industry (Wind Energy Development) Act 2004).
Premium FiT A price paid to owners of small-scale renewable generation which is set above the retail electricity market price for electricity fed into the grid (ATA 2008).
WTG Wind Turbine Generator

MIET2133 Energy Design Project II
P a g e | 8 Student #: 9003094 Student: Wayne Bowers

MIET2133 Energy Design Project II
Student: Wayne Bowers Student #: 9003094 P a g e | 9
1 Aim
The purpose of this paper is threefold. First, to show that there are genuine benefits provided
by community owned wind farms. Second, to identify barriers that significantly impact the growth
of community owned wind farms in the state of Victorian. Third, based on the identified barriers,
recommendations to overcome these barriers will be proposed and discussed. The investigation
of these issues will be supported by drawing on the experiences from Australia’s first community
owned wind farm (COWF), Hepburn Community Wind Park Co-operative Ltd (Hepburn Wind),
located near Daylesford in Central Victoria.

MIET2133 Energy Design Project II
P a g e | 10 Student #: 9003094 Student: Wayne Bowers

MIET2133 Energy Design Project II
Student: Wayne Bowers Student #: 9003094 P a g e | 11
2 Context
At the turn of last century, electricity supply was established around the local generation and
supply by each town or city through small local electricity networks. During the 1930’s it became
technically and economically feasible to interconnect these smaller electricity networks into
larger ones which eventually grew into our centralised electricity system of today (Burton et al.
2001). Currently, Victoria generates most of its electricity in large centralized facilities located in
the Latrobe valley. These centralized thermal generation facilities make use of locally abundant
brown coal which has provided Victoria with a low cost source of electricity for many decades.
These plants have excellent economies of scale, but usually transmit electricity long distances
with associated losses and have significant environmental effects due to their greenhouse gas
(GHG) emissions and other pollutants. The Victorian Governments Climate Change White Paper
recently highlighted that it will be a difficult challenge for Victoria to reduce its GHG emissions
because of its heavy reliance on brown coal (Victorian Government 2010).
While Victoria, and Australia more broadly, marched on predominately with large scale coal
power plants it was countries such as Denmark that took a different road. Through environmental
concerns, energy security, and government incentives, many forms of low emissions distributed
generation (DG) flourished. Distributed Generation (DG) is an approach whereby the generator is
connected to the distribution network thus allowing electricity to be generated very close to the
load with the added benefit that it reduces the amount of energy lost in transmitting electricity
long distances (Nelson 2008). DG can take many forms of low emissions technologies such as
combined heat and power (CHP), solar photovoltaic (PV) and wind turbine generators. In
combination with these changes was a new type of DG development known as the community
owned wind farm (COWF), see Appendix A – What is a community owned wind farm? for a
detailed definition of a ‘community wind farm’. This was so popular in Denmark that it was later
repeated in Germany and to a lesser extent in other European countries (Bolinger, MA 2005).
Recently other countries have followed suit including the United States and Canada, specifically
states where legislation supports community wind such as Minnesota and Ontario (Green Energy
and Green Economy Act 2009; Gipe 2010; Yarano 2008).
MIET2133 Energy Design Project II
P a g e | 12 Student #: 9003094 Student: Wayne Bowers
With the public becoming increasingly concerned by the potential impact of climate change
on Australia, both the federal and state governments have implemented schemes to promote the
development of renewable energy generation in an effort to try and reduce our GHG emissions.
The federal government introduced the renewable energy target (RET) scheme which provided a
quota system for both small and large-scale renewable generation while the Victorian state
government has favoured incentives for small-scale DG such as domestic solar PV. It should be
noted that the Victorian Government did have a quota scheme called the Victorian Renewable
Energy Target (VRET) which was later rolled into the federal governments RET scheme.
The RET scheme guarantees a market for additional renewable energy generation using a
mechanism of tradeable Renewable Energy Certificates known as RECs (backed by a legislative
quota or target). The RET scheme has changed considerably since its inception in 2001 when it
began as the Mandatory RET (MRET). Having initially set a target of 9500GWh from additional
renewable energy, larger scale wind farms where quickly established to benefit from the scheme,
however the scheme soon faulted due to the target being quickly met. The legislated target was
then increased to provide 20% of energy from renewable sources by 2020, a target of 45,000GWh
per year. However, the scheme again faulted when the REC price dropped because the market
became oversubscribed due to a significant amount of RECs entering the market from small scale
installations. Under the scheme installations involving solar water heaters, heat pumps,
photovoltaic systems, wind systems, and small hydro electric are all eligible for RECs with a
maximum deeming period of up to15 years (ORER 2011). This means that all eligible RECs are
created immediately following installation and not over the life of the system, which was most
likely conceived to simplify the scheme. Further compounding the issue was a new federal
incentive called the Solar Credits multiplier which gave households up to 5 times the number of
RECs that their system would actually produce. In addition to the federal incentive various state
governments implemented Feed-in-Tariff (FiT) legislation that has driven demand for small-scale
photovoltaic systems (Brazzale 2011).
MIET2133 Energy Design Project II
Student: Wayne Bowers Student #: 9003094 P a g e | 13
The accumulation of these issues led to the most important change to the scheme since its
inception, known as the Enhanced RET scheme, it split the scheme into two parts beginning the
1st January 2011. The parts comprise the Small-scale Renewable Energy Scheme (SRES) with a
target of 4000GWh per year by 2020 and the Large-scale Renewable Energy Target (LRET) with a
target of 41,000GWh per year by 2020 (Australia 2011).
Small scale wind generators in Victoria can benefit from the ‘Standard Feed-in Tariff’. Feed-in
Tariffs (FiTs) have a brief history in Victoria, having only been introduced in the past decade. The
first FiT, known as the Standard FiT, was legislated by the Victorian government in 2004 with the
aim to facilitate the development of wind energy generation and ensure that wind generators are
paid for electricity generated (Electricity Industry (Wind Energy Development) Act 2004). The
Standard FiT placed an obligation on the electricity retailers to pay a FiT equivalent to the retail
market price of electricity to Victorian households and small businesses for electricity fed into the
electricity grid from small scale wind generators. This was followed by an expansion of the
Standard FiT in 2007 to include other renewable energy sources such as Solar, Hydro, and
Biomass (DPI 2010).
There is a developing interest in community owned wind farms (COWFs) in Victoria as a
means to reduce the communities GHG emissions which makes sense when you consider that the
primary advantage of wind farms is their cost effective contribution to a reduction in GHG
emissions. These savings result from wind being a renewable energy source, a mature wind
turbine industry and as a result of reduced network losses by using the generation near the point
of consumption (CSIRO 2009). However there are many barriers and no support for this segment
of the renewable electricity generation market in Victoria. For example, COWFs do not have the
scales of economy that large-scale wind farms enjoy and do not receive the support that small-
scale wind receives in the form of a FiT. See Table 1 for a comparison of the different scale wind
projects. This provides the context from which this paper will now discuss in detail both the
benefits and barriers facing COWF projects in Victoria and proposed solutions to aid COWF
development in the state.

MIET2133 Energy Design Project II
P a g e | 14 Student #: 9003094 Student: Wayne Bowers
Domestic Scale
(Small Scale)
Medium Scale
(COWFs)
Utility Scale
(Large Scale)
Generation Capacity < 100kW 100kW to 30MW > 30MW
Life of Project 15 years 20+ years 20+ years
Grid Connection Via Domestic Supply Distribution Network Transmission or Sub-
transmission Network
Sale of Electricity Standard FiT Via spot market or
Power Purchase
Agreement (PPA)
Via spot market or
Power Purchase
Agreement (PPA)
RET Scheme Small-scale
Renewable Energy
Scheme (SRES) (size <
10kW)
Large-scale
Renewable Energy
Target (LRET)
(size >= 10kW)
Large-scale
Renewable Energy
Target (LRET)
Large-scale
Renewable Energy
Target (LRET)
Economies of scale No No Yes – usually greater
than 15 turbines
(particularly
administration and
operation)
Table 1 – Comparison of different scale wind projects.

MIET2133 Energy Design Project II
Student: Wayne Bowers Student #: 9003094 P a g e | 15
3 Why support community owned wind farms?
There are significant benefits to be gained by supporting community owned wind farm
(COWF) developments. These include but are not limited to increased acceptance of wind
generation, distributed generation loss advantages, and renewal for rural communities involved
in such projects. These benefits are discussed in detail in the following sections. As stated by the
not-for-profit group Energy4All in the UK:
Owning a wind farm increases awareness of and involvement in renewable energy
developments, maximises financial returns from local resources, and mobilises environmental
concern (Energy4All, 2010).
3.1 Increased Acceptance and Support
The community at all levels is becoming more familiar with climate change and its
consequences and thus is looking for actions that they can take to have a positive effect on their
greenhouse gas emissions. Consequently COWF projects can fill part of this need. Research in the
UK has indicated that renewable energy projects that allow for significant community input and
recognition, and which focus on the positive values of the project can facilitate support for the
promotion of renewable energy or open the door to these ideas (Walker & Devine-Wright 2008).
COWF projects with few exceptions (possibly farmer based models) involve the local
community from the inception of the project. This direct involvement in the project helps raise
public awareness and increases the number of local individuals with a stake in the success of the
project. By doing this the local community becomes involved in the siting and the orientation of
the turbines and can control the scale of the development. This has been shown to increase local
acceptance and contribute to fewer planning issues (Walker 2008).

MIET2133 Energy Design Project II
P a g e | 16 Student #: 9003094 Student: Wayne Bowers
One thing we can all relate to is the sense of ownership we have with relation to a project in
which we can express control and influence. More concisely a ‘sense of ownership’ in a
community project or development is described as “a concept through which to assess whose
voice is heard, who has influence over decisions, and who is affected by the process and outcome”
(Lachapelle 2008). Lachapelle goes on to make a case for a relationship between capacity for and
quality of trust and the potential for ownership. Although a sense of ownership can be quite
subjective as compared to legal ownership (Warren & McFadyen 2008), this needs to be taken
into account in the early stages of a project to ensure that trust and a sense of ownership are
developed otherwise this could strengthen the voice of local objectors.
This sense of ownership clearly cannot be ignored as demonstrated by research in the UK that
suggests it is possible that projects that are owned or part-owned by local communities generally
have fewer problems with obtaining planning permission (Walker 2008). Interestingly in a study
of wind farms in Scotland, support for wind power was relatively strong and it was found that it
did not impact on the ability of the region to attract tourists (Warren & McFadyen 2008). The
authors of this study go on to argue that the key finding of their study in Scotland and the UK
more broadly was the positive impact that the community-based model had on local acceptance
and increased support for wind farm development. In addition, members of the Kintyre
community in Scotland expressed concern for the over development of their region because they
felt, having supported some wind farm development, that they may be pressured into further
development due to the lack of support from other communities.
MIET2133 Energy Design Project II
Student: Wayne Bowers Student #: 9003094 P a g e | 17
3.2 Reduced Network Losses
Nelson points out that because COWF generators are typically located close to the point of
consumption, for example the community that owns the wind farm, they use very little of the
wider electricity distribution network to deliver the electricity (Nelson 2008). Hence if all of the
electricity is consumed locally then that amount did not have to be transmitted from the
centralised generators and thus associated losses are eliminated.
3.3 New source of Capital
By utilising the community ownership model and extending it to ‘communities of interest’
(see Appendix A), such as private ethical investors, can provide a source of much needed
investment capital (Bolinger, M 2001). For example, in Germany the ‘Burgerwindparks’ (Citizens’
wind farms) make up over 5000MW of installed wind turbine capacity. These wind farms typically
have strong local participation, involve ethical investment principles and only occasionally offer
lower returns (Toke, Breukers & Wolsink 2008).

MIET2133 Energy Design Project II
P a g e | 18 Student #: 9003094 Student: Wayne Bowers
3.4 Benefits for Rural communities
The most obvious benefit from community owned wind farms (COWFs) or any renewable
energy project is the financial return on investment and sale of generated electricity (Walker
2008). This could be significant for rural communities that are in decline and want to become
more financially resilient in the face of climate change and peak oil. Furthermore, rural
communities are typically very reliant on fossil fuels which could see significant increases in the
price in the medium term. From an investigation of wind farms in 2 districts in Scotland (Warren
& McFadyen 2008), it was shown that the community-owned project returned over ₤28,000 per
turbine whereas the utility-owned project returned only ₤369 per turbine to the community. In
addition it showed that the community-owned project also created new local jobs, net
immigration and growing numbers in the local school. This is a significant indicator of how strong
a financial case exists for such projects at a community level.
Another similar project in Germany, the Galmsbull GE co-operative wind farm (which
produces enough electricity for 3600 homes) returns 33% of its profits to the local community
(Wijngaart, Pemberton & Herring 2009). A community wind farm can provide a significant
additional revenue for a local community, for example if 2 million shares are locally owned out of
a possible 9.5 million (1 share = $1) then at a very conservative 6% return per annum would result
in over $120,000 returned to the local community each year. There is also the benefit of lease
agreements with local land owners, many of whom are farmers looking for more stable incomes
to supplement their agricultural returns.
What’s more, community wind farms can also provide education and supplemental funding
for sustainability projects within the local community. For example, Hepburn Wind has
established a Community Sustainability Fund (CSF) to support local community energy programs.
The fund is allocated a portion of the project’s profit over the life of the wind farm and is paid on
an annual basis from the first year of operation. Hepburn wind forecasts the fund will provide
over $1,000,000 over the life of the wind farm (Membership and Share Offer 2010). Reduced
electricity costs through education programs to promote energy efficiency and the ability to
purchase electricity generated locally can also bring significant financial reward.

MIET2133 Energy Design Project II
Student: Wayne Bowers Student #: 9003094 P a g e | 19
3.5 Ethical and Environmental commitment
Many local communities throughout Australia are looking for ways to have a positive impact
on climate change and boost the amount of renewable energy generated locally. For Hepburn
Wind the driving motivation for establishing a community owned wind farm (COWF) was “climate
change and the enormous benefits of renewable energy” (Hepburn Wind 2010). It must also be
noted that the lack of government action on climate change and the holdup of a carbon trading
scheme are also motivating forces for community action. Examples of community wind farm
success overseas include Germany where approximately 50% of the 20,000MW to be installed by
the end of 2006 will be locally owned (Toke, Breukers & Wolsink 2008). There is mounting
evidence that being involved with community based renewable energy projects can raise both
understanding of and support for renewable energy projects more generally (Walker & Devine-
Wright 2008). In Australia this has been demonstrated by the number of letters written in support
of rural wind projects submitted by members and supporters of the Hepburn Wind project in
response to the Senate Inquiry into The Social and Economic Impact of Rural Wind Farms (Senate
2011).

MIET2133 Energy Design Project II
P a g e | 20 Student #: 9003094 Student: Wayne Bowers
3.6 Market Niche
Typically smaller-scale wind developments are not attractive to commercial developers
because of potentially lower returns due to smaller economies of scale in the development and
management of the project. This presents an opportunity for community-based wind
developments that don’t have the corporate pressures to provide large returns to investors. This
is an advantage of ethical and local community investments that are willing to take a lower
return; however these investors still expect a return on investment that is reasonable.
Many areas where wind resources are commercially viable are either located very remotely
and thus are not close to large network connectors, or require local network connections to be
upgraded to support the peak generation from the commercial wind farm development
(Diesendorf 2010). An example in Australia is the grid-constrained South Australian wind
generators. These additional costs for providing the upgraded infrastructure often results in a
commercial project no longer being economically viable. This means smaller scale community
projects can become a viable option in these regions as the smaller size may not require any
upgrade to the electricity network.

MIET2133 Energy Design Project II
Student: Wayne Bowers Student #: 9003094 P a g e | 21
4 Technical Barriers
As can be seen in Figure 1 the most promising wind resource available in Victoria is
distributed over a large rural area away from the capital city of Melbourne. Therefore the
Victorian rural electricity distribution networks will be the primary point of connection to collect
the energy generated from potential community owned wind farms (COWFs). Although we have
described wind farms connected in this way as being a form of distributed generation (DG), they
can be described as being embedded in the distribution network, thus are also termed embedded
generation (EG).
Figure 1 - Victorian Wind Resource Map (SV 2011)
As previously discussed, Victoria’s electricity network was constructed around centralised
brown coal fired generators, mostly located in the Latrobe Valley. As such, the transmission and
distribution networks where constructed with only unidirectional power flows in mind, from
generator to customer load. Hence the connection of wind farms to the distribution network was
not considered in the initial design and can alter the way in which they operate (Burton et al.
2001). To ensure that the distribution network continues to operate correctly some potentially
serious technical barriers regarding the connection of COWFs must be overcome.

MIET2133 Energy Design Project II
P a g e | 22 Student #: 9003094 Student: Wayne Bowers
4.1 Victoria’s Rural Distribution Grid
The rural electricity distribution grid of Victoria is supplied by the high voltage (HV)
transmission network that originates at the centralised generators. The distribution network is
composed of a sub transmission network of three phase overhead lines operating at 66kV which
supplies the ‘distribution network’, which together comprise 84,000 km of bare wire overhead
lines (The Nous Group 2010). The ‘distribution network’ comprises three and single phase lines of
22kV and Single Wire Earth Return (SWER) lines operating at 12.7kV (The Nous Group 2010). The
Victorian distribution network is divided into zones which are operated by five private
Distribution Network Service Providers (DNSPs).
Figure 2 – Victorian Electricity Transmission and Distribution Network diagram

MIET2133 Energy Design Project II
Student: Wayne Bowers Student #: 9003094 P a g e | 23
4.2 Connection of a Wind Farm to the Grid
Until recently most utility scale wind generators operated with 3 phases at a voltage less than
1000V, typically 690V between phases (Burton et al. 2001) and required an external step-up
transformer for connection to the distribution network. The reason for the lower voltage within
the wind turbine was both to reduce cost and for simplicity as safety regulations become much
more severe for voltages higher than this. For example, higher voltages will require special
precautions and dedicated equipment to earth the systems before work can be carried out
(Burton et al. 2001). The Hepburn Wind farm generators are connected in this fashion, see Figure
3.
Recently the market has become dominated by larger turbines which make it practical to
generate higher voltages to reduce losses and thus eliminate the need for an external step-up
transformer. For example, the Acciona AW1500, 1.5MW wind turbine generates an output
voltage of 12kV (ACCIONA 2011). However, operating at higher voltages can add addition safety
requirements and thus costs both for the connection of these turbines and ongoing maintenance.
It should be noted that only balanced three phase networks of 22kV or 66kV are suitable for the
connection of utility scale wind turbines (Burton et al. 2001).
Figure 3 - Connection of Hepburn Wind's two 2.05MW turbines to the distribution grid

MIET2133 Energy Design Project II
P a g e | 24 Student #: 9003094 Student: Wayne Bowers
4.3 What is a weak rural grid?
The literature often talks about weak networks, particularly in rural areas, but what is meant
by a weak network? This refers to a weak point on a network where changes in the real and
reactive power flows into or out of the network will cause significant changes in the voltage at
that point, and at neighbouring points on the network (Tande 2000). Networks in rural areas are
generally weaker than in urban or industrial areas due primarily to the length of the distribution
feeders and sparsely connected loads. Weak networks are often referred to as having a ‘low
short-circuit level’ or ‘low fault level’ due to the associated low fault level at the customer’s point
of connection (Craig et al. 1996; Tande 2000).
4.4 Network Voltage Level Issues
Due to the design of the distribution networks in Victoria, the networks do not lend
themselves to the connection of significant generation and thus voltage control at these lower
distribution voltage levels becomes a significant issue (Ackermann, Andersson & Söder 2001; Fox
2007). These distribution networks can generally be considered as weak networks. The concern
for network voltage levels is sometimes referred to as Slow or Steady-State voltage variations.
Distribution networks are distinguished from other networks by the direct connection of
demand (customer loads) often connected through fixed-tap transformers. For example, the
transformer will step down the 22kV to 240V for single phase connections to households. The key
design criteria for these networks are therefore voltage standards to ensure that customers
located at any distance along the length of the distribution network receive voltage that is within
the limits of that standard.
In Victoria the distribution network must be capable of delivering a nominal voltage to the
customer of 230V/400V/460V within +10% and -6% at the customers’ point of connection (BCSE
2004; SP AusNet 2011). The National Electricity Rules (NERs) state that the distribution voltage
must be within +/-10% of nominal (AEMC 2011). However, as customers are connected directly to
the high voltage distribution network through fixed step down transformers this means that the
voltage throughout the distribution network must be considered carefully to ensure that the
voltage at the customer’s point of connection is within standard. The allowable voltage range is
illustrated in terms of distance along the length of the distribution circuit as shown in Figure 4.

MIET2133 Energy Design Project II
Student: Wayne Bowers Student #: 9003094 P a g e | 25
Figure 4 – Simplified Distribution Network Voltage Profile without distributed generation
It should be noted that the transformer that connects the customer to the distribution
network will have its ratio adjusted during installation to ensure that the voltage at the
customer’s point of connection is matched to the voltage at that point on the distribution
network. Therefore a customer connected close to the distribution substation will have a
different ratio adjustment compared to a customer located at the end of the distribution
network.
Due to the dynamic nature of the customer loads, current will change in the distribution
network throughout the day leading to voltage change as the voltage is directly proportional to
the current in the network (Kundur, Balu & Lauby 1994). The voltage drop is also a function of the
conductor (overhead line) impedance and length (Fox 2007). In order to maintain the voltage
level within network specifications where the load varies greatly and the length impacts voltage
levels, the change in voltage is compensated for by employing transformers with on-load tap
changers (OLTC) (Burton et al. 2001). This type of transformer is also known as an Automatic
Voltage Regulator (AVR) (Fox 2007). This means that the transformers ratio (or taps) can be
altered automatically so that the voltage level is maintained within limits. The voltage profile for
such a network is shown in Figure 5.

MIET2133 Energy Design Project II
P a g e | 26 Student #: 9003094 Student: Wayne Bowers
Figure 5 - Voltage profile for network with Automatic Voltage Regulator (AVR) compensation
Now consider the addition of a wind farm generator connected to this network as shown in
Figure 6. The connection of the wind farm results in a reversal of power flow in part of the
distribution network and an increase in voltage at the wind farm point of connection. This may
result in the end customer experiencing voltages outside the specified nominal voltage. The full
impact will depend on the size of the wind farm, the impedance of the feeder and the dynamic
nature of the loads. Furthermore, there are two significant impacts that need to be considered.
The first, that the AVR’s may behave in such a way that protection equipment is tripped if not
designed for excessive voltage excursions or reverse current flows (Burton et al. 2001; Wallace,
AR & Kiprakis 2002). Second that the AVR’s may tap change more often due to variation in wind
generator output, thus resulting in flicker at the customers point of connection and possibly
maintenance issues for the AVR (Burton et al. 2001).

MIET2133 Energy Design Project II
Student: Wayne Bowers Student #: 9003094 P a g e | 27
Figure 6 - Possible scenario with wind farm connection to distribution network

MIET2133 Energy Design Project II
P a g e | 28 Student #: 9003094 Student: Wayne Bowers
4.4.1 Case study – Hepburn Wind
A MatLab simulation was carried out to demonstrate the potential effect of the Hepburn
Wind farm on the local distribution network using the simplified feeder model as shown in Figure
7. The points shown on this model, labelled 1 through 8, are locations along the feeder of
significant load or connection points and where voltage levels were measured. It was assumed for
the simulation that the distance between each of these points was 10km. The overhead lines
were then simulated using a series Resistive-Inductive component with parameters as listed in
Table 2. Shunt capacitive effects were not considered as they are considered negligible for
overhead lines of up to approximately 100kms in length (Fox 2007). The VCR’s are shown in the
simplified model of Figure 7 to indicate location on the feeder only and were not simulated.
Figure 7 - Simplified Powercor Feeder BAN_11 that connects Hepburn Wind (Wallace, P 2009)
Overhead Line Parameter Parameter Value
Resistance, R (Ω) 0.30
Reactance, X (Ω) 0.31
X/R Ratio 1.03 Table 2 – Typical MV overhead line parameters at 50Hz (per phase, per km)(Fox 2007)
The results of the simulation are shown in Figure 8. The results show a significant increase in
voltage at the wind farm point of connection of approximately 7% when the wind turbines where
operating at maximum power output and thus an increase in voltage level along the length of the
distribution network. This indicates a reversal of current flow in the distribution network from the
wind farm back toward the zone substation.

MIET2133 Energy Design Project II
Student: Wayne Bowers Student #: 9003094 P a g e | 29
Note that the simulation does not include dynamic load changes which can affect voltages
levels. Although the voltage level across the distribution network only varies by less than 8% this
will still have a significant effect on the VCRs which will have to tap change more often during
wind farm output variation. The other concern regards reverse current flow through the VCR
located between points 2 and 3, as this may result in incorrect behaviour and tripping of
protection equipment if the VCR has not been designed for reverse power flow.
Figure 8 – Voltage profile along feeder BAN_11
4.5 Overcoming Voltage Level Issues
There are a number of methods that can be employed to overcome voltage level issues.
Advancements in wind turbine technology and turbine manufacturers adding options to allow the
turbine to contribute reactive power can reduce the need for additional voltage level control
equipment. However, the method chosen will be based on an analysis of the distribution network
with the final decision on which solution to implement being given by the DNSP as part of the
connection approval process. It should be noted that if the DNSP demands additional devices to
control the voltage level such as STATCOMs, this could result in a significant increase in capital
expenditure as these devices can be quite expensive.

MIET2133 Energy Design Project II
P a g e | 30 Student #: 9003094 Student: Wayne Bowers
4.6 Network Power Quality Issues
Network power quality issues are those associated with noticeable effects on the end
customer’s load. For example, harmonics delivered from the network being coupled into
telephone lines or flicker in incandescent light globes.
4.6.1 Harmonics
Any device that consists of a power converter, commonly referred to as an inverter, will be
capable of creating harmonics or voltage waveform distortion. Most modern turbines use power
converters, particularly DFIG or any wind generator where the variable frequency current
produced is converted to DC and then back to AC for delivery to the electricity network, also
known as a full power AC-DC-AC inverter. Modern power electronic converters are able to apply
filtering to the output current and thus are able to reduce the harmonics injected into the
network (Coster et al. 2011).
In general, the DNSP will seek to ensure that any new generation does not worsen harmonics
on the power system as they are responsible for guaranteeing that the distribution network
complies with the National Electricity Rules (AEMC 2011). Chapter 5 of the National Electricity
Rules specifies the criteria that new generation will need to meet in order to connect to the
electricity network, including the requirements for voltage waveform distortion and relevant
standards such as Australian Standard AS/NZS 61000.3.6:2001.
However this is only part of the story as a DFIG turbine can meet standards but still cause
harmonic voltage distortion when a resonant condition exits. Resonant frequencies are hard to
predict and depend on the connected reactive load devices, network topology, and the
connected wind generator(s) (Fox 2007). As such, the DNSP will require that monitoring
equipment be installed at the site so that the site is measured both during and after
commissioning to ensure that there are no resonant conditions and that harmonics are kept
within standards. Wind turbines that convert all power generated by the turbine will, in theory,
emit more harmonics than wind turbines that convert only a portion of the power generated such
as DFIG devices (Fox 2007).

MIET2133 Energy Design Project II
Student: Wayne Bowers Student #: 9003094 P a g e | 31
4.6.2 Flicker
Although there are no firm definitions for Flicker, it is generally considered as a voltage
fluctuation of less than 10Hz that results in a discernible flicker in the visual output of
incandescent globes (Fox 2007; Kundur, Balu & Lauby 1994). Flicker can be caused be either rapid
and regular load current variation or a phenomenon exhibited by some wind turbines, particularly
fixed speed turbines, called the tower effect or 3P (Coster et al. 2011; Fox 2007). It is called 3P
because an oscillation in power can occur at 3 times the blade turning speed or once every time a
blade passes the tower (typical frequency is about 1Hz). When the blade passes the tower, the
tower can shield the blade and this can result in a partial loss of electrical power caused by a
partial loss of torque input. Usually large wind farms don’t exhibit this issue as many turbines
together will reduce the impact of these oscillations on customers (Fox 2007). Fox indicates that
measurements made of both DFIG and fixed speed WTG show that DFIG have a smaller impact
and tend to smooth the 3P oscillations whereas fixed speed WTG may require additional
equipment to reduce the 3P effect (Fox 2007).
The 3P effect may be more significant with earlier designs in which the turbine blades were
downwind of the tower, hence the air flow must first pass around the tower potentially causing
turbulence which then enters the swept area of the turbine blades (Memery 2011).
Contemporary turbine designs typically have the blades upwind of the tower.

MIET2133 Energy Design Project II
P a g e | 32 Student #: 9003094 Student: Wayne Bowers
4.7 Transient System Performance
Transient system performance is concerned with the response of the wind farm to changes or
faults in the electricity network that are outside standard operating conditions. For example,
frequency changes in the grid due to peak summer demand and short circuit conditions that may
occur on the distribution network.
4.7.1 Frequency Performance & dynamic response
Any generation equipment connected to the electricity network must work within a set of
frequency limits. Conditions may arise that result in an imbalance between supply and demand
which in turn causes the network frequency to deviate from the specified frequency of 50Hz
(Pepermans et al. 2005). Therefore generation connected to the distribution network must be
equipped with a control mechanism capable of responding to the frequency change. Wind
generators are typically not capable of providing frequency support in small numbers so can be
considered to free ride on the efforts of the TNSP and large scale generators to maintain network
frequency (Pepermans et al. 2005). The AMEC publishes frequency operating standards which
outline the frequency range and endurance time of which the wind turbine will be expected to
operate without tripping (AEMC 2011). As the frequency range over which the network must be
maintained in Australia is much narrower than most overseas countries, it would be expected
that imported turbines would easily be able to meet the frequency operating standards.
As noted by Fox, many turbine manufacturers have indicated that there are no significant
issues associate with meeting these frequency limits (2007). Although their control systems can
handle the change in frequency, some wind turbine generators are affected mechanically through
induced mechanical loads at higher system frequencies. This is more prevalent with fixed-speed
WTGs than with DFIG units as the speed of the generator in a DFIG machine is partly isolated
from the network frequency.

MIET2133 Energy Design Project II
Student: Wayne Bowers Student #: 9003094 P a g e | 33
4.7.2 Transient Response
Transient response relates to the way in which a distributed generator responds to various
kinds of three-phase faults on the network. These faults include (Fox 2007):
Single line shorted to ground
Line to line short
Double line shorted to ground
Three lines shorted to ground
These types of faults are typically well understood, however it is important that when the
turbine is subjected to the most severe fault type, a three-phase-to-ground fault, that the turbine
is capable of handling such a fault and the resulting behaviour is predictable (Fox 2007). The DNSP
will expect the generator to be able to ‘ride through faults’, which means that the wind generator
control system must be able to detect faults and not trip (shut down) in order to be available to
contribute to the restoration of the network, through supplying customer load, immediately the
fault is cleared.
The worst case for the wind generator is when the fault occurs very close to it so that the
voltage seen by the generator is virtually zero. There have been many advances in wind turbine
ride-through capability since 2003 with some advanced DFIG turbines now capable of ride-
through when voltages at the wind farm connection drop to 30% of nominal voltage. Some recent
advances indicate that this may be go as low as 15% of nominal voltage for a short period (Fox
2007).

MIET2133 Energy Design Project II
P a g e | 34 Student #: 9003094 Student: Wayne Bowers
4.8 Grid Protection
This section looks at the effect of DG on fault level, fault detection and grid protection
schemes.
4.8.1 Fault Level
When DG is added to a distribution network, fault current levels will be impacted. An example
is shown in Figure 9 where a short has occurred along the distribution line. This fault will now
have fault current contributed from both the grid and the local generator. The amount
contributed from each source will be dependent on things such as the networks impedance,
configuration, and amount of power generated by the DG. However, due to the addition of the
DG the networks total fault current will increase.
Figure 9 - Example distribution network with DG showing fault currents (Coster et al. 2011)
4.8.2 Blinding of Protection
Blinding of protection, also known as underreach, can occur when the protection relay in a
distribution network fails to trip. As shown in the example in Figure 9, a fault has occurred on a
distribution network which has DG added. Instead of the grid supplying all of the fault current the
generator will also contribute fault current and depending on the size of the DG this will cause
fault current contribution from the grid to fall. If the grid contribution falls below the level to trip
the protection relay the fault may continue undetected (Coster et al. 2011). Coster indicated that
if the distribution network, such as what was typical in The Netherlands, was of ‘sufficient
strength’ and ‘moderate length’, then blinding of protection was not likely to occur (2011).
However, many rural distribution networks in Victoria are considered weak in comparison and
their length is also much greater when compared to the Dutch network. Therefore it would be
considered prudent of the DNSP to investigate fault current requirements for any proposed
COWF and that the COWF ensures that such a study has occurred.

MIET2133 Energy Design Project II
Student: Wayne Bowers Student #: 9003094 P a g e | 35
4.8.3 Automatic Recloser Problems
Automatic reclosers have commonly been used for overhead lines in Australia and globally.
The recloser works by first detecting a fault and then de-energising the overhead line leading to
the fault. After a preset time to allow any arcing to stop at the fault location, for example, from
overhead lines that have touched in strong wind, the recloser will re-energise the line. Problems
can occur however if there is distributed generation on the overhead line where the fault has
occurred. Once the overhead line has been de-energised, the generator can keep supplying the
fault and when the recloser re-energises the line the generator could be out of phase with the
electricity network with the potential to cause significant generator plant damage (Coster et al.
2011). Therefore the National Electricity Rules (NERs) state that to prevent a distribution line
being energised from sources that are not in synchronism, check or blocking facilities must be
applied to the automatic reclose equipment (AEMC 2011). It would therefore be wise for the
potential community wind generator to confirm whether this has been taken into account with
the DNSP prior to plant commissioning.

MIET2133 Energy Design Project II
P a g e | 36 Student #: 9003094 Student: Wayne Bowers
4.8.4 False Tripping
In distribution networks where there are multiple feeders originating from a substation, there
is a possibility for false tripping to occur, also known as sympathetic tripping (Coster et al. 2011).
When a fault on an adjacent feeder to the DG occurs as shown in Figure 10, there will be an
additional fault current contribution from the DG. The additional fault current will depend on the
size of the DG, network impedance and network configuration. If the additional fault current is
large enough it can trip the relay on the same feeder as the DG before the fault has had time to
clear on the faulty feeder. Thus a healthy feeder is tripped for no reason making the feeder less
reliable and could result in repercussions for the DNSP responsible for the network. Once again it
would be prudent for the potential COWF to check that such a study has been carried out prior to
plant commissioning.
Figure 10 - Example of how False Tripping can occur (Coster et al. 2011)

MIET2133 Energy Design Project II
Student: Wayne Bowers Student #: 9003094 P a g e | 37
5 Institutional Barriers
Apart from the technical barriers discussed, there are legal, regulatory and cultural barriers
that may also hamper the progress of community wind projects. These barriers can be described
as “Institutional” barriers. An in-depth look at Market Barriers and the theory behind them is
beyond the scope of this paper, however this paper will use an adapted version of Dunstan’s
simplified classification system to provide a basis from which to discuss the institutional barriers
facing COWF projects in Victoria (Dunstan & Daly 2009). An adapted version of Dunstan’s
proposed simplified classification system for institutional barriers comprising seven types is
shown in Table 3. Although originally developed for distributed energy and energy efficiency,
these barriers can be equally applied to renewable energy generators such as COWFs.
Barrier Type Description
Information Lack of available and accurate information
Split Incentives The challenge of capturing the benefits spread across numerous
stakeholders
Payback Gap The gap in acceptable payback periods for renewable energy
Inefficient Pricing Failure to reflect costs (including environmental costs) properly in energy
prices
Regulatory The biasing of regulation against distributed generation (DG)
Cultural Values Low priority and/or opposition to energy issues (BAU)
Confusion The additional barriers created by the interaction between the six types
of barriers listed above.
Table 3 - List of Institutional barriers adapted from Dunstan & Daly (Dunstan & Daly 2009)

MIET2133 Energy Design Project II
P a g e | 38 Student #: 9003094 Student: Wayne Bowers
5.1 Information Barriers
An Information Barrier refers to a lack of available and accurate information that would have
been freely available in an ideal market. The ideal market can be described as being truly efficient
and information is both perfect and freely available (Brown 2001). However the reality is that our
markets are far from being truly efficient and thus information is usually expensive and often
difficult to obtain. In a study of the Market failures inhibiting energy efficiency measures in the
US, Brown refers to this type of barrier occurring as a result of ‘insufficient and inaccurate
information’ (2001) and notes that it is not only the energy sector that is prone to this type of
barrier. Clearly a lack of information in any endeavour is going to be a barrier and although no
information can be perfect, there should be sufficient and accurate information available to make
good decisions (Garnaut 2008).
5.1.1 Information Barriers between Stakeholders
As can be seen in Figure 11 there are a number of key stakeholders for which any community
owned wind farm (COFW) organisation will have to contend to ensure a successful outcome. The
solid arrows indicate information flows between the COWF and the other stakeholders while the
dotted arrows indicate the additional information flows that result from the flow of restricted or
proprietary information.
Community
Wind Farm
DNSPWind Turbine
Manufacturer
Third
Parties
Figure 11 - Community owned wind farm potential stakeholders

MIET2133 Energy Design Project II
Student: Wayne Bowers Student #: 9003094 P a g e | 39
For example, the DNSP will need to assess the impact of the wind turbine(s) on the network.
To do this they will require the turbine model from the wind turbine manufacturer to analyse the
impact using simulation software. This turbine model is considered strictly confidential by the
manufacturer. In turn, the DNSP may have a conflict of interest should they own or be associated
with any wind farms, therefore they may require a third party to carry out such an analysis on
behalf of both the DNSP and wind turbine manufacturer further complicating the management of
information for the COWF.
5.1.2 Information asymmetry
Garnaut notes that information asymmetry “occurs when two parties to a transaction do not
have equal access to relevant information” (2008). An example of this would be the agreement
that both the COWF and DNSP enter into in order to connect the wind farm to the distribution
network. Snow indicates that the operation of the market can be influenced by the DNSP because
the information required to facilitate a sound design for connection approval of distributed
generation is under the DNSP’s control and is often treated as confidential (2009).
Further complicating this barrier is that fact that even when the distribution network
information is provided there may be a challenge for the COWF to successfully interpret the data
as they may lack the expertise to do so (Dunstan & Daly 2009). This often requires the COWF to
contract third parties to interpret the data for them which can be time consuming and expensive
and requires the community organisation to have additional skills in managing third party
contracts.
During the Inquiry into the Approvals Process for Renewable Energy Projects in Victoria (ENRC
2009) it was noted that the DNSP’s are natural monopolies within the NEM and do create
obstacles for renewable energy projects trying to negotiate a connection to the grid. During the
inquiry the Clean Energy Council noted that there existed a perception amongst generators that
the requirements for connection of renewable energy projects where ‘excessive for purpose’.
These additional requirements were referred to by Garnaut as ‘gold plating’ (2011). Considering
that many of these observations during the inquiry came from large corporations such as AGL and
Acciona Energy which indicated that an imbalance of power existed, one can deduce that the
process is going to be even more difficult for a resource constrained COWF organisation.
MIET2133 Energy Design Project II
P a g e | 40 Student #: 9003094 Student: Wayne Bowers
5.2 Split Incentives
There exist circumstances where a course of action is obstructed between two parties
because one of the parties concludes that it is not in their best interest (Dunstan & Daly 2009). A
commonly cited example of such a barrier is the circumstances which exist between a landlord
and tenant while the course of action involves upgrading the energy efficiency of the rental
property. There will typically be no incentive for a landlord to make the upgrade if there is little
ability for the landlord to charge a higher rent while all the benefits are obtained by the tenant
through lower energy bills.
A similar situation can occur between a DNSP and a distributed generator. A DNSP will need
to allocate resources for both accessing an application to connect a COWF, and if approved,
provide further resources to establish the physical network connection. Although the DNSP will
be able to incorporate charges into the connection fee to cover this work there is no incentive for
the DNSP to provide the resources when there is no advantage for them to do so. Furthermore,
as most companies run learn businesses these resources can be considered as scarce resources
which could be more efficiently allocated to network augmentation issues, for example, as these
can have a direct impact on the DNSPs income.
5.2.1 Principle-agent problem
A variation of the split incentive is called the principle-agent problem. This occurs when an
agent, acting on behalf of a client, does not take into consideration the client’s best interest
(Dunstan & Daly 2009). An example would be the financial investment industry where agents
have been found to be selling products to clients that gave the agent better commissions while
not necessary giving the client the best return on investment. This could occur between the
COWF, the client, and third party contractors, the agents. The selection of turbine technology,
switch gear, voltage compensation equipment, line upgrades are examples where complex
decisions are usually made, at least in part, on behalf of the COWF as the agent is considered the
expert.

MIET2133 Energy Design Project II
Student: Wayne Bowers Student #: 9003094 P a g e | 41
5.3 Payback Gaps
The payback gap refers to the acceptable payback and/or rate of return for community
owned wind farms (COWFs) verses commercial wind farms and the associated impact on any debt
financing that may be required. There are two issues of concern regarding payback gaps for
COWFs. They are:
1. Establishment of a viable income stream to support debt financing,
2. Rate of return to investors of the wind farm
5.3.1 Establishment of a viable income stream
The establishment of a viable income stream begins with building a case for the wind
resource itself and concludes with a decision on a method for the sale of the generated
electricity, both to ensure that a sufficiently strong business case is built in order to obtain loans
and investor financing.
Site Evaluation and Feasibility Study
Substantial Wind resource evaluation is needed for any wind farm project in order to
establish a viable business case. This normally includes hiring a third party, someone with proven
knowledge in the area of wind resource evaluation, to carry out site measurements over a
minimum period of time. This will prove the first of many barriers for the COWF to overcome as it
requires a significant upfront cost, in the tens of thousands, and will provide the key data as to
whether the project is viable or not.
Sale of Electricity
As is typical for many renewable energy generation projects, COWFs will have higher capital
costs but lower ongoing or operating costs as no fuel purchases are required (Dunstan & Daly
2009). Hence a potential barrier for COWFs and distributed generation in general, is a potential
inability for these projects to access finance to cover the higher up-front capital costs.

MIET2133 Energy Design Project II
P a g e | 42 Student #: 9003094 Student: Wayne Bowers
There are three ways in which a COWF is likely to sell their generated electricity in Victoria.
First, through a power purchase agreement (PPA) where a contract is established with an
electricity retailer for the purchase of all electricity generated for a set period of time. In addition
this may include purchasing RECs generated by the COWF. The second method is to establish an
off-take agreement with a retailer where the retailer agrees to purchase all the electricity
generated based on the spot market price. Third, the wind farm can elect to sell its electricity via
the NEM which is managed by the Australian Energy Market Operator (AEMO). The market works
in the following way (AEMO 2011a):
AEMO calculates the financial liability of all market participants on a daily basis and settles
transactions for all trade in the NEM weekly. This involves AEMO collecting all money due for
electricity purchased from the pool from market customers, and paying generators for the
electricity they have produced.
As the option to sell electricity via the NEM is inherently risky and does not provide a
guaranteed income stream on which to build a business case in order to obtain financing.
Therefore most COWF organisations would consider a PPA as a first option. However the PPA is
arguably the most difficult business agreement for a community wind development to deal with
because they have no leverage with the electricity retailers, many of which are also generators
themselves. As a typical PPA covers a period of one to three years it effectively makes the
business case just as difficult to build as trading on the NEM. At the time of writing Hepburn Wind
had negotiated an off-take agreement with Red Energy Pty Ltd (Holmes à Court 2011). The report
for the Southern Councils Group (Wijngaart, Pemberton & Herring 2009), reported that:
...some utilities are trading on this control and acting as cartels in the energy market by buying
wind farms and giving only themselves 10 year PPAs (they are referred to as ‘gen-tailers’). While
this could be regarded as restrictive trade practice, State Governments have not acted on this
strong discouragement to renewable energy diversification.

MIET2133 Energy Design Project II
Student: Wayne Bowers Student #: 9003094 P a g e | 43
5.3.2 Rate of Return
Due to a number of issues such as reduced economies of scale and connection costs, the rate
of return will potentially be lower than what may be demanded in some business sectors. For
example, many industries look for relatively short payback periods of only a few years to recover
their initial investment. The Stern Review noted that this can imply an average discount rate of
30% or more (2006, cited in Dunstan & Daly 2009, p. 26). This is clearly an unrealistic situation for
a COWF as the initial capital costs would make such a return impossible. Further impacting the
rate of return is the amount of debt financing sort by the COWF. If the debt is too high the wind
farm could run at a loss or be forced to pay very low rates of return during the early years of
operation. Getting this balance right will require extensive work by the COWF and the financial
bodies it engages.
5.4 Inefficient Pricing (mispricing)
Inefficient pricing is concerned with the failure to properly reflect the full cost of energy
production in the electricity price structure. This is primarily concerned with the unpriced
external costs often associated with social and environmental impacts of energy production,
known as externalities.
5.4.1 Externalities
Unpriced external costs are the result of producing a good or service but are not included in
the final price of that good or service (Dunstan & Daly 2009). For example, electricity is produced
and priced based on the cost of production and transmission but does not include any price for
the pollution that is released as a result. The most obvious external cost results from both the
health and climate impacts of this pollution. In Victoria the electricity sector produces over 50%
of the states net GHG emissions (CES 2006). The burning of coal has been cited as one of the
leading causes of smog, acid rain, global warming, and other airborne toxic substances (UCS
2010). A carbon tax is a method to include the external costs associated with GHG pollution into
the cost of producing a good or service, thus reducing the inefficient pricing barrier facing
renewable energy generators.

MIET2133 Energy Design Project II
P a g e | 44 Student #: 9003094 Student: Wayne Bowers
5.5 Regulatory Barriers
Regulatory barriers refer to the biasing of regulation against distributed energy resources such as
wind farms.
5.5.1 Lack of Feed-in-Tariff (FiT)
A feed-in tariff (FiT) is a price paid to generators of renewable energy for a guaranteed period
of time for electricity fed into the grid (Couture & Gagnon 2010; Prest 2008). FiTs have become
increasingly popular in the past couple of decades by encouraging investment, stimulating rapid
development, and creating a more diverse range of clean electricity options (Prest 2008). There
are now more than 64 jurisdictions worldwide implementing FiT laws (Klein et al.; Ernst and
Young; Mendonça; IEA; European Commission; REN21, cited in Couture & Gagnon 2010).
Although it can be argued that there is the beginning of a widespread public acceptance that
we need to reduce our GHG emissions, there have been no signals from government in Australia
to stimulate medium-scale distributed generation. The federal government has had some limited
success in stimulating large-scale technology, specifically large-scale wind, through the MRET
scheme. At the state level, the Victorian government has had recent success in targeting small-
scale solar PV and had past success through a scheme established during the 1980’s by the SECV
to promote medium-scale co-generation technologies (Snow 2009). Advocates for FiTs as a
regulatory signal argue that experience, particularly in other countries, including community
owned generation in Denmark and Germany, has shown that they are a better way of stimulating
growth in the renewable energy sector than other methods such as quota systems similar to
Australia’s MRET scheme (Meyer, 2003 cited Walker 2008).

MIET2133 Energy Design Project II
Student: Wayne Bowers Student #: 9003094 P a g e | 45
5.6 Cultural Values
Cultural values refer to the barriers that exist due to society’s expectations and norms. These
values have resulted in both a low priority for and opposition to wind technology.
5.6.1 Opposition and Scepticism of Wind Technology
When working with a geographically local community, there are essentially two key groups
that are likely to oppose a wind development. First, the citizens who have a long-term
relationship with the area, this type of relationship is often described as “place identity” (Pearce
2008). The second group are the lifestyle-changers or “blow-ins” as described by Pearce. Involving
these groups in the planning and sitting can help to reduce opposition, however the people that
oppose such a development because they are ingrained sceptics of wind technology (typically
believe that the technology is flawed) will not be swayed by involvement with the local
community.
Hepburn Wind encountered such a group when their planning permit was challenged
through the Victorian Civil and Administrative Tribunal (VCAT) (Pearce 2008). The group that
launched the action was the Daylesford and District Landscape Guardians. At the time of the
VCAT challenge the rules stated that any individual could take an appeal to VCAT with an appeal
cost of $300. The VCAT process can be costly and time consuming for the COWF organisation.
Although Hepburn Wind won the appeal the decision handed down resulted in additional
obligations being placed on the wind farm. These included an extensive Landscaping and Visual
Screening Plan which added extra on-going costs throughout the life of the wind farm project
(Holmes à Court 2011; VCAT 2007).
Furthermore, the VCAT decision removed the ability of the wind farm to micro-site the
turbines, a process that utilises fluid dynamics and other methods to fine tune the position of the
turbines to minimise turbulent effects from nearby objects and maximise power generation. The
ruling stated that “No turbine shall be closer to the closest wall of any existing residence” and as
residents where located effectively on all sides of the wind farm there was no possibility to adjust
the tower locations without moving slightly closer to a residence (Holmes à Court 2011; VCAT
2007).

MIET2133 Energy Design Project II
P a g e | 46 Student #: 9003094 Student: Wayne Bowers
5.6.2 Business Culture
It may be assumed that a responsible DNSP would operate their business to account for
future changes in the market and embrace distributed generation, especially considering the
government’s announcement of a carbon price and the benefits that can be obtained from some
distributed generation in terms of demand management. However, a business’s main priority is to
maximise profits within the bounds of the current market regulations. Therefore any risk imposed
on that business will influence the business culture and can result in poor responses and low
priority given to renewable generation wishing to connect to the network. This is further
complicated by the 5 year price reset that focuses the DNSP business on the next five year period
and associated network augmentation.

MIET2133 Energy Design Project II
Student: Wayne Bowers Student #: 9003094 P a g e | 47
5.7 Confusion
Obviously the above mentioned barriers don’t exist in isolation, in reality there can be many
interactions between each barrier with some interactions being quite complex in nature. A few
examples will be presented of the types of interactions that can take place between barriers
resulting in further confusion.
5.7.1 Interaction between split incentives and information asymmetry
One of the split incentives previously noted was that of the landlord and tenant problem,
meaning there was little incentive for the DNSP to cooperate with distributed generators. A
further complication of this problem may occur due to the interaction with information
asymmetry. This may result in the distributed generators being lumped with the costs associated
with distribution network upgrades regardless of whether the upgrade was required due to the
addition of generation or not. As noted in section 5.1.2, the DNSP often considers network
information confidential, hence it may be difficult to prove whether the distributed generator is
paying an excessive amount or not to connect their generation assets.

MIET2133 Energy Design Project II
P a g e | 48 Student #: 9003094 Student: Wayne Bowers
5.7.2 Connection Approval Process
There is little incentive for the DNSP to cooperate with distributed generators in a timely
fashion beyond the specified regulatory requirements in regard to the connection process. This is
due to a combination of barriers including information asymmetry, split incentives, and business
culture. This may result in the COWF being forced to endure unnecessarily long delays between
the initial application for connection of generator assets and the offer to connect being made by
the DNSP. The National Electricity Rules (NERs) specify that the DNSP must use its “reasonable
endeavours” when making an offer to connect, and although the rules specify time frames for
responding to connection enquiries and initial responses to the application for connection there is
no maximum time frame specified for the DNSP to respond with an offer to connect (AEMC
2011).
Several companies have indicated during a recent inquiry that the connection process is
complex, costly and leads to time frames that are excessive (ENRC 2009). Hepburn Wind has
experienced similar approval delays with the process from start to finish taking over 3 years
(Holmes à Court 2011). A similar situation has been reported for the connection of cogeneration
plants within the city of Melbourne, with the approval process taking over 18 months (Snow
2009).

MIET2133 Energy Design Project II
Student: Wayne Bowers Student #: 9003094 P a g e | 49
6 Recommendations to support Community Owned Wind Farms
Having examined both the Technical and Institutional barriers faced by community owned
wind farms (COWFs), the following section will detail proposed recommendations to reduce or
eliminate the impact of these barriers. The recommendations are divided into two groups,
regulatory and non-regulatory based support mechanisms. Regulatory based support
mechanisms are those which require state, federal or an industry regulatory body to implement,
these are summarised in Table 4. Non-regulatory based support mechanisms are those that can
be implemented directly, and are summarised in Table 5. Both groups of recommendations are
discussed in further detail below.
Recommendation Barrier type Description of recommendation
Establish a FiT Regulatory Establish a FiT to provide a pricing signal in order to promote renewable energy generation.
Incentivise DNSPs Information
Split incentives
Regulatory
Cultural Values
Technical
Provide an incentive program for DNSPs to connect renewable energy generators.
Connection priority Confusion Establish time limits for DNSPs to both respond to a connection application and provide the final connection approval.
Carbon Price Inefficient Pricing Implement a price on carbon in order to level the playing field between polluting industries and renewable energy.
Establishment fund Payback gap
Regulatory
Provide a fund that can be used to help finance prospective community energy projects.
Table 4- Summary of regulatory based support mechanisms.
Recommendation Barrier type Description of recommendation
Support Groups Information Join, share and talk with like minded groups and organisations.
Community focused financial institutions
Information
Payback gap
Form a relationship with a financial institution such as Bendigo Bank who has community-owned business experience.
Ethical Investors Payback gap Target ethical investors which are more willing to accept a lower rate-of-return if there are social and environmental benefits.
Ethical Business Culture
Cultural Values Encouraging DNSP’s to partner with community owned wind farms (COWFs) in order to promote an ethical business culture.
Understand Connection Risks
Technical Obtain as much technical knowledge as possible to reduce project and financial risks during connection and operation of the wind farm.
Table 5- Summary of non-regulatory based support mechanisms.

MIET2133 Energy Design Project II
P a g e | 50 Student #: 9003094 Student: Wayne Bowers
6.1 Regulatory Based Support Mechanisms
Regulatory based recommendations are those which require regulatory changes or
government intervention to implement. This means that the COWF has little control or influence
over these mechanisms other than to provide support and lobby the government for action in
these areas. It should be noted that for these recommendations to be implemented it will involve
coordination and cooperation between both the state and federal governments, the Australian
Energy Market Operator (AEMO) and the Australian Energy Regulator (AER).
6.1.1 Establish a FiT
On assessing FiT policy implementation in jurisdictions in Australia and overseas, we find that
they all use ‘legislation and regulation’ as the primary policy instrument (Prest 2008). As noted by
Howlett, Ramesh & Solomon, regulations often govern such things such as the price and
standards of consumer goods and services, energy prices, as well as the quality of our water and
air (2003). Hence legislation is necessary as the existing electricity industry to which a FiT
regulation would apply, is a regulated service and energy industry (AEMO 2010; ESC 2010b). The
target groups for compliance under a FiT Act are:
Distribution Network Service Providers (DNSPs)
Electricity retailers
Renewable electricity generators
One benefit of regulation is that it can be less costly to implement when compared to other
instruments such as taxes or subsidies (Howlett, Ramesh & Solomon 2003). Excluding the costs
associated with drafting the legislation and putting it into law, the FiT costs are entirely met by
the electricity consumers within the state of Victoria as occurs with the Standard & Premium FiT
legislation (DPI 2009). Apart from on-going funding for the Essential Services Commission (ESC),
the cost to ensure compliance with the regulation is very low. Another advantage of regulation
over other instruments is its predictability and in particular it is well suited to cases where action
is needed to be seen to be done in relation to an urgent matter such as climate change (Howlett,
Ramesh & Solomon 2003).
MIET2133 Energy Design Project II
Student: Wayne Bowers Student #: 9003094 P a g e | 51
A feed-in tariff (FiT) is essentially a ‘pricing law’ established by government legislation to
ensure that Renewable Energy (RE) producers are paid an equitable tariff for the electricity they
generate. A FiT can be differentiated by technology and size of installation (i.e. in terms of power
output). In addition it would be recommended that the proposed FiT is restricted to COWFs of
medium size, say 100kW to 20MW nameplate capacity.
The cost of a FiT has typically been passed onto the residential consumer base in Australia.
There are issues surrounding the equity of passing on the cost to consumers which may be
unfairly affected and unable to pay. However, the proposed FiT scheme will be kept modest in
order to reduce such impacts.
Design
A review of the literature reveals that there are two primary types of FiT deployed globally
(Couture & Gagnon 2010; Mendonca 2009). Those types are the market-independent and
market-dependent FiT models, see Appendix C – FiT Models for further details. As the name of
the models suggests, the FiT scheme is either linked with the electricity market wholesale price or
not. Initially FiT models were predominantly market-dependent, however there proved to be
problems associated with this model that has resulted in the market-independent model
becoming dominant.
For example, Germany initially implemented a market-dependent FiT which provided a tariff
rate in proportion to the wholesale electricity price. The idea was that as the price for electricity
went up the tariff rate paid to renewable energy generators would be reduced. However the
scheme did not anticipate a drop in the electricity price and was not designed to increase the
tariff sufficiently to compensate generators below a particular electricity price threshold. The
price dropped below the threshold and resulted in renewable generators being under
compensated by the scheme. The German scheme was later changed to the highly successful
market-independent model whereby the FiT rate was set independently of the wholesale price of
electricity allowing the scheme to be decoupled from potential market volatilities (Couture &
Gagnon 2010).

MIET2133 Energy Design Project II
P a g e | 52 Student #: 9003094 Student: Wayne Bowers
This recommendation comprises a modest FiT for COWFs based on a market-independent FiT
model. This model type is arguably the most successful model deployed worldwide for increasing
the amount of electricity generated from renewable energy sources (Couture & Gagnon 2010;
Mendonca 2009). The key advantage of the market-independent model is the greater stability of
revenue it provides resulting in greater investment security, potentially lower cost of financing,
and a reduction in the coupling of revenue with market volatilities (Couture & Gagnon 2010).
There are many ways in which a market-independent FiT model can be deployed. This paper
proposes a simple fixed tariff that is paid per MWh generated for a period of 10 years. It is
combined with a regression rate that reduces the fixed tariff amount based on the year that a
wind farm joins the FiT scheme. For example, if joining the scheme in year 1 then the full tariff
amount will be paid for a 10 year period. If joining the scheme in year 5, a reduced tariff rate,
although still fixed, will be paid for a 10 year period. This ensures that early adopters will be
better compensated based on their higher risk profiles and the current low electricity prices. The
tariff is paid in addition to the wholesale price that the COWF can receive from the market and
the revenue from the sale of RECs, hence its independence.
Setting the Tariff rate
A key component of any FiT scheme is setting the tariff rate so that there is a clear pricing
signal to encourage COWFs without over or under compensation occurring. Simon Holmes à
Court, the chairman of Hepburn Wind, indicated during discussions that a long term income of at
least $120 per MWh was required for a sustainable community wind sector (2011, pers. comm.,
20 May). Financial modelling by the author based on an estimated 25 year life for an equivalent
COWF to that of Hepburn Wind with an income of $80/MWh indicates that investor returns of
approximately 2.9% can be expected along with a net loss during the first 8 years of operation.
Further modelling was carried out for income levels of $100, $115, $120 and $140 per MWh and
the results are presented in Table 6.

MIET2133 Energy Design Project II
Student: Wayne Bowers Student #: 9003094 P a g e | 53
Income per MWh Rate of Return Net Profit or Loss
$80 2.9% Net Loss of first 8 years
$100 5.9% Net Loss for first year
$120 8.9% Net Profit each year
$140 11.9% Net Profit each year
$115* 8.2% Net Loss for first 3 years
*Modelling of REC & Electricity pricing provided by Hepburn Wind based on 5% CPRS (Holmes à Court 2010)
Table 6 - Modelling results for a COWF with varying income levels (in 2010 AUS dollars)
It was concluded from these results that $120 per MWh would be the target income level for
the proposed FiT scheme to ensure an adequate pricing signal without overcompensating. This
compares with other accounts in the industry that state that for large-scale wind to be
sustainable in Australia an income of $120 per MWh is required (EMN 2009). The current income
per MWh based on the wholesale electricity price plus the sale price of RECs is approximately $75
at the time of writing (AEMO 2011b; GET 2010), see both Table 7 and Figure 12. This is
considerably short of $120 per MWh which is making it very difficult for large-scale wind farms let
alone community based projects.
Year Average Victorian Electricity Price ($/MWh)
2010 $34.73
Table 7 - Average Annual Wholesale Electricity Prices (AEMO 2011b)
Figure 12 - LGC Spot price from May 2010 to May 2011 (NextGen 2011)
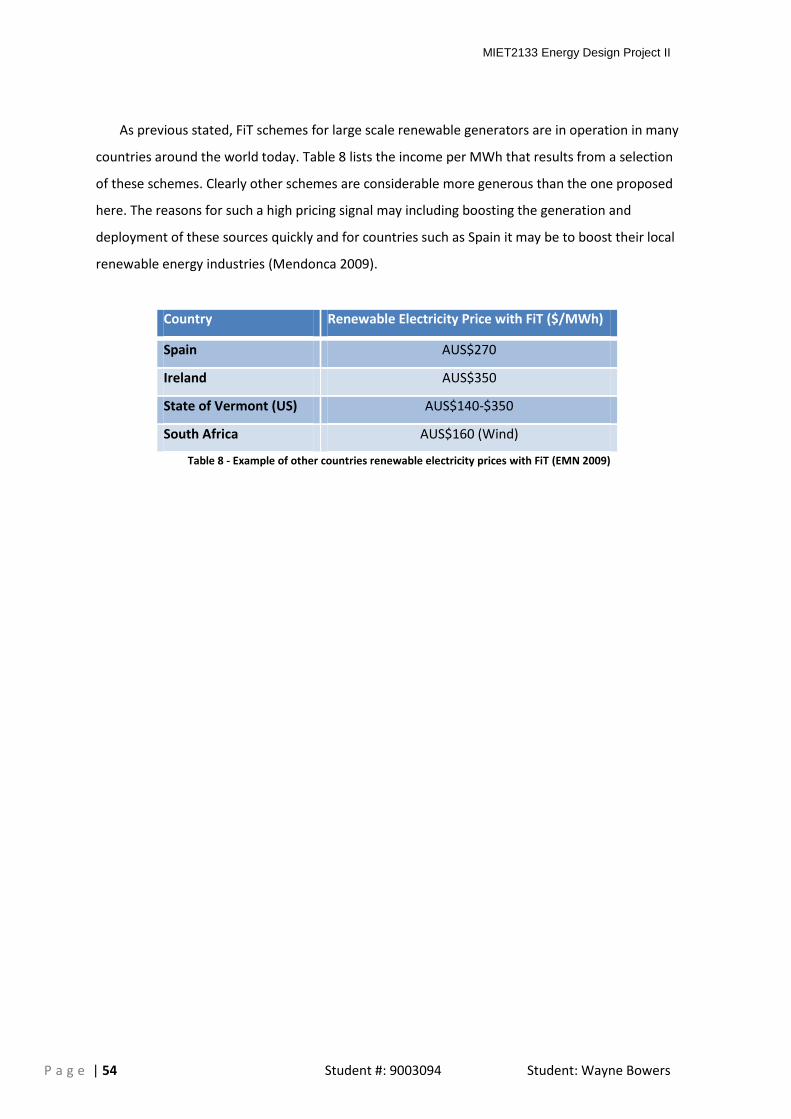
MIET2133 Energy Design Project II
P a g e | 54 Student #: 9003094 Student: Wayne Bowers
As previous stated, FiT schemes for large scale renewable generators are in operation in many
countries around the world today. Table 8 lists the income per MWh that results from a selection
of these schemes. Clearly other schemes are considerable more generous than the one proposed
here. The reasons for such a high pricing signal may including boosting the generation and
deployment of these sources quickly and for countries such as Spain it may be to boost their local
renewable energy industries (Mendonca 2009).
Country Renewable Electricity Price with FiT ($/MWh)
Spain AUS$270
Ireland AUS$350
State of Vermont (US) AUS$140-$350
South Africa AUS$160 (Wind)
Table 8 - Example of other countries renewable electricity prices with FiT (EMN 2009)

MIET2133 Energy Design Project II
Student: Wayne Bowers Student #: 9003094 P a g e | 55
Operation
FiTs are typically longer term support mechanisms that are reduced slowly over time to
prevent potential boom and bust cycles (Mendonca 2009). However, modelling provided by
Hepburn Wind suggests that Australian electricity prices within the NEM will rise quite
considerably in the short to medium term, therefore the proposed FiT scheme would only need to
run for a period of 10 years instead of say 15 or 20 (Holmes à Court [Hepburn Wind], 2010, pers.
comm., 20 May). It is also assumed that a price will be placed on carbon by the federal
government within this period. It is expected that turbine costs will decrease over the next 10
years, particularly with the increased competition from turbine manufacturers in China and India.
The FiT scheme will include a degression rate that will be applied to the tariff each year of the
scheme, see Table 10. The key scheme parameters are given in Table 9. A COWF that joins the
scheme in year 1 will receive a tariff of $30 per MWh for a period of 10 years, while a COWF that
joins the scheme in the final year will receive a tariff of $3 per MWh for a period of 10 years. The
scheme would only be in effect in Victoria and would be limited to 250MW of installed capacity, if
this capacity is reach before the end date of the scheme the scheme would be stopped early.
Modelling by the author was then conducted based on these parameters and limits.
Scheme Parameter Value Description
Life of FiT Scheme 10 years Period in which a community owned wind farm can join the scheme
Period Tariff is payable 10 years The period the tariff is paid after joining the scheme
Active Period of Scheme 20 years This is the total period in which the FiT scheme is active
Degression rate 10% Rate at which the FiT is reduced each year of the scheme
Tariff $30/MWh Tariff paid in the first year of the scheme
Table 9 - Proposed FiT scheme key parameters
Year Wind Farm starts operation (joins scheme)
Scheme Year
1 2 3 4 5 6 7 8 9 10
Tariff Rate $30 $27 $24 $21 $18 $15 $12 $9 $6 $3
Table 10 - Tariff rates based on year in which wind farm joins FiT scheme

MIET2133 Energy Design Project II
P a g e | 56 Student #: 9003094 Student: Wayne Bowers
Summary
Modelling conducted by the author indicates that the proposed FiT scheme would have a very
modest impact on domestic households with an average increase in yearly bills of just over half a
percent between years seven and eleven, see Figure 13. This is based on the average Victorian
household electricity use of 5.84MWh per year. As of 2010 there were 2,272,082 residential
electricity customers in Victoria (ESC 2010a).
0.00%
0.10%
0.20%
0.30%
0.40%
0.50%
0.60%
0.70%
$0.00
$1.00
$2.00
$3.00
$4.00
$5.00
$6.00
$7.00
$8.00
$9.00
0 5 10 15 20 25 30
Household Costs (per Year)
Cost Per Household ($)
Electricity Bill Increase (%)
Figure 13 - FiT effect of Residential Electricity Bill per annum
Modelling indicates that a wind farm that joins the scheme in year 1 should not make any net
losses and will be able to provide an average rate of return of approximately 10%. The full list of
results is given in Table 11.
Year Joined Rate of Return Net Profit or Loss
1 10.0% Net Profit each year
2 10.1% Net Profit each year
5 10.0% Net Profit each year
10 9.2% Net Profit each year
Table 11 - List of results for Wind Farm versus year of joining FiT scheme

MIET2133 Energy Design Project II
Student: Wayne Bowers Student #: 9003094 P a g e | 57
It should be noted that during the early years of establishing a community wind sector the
associated costs for the wind farm such as connection costs and third party consultation will be
higher. However, these costs are expected to decrease as the information barriers are reduced by
some of the non-regulatory based recommendations. Hence in Figure 14 it can be seen that the
FiT results in higher income for wind farms that join the scheme in the first year while at the same
time these wind farms have to contend with substantially lower REC and Electricity prices during
this period. Therefore it can be concluded that the introduction of the FiT as presented here will
not only provide a modest scheme but will be able to provide the financial stability to drive the
community wind sector without over compensation occurring.
$40
$60
$80
$100
$120
$140
$160
1 2 3 4 5 6 7 8 9 10 11 12 13 14 15 16 17 18 19 20 21 22 23 24 25
Inco
me
($/M
Wh
)
Year of Scheme
Yearly Income per MWh inc FiT
Commenced Year 1 Commenced Year 2 Commenced Year 5
Commenced Year 10 Combined REC & Elect.
Figure 14 - Effect of FiT on yearly income versus combined REC & electricity price

MIET2133 Energy Design Project II
P a g e | 58 Student #: 9003094 Student: Wayne Bowers
6.1.2 Levelised Cost
Having modelled the financial outcome for a community owned wind farm (COWF) including
the FiT it may be convenient to compare the costs associated with this type of electricity
generation to other forms. As part of the financial analysis of a medium-scale COWF based on the
Hepburn Wind farm, the levelised cost of the electricity generated by the wind farm was
calculated to be $105 per MWh using a discount rate of 5%. This compares favourably to small-
scale PV with a range of $150 to $200 per MWh and CSP using parabolic troughs at $120 to $150
per MWh (ABARE 2007). Commercial scale on-shore wind in the US in 2009 US$ has been
calculated at $97/MWh with a discount rate of 7.4%, see Table 12 (EIA 2011). Due to the variation
of the Australian dollar with the US dollar it is difficult to do a direct comparison, however if a
comparison of a range from US$1-US$0.8 to one Australian dollar is used then the levelised cost
for on-shore wind in the US is in the range of AUS$97 to AUS$121. This compares very favourably
with the levelised cost calculated for the modelled community based wind farm at $120/MWh
with a discount rate of 7.5%, see Figure 15.
$105
$120
$143
Levelised Cost
Levelised Cost of Electricity for a Community Wind Farm
5%
7.50%
10%
Discount Rates
Figure 15 - Levelised cost of generating electricity from a COWF
It should be noted that the levelised cost calculated for the COWF includes the connection
and network upgrades required to connect the wind farm to the electricity grid. This is why we
can do a comparison with the US figures given in Table 12 as these also include connection and
network costs, labelled transmission investment. However many studies provide levelised costs
and do not include the connection costs and thus give much lower levelised costs than provided
here.

MIET2133 Energy Design Project II
Student: Wayne Bowers Student #: 9003094 P a g e | 59
Table 12 - US average Levelised Costs for plants entering service in 2016 (in 2009 US$/MWh, 7.4% discount rate)
(EIA 2011).

MIET2133 Energy Design Project II
P a g e | 60 Student #: 9003094 Student: Wayne Bowers
6.1.3 Incentivise DNSPs
To remove the confusion surrounding the connection process for renewable energy
generators and to demonstrate that regulators are serious about increasing generation from
renewable sources a program needs to be established to provide DNSPs with an incentive to
connect generators. A similar program already exists for providing DNSPs with an incentive for
demand management called the Demand Management Incentive Scheme (DMIS). The DMIS
program was established in Victoria by the Essential Services Commission Victoria (ESCV),
regulation of which has since transferred to the Australian Energy Regulator (AER). This program
provides a DNSP with an allowance of up to $600,000 to undertake approved demand
management projects. However, these programs can be difficult to implement and regulate
effectively.
The Victorian demand management program can be considered ineffective due to the failure
of the program to facilitate demand management projects (Dunstan, Abeysuriya & Shirley 2008).
In a 2008 survey questioning DNSPs about the DMIS program offered in Victoria, all five DNSPs
indicated that they had no active programs in place and make very little investment in demand
management (Dunstan, Abeysuriya & Shirley 2008). Therefore an education program needs to be
considered in parallel with such a scheme to inform not just the DNSPs but more importantly to
notify renewable energy projects to ensure they lobby the DNSPs to take advantage of the
incentives on offer.

MIET2133 Energy Design Project II
Student: Wayne Bowers Student #: 9003094 P a g e | 61
6.1.4 Connection Priority
Currently the excessive time period from a wind farm submitting a connection application
until the final connection approval is obtained is unsatisfactory. Therefore it is recommended that
the National Electricity Rules (NERs) be altered to define a regulated time period for responding
with a connection approval for all distributed generators (DGs). In addition to the regulated time
period the alteration should also include a provision that ensures that a reasonable priority level
is given to the connection of DG. Further, the Australia Electricity Regulatory (AER) should request
the DNSPs provide information regarding their connection approval times in their yearly updates
and include the approval times within the GSL component of the Service Target Performance
Incentive Scheme (STPIS) (AER 2010). The GSL component of this scheme sets service level
thresholds for the DNSP to achieve and when customers experience levels below these thresholds
the DNSP is required to make direct payments to the customers affected.
6.1.5 Establish a carbon price
Establishing a price on carbon can take many forms, however, the primary object is to ensure
that an appropriate price is applied to externalities and is included in such services as electricity
produced from fossil fuels. This ensures that renewable energy generation can compete on a
more level field with highly polluting industries that have traditionally not had to account for the
cost of their pollution and emissions. Recently the federal government proposed a carbon tax to
begin from July 2012 followed by a carbon trading scheme in 2015-16 (Maher & Shanahan 2011).

MIET2133 Energy Design Project II
P a g e | 62 Student #: 9003094 Student: Wayne Bowers
6.1.6 Establishment Fund
Wind resource evaluation of the proposed site for a community owned wind farm (COWF) is
the single most important step as it provides the likely feasibility of the project and allows for
financial and project planning to continue. However this information is required prior to the
establishment of the formal community wind organisation at a time when there is typically no
financing available. The wind resource study requires significant upfront expenditure, potentially
in the tens of thousands of dollars. One potential COWFs in Victoria, Westgate Wind, was
fortunate to have the feasibility study initiated and paid for by the Maribyrnong City Council
(Mountjoy 2010). For Hepburn Wind, Australia’s first community owned wind farm (COWF), a
partnership was established with Future Energy, a wind farm consultancy. Future Energy then
provided the very early funding but also helped prepare and co-ordinate the preliminary site
investigations. This left Hepburn with an outstanding future debt while Future Energy bore the
early project risks. Simon Holmes à Court, the chairman of Hepburn Wind, indicated there needs
to be a way to support the start up costs as this is the largest hurdle in successfully launching a
COWF (2010, pers. comm., 22 December).
This recommendation proposes that a fund be established by the Victorian Government to
provide an interest free loan to potential community wind projects. The loan would then be
repaid when the wind farm becomes operational. For example, it could be set up in a similar
fashion to the Renewable Energy Support Fund that was operated by Sustainability Victoria,
although this fund was not a loan and thus was not expected to be repaid (Membership and Share
Offer 2010). Obviously there would be some risk involved that the government would have to
bare in this case as some funds may not be repaid if the feasibility study or other issues result in
the wind farm not being established. Hence there would need to be reasonable oversight and
program management, perhaps shared with relevant community organisations such as Embark.

MIET2133 Energy Design Project II
Student: Wayne Bowers Student #: 9003094 P a g e | 63
6.2 Non-regulatory Based Support Mechanisms
As previously discussed, non-regulatory recommendations are those which do not require
regulatory changes or government intervention to implement and can usually be implemented
directly by the community owned wind farm (COWF).
6.2.1 Support Groups
There are several ways in which information barriers can be reduced, one of the primary ways
is through information exchange. Some community organisations in the UK where shown to be
more successful than others in the field of renewable energy (Walker 2008). The successful
projects where shown to have either ‘key committed individuals or entrepreneurs’ or a
‘supportive local institution’ (Walker et al., 2007 cited in Walker 2008, p. 4403). Examples where
provided from the UK community energy sector showing that a ‘supportive local institution’ can
help by providing the distinctive expertise that is not normally readily available to a community
group (Walker 2008). An example of this type of organisation in Australia is Embark, a not-for-
profit organisation established in Melbourne, Victoria to aid community groups that are seeking
to establish a community owned renewable energy project (Embark 2011).
Walker extends his argument about ‘supportive local institutions’ by indicating that there is
now evidence for a ‘process of replication’ whereby organisations such as Embark and a similar
entity in the UK called Energy4All, see Figure 16, allow successful community ownership models
to be easily reproduced. Thus this can save a new community organisation the time and expense
of obtaining information by adopting successful models from others.

MIET2133 Energy Design Project II
P a g e | 64 Student #: 9003094 Student: Wayne Bowers
Figure 16 - Description of the not-for-profit group Energy4All
6.2.2 Community focused financial institutions
This recommendation is similar to the first and is based on the concept that one of the best
ways to overcome information barriers is through information exchange. By seeking out and
establishing a partnership with a financial institution with a community focus, information and
support can be obtained. The Bendigo Bank is an example of a financial institution that can
provide a financial model for the establishment of a community owned wind farm based on a co-
operative business model. Bendigo Bank utilises pledge drives as part of the pre-feasibility study
for the establishment of community owned Bendigo Bank branches (InfoChoice 2011). Hepburn
Wind used the pledge model as part of their pre-feasibility study and later formed a partnership
with Bendigo Bank to finance a portion of the wind farm (Membership and Share Offer 2010).
The pledge drive asks local community members to indicate via a non-binding response if they are
willing to become members by investing in the co-operative. This allows a community group to
gauge the interest in establishing a community owned co-operative business, for more
information on co-operatives see Appendix A – What is a community owned wind farm?
Energy4All
Energy4all is a community wind farm project management not-for-profit company owned by
the wind farm cooperatives it supports. It builds and manages the wind farms on the behalf of the
cooperatives.
One-stop shop for any community group
One entity for the electricity network/retailers to deal with as opposed to each
individual community wind farm.
Pay an annual fee for the services provided
The UK is one of the countries hardest hit by Landscape issues. Not-for-profit groups like
Energy4all are changing this by engaging directly with the local community.

MIET2133 Energy Design Project II
Student: Wayne Bowers Student #: 9003094 P a g e | 65
A community wind development may choose to sell their electricity via a power purchase
agreement (PPA). As discussed in section 5.3.1, the PPA is arguably the most difficult business
component for a community wind development to manage because they have no leverage with
the electricity retailers. A report for the Southern Councils Group discusses a solution as proposed
by the Bendigo Bank (Wijngaart, Pemberton & Herring 2009). The Bank had stated that from their
experience electricity retailers are more willing to deal with a Bank especially if they are a holder
of a portfolio of power products within that market space. This allows a separation between the
retailer and the customer with the bank providing a brokerage role for the COWF, thus helping to
overcome information and payback gap barriers.
6.2.3 Target Ethical Investors
By targeting ethical investors, community owned wind farms (COWFs) can gain significant
equity in place of finance to establish the wind farm. Ethical investors are typically more
comfortable with lower rates of return verses other investors. Although market expectations for a
high rate of return may turn some potential investors away from a COWF, the return potential
needs to be viewed within the context of typical investments versus ethical investments. The
reality for private investors is that they often receive the equivalent rate of return of that from a
money market fund or superannuation, not double digit rates of return as demanded in the
commercial sector. APRA released figures showing that the average rate of return for large
superannuation funds in the ten years to 30 June 2010 was 3.3% per annum (APRA 2011). As
demonstrated by Hepburn wind and the financial study carried out as part of this project, see
Table 6, the rate of return for a COWF can be expected to be in the order of 6-12% per annum
(Membership and Share Offer 2010). This is significantly better than the current performance of
Australian superannuation funds. Furthermore, it has been shown that some private investors are
willing to accept a return that will be below the commercial rate because they are supporting an
ethical cause they believe in (Bolinger, M 2001).

MIET2133 Energy Design Project II
P a g e | 66 Student #: 9003094 Student: Wayne Bowers
6.2.4 Ethical Business Culture
There is also the opportunity for the DNSP to actively partner with community owned wind
farm (COWF) organisations. With the outcome of the Bush Fire royal commission and inquiry into
approvals process for Renewable Energy Projects in Victoria (2009) placing Victorian DNSP’s in a
negative light, there is a real opportunity to be more open and supportive of COWF developments
as it has the potential to connect them with the local communities that they serve. A little bit of
“good will” can go a long way and help market the organisations to the broader community.
Therefore it may be desirable for the COWF to seek out the marketing or public relations
departments of the DNSP in parallel with any connection application in order to facilitate such
opportunities.
6.2.5 Understand Connection Risks
A review of the literature reveals that the dominant technical issue to be considered when
connecting wind farms to a weak rural grid is the effect the generator will have on the voltage
levels of the local network (Craig et al. 1996; Holdsworth et al. 2003; Jenkins & Strbac 1997;
Wallace, AR & Kiprakis 2002). A simulation of the potential effects of adding wind generation to a
weak distribution grid was demonstrated, see section 0. The simulation showed significant
changes to the voltage level in relation to the output from the wind farm at the point of
connection. This resulted in reverse current flow in the distribution network which has the
potential to result in incorrect operation and to increase the maintenance of VCR’s located on the
distribution feeder. Older wind turbines were not capable of supplying reactive power to support
the voltage level on the distribution network. However, advancements in wind turbine
technology and turbine manufacturers adding options to allow the turbine to contribute reactive
power have changed the impact that these wind turbines have on the local grid.

MIET2133 Energy Design Project II
Student: Wayne Bowers Student #: 9003094 P a g e | 67
After reviewing the effects that wind turbine generators can have on the distribution
network, it is recommended that potential COWF’s avoid older technology turbines such as fixed
speed and refurbished turbines. These types of wind turbine can have a potentially greater
impact on the distribution network due issues associated with flicker and frequency performance.
Conditions on the network such as short circuits can have an adverse impact on the wind turbine
and may result in the wind farm shutting down more frequently. It has also been shown that fixed
speed turbines generate considerable less energy when compared to equivalent variable-speed
generators (Datta & Ranganathan 2002).
It is important for any potential COWF to discuss these potential connection issues with the
DNSP as part of the connection negotiations otherwise the DNSP may request additional works at
the cost of the COWF to overcome these issues should they arise, even if not the direct result of
the wind farm. However, it may be difficult for the COWF to challenge such claims, even when
they occur after the commissioning of the wind farm and the connection has been given approval
as the DNSP can simply respond that the cause is directly contributable to the additional
generation added to the network. Furthermore, COWFs should ensure that DNSPs perform data
collection and background studies prior to installation of turbines to help avoid such situations
and allow possible claims to be challenged.

MIET2133 Energy Design Project II
P a g e | 68 Student #: 9003094 Student: Wayne Bowers

MIET2133 Energy Design Project II
Student: Wayne Bowers Student #: 9003094 P a g e | 69
7 Conclusions
There is a growing interest in community owned wind farms in Victoria in order to have a
positive impact on climate change by reducing GHG emissions. There are significant benefits
associated with community owned wind farms and therefore a case to provide this sector with
support. Benefits include an increase in the awareness of and support for renewable energy
projects especially when the local community are able to become stakeholders through co-
operative ownership models allowing them a ‘sense of ownership’ in the project. Having the
generation close to the community where the electricity is consumed reduces network losses and
provides the local community with a significant reduction in GHG emissions.
There are significant financial benefits for rural communities that are willing to accept the
challenge of establishing a community owned wind farm. This can help a rural community to
become more resilient by providing an alternative income stream. Overseas experience has
demonstrated that community owned wind turbines can provide financial returns to a local
community that are many times that provided through community funds set up by utility based
wind farms.
Community owned wind farms can access new sources of investment capital by targeting
ethical investors which has shown to be particularly successful in countries such as Germany.
There is also an opportunity to develop community owned wind farms at sites that are not
favourable for utility scale wind farms and which may not have been exploited otherwise.
Any wind farm can encounter significant technical barriers. However the dominant technical
barrier identified when connecting smaller community owned projects to the distribution
network is that of voltage level concerns. These concerns are often referred to as Slow or Steady-
State voltage variations and relate to the voltage level that customers experience at their point of
connection to the distribution network. The DNSP with take this very seriously as voltage
variations outside of specification can result in penalties.

MIET2133 Energy Design Project II
P a g e | 70 Student #: 9003094 Student: Wayne Bowers
The author was able to demonstrate the significant impact voltage levels can have on a
distribution grid with no voltage compensation by modelling the Hepburn Wind farm using the
MatLab simulation package. Results indicated that voltage could increase by up to 8% when the
wind farm is operating at maximum output. Potential community owned wind farms need to be
aware that voltage compensation equipment as specified by the DNSP to meet connection
requirements may result in significant addition capital costs.
A number of significant institutional barriers where identified and categorised based on the
type of barrier. The dominant institutional barriers centred on information and its availability, and
the general lack of support for the renewable energy sector in Australia. Establishing a viable
income stream in order for community owned wind farms to obtain loans and seek investors is
very difficult within the current environment, particularly with the uncertainty surrounding
electricity prices and carbon price legislation.
Recommendations were made in order to overcome both the technical and institutional
barriers identified by splitting the recommendations into two groups, see page 49. The first group
of recommendations requires some type of regulatory changes to enact whereas the second
group are recommendations that the community wind farm organisation can implement directly.
The critical regulatory recommendations included the establishment of a FiT scheme, a method to
ensure the DNSPs are encouraged to prioritise the connection of distributed generation,
alteration of the National Electricity Rules (NERs) to establish a time period in which the DNSP
must respond with a connection approval, and finally to implement a price on carbon to ensure a
more level playing field between polluting forms of energy generation and renewable energy.

MIET2133 Energy Design Project II
Student: Wayne Bowers Student #: 9003094 P a g e | 71
The essential non-regulatory recommendations included seeking out support groups in order
to share and disseminate information between community based renewable energy projects,
forming a relationship with a financial institution with a community focus and experience with co-
operative business models. Finally, it cannot be emphasised enough the requirement for the
community owned wind farm organisation to obtain as much technical knowledge as possible,
whether taking on the challenge to self-educate or by obtaining third party expertise to advise
them. This can significantly reduce project risks and can potentially reduce both capital and on-
going costs.
The recommendations included an examination and proposal for a modest FiT scheme. This
included modelling the scheme from which the results indicated that this modest scheme could
provide the necessary income in order to establish the community owned wind farm sector in the
state of Victoria while only imposing a modest cost on Victoria households. This financial analysis
also demonstrated that community owned wind farms are very cost competitive when compared
with other renewable energy generation based on their levelised cost. Furthermore, community
owned wind farms are significantly more economically efficient in producing renewable energy
compared to small scale systems such as Solar PV which is currently supported in Victoria through
a premium FiT.
It was demonstrated that there is potential for significant benefits to be provided by the
community owned wind farm sector. However this sector will remain insignificant unless support
is provided at both the State and Federal levels of government. The fact that community owned
wind farms have the potential to produce renewable energy which is more cost competitive than
small-scale solar PV and competitive with other large scale forms of renewable energy is a
significant advantage. Furthermore, they have the ability to provide an additional income streams
for rural communities many of which are currently struggling.

MIET2133 Energy Design Project II
P a g e | 72 Student #: 9003094 Student: Wayne Bowers

MIET2133 Energy Design Project II
Student: Wayne Bowers Student #: 9003094 P a g e | 73
Appendix A – What is a community owned wind farm?
A review of the literature shows that there are many differing ideas as to what constitutes a
community owned wind farm (COWF). For example Mark Bolinger (Bolinger, MA 2005) writes
that there are a wide variety of definitions and includes some criteria such as the development
size, purpose, ownership and type of grid connection. I would argue that such criteria as the
development size in terms of the number of turbines does not really apply as the local
community will be constrained by what it can afford and that usually is not more that a small
number of turbines. The reality is that there are many different views and definitions;
consequently I believe it is important to outline a definition for a COWF.
If we look at the definition of community in the Merriam-Webster Collegiate Dictionary
(Merriam-Webster Inc. 2003) it states several definitions of which two are particularly relevant to
our discussion:
A unified body of individuals: as the people with common interests living in a particular
area, and
Joint ownership or participation
In addition Bolinger breaks down community into (Bolinger, M 2001) “communities of
locality” and “communities of interest”. Country townships, an area bounded by a shire or council
all constitute communities of locality. Communities of interest may not be bound by geographic
location but are bound by shared interests such as the promotion of renewable energy. Bolinger
goes on to make the point that these two communities often overlap and can work closely with
each other in such wind farm developments.
Another approach is to evaluate the process and outcome dimensions of such projects. One
paper plots these dimensions to show the differences between commercial scale and community
renewable energy projects (Walker & Devine-Wright 2008). This is appealing because it provides
an easily-understood graphical illustration to present these differences. The area bounded by
both A and B is the ideal COWF resulting in maximum local outcomes with an open and
participatory process. Most COWFs would exit somewhere in the area shaded by C. Utility or
corporate wind farm developments are typically distant, that is they have no relationship with the
local community, and are closed because of the corporate nature of the development institution.

MIET2133 Energy Design Project II
P a g e | 74 Student #: 9003094 Student: Wayne Bowers
Figure 17 - Understanding of community renewable energy in relation to project process and outcome
dimensions (Walker & Devine-Wright 2008)
Recently there has been an emergence of COWFs being established in the US. Although in its
infancy, it has gained significant attention and thus has also grappled with the definition of what
is community wind. In a paper discussing policy support for community wind in the US, Patrick
Mazza (2008) states very concisely that “Community wind in its most essential definition is wind
development in which local ownership plays a major role”.
Finally, by analysing the above definitions I conclude that a COWF is:
A development in which a group of like-minded individuals with a majority from the
geographical area of the development, through joint ownership and participation, erect a small
number of wind turbines for the benefit of that community.

MIET2133 Energy Design Project II
Student: Wayne Bowers Student #: 9003094 P a g e | 75
Ownership models
David Toke (Elliott 2007) suggests 3 typical community ownership models have developed
globally:
Local co-operatives
o The local co-operative model is typically formed with the local residents owning
the entire wind farm assets. The best example of this form of wind farm comes
from Denmark, in which the entire funding comes from equity capital, thus
negating the need for bank credit resulting in increased income security.
Non-local & non-commercial co-operatives
o Under the non-local & non-commercial co-operative model the shareholders are
not confined to the local area of the wind farm itself and may include ethical
investors. Hepburn Wind follows this particular model although priority is given
to local investors (Membership and Share Offer 2010).
Farmer ownership
o Farmer ownership is a commonly used in both Denmark and Germany. Financing
can be more difficult as the farmer(s) usually finance via a bank loan for the
majority of the capital to set up the wind farm. Because the farmer requires the
motivation to acquire additional knowledge to establish a wind farm, this is seen
as the key barrier to this form of ownership
There are other possible community models however there do not seem to be any operating
in any notable fashion in the wind farm sector. In the UK other models that have been used in
non-wind renewable energy projects include community charities and development trusts
(Walker 2008). These typically are of a smaller scale than a community owned wind farm (COWF)
in terms of capital costs. Another model of relevance was gifting of shares or a wind turbine to a
local community organization such as at the Earlsburn Wind farm in Scotland (Walker 2008). A
similar model has been used by an Australian commercial wind farm development, the Challium
Wind farm near Ararat in Victoria, where $30,000 is given to the local council annually to be used
specifically for community projects (Wijngaart, Pemberton & Herring 2009).

MIET2133 Energy Design Project II
P a g e | 76 Student #: 9003094 Student: Wayne Bowers
A note on Co-operatives
Community wind ownership structures based on the co-operative model can vary from
country to country but are essentially all based on the same principles. The modern co-operative
model dates back to 1844 when the Rochdale Society of Equitable Pioneers in Rochdale, England
set out a series of principles which have formed the basis on which co-operatives around the
world operate to this day (The Birthplace of the Modern Co-operative Movement 2010). Today
the international co-operative movement has more than 800 million members located in over 100
countries. The International Co-operative Alliance (ICA) formed in 1895, today represents co-
operatives around the world (ICA 2010).
The 7 main principles by which co-operatives are run (Co-operatives 2010):
1. voluntary and open membership
2. democratic member control
3. member economic participation
4. autonomy and independence
5. education, training and information for members and others
6. co-operation among cooperatives
7. concern for the community
In Australia there is at present separate legislation governing co-operatives in each state and
territory. In 2009 there was a proposed Cooperatives National Law being put forward by
Australia's Ministerial Council on Consumer Affairs (A New Cooperatives National Law 2010). As
this proposal is still in the planning stages it is unclear what time frame any legislative changes
will take if pursued.

MIET2133 Energy Design Project II
Student: Wayne Bowers Student #: 9003094 P a g e | 77
What laws regulate co-operatives in Victoria?
A co-operative in Victoria can be (although it does not have to be) incorporated under the Co-
operatives Act 1996 (Vic). If not incorporated it is essentially treated like any other
unincorporated group. The department of Consumer Affairs Victoria (CAV) administers this
legislation which includes provisions to provide for the 7 main principles by which a co-operative
is run. An incorporated co-operative is a legal entity in its own right that is separate of that of its
members meaning the members have limited liability and the co-operative can outlive its
members. Therefore the co-operative has rights, responsibilities, and liabilities that can continue
even if members die or leave as long as there are at least five members. The Co-operative Act also
sets out which provisions of the Commonwealth Corporations Act 2001 (Cth) may apply to some
co-operatives under particular situations (Co-operatives 2010).

MIET2133 Energy Design Project II
P a g e | 78 Student #: 9003094 Student: Wayne Bowers

MIET2133 Energy Design Project II
Student: Wayne Bowers Student #: 9003094 P a g e | 79
Appendix B - Victoria’s First Community Owned Wind Farm – Hepburn Wind
The following is a brief overview of the Hepburn Community Wind Park also known as
Hepburn Wind (Hepburn Wind 2010):
Located near Leonard’s Hill approximately 10km south of Daylesford, Victoria
Will consist of 2 Turbines, each of 2.05 MW peak generating capacity
Expected to generate 12,200MWh/year – enough electricity to supply 2300 average
homes
Connection to the electricity grid is via 22kV powerlines that run through the site where
the turbines will be located
Order for the turbines was placed in April 2010 with Repower Systems AG
Project is expected to commence operation by mid-2011
Wind turbines were erected in April 2011
Project uses a Co-operative Model (established under the Victoria Co-operatives Act of
1996)
Hepburn Shire has a population of approximately 15,000 and an annual growth rate of
0.5%.
A local member is defined as living within the boundary of the Hepburn Shire
A non-local member can typically be described as person or entity based outside of the
Hepburn Shire but within the state of Victoria (although the co-operative can accept
applications from other states and overseas as long as they meet the criteria of the Co-
operatives Act 1996 (Vic)).
The seeds for Hepburn Wind were sown back in early 2005 when the Hepburn Renewable
Energy Association (HREA) approached a renewable energy consulting company called Future
Energy and the idea for a community owned wind farm (COWF) to provide enough electricity for
the local community was established (Membership and Share Offer 2010). This meeting
consisted of two people that would be the key drivers to getting this project off the ground, Per
Bernard and David Shapero (Pearce 2008) and would later be joined by Simon Holmes à Court the
current chairman of Hepburn Wind.

MIET2133 Energy Design Project II
P a g e | 80 Student #: 9003094 Student: Wayne Bowers
Per Bernard is the former President of HREA which is now known as SHARE (Sustainable
Hepburn Association) and although the organisation helped start Hepburn Wind it has no legal
relationship with Hepburn Wind but co-operates on sustainability and education programs. David
Shapero is the Managing Director of Future Energy (Future Energy Pty Ltd 2010).
Hepburn Wind became a formally-incorporated entity in 2007 when it registered as a co-
operative under the Victorian state Co-operative Act of 1996, its core purpose being the
development and ownership of the Hepburn Community Wind Farm located at Leonards Hill just
south of Daylesford, Victoria. The co-operative had 1112 members registered as of the 22nd April
2010 (Membership and Share Offer 2010). The co-operative act limits members to Victorian
residents (except under special circumstances) and prevents any member from owning more than
20% of the co-operatives shares. Any co-operative must formalise a set of ‘Rules of the Co-
operative’ which lay out how the co-operative will be run and what to do in the case of being
wound up as well as any other requirements as per the co-operative act. For example, Hepburn
has opened membership to the whole of Victoria but favours local investors that are located
geographically close to the wind farm and reside within the Hepburn shire. These investors can
participate in the scheme for as little as $100 whereas non-local investors must provide a
minimum of $1000 (Hepburn Wind 2010).
From the set of rules defined for the Hepburn Wind co-operative, the primary activities are to
(Membership and Share Offer 2010):
Develop, own, operate and manage a wind farm or farms
Generate and supply energy from the co-operative wind farm or farms
Provide advice and assistance to its members to reduce energy usage and increase
members’ energy efficiency
Raise community awareness of the benefits of sustainable and renewable energy

MIET2133 Energy Design Project II
Student: Wayne Bowers Student #: 9003094 P a g e | 81
Project Development and Financing
The following 7 project development stages are typical of a wind farm project (Bolinger, MA
2005):
1. Project conceptualisation and site identification,
2. Wind measurement and monitoring,
3. Feasibility analysis (both technical and economic),
4. Public outreach and feedback,
5. Project financing,
6. Project construction, and
7. Project operation and maintenance.
Hepburn Wind has progressed through many of the stages cited above during the past 5 years
since the first meeting between Bernard and Shapero and is currently in the final three stages.
Starting from step 5, Hepburn Wind is currently hoping to finalise financing this year and begin
operation of the wind farm in mid 2011. The erection of the turbines was completed in April
2011. Some contract negotiations are still underway with regard to sale of electricity and
connection to the grid (Hepburn Wind 2010).
The most difficult phases for any community based project are the first 3 phases in which a
business case must be established for the project (see the project development stages above).
For community wind a large portion of this effort is dedicated to locating a site and establishing
that a good wind resource exists. At these early phases funds are limited or non-existent and
there are limited resources and skills available within the team. Hepburn Wind (through the help
of Future Energy) was able to overcome these significant barriers. Future Energy not only
provided the early funding but also helped prepare and co-ordinate the preliminary site
investigations. Future Energy then went on to co-ordinate the overall project in partnership with
Hepburn Wind. Due to this partnership there exist two contracts which establish the roles and
responsibilities of the two parties through to the completion of the project including the financial
compensation for services and financial risk undertaken by Future Energy during the early stages
of the project.

MIET2133 Energy Design Project II
P a g e | 82 Student #: 9003094 Student: Wayne Bowers
These contracts are (Membership and Share Offer 2009):
Project Transfer Agreement (PTA), and
o Includes such things as transfer of assets from Future Energy to Hepburn Wind
and instalment payments to Future Energy based on project milestones achieved.
These fees include the project establishment fee ($127,717) and project
development fee ($240,000 and 160,000 shares).
Project Management Services Agreement (PMSA)
o This agreement contracts Future Energy to provide project management services
until the commissioning of the project is complete. Future Energy will receive
reimbursement for the services rendered and costs incurred in these activities.
This is a considerable liability for a community based project. On the other hand the project
may not have got off the ground in the first place without these contracts in place with Future
Energy. For both Hepburn Wind and Future Energy there was a significant learning curve in
developing the business skills to establish the community co-operative to operate the wind farm.
Towards the latter part of the project Bendigo Bank was able to help in this regard. This has been
cited as a major barrier/risk in the project that if done again would use an existing co-operative
business model as opposed to developing one from scratch (Mountjoy 2010). Hence West Gate
Wind have already engaged Bendigo Bank to provide the co-operative business model, in fact
Bendigo Bank has even offered to drop associated fees to help them establish the wind farm.

MIET2133 Energy Design Project II
Student: Wayne Bowers Student #: 9003094 P a g e | 83
As of April 2010 the total cost for the development of the Hepburn Wind farm sat at an
estimated maximum of $12,940,210 (Membership and Share Offer 2010). Originally the share
offer from July 2008 quoted a total project cost of $10,654,000 (Membership and Share Offer
2009) which was revised during 2009 when capital raising became difficult due to the Global
Financial Crisis. The current breakdown of financing is as follows (Membership and Share Offer
2010):
Grant from Sustainability Victoria for $975,000
Regional Infrastructure Development Fund (RIDF) grant for $750,000
A loan of up to $3.1 million from Bendigo Bank
Possible share memberships totalling $9,507,441 which consists of
o 7,525,421 through share applications received prior to 22nd April 2010
o 1,822,020 via the latest share offering in 2010 which closes end of June.
o 160,000 from Future Energy (to be issued to Future Energy on project completion)
The financial model used by Hepburn Wind is similar to that used successfully by the Gigha
COWF in Scotland. Their capital was comprised of a three-way mix with one portion coming from
a grant, another from a commercial loan and the rest from equity finance (Warren & McFadyen
2008).
Generally speaking the members of a co-operative are also its customers. This has been a
significant difficulty for Hepburn Wind because it is not an electricity retailer and the expense to
become one does not make financial sense. Therefore members can only become a customer of
Hepburn Wind through an arrangement with a third party electricity retailer. This has been a
lengthy negotiation for Hepburn Wind as it has always been their intention to ensure that
members could purchase electricity generated by the wind farm through an electricity retailer,
yet at the same time they must ensure that they get a fair price from the retailer.

MIET2133 Energy Design Project II
P a g e | 84 Student #: 9003094 Student: Wayne Bowers

MIET2133 Energy Design Project II
Student: Wayne Bowers Student #: 9003094 P a g e | 85
Appendix C – FiT Models
In a survey of FiTs schemes used worldwide, Couture & Gagnon (2010) discovered that there
are many differing types employed, however, these where able to be grouped based on whether
they were market-dependent or independent. This means that the scheme is based on whether
the FiT offers remuneration that is dependent or independent from the actual market electricity
price. It is important to note that the design aspects of these FiT models can overlap (i.e. are not
mutually exclusive) and can be tailored to the specific needs or context of the jurisdiction where it
is to be implemented.
Market-independent FiT policies based on a fixed-price option are the most commonly
employed model and are generally accompanied by a purchase guarantee. Market-dependent
models are also known as feed-in premiums as they are usually designed to pay a premium above
the market rate of electricity to the generator (Couture & Gagnon 2010).
Model Description
Premium Price Model Offers a constant premium or bonus over and above the
average retail price.
Variable Premium Price Model Similar to the premium price model but adds both caps
and floors effectively allowing the premium to vary as a
function of the market price. The premium amount
declines in a graduated way until the retail price reaches
a certain level, at which point the premium declines to
zero and the generators receives the spot market price.
Percentage of Retail Price Model Establishes a fixed percentage of the market retail price
to be paid to the generator.
Table 13 - Summary of Market-dependent FiT Models (Couture & Gagnon 2010)

MIET2133 Energy Design Project II
P a g e | 86 Student #: 9003094 Student: Wayne Bowers
Model Description
Fixed Price Model Establishes a fixed minimum price at which the
electricity generated will be bought for a fixed time
period, irrespective of the retail price of electricity.
Fixed Price Model with full or partial
inflation adjustment
Similar to the Fixed price model but adds inflation
adjustment to guard against a decline in the real value
of project revenues by tracking changes with the
broader economy.
Front-end loaded model Similar to the Fixed Price model but pays a higher
remuneration in the earlier years than the later years of
the project, effectively skewing the cash flows in favour
of the earlier years of the project’s life.
Spot Market gap model The actual FiT payment is comprised of the gap between
the spot market and the required FiT price. As a result,
the total remuneration is the fixed price consisting of
the sum of the spot market price and the variable FiT
premium, which when combined make up the total FiT
payment.
Table 14 - Summary of Market-independent FiT Models (Couture & Gagnon 2010)
Summary
Due to the fact that the retail price of electricity cannot be predicted reliably over a 15 to 20
year period, market-dependent models create greater uncertainty for investors and developers
because the future payment levels are not known. This presents significant problems for COWF
projects as they require a stable and predictable revenue stream to obtain financing and attract
investors.
Due to the added transaction costs of participating in selling one’s electricity via the spot
market, Couture & Gagnon (2010) note that the market dependent option may arguably be
better suited to larger scale market participants than community owned generators. Market-
dependent FiT models can also suffer from both over and under compensation as long as the
premium offered remains fixed.

MIET2133 Energy Design Project II
Student: Wayne Bowers Student #: 9003094 P a g e | 87
Lesser and Su (cited in Couture & Gagnon, 2010) have argued that fixed price FiTs in which
the FiT payment remains completely independent from the electricity market prices can distort
the wider electricity price. The distortion arises from the fixed-price FiT remaining the same over
time regardless of the electricity market price trends such as a development that leads to overall
lower costs to deploy renewable energy and may lead to lower electricity prices. However
because the FiT is fixed the consumer will continue to pay a higher cost than what the market
would really pay otherwise. This could be possible for a FiT that is applied to a large sector of the
Renewable Energy market, however the recommendations of this paper is for the medium scale
wind sector only which is not large enough or expected to be large enough to cause such a
distortion (also see future financial analysis).

MIET2133 Energy Design Project II
P a g e | 88 Student #: 9003094 Student: Wayne Bowers
Table of Figures
FIGURE 1 - VICTORIAN WIND RESOURCE MAP (SV 2011) ........................................................................................... 21
FIGURE 2 – VICTORIAN ELECTRICITY TRANSMISSION AND DISTRIBUTION NETWORK DIAGRAM.............................................. 22
FIGURE 3 - CONNECTION OF HEPBURN WIND'S TWO 2.05MW TURBINES TO THE DISTRIBUTION GRID .................................. 23
FIGURE 4 – SIMPLIFIED DISTRIBUTION NETWORK VOLTAGE PROFILE WITHOUT DISTRIBUTED GENERATION ............................. 25
FIGURE 5 - VOLTAGE PROFILE FOR NETWORK WITH AUTOMATIC VOLTAGE REGULATOR (AVR) COMPENSATION ...................... 26
FIGURE 6 - POSSIBLE SCENARIO WITH WIND FARM CONNECTION TO DISTRIBUTION NETWORK .............................................. 27
FIGURE 7 - SIMPLIFIED POWERCOR FEEDER BAN_11 THAT CONNECTS HEPBURN WIND (WALLACE, P 2009) ....................... 28
FIGURE 8 – VOLTAGE PROFILE ALONG FEEDER BAN_11 ............................................................................................... 29
FIGURE 9 - EXAMPLE DISTRIBUTION NETWORK WITH DG SHOWING FAULT CURRENTS (COSTER ET AL. 2011) .......................... 34
FIGURE 10 - EXAMPLE OF HOW FALSE TRIPPING CAN OCCUR (COSTER ET AL. 2011) .......................................................... 36
FIGURE 11 - COMMUNITY OWNED WIND FARM POTENTIAL STAKEHOLDERS ...................................................................... 38
FIGURE 12 - LGC SPOT PRICE FROM MAY 2010 TO MAY 2011 (NEXTGEN 2011) .......................................................... 53
FIGURE 13 - FIT EFFECT OF RESIDENTIAL ELECTRICITY BILL PER ANNUM ........................................................................... 56
FIGURE 14 - EFFECT OF FIT ON YEARLY INCOME VERSUS COMBINED REC & ELECTRICITY PRICE ............................................. 57
FIGURE 15 - LEVELISED COST OF GENERATING ELECTRICITY FROM A COWF ...................................................................... 58
FIGURE 16 - DESCRIPTION OF THE NOT-FOR-PROFIT GROUP ENERGY4ALL ........................................................................ 64
FIGURE 17 - UNDERSTANDING OF COMMUNITY RENEWABLE ENERGY IN RELATION TO PROJECT PROCESS AND OUTCOME
DIMENSIONS (WALKER & DEVINE-WRIGHT 2008) ............................................................................................. 74

MIET2133 Energy Design Project II
Student: Wayne Bowers Student #: 9003094 P a g e | 89
References
ABARE 2007, Technology: toward a low emissions future, Commonwealth of Australia, Canberra.
ACCIONA 2011, ACCIONA Wind Power, ACCIONA Australia, viewed 22 May 2011,
<http://www.acciona.com.au/businessDivisions/energy/windpower/index.php>.
Ackermann, T, Andersson, G & Söder, L 2001, 'Distributed generation: a definition', Electric Power
Systems Research, vol. 57, no. 3, pp. 195-204.
AEMC 2011, National Electricity Rules Version 41, Chapter 5: Network Connection, Australian
Energy Market Commission (AEMC), Sydney South.
AEMO 2010, Home > Electricity Market & Power Systems, Australian Energy Market Operator
(AEMO), viewed 12 October 2010,
<http://www.aemo.com.au/electricityops/market.html>.
---- 2011a, Electricity Settlements, viewed 16 April 2011,
<http://www.aemo.com.au/electricityops/settlements.html>.
---- 2011b, Electricity: Average Price Tables, viewed 27 April 2011,
<http://www.aemo.com.au/data/avg_price/averageprice_main.shtml>.
AER 2010, Victorian electricity distribution network service providers: Distribution determination
2011–2015, Final Decision, Australian Energy Regulator (AER), Canberra, ACT.
APRA 2011, Media Releases: APRA releases annual superannuation figures to 30 June 2010,
Australian Prudential Regulation Authority (APRA), Commonwealth of Australia, viewed
12 April 2011, <http://www.apra.gov.au/media-releases/11_01.cfm>.
ATA 2008, Cost to Victorian Consumers of a Gross-Metered Feed-in Tariff, Alternative Technology
Association, Melbourne.
Australia, Co 2011, Fact sheet: Enhanced Renewable Energy Target, Australian Government,
viewed 3 March 2011,
<http://www.climatechange.gov.au/government/initiatives/renewable-target/fs-
enhanced-ret.aspx>.
BCSE 2004, Technical Guide for Connection of Renewable Generators to the Local Electricity
Network.
The Birthplace of the Modern Co-operative Movement, 2010, Rochdale Pioneers Museum, viewed
10/06/2010 <http://museum.co-op.ac.uk/>.
Bolinger, M 2001, Community Wind Power Ownership Schemes in Europe and their Relevance to
the United States, Assistant Secretary of Energy Efficiency and Renewable Energy of the
U.S. Department of Energy.

MIET2133 Energy Design Project II
P a g e | 90 Student #: 9003094 Student: Wayne Bowers
Bolinger, MA 2005, 'Making European-style community wind power development work in the US',
Renewable and Sustainable Energy Reviews, vol. 9, no. 6, pp. 556-75.
Brazzale, R 2011, 'Market and REC Pricing', presentation to the Clean Energy Week Conference
(Combined ATRAA and CEC National Conference), Clean Energy Coucil, Melbourne,
Australia.
Brown, MA 2001, 'Market failures and barriers as a basis for clean energy policies', Energy Policy,
vol. 29, no. 14, pp. 1197-207.
Burton, T, Sharpe, D, Jenkins, N & Bossanyi, E 2001, Wind Energy Handbook, John Wiley & Sons.
CES 2006, Electricity Generation, consumption and greenhouse gas emissions in Victoria,
Commissioner for Environmental Sustainability, Victoria, viewed 17 April 2011,
<http://www.ces.vic.gov.au/ces/wcmn301.nsf/obj/publications/$file/Electricity+factshee
t+v1.pdf>.
Co-operatives, 2010, Pilch Connect - a specialist legal service for community organisations,
viewed 11/06/2010 <http://www.pilch.org.au/cooperatives>.
Coster, EJ, Myrzik, JMA, Kruimer, B & Kling, WL 2011, 'Integration Issues of Distributed Generation
in Distribution Grids', Proceedings of the IEEE, vol. 99, no. 1, pp. 28-39.
Couture, T & Gagnon, Y 2010, 'An analysis of feed-in tariff remuneration models: Implications for
renewable energy investment', Energy Policy, vol. 38, no. 2, pp. 955-65.
Craig, LM, Davidson, M, Jenkins, N & Vaudin, A 1996, 'Integration of wind turbines on weak rural
networks', paper presented to Opportunities and Advances in International Electric
Power Generation, International Conference on (Conf. Publ. No. 419), 18-20 Mar 1996.
CSIRO 2009, Intelligent Grid: A value proposition for distributed energy in Australia.
Datta, R & Ranganathan, VT 2002, 'Variable-speed wind power generation using doubly fed
wound rotor induction machine-a comparison with alternative schemes', Energy
Conversion, IEEE Transactions on, vol. 17, no. 3, pp. 414-21.
Diesendorf, M 2010, Submission on National Transmission Network Development Plan, Institute
of Environmental Studies, University of New South Wales.
DPI 2009, Reserch Brief Number 2 - Electricity Industry Amendment (Premium Solar Feed-in Tariff)
Act, Victorian Legislation and Parlimentary Documents Website, viewed 5 October 2010,
<http://www.parliament.vic.gov.au/publications/research-papers?start=20>.
---- 2010, Review into the expansion of feed-in tariffs to include low-emissions technologies,
Melbourne.
Dunstan, C, Abeysuriya, K & Shirley, W 2008, Win, Win, Win: Regulating Electricity Distribution
Networks for Reliability, Consumers and the Environment, Total Environment Centre
Dunstan, C & Daly, J 2009, Institutional Barriers to Intelligent Grid: Working Paper 4.1 Institute for
Sustainable Futures, UTS.

MIET2133 Energy Design Project II
Student: Wayne Bowers Student #: 9003094 P a g e | 91
EIA 2011, Levelized Cost of New Generation Resources in the Annual Energy Outlook 2011, US
Energy Information Administration (EIA), viewed 3 June 2011,
<http://www.eia.gov/forecasts/aeo/electricity_generation.cfm>.
Electricity Industry (Wind Energy Development) Act, 2004, Victorian Legislation and Parlimentary
Documents Website - Victorian Statute Book, Victoria, Australia,
<http://www.legislation.vic.gov.au/>.
Elliott, D (ed.) 2007, Sustainable Energy: Opportunities and Limitations, Energy, Climate and the
Environment Series, Palgrave Macmillan.
Embark 2011, Home Page, viewed 06 April 2011,
<http://www.embark.com.au/display/WebsiteContent/Home>.
EMN 2009, CleanTech opinion: RET will favour wind and solar, Environmental Management News
(EMN), produced by WME Media, viewed 27 April 2011,
<http://www.environmentalmanagementnews.net/storyview.asp?storyid=1034595%C2%
A7ionsource=s0>.
ENRC 2009, Inquiry into the Approvals Process for Renewable Energy Projects in Victoria,
Environment and Natural Resources Committee (ENRC), Victorian Legislation and
Parlimentary Documents Website - Parlimentary Documents, Victoria, Australia.
ESC 2010a, Energy retailer’s comparative performance report – Customer service 2009-10,
Essential Services Commission.
---- 2010b, Welcome to the Essential Services Commission, Essential Services Commission (ESC),
viewed 12 October 2010, <http://www.esc.vic.gov.au/public/>.
Fox, B 2007, Wind power integration:connection and system operational aspects, IET power and
energy series ; 50, Institution of Engineering and Technology, London.
Future Energy Pty Ltd, 2010, Our Team, viewed 10/06/2010
<http://www.futureenergy.com.au/team.html>.
Garnaut, R 2008, The Garnaut Climate Change Review, Commonwealth of Australia, Canberra.
---- 2011, Garnaut Climate Change Review Update 2011: Transforming the electricity sector,
Commonwealth of Australia, Canberra.
GET 2010, How are Certificates priced?: The Wholesale Certificate Market, Green Energy Trading
(GET), viewed 27 April 2011, <http://www.greenenergytrading.com.au/how-are-recs-
priced.html>.
Gipe, P 2010, Provincial Feed-in Tariffs Spurring Community Power: Ontario on Track for Most
Community Power outside Denmark & Germany, viewed 22 May 2011,
<http://www.wind-works.org/contact.html>.
Green Energy and Green Economy Act, 2009, Bill 150, Legislative Assembly of Ontario Website -
Bills & Lawmaking, Current Parliment, Ontario, Canada,

MIET2133 Energy Design Project II
P a g e | 92 Student #: 9003094 Student: Wayne Bowers
<http://www.ontla.on.ca/web/bills/bills_detail.do?locale=en&BillID=2145&detailPage=bil
ls_detail_the_b>.
Hepburn Wind, 2010, Hepburn Community Wind Park Co-operative Ltd (Hepburn Wind), viewed
08/04/2010 2010, <http://www.hepburnwind.com.au/>.
Holdsworth, L, Wu, XG, Ekanayake, JB & Jenkins, N 2003, 'Comparison of fixed speed and doubly-
fed induction wind turbines during power system disturbances', Generation, Transmission
and Distribution, IEE Proceedings-, vol. 150, no. 3, pp. 343-52.
Holmes à Court, S 2010, Discussion about barriers that have impacted Hepburn Wind to W
Bowers, 22 December.
---- 2011, Discussion about Hepburn Wind in relation to feedback on draft report to W Bowers, 20
May.
Howlett, M, Ramesh, M & Solomon, R 2003, Studying public policy : policy cycles and policy
subsystems, 2nd. ed. edn, POLI1038 (Reserve), Oxford University Press, Ontario.
ICA, 2010, International Co-operative Alliance, viewed 10/06/2010 <http://www.ica.coop/al-
ica/>.
InfoChoice 2011, Community banking: How it works, viewed 5 June 2011,
<http://www.infochoice.com.au/banking/savings-account/guides/community-banking-
how-it-works/21322/1/16,40,41,51,52,53,57,79>.
Jenkins, N & Strbac, G 1997, 'Impact of embedded generation on distribution system voltage
stability', paper presented to Voltage Collapse (Digest No: 1997/101), IEE Colloquium on,
24 Apr 1997.
Kundur, P, Balu, NJ & Lauby, MG 1994, Power system stability and control, EPRI Power System
Engineering Series., McGraw-Hill, New York.
Lachapelle, P 2008, 'A Sense of Ownership in Community Development: Understanding the
Potential for Participation in Community Planning Efforts', Community Development, vol.
39, no. 2, pp. 52 - 9.
Maher, S & Shanahan, D 2011, Labor to impose carbon tax next year, ETS in 2015, The Australian,
viewed 15 April 2011, <http://www.theaustralian.com.au/national-affairs/climate/labor-
to-impose-carbon-tax-next-year-ets-in-2015/story-e6frg6xf-1226004719022>.
Mazza, P 2008, Community Wind 101: A Primer for Policymakers, Harvesting Clean Energy, 25x'25,
and The Energy Foundation.
Membership and Share Offer, 2009, Hepburn Community Wind Park Co-operative Ltd (Hepburn
Wind).
Membership and Share Offer, 2010, Hepburn Community Wind Park Co-operative Ltd (Hepburn
Wind).

MIET2133 Energy Design Project II
Student: Wayne Bowers Student #: 9003094 P a g e | 93
Memery, C 2011, Discussion and feedback on technical barriers in draft report to W Bowers, 13
May.
Mendonca, M 2009, Feed-in Tariffs: Accelerating the Deployment of Renewable Energy,
Earthscan, London.
Merriam-Webster Inc. 2003, Merriam-Webster's collegiate dictionary, Eleventh ed. edn, Merriam-
Webster Inc., Springfield, Mass.
Mountjoy, G 2010, Interview of President, West Gate Wind to W Bowers, 11 May 2010.
Nelson, A 2008, Community Based Water and Energy Initiatives in Rural and Regional Victoria,
Alternative Technology Association.
A New Cooperatives National Law, 2010, Co-operatives Australia, viewed 10/06/2010
<http://www.australia.coop/ca/news/14-anewcooperativesnationallaw>.
NextGen 2011, Environment: Weekly Spot Chart, Next Generation Energy Solutions, viewed 22
May 2011,
<http://www.nges.com.au/index.php?option=com_content&view=article&id=101&Itemi
d=117>.
ORER 2011, ORER Home, Australian Government, viewed 22 May 2011,
<http://www.orer.gov.au/index.html>.
Pearce, J 2008, 'Is there an appropriate model of community wind turbine ownership for New
Zealand?', Massey University, Palmerston North, New Zealand.
Pepermans, G, Driesen, J, Haeseldonckx, D, Belmans, R & D'Haeseleer, W 2005, 'Distributed
generation: definition, benefits and issues', Energy Policy, vol. 33, no. 6, pp. 787-98.
Prest, DJ 2008, Submission by ANU College of Law to the Senate Standing Committee on
Environment, Communications and the Arts, Inquiry into the Renewable Energy
(Electricity) Amendment (Feed-in-Tariff) Bill 2008, Department of the Senate, viewed 1
October 2010,
<http://www.aph.gov.au/senate/Committee/eca_ctte/renewable_energy/submissions/s
ub123.pdf>.
Senate 2011, Submissions received by the Committee, Parliment of Australia, Senate, viewed 22
May 2011,
<http://www.aph.gov.au/senate/committee/clac_ctte/impact_rural_wind_farms/submis
sions.htm>.
Snow, M 2009, Distributed/Embedded generation in the Melbourne CBD - Barriers to entry
currently limiting the potential for large scale cogeneration adoption., RMIT, Melbourne.
SP AusNet 2011, Distribution System Planning Report, SP AusNet, Network Strategy and
Development Division Melbourne.

MIET2133 Energy Design Project II
P a g e | 94 Student #: 9003094 Student: Wayne Bowers
SV 2011, Wind resources in Victoria, Sustainability Victoria, viewed 10 March 2011,
<http://www.sustainability.vic.gov.au/www/html/2111-wind.asp>.
Tande, JOG 2000, 'Exploitation of wind-energy resources in proximity to weak electric grids',
Applied Energy, vol. 65, no. 1-4, pp. 395-401.
The Nous Group 2010, National workshop on rural electricity network options to reduce bushfire
risk, The Nous Group on behalf of Energy Safe Victoria (ESV).
Toke, D, Breukers, S & Wolsink, M 2008, 'Wind power deployment outcomes: How can we
account for the differences?', Renewable and Sustainable Energy Reviews, vol. 12, pp.
1129–47.
UCS 2010, Environmental impacts of coal power: air pollution, Union of Concerned Scientists,
viewed 08 April 2011, <http://www.ucsusa.org/clean_energy/coalvswind/c02c.html>.
VCAT 2007, Perry v Hepburn SC [2007], 27 July 2007 edn, 1309, VCAT,
<http://www.austlii.edu.au/au/cases/vic/VCAT/2007/1309.html>.
Victorian Government 2010, Taking Action for Victoria’s Future: Victorian Climate Change White
Paper - The Action Plan Published by the Victorian Government Department
of Premier and Cabinet, Melbourne, July 2010.
Walker, G 2008, 'What are the barriers and incentives for community-owned means of energy
production and use?', Energy Policy, vol. 36, p. 5.
Walker, G & Devine-Wright, P 2008, 'Community renewable energy: What should it mean?',
Energy Policy, vol. 36, no. 2, pp. 497-500.
Wallace, AR & Kiprakis, AE 2002, 'Reduction of voltage violations from embedded generators
connected to the distribution network by intelligent reactive power control', paper
presented to Power System Management and Control, 2002. Fifth International
Conference on (Conf. Publ. No. 488), 17-19 April 2002.
Wallace, P 2009, 'Connection of Leonards Hill Wind Farm to BAN 11 - Spargo spur: Voltage and
Reactive Power Control Strategy ', Peter Wallace Engineer Pty Ltd
Warren, CR & McFadyen, M 2008, 'Does community ownership affect public attitudes to wind
energy? A case study from south-west Scotland', Land Use Policy, vol. 27, no. 2, pp. 204-
13.
Wijngaart, Bvd, Pemberton, C & Herring, D 2009, Wind Power Concept Study Report, Southern
Councils Group.
Yarano, D 2008, 'Minnesota Model Encourages Community Wind', North American Windpower,
vol. January 2008.