on the trail of student participants: identifying barriers
TRANSCRIPT

Eastern Kentucky UniversityEncompass
Online Theses and Dissertations Student Scholarship
January 2015
On the Trail of Student Participants: IdentifyingBarriers to Hunting and Developing a HunterRecruitment Profile for College Students inKentuckyJustin Dean KurtzEastern Kentucky University
Follow this and additional works at: https://encompass.eku.edu/etd
This Open Access Thesis is brought to you for free and open access by the Student Scholarship at Encompass. It has been accepted for inclusion inOnline Theses and Dissertations by an authorized administrator of Encompass. For more information, please contact [email protected].
Recommended CitationKurtz, Justin Dean, "On the Trail of Student Participants: Identifying Barriers to Hunting and Developing a Hunter RecruitmentProfile for College Students in Kentucky" (2015). Online Theses and Dissertations. 285.https://encompass.eku.edu/etd/285


On the Trail of Student Participants:
Identifying Barriers to Hunting and Developing a Hunter Recruitment Profile for
College Students in Kentucky
By
Justin Kurtz
Bachelor of Science
Eastern Kentucky University
Richmond, Kentucky
2013
Submitted to the Faculty of the Graduate School of
Eastern Kentucky University
in partial fulfillment of the requirements
for the degree of
MASTER OF SCIENCE
May, 2015

ii
Copyright © Justin Kurtz, 2015
All rights reserved

iii
DEDICATION
This thesis is dedicated to the two men in my life who first
piqued my interested in hunting; my uncle, Mike Mayer
who passed away far too early on February 13, 2015, and
my father-in-law, Sonny Gay, who gave me my first
shotgun at the age of 17.

iv
ACKNOWLEDGMENTS
I would like to thank Dr. Ryan Sharp for his guidance in the thesis process, specifically
for his patience as I learned the necessary statistical analysis for this project. I would also
like to thank Dr. Michael Bradley for his assistance in the implementation of the survey
portion of this study and expertise and constructive criticism in the technical writing
process. I would like to thank Jamie Cook of the Kentucky Department of Fish and
Wildlife Resources for being the initiator of this project and providing a subject for
research that was both exciting and practical. Thanks to my wife, Julia, for her love,
undeserved patience, unwavering support, and willingness to listen to me ramble on
about the exciting things I was learning even while not understanding or relating to much
of what I was talking about. I would like to thank my mom and dad, Wendell and Bonnie
Kurtz, for raising me to chase after my dreams and giving me the tools to do so. Finally,
thanks to my three young sons, Miles, Owen, and Noah, for being constant reminders of
what is truly important and making me laugh even during the most difficult and stressful
times.

v
Abstract
Over the past several decades the number of individuals participating in hunting
has decreased dramatically. This issue is important as hunting plays a major role in the
US economy, is also the basis for the modern model of wildlife conservation, and can
serve as a conduit for individuals to experience nature.
The purpose of this research was to identify barriers to hunting for college students, as
well as identify lifestyle factors that can be used to create a profile for college students
who are ideal for hunter recruitment efforts. Students at Eastern Kentucky University,
Northern Kentucky University, and Western Kentucky University were surveyed for this
study. Researchers discovered that 70% of those surveyed had not participated in hunting
in the past three years. However, results also showed that a 71% of respondents approved
of hunting while 30% had participated in hunting. The largest barriers for college
students to hunter were Time and Lack of Interest.
Cluster analysis also revealed an Environmentally Inclined group (EINC) of college
students who were slightly more interested in hunting than the Environmentally
Indifferent group (EIND). A Potential Hunter (PH) group was also made up of
individuals who expressed some interest in hunting but had not participated in hunting in
the three years prior to this study (2011-2013). This (PH) group accounted for 30% of
the overall sample of college students.
vi
TABLE OF CONTENTS
CHAPTER PAGE
I. Introduction………………………………………………………………….1
II. Literature Review ..........................................................................................4
College Students and Recreation ............................................................................................4
Hunting as Recreation ............................................................................................................5
Barriers to Recreation .............................................................................................................6
Barriers to Hunting .................................................................................................................8
Hunter Recruitment Programs .............................................................................................. 12
A Profile for Recruitment ..................................................................................................... 15
Purpose of Research . ………………………………………………………………………16
III. Methods………………………………………………………………….. 18
Objective 1 ............................................................................................................................ 18
Objective 2 ............................................................................................................................ 18
Site Description .................................................................................................................... 19
Study Implementation ........................................................................................................... 20
Data Analysis ........................................................................................................................ 25
Limitations ............................................................................................................................ 26
IV. Results…………………………………………………………………….. .27
Demographics ....................................................................................................................... 27
Barrier Analysis .................................................................................................................... 28
Environmentally Inclined/ Environmentally Indifferent Groups .......................................... 33
Potential Hunter Group ......................................................................................................... 35
V. Discussion………………………………………………………………… 39
Barriers ................................................................................................................................ 39
Gender .................................................................................................................................. 39
Residence Type .................................................................................................................... 41
Environmentally Inclined/ Environmentally Indifferent Groups .......................................... 42
Potential Hunter Group ......................................................................................................... 43
Conclusions and Recommendations ..................................................................................... 46

vii
List of References ……………………………………………………………50
Appendices…………………………………………………………………….. 58
Appendix A: Survey Instrument ........................................................................................... 58
Appendix B: Non-Response Bias Check Instrument ............................................................ 65

viii
LIST OF TABLES
TABLE PAGE
1. Number of invitations to participate sent to Kentucky universities ...........22
2. Comparison of full survey and non-response check survey ......................24
3. Statistical analysis of demographic differences among respondents
by university...............................................................................................25
4. Barriers for Kentucky college students who hunted 2011-2013 ................29
5. Relationship of barriers to hunting for number of times hunted
2011-2013 ..................................................................................................30
6. Significant relationships of barriers to hunting and gender .......................31
7. Significant relationships of barriers to hunting and residency type ...........33
8. Differences in lifestyle factors for Environmentally Inclined group
and Environmentally Indifferent group ....................................................34
9. Means of barriers and interest in hunting for Environmentally Inclined
group and Environmentally Indifferent group ...........................................36
10. Relationship of barriers to hunting and PH Group ....................................38
11. Means of barriers to hunting for those inside and outside PH Group ........38
12. Members of Potential Hunter and Environmentally Inclined groups ........48

ix
LIST OF FIGURES
FIGURE PAGE
1. Comparison of EKU, WKU, and NKU and sample demographics ...........27
2. Means of barrier variables for number of times hunted 2011-2013 .........31

1
Chapter 1
Introduction
Over the past several decades abundant research has been done in hunting as a
recreational activity. Much of the research in this area has focused on hunter recruitment
and retention. This includes the study of special populations in connection with hunting
including youth (Sofranko & Nolan, 2009), women (Heberlein, Serup, & Ericsson, 2008),
and race (Floyd & Lee, 2002). Studies that focus on hunter recruitment and retention are
vital considering the continual decline of hunter participation in the United States.
The decline of participation in hunting in the United States (US) has been fairly
consistent since the 1980’s. Even with declining participation numbers, a recent study
noted 79% of US Citizens surveyed still approve of legal hunting and 52% strongly
approved of legal hunting (Responsive Management, 2013). In addition, hunting pursuits
remain a vital contributor to the U.S. economy (U.S. Fish and Wildlife Service, 2012)
and play an important role in the management of wildlife resources (Riley, Decker, Enck,
Curtis, Lauber, & Brown, 2003; Campbell & Mackay, 2009). It is for these reasons that
there is great concern over falling hunter participation rates.
The economic impact of the hunting industry is also an undeniable factor when
considering hunter participation. According to the US Fish and Wildlife Service (2011),
American hunters contributed $33.7 billion to the US economy in a combination of trip
expenditures (food, transportation, lodging, etc.), guide fees, land use fees, equipment,
and hunting licenses among other things. A survey administered by the US Fish and
Wildlife Service every five years discovered that in 2011 American hunters spent $2,465
per hunter annually. This total is an increase of over $300 per hunter than when the

2
survey was produced in 2006 (USFWS, 2012). In 2011, hunters in the commonwealth of
Kentucky (the state examined in this study) spent $798 million on hunting and hunting
related activities.
Today regulated hunting is the basis for the model of modern wildlife
conservation programs (Heffelfinger, Geist, & Wishart, 2013). Hunters purchase licenses
that help fund state fish and wildlife agencies. Funds for state and federal wildlife
agencies are also generated through a 10% tax on ammunition and firearms as well as
other hunting related products (Pittman-Robertson Act, 1937). These fish and wildlife
agencies are responsible for game species which hunters and fishermen pursue, and
oversee the management of non-game species. In Kentucky, over half of the annual
budget for the Kentucky Department of Fish and Wildlife Resources comes directly from
the sale of hunting and fishing licenses (KDFWR, 2012). As long as this system of
funding exists, it is imperative for the conservation of all wildlife species that hunting
remains a viable activity.
Another consideration when understanding the importance of hunting is the
connection hunting provides between the natural environment and the hunter. Modern
society is increasingly disconnected from the natural environmental surroundings. This
lack of connection with the natural environment leads to behavior that shows little
concern for the health of nature. Studies have shown that outdoor recreation opportunities
(Larson, Whiting, & Green, 2011) and participation in outdoor recreation activities are
positively associated with pro-environmental attitudes and behaviors (Tarrant & Green
1999; Dunlap & Heffernan,1975). As people interact with the outdoors, it increases their
awareness of natural resources and the importance of protecting those resources. As an

3
outdoor recreation activity, hunting may provide a connection to the environment that
leads greater pro-environmental attitudes and behaviors. However, as previously stated,
the number of hunters in the US has declined since the 1980s. A society with declining
hunter participation may also be a society where pro-environmental behaviors are less
important.
Many recruitment efforts seek to identify and target populations with lower rates
of participation. Youth, women, minority groups, and special interest groups are typical
hunter recruitment targets. It was discovered that the 18-24 year age bracket is an
extremely inactive age group when it comes to hunter participation (Winkler & Warnke
2013). This age group closely relates to the age of traditional college students, however,
little research has been published in the area of recruitment and retention specifically
targeting college students. This dearth of information in the current body of research may
provide insight on ways to improve hunter participation in the future. If management
agencies are able to remove or hunting barriers for this group, college students may
represent a significant underrepresented hunting population, which can bolster hunter
recruitment and retention numbers in the United States. This study seeks to identify
barriers to hunting for college students and discover a profile for ideal hunter recruits
within this population to aid management agencies in this effort.

4
Chapter 2
Literature Review
College Students and Recreation
Traditional college students, generally associated with the ages of 18-24, have
ample opportunity for recreation. According to the Bureau of Labor Statistics American
Time Survey (2014), college students spend more time daily on leisure and sports
activities (4 hours) than either educational activities (3.3 hours) or work activities (2.5
hours). Leisure time is nearly the largest category of time use for college students, second
only to sleeping (8 hours). Common recreation activities for college students include
sports activities, outdoor recreation, exercise, and sedentary activities (reading, video
games, etc). There is concern for the growing amount of sedentary leisure time for
college students (Pauline, 2013; Mokdad, Serdula, Dietz, Bowman, Marks, & Koplan,
1999).
The college years are a formative time for students. Patterns of behavior that are
formed during this time often shape adulthood activity and choices (Sparling & Snow,
2002). This could be said for recreational choices as well. Introduction to new
recreational activities during the college years may prove to be lasting in the years that
follow the college experience. Though hunting is a historically traditional activity to the
majority of college students it is a novel idea for recreation. College may be an ideal time
for recruitment into this historical and important recreation activity.
5
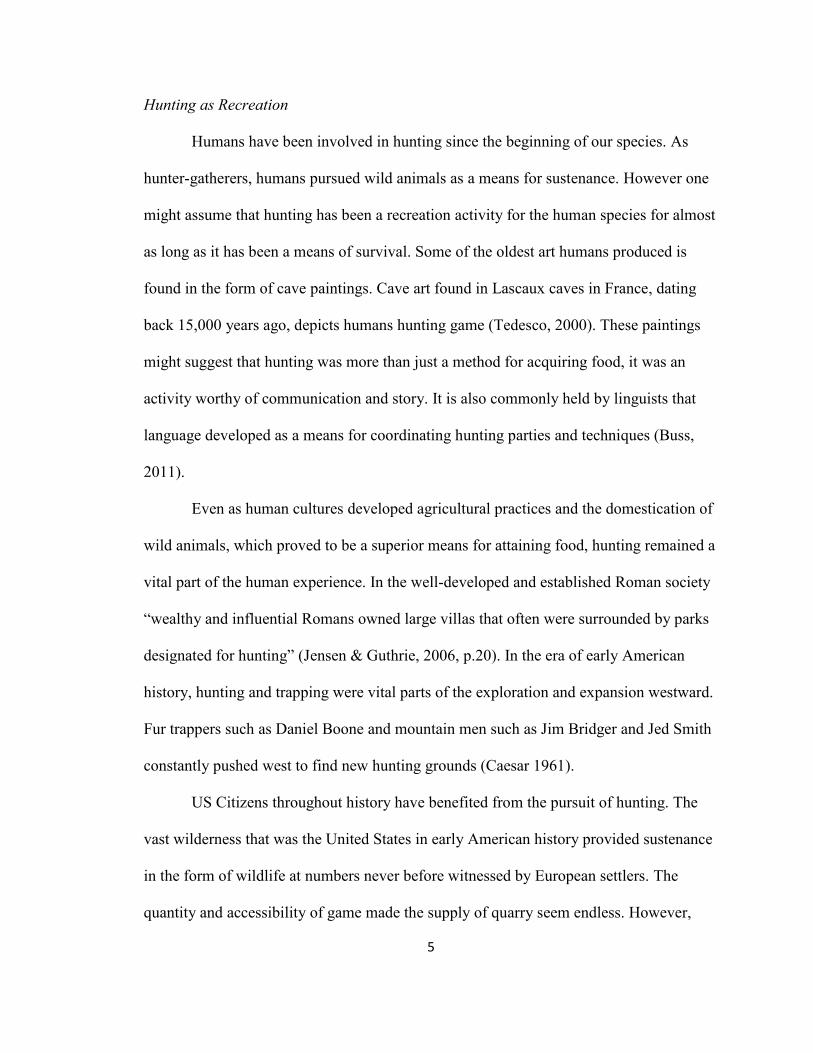
Hunting as Recreation
Humans have been involved in hunting since the beginning of our species. As
hunter-gatherers, humans pursued wild animals as a means for sustenance. However one
might assume that hunting has been a recreation activity for the human species for almost
as long as it has been a means of survival. Some of the oldest art humans produced is
found in the form of cave paintings. Cave art found in Lascaux caves in France, dating
back 15,000 years ago, depicts humans hunting game (Tedesco, 2000). These paintings
might suggest that hunting was more than just a method for acquiring food, it was an
activity worthy of communication and story. It is also commonly held by linguists that
language developed as a means for coordinating hunting parties and techniques (Buss,
2011).
Even as human cultures developed agricultural practices and the domestication of
wild animals, which proved to be a superior means for attaining food, hunting remained a
vital part of the human experience. In the well-developed and established Roman society
“wealthy and influential Romans owned large villas that often were surrounded by parks
designated for hunting” (Jensen & Guthrie, 2006, p.20). In the era of early American
history, hunting and trapping were vital parts of the exploration and expansion westward.
Fur trappers such as Daniel Boone and mountain men such as Jim Bridger and Jed Smith
constantly pushed west to find new hunting grounds (Caesar 1961).
US Citizens throughout history have benefited from the pursuit of hunting. The
vast wilderness that was the United States in early American history provided sustenance
in the form of wildlife at numbers never before witnessed by European settlers. The
quantity and accessibility of game made the supply of quarry seem endless. However,
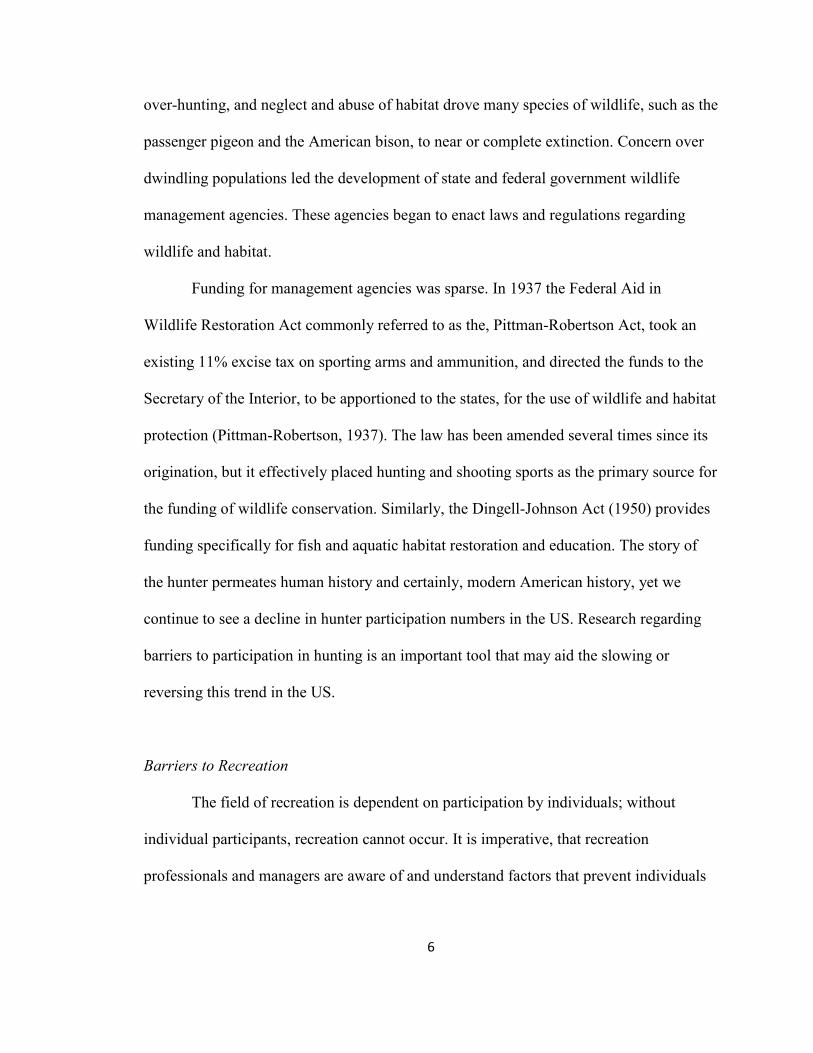
6
over-hunting, and neglect and abuse of habitat drove many species of wildlife, such as the
passenger pigeon and the American bison, to near or complete extinction. Concern over
dwindling populations led the development of state and federal government wildlife
management agencies. These agencies began to enact laws and regulations regarding
wildlife and habitat.
Funding for management agencies was sparse. In 1937 the Federal Aid in
Wildlife Restoration Act commonly referred to as the, Pittman-Robertson Act, took an
existing 11% excise tax on sporting arms and ammunition, and directed the funds to the
Secretary of the Interior, to be apportioned to the states, for the use of wildlife and habitat
protection (Pittman-Robertson, 1937). The law has been amended several times since its
origination, but it effectively placed hunting and shooting sports as the primary source for
the funding of wildlife conservation. Similarly, the Dingell-Johnson Act (1950) provides
funding specifically for fish and aquatic habitat restoration and education. The story of
the hunter permeates human history and certainly, modern American history, yet we
continue to see a decline in hunter participation numbers in the US. Research regarding
barriers to participation in hunting is an important tool that may aid the slowing or
reversing this trend in the US.
Barriers to Recreation
The field of recreation is dependent on participation by individuals; without
individual participants, recreation cannot occur. It is imperative, that recreation
professionals and managers are aware of and understand factors that prevent individuals

7
from participating in a given activity. By recognizing these factors managers may
proactively address these issues that make the pathway to their services complicated.
Early research in this area referred to these factors as “barriers” to recreation,
though “constraints” may be a more appropriate term. Jackson (1991) suggests the term
“constraints” refers to a much broader group of recognized issues that lead one to non-
participation in recreation or leisure where as “barriers” indicates specific types of
constraints that intervene or prevent participation. While this debate exists in past
research, this study uses the term “barrier” as it is as a more readily recognizable term for
the general public and the subjects of the study. Recreation and leisure barriers have been
defined as “factors that inhibit people’s ability to participate in leisure activities, to spend
more time doing so, to take advantage of leisure services or to achieve a desired level of
satisfaction” (Jackson, 1988, p.203).
The concept of barriers to recreation is a complicated issue. There are many
variables to consider with regards to participation in recreation. Recent analysis has
revealed a major divide in the opportunity to participate in outdoor recreation along the
lines of ethnicity, gender, residency location, and age groups (Ghimire, Green, Poudyal,
Cordell, 2014). In addition, barriers and participation do not necessarily operate in an
inverse relationship (Wright, Rodgers, & Backman, 2001); therefore, the absence of
barriers to recreation does not guarantee and an individual’s participation. In the same
way the presence of barriers does not guarantee nonparticipation in an activity. Research
shows that an individual’s perception of an activity as significant may negate the
presence of a constraint (Kay & Jackson, 1991; Shaw, Bonen, & McCabe, 1991).

8
Barriers to Hunting
The number of hunters in the United States has seen a decline over the past
several decades, exemplified by the number of paying license holders has decreasing
almost every year since the 1980’s (Robinson & Ridenour, 2012). From the late 1970’s to
2003 annual hunting license purchases fell approximately 25% (Robinson et. al. 2012). In
2006 hunter participation reached a low of 12.5 million participants, roughly 5% of the
US population (USFWS, 2012).
However, according to the 2011 National Survey of Fishing, Hunting, and
Wildlife-Associated Recreation (2012), hunter participation numbers increased to 13.7
million participants or 6% of the population. According to a report by Responsive
Management (2013), there is no single reason for this recent increase, but likely it is a
result of a combination of factors. Reasons may include: “economic factors and the
building industry, the desire to hunt and fish to obtain a natural or ‘green’ food as well as
to supplement food budgets, and even the weather” (Responsive Management, 2013).
The recent increase participation is significant and encouraging as it represents the only
increase in participation numbers since the US Fish and Wildlife Service began this
survey. Yet, participation levels are still well below the peak of the hunting population of
16.7 million people in 1982 (Winkler & Warnke, 2013).
The understanding of why hunter participation numbers are in decline is
incomplete; there are a number of theories that have been suggested. One of the most
significant barriers for recreation in America, including hunting, is a lack of discretionary
time w. Miller and Vaske (2003) reported that 21% of survey respondents cited time as a
significant barrier; the most for perceived barriers to hunting. Responsive Management

9
(2008) found 29% of hunters surveyed listed lack of time as a cause for decreasing
hunting participation over a five year period, second only to age and/or poor health.
A possible explanation for this decrease in time available may be that Americans
report spending more time at work. In her book, The Overworked American (1997),
Juliet Schor writes that in 1990 Americans worked one month more per year than in
1970. Americans spend more time at work, have less discretionary time for leisure, take
fewer vacations, are more likely to work late nights or weekends, and are more likely to
feel pressured for time than other countries of similar affluence (Hamermesh, 2014).
Beyond spending more time at work, other time constraints exist for US Citizens.
Wright et. al (2001) grouped family and work commitments together and found that those
who had decreased participation in hunting were more likely to cite family and work
commitments as barriers. Family time commitments such as caring for family members,
attending family member leisure activities (youth sports, etc.), and household activities
limit time for individual recreation activities.
Costs can be another significant barrier to hunting. In 2011, US Citizens spent an
average of $2,465 per hunter (USFWS, 2012). This amount includes expenditures for
hunting licenses, transportation, guide fees, equipment, memberships, private land leases,
and various other related items. For many, the thought of spending upwards of $2,000 for
a recreational activity is daunting. This is especially true for those new to the activity and
are required to make the initial investment in equipment and supplies. Miller & Vaske
(2003) reported that “lack of financial resources” was commonly cited as a perceived
personal barrier.
10
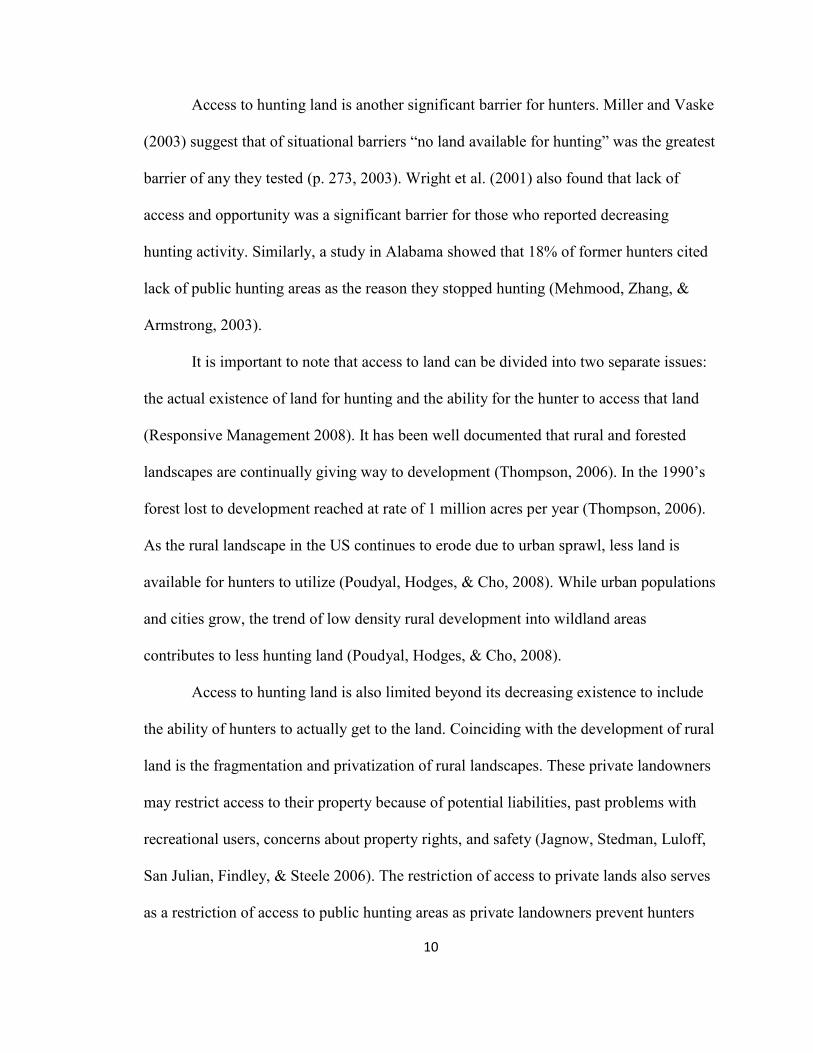
Access to hunting land is another significant barrier for hunters. Miller and Vaske
(2003) suggest that of situational barriers “no land available for hunting” was the greatest
barrier of any they tested (p. 273, 2003). Wright et al. (2001) also found that lack of
access and opportunity was a significant barrier for those who reported decreasing
hunting activity. Similarly, a study in Alabama showed that 18% of former hunters cited
lack of public hunting areas as the reason they stopped hunting (Mehmood, Zhang, &
Armstrong, 2003).
It is important to note that access to land can be divided into two separate issues:
the actual existence of land for hunting and the ability for the hunter to access that land
(Responsive Management 2008). It has been well documented that rural and forested
landscapes are continually giving way to development (Thompson, 2006). In the 1990’s
forest lost to development reached at rate of 1 million acres per year (Thompson, 2006).
As the rural landscape in the US continues to erode due to urban sprawl, less land is
available for hunters to utilize (Poudyal, Hodges, & Cho, 2008). While urban populations
and cities grow, the trend of low density rural development into wildland areas
contributes to less hunting land (Poudyal, Hodges, & Cho, 2008).
Access to hunting land is also limited beyond its decreasing existence to include
the ability of hunters to actually get to the land. Coinciding with the development of rural
land is the fragmentation and privatization of rural landscapes. These private landowners
may restrict access to their property because of potential liabilities, past problems with
recreational users, concerns about property rights, and safety (Jagnow, Stedman, Luloff,
San Julian, Findley, & Steele 2006). The restriction of access to private lands also serves
as a restriction of access to public hunting areas as private landowners prevent hunters
11
from passing through to reach public land. It has also been proposed that there is less
access to private land for hunting due to changes in agricultural practices and shifting
public values (Miller, 2002).
The urbanization of the United States also resonates with the cultural shift to more
urbanized family life. According the US Census Bureau 80.7 % of US Citizens live in
urban areas (US Census Bureau, 2012). It has been suggested that one of the most
significant indicators for hunter participation as youth is introduction to the activity by
parents (Heberlein, 1987; Sofranko & Nolan, 2009; Winkler & Warnke, 2013). With the
urbanization of family life, adults have less access to hunting land and therefore have less
opportunity to pass down hunting traditions. Also individuals are more likely to
participate in a recreational activity, including hunting, if peers participate (Shultz,
Millspaugh, Zekor, & Washburn, 2003) but with less rural land to roam, fewer youth are
interested in hunting and fewer of their friends are influenced to participate.
Another barrier to participation in hunting stems from the changing world of
information and technology. Hi his book Last Child in the Woods, Richard Louv (2008)
suggests that children are spending less time outside for recreation, which creates what he
terms a nature deficit disorder. In this theory the decrease in outdoor play results in a
lack of curiosity about nature and wildlife. As a result, children become less connected to
the natural world and may be less likely to participate in activities that connect humans to
nature. Hunting at its base is a human-nature interaction and currently, fewer children are
experiencing this interaction than have in decades past.
Backman & Wright (1993) found that lack of interest was a significant barrier for
participating in hunting. The most common avenue for development of interest to hunting
12
comes as young children are mentored by family members or close friends (Bissel, Duda,
& Young, 1998). Research also shows that past hunting experience serves as a significant
predictor for future hunting participation (Miller & Vaske, 2003). As fewer children are
introduced to the outdoors, specifically hunting, future participation for these individuals
as adults is less likely.
Finally, it has been suggested that the most significant predictor for hunter
participation was the age of the individual and that an aging population was a significant
factor in hunter decline (Winkler & Warnke. 2013). As a greater number of baby
boomers reach an age where it is physically more difficult to participate in hunting, the
number of total participants also decreases. The decline of the baby boom generation is
particularly troubling to hunting advocates, as the problem of hunter decline is much
more complicated than a simple aging population. Winkler et al. (2013) suggest that
while the aging population may not be a singular factor for hunter decline it at the very
least will compound the problem for the foreseeable future as more and more baby
boomers reach an age where they are physically no longer able to hunt.
Hunter Recruitment Programs
Currently, many specific efforts of hunter recruitment and retention focus on
youth (Gude, Cunningham, Herbert & Baumeister, 2011), women, or minority groups
(Ryan & Shaw, 2011). This reveals a common hunter recruitment method; identifying
populations who traditionally have lower rates of hunter participation and develop
programs to increase participation.
13
One of the most traditional methods of hunter recruitment is to focus on
developing programs for youth. Research suggests that 80% of hunters are introduced
into hunting at a young age through relationships with family and friends (Ryan & Shaw,
2011). Because of this, much time, effort, and resources have been directed toward
establishing youth hunter development programs. Most of these programs take the form
of some type of mentor relationship. The Merriam-Webster Diction (2015) defines
mentor as “a trusted counselor or guide.” With declining hunting participation numbers
there are fewer of these natural family hunting mentor relationships. Agencies and
advocacy groups seek opportunities to set up youth with willing adults to form a
mentorship. However, it has also been shown that without the continued social support
from a mentor that helps create a “hunter identity,” mentorship programs with youth may
be limited (Enck, Decker, & Brown, 2000). Youth recruitment efforts in Kentucky are
included to some degree through the National Archery in the School Program, Explore
Bowhunting, KDFWR Conservation Camps, Project WILD, and specific youth mentor
hunts.
Agencies also recognize the lack of diversity of ethnic groups that participate in
hunting. Traditionally, those who participate in hunting have been described as middle
aged white males from a rural background (Ryan & Shaw, 2011). Hispanics and African
Americans are significantly less likely to purchase hunting and fishing licenses (Floyd &
Lee, 2002). In 2011, 94% of those who reported hunting were white (USFWS, 2012).
Thomas, Lueck, and Farrell (2007) explain that for minorities a shortage of role models,
lack of education about hunting, and feeling unwelcome are significant barriers for
participation. It has also been suggested that a lack of historical or cultural connection to
14
hunting is a significant issue for recruiting African American or Hispanic individuals
(Ryan & Shaw, 2011). There have been several attempts at seeking minority group
hunting recruits however many of them have been unsuccessful to this point (DJ Case &
Associates, 2009).
As most traditional hunters are males, specific efforts have been made to recruit
more females. Programs such as Becoming an Outdoors- Woman (BOW) have been
somewhat successful at introducing women to hunting and creating the social
environment that leads to a hunter identity (Ryan & Shaw, 2011). It may be that
programs like BOW are the reason behind the national trend of increased female
participation (Bissel et. al, 1998) though the percentage of female hunters remains very
low (11%) despite decades of targeted effort (Larson, Stedman, Decker, Siemer, &
Baumer, 2014; USFWS, 2012). In addition, others have suggested that women tend to
participate in hunting as a means for activity with husbands or significant others (Schorr,
Lukacus, & Gude, 2014; Adams & Steen, 1997). These ideas imply the importance of
mentor or social relationships for hunting participation for females.
Another current trend in hunter recruitment is the placement of hunting as a
sustainable and organic food source (Pontius, Greenwood, Ryan, & Greenwood, 2013;
Tidball, Tidball, & Curtis, 2013). This approach seeks to recruit individuals who see the
value of local and organic food choices and introduce them to hunting and fishing as an
opportunity to harvest meat in an environmentally friendly manner. These individuals,
often termed “locavores” seek to enjoy what they eat while understanding the
implications their choices have on the environment (Tidball et. al, 2013). It is fitting then
that some locavores are beginning to view hunting as a sustainable source for food. An
15
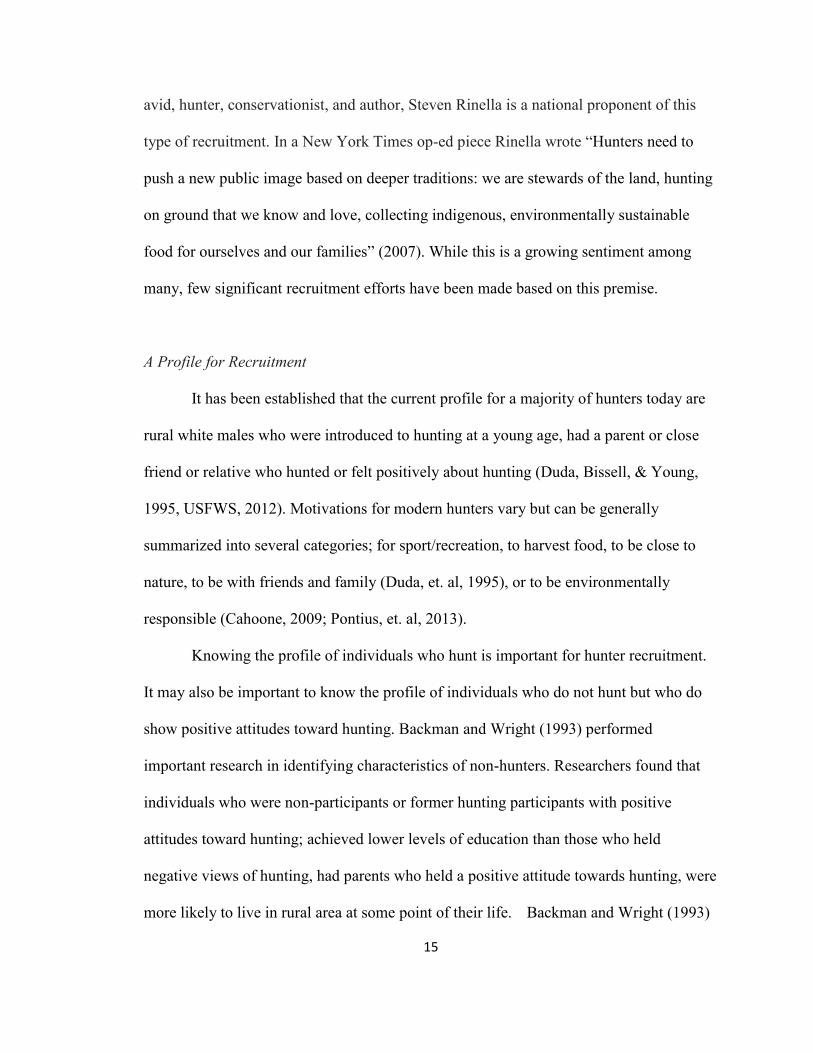
avid, hunter, conservationist, and author, Steven Rinella is a national proponent of this
type of recruitment. In a New York Times op-ed piece Rinella wrote “Hunters need to
push a new public image based on deeper traditions: we are stewards of the land, hunting
on ground that we know and love, collecting indigenous, environmentally sustainable
food for ourselves and our families” (2007). While this is a growing sentiment among
many, few significant recruitment efforts have been made based on this premise.
A Profile for Recruitment
It has been established that the current profile for a majority of hunters today are
rural white males who were introduced to hunting at a young age, had a parent or close
friend or relative who hunted or felt positively about hunting (Duda, Bissell, & Young,
1995, USFWS, 2012). Motivations for modern hunters vary but can be generally
summarized into several categories; for sport/recreation, to harvest food, to be close to
nature, to be with friends and family (Duda, et. al, 1995), or to be environmentally
responsible (Cahoone, 2009; Pontius, et. al, 2013).
Knowing the profile of individuals who hunt is important for hunter recruitment.
It may also be important to know the profile of individuals who do not hunt but who do
show positive attitudes toward hunting. Backman and Wright (1993) performed
important research in identifying characteristics of non-hunters. Researchers found that
individuals who were non-participants or former hunting participants with positive
attitudes toward hunting; achieved lower levels of education than those who held
negative views of hunting, had parents who held a positive attitude towards hunting, were
more likely to live in rural area at some point of their life. Backman and Wright (1993)
16
also noted that lack of interest, and lack of opportunity for hunting were more significant
barriers for non-hunters.
Understanding the profile of individuals who may be interested in hunting but
who do not participate in hunting is important for the conservation of wildlife. Currently,
funding for the agencies charged with protection and conservation of wildlife is tied
directly to hunter participation. As participation rates decline, new programs for the
recruitment and retention of various demographics that are underrepresented in the
hunting population are necessary. This study seeks to better understand barriers to
hunting for the specific population of college students to better aid recruitment efforts.
Purpose of Research
While a significant amount of research has been done to study hunter decline and
the factors that cause it, little has been directed to the study college students. It was
discovered that the 18-24 year age bracket is the least active group when it comes to
hunter participation (Winkler & Warnke 2013). Specifically, researchers have found that
male hunters were relatively active at age 15, but a significant drop in participation
occurred between the ages of 18 and 24, before a leveling off period between ages 25-51.
A larger drop in participation again occurred after age 65, when more hunters reached an
age where they were no longer able to hunt.
The time when hunters were least likely to be active is between the ages of 18-
24. This gap in hunting activity correlates most directly with the age of most traditional
college students. It is important for wildlife and recreation managers to understand the
barriers specific for this cohort group to make participation in hunting more accessible.

17
This segment of the population may include a higher number of potential hunters that are
currently inactive.
To provide necessary information, it is also important then to identify
characteristics for individuals who display a propensity for participation in hunting so
that a profile may be developed to aid conservation agencies in their recruitment of
college students as hunters. This is especially important to state agencies such as the
Kentucky Department of Fish and Wildlife Resources that has developed a small program
for recruitment of college students. The “Hunter’s Legacy” program coordinates the
introduction of experienced hunters with non-experienced hunters on college campuses in
order to introduce individuals to hunting. This is a mentor-based program complete with
hunter education instruction culminating with a mentored hunt. The Hunter’s Legacy
program started in 2012 with 12 participants and mentors and has grown each subsequent
year. In order for programs such as this to reach full potential, researcher must identify
ideal student candidates for recruitment and continued participation must be identified.

18
Chapter 3
Methods
Purpose Statement:
The purpose of this study is to identify barriers to hunting as a recreation activity, as well
as identify lifestyle factors that can be used to create a profile of college students who are
ideal for hunter recruitment efforts.
Objective 1. To identify barriers which prevent college students in Kentucky from
participating in hunting as a recreational activity
Hypotheses
H1a - The number of students who approve of hunting as a recreational activity is greater
than the number of students who participate in hunting.
H1b - Time and money are the greatest barriers to hunting for college students who
reported hunting within the last three years.
H1c - Those who reported no hunting within the last three years, showed Lack of Interest
as a significant barrier to hunting.
Objective 2. To identify a group of students who are ideal candidates for hunting
recruitment.
Hypotheses
H2a - Students who rate “environmentally friendly” behaviors as important lifestyle
factors will be more interested in hunting than those who rate these factors as less
important.

19
H2b - Presenting hunting as a social activity increases the interest of participation for the
“environmentally friendly” behavior profile group.
H2c – There will be a large group of students who express interest in hunting but have
participated 0 times from 2011 through 2013.
Site Description
College students from three Kentucky universities were identified as the target
population for this study. Invitations to participate in the study were sent by email to
students at Eastern Kentucky University (EKU), Western Kentucky University (WKU),
and Northern Kentucky University (NKU). These universities were chosen specifically to
gain access to a population sample with varied geographic distribution through the
regions of service for each university. These schools also serve varied demographics as
EKU and WKU students tend to come from more rural areas and NKU students come
from a more urban area close to Cincinnati, OH.
EKU is located in Richmond, Kentucky (population 30,000) in the central part of
the commonwealth. In 2013 EKU had a total enrollment of 16, 111 students. The
university population is 83% white. In 2013, 13,546 students were residents of the
commonwealth of Kentucky. Of these 13, 546, 49% held residence in the EKU service
region comprised of the rural southeastern Kentucky counties.
WKU is located in the western part of the commonwealth in Bowling Green
Kentucky (population 60,000), the third larges city in the commonwealth. WKU had a
total enrollment of 20,546 in 2013. The university population is 77% white. 16,088
students were residents of the commonwealth of Kentucky with 10,726 (52%) of the
20
students coming from the WKU area of geographic responsibility in the western part of
the commonwealth. Many of the counties in the WKU region of service are rural in
nature.
NKU is located in the northern part of the commonwealth in Highland Heights
Kentucky just south of the Kentucky/Ohio border south of Cincinnati, OH area. The 2013
enrollment for NKU was 15,283 students. 12,677 (83%) of students were white. NKU
serves the eight northern most counties in Kentucky. Close to 80% ( of their students in
2013 made their permanent residence in this area with the largest percentage of students
originating from the Kentucky counties that make up the greater Cincinnati, Ohio area.
Study Implementation
The survey questionnaire contained six sections (See Appendix A) and questions
for the survey were developed with the help of the KDFWR employees. Individual
questions were formed with consideration to previous surveys related to hunter
recruitment and retention as well as areas of particular interest for the KDFWR.
Section one was designed to establish recent experience with hunting and fishing
and plans for hunting and fishing in the coming year. (Note: While fishing was not the
primary focus of this study, hunting and fishing are often grouped together as related
activities, and thus both were included to compare participation levels of the two
activities. The focus of this study is hunting and Section One is the only section that
contained questions related to fishing). It included four questions. Section two consisted
of ten questions involving various lifestyle factors that influence recreation habits.
Participants rated each barrier on a five point Likert scale from “Not Important” to “Very

21
Important.” The third section of three questions dealt specifically with the participant’s
opinion of hunting as a recreation activity. Section four consisted of two questions that
addressed the participant’s opinion on hunting as a means for gathering food. The fifth
section contained 11 questions and dealt with two areas. The first nine questions
addressed specific barriers to hunting for the individual. Participants rated each barrier on
a five point Likert scale from “Not a Barrier for Me” to “A Significant Barrier for Me.”
The last two questions of section five dealt with the interest level in hunting based on
social factors. The final section of the survey, eight questions, asked for demographics of
the individual participant. Finally, the last page of the survey provided a place for the
participant to enter his or her email address to be a part of the random drawing for a
$50.00 Visa gift card.
The survey instrument was first tested on five individuals for length and clarity of
question. A pilot study was then conducted to identify complications within the survey
instrument. Sixty-three individuals within the Department of Recreation and Park
Administration at Eastern Kentucky University participated in the pilot study.
Finally an invitation to participate in the final research survey was sent to students
at each of the three identified universities. A total of 27,529 individuals received
invitations via email to participate in the online survey (Table 1). The number of survey
invitations distributed to each university was based on access to student email addresses
that individual institutions granted to the researcher through each university’s
Institutional Review Board.

22
Table 1
Number of invitations to participate sent to Kentucky universities
Number of Invitations
Western Kentucky University 18,852
Northern Kentucky University 7,048
Eastern Kentucky University 1,629
This study was conducted as an online survey with invitations to participate sent
by email. Initial invitations to participate were sent out in the spring of 2014. The first
email invitation was sent to WKU and EKU students on March 26th, 2014 and to NKU on
April 17th, 2014. Two Follow-up or reminder invitations were sent out to WKU and EKU
at two week intervals and in one and half week intervals for NKU because of the
proximity to the end of the semester.
The invitation email contained plain text explaining the nature of the research
study and a link to access the survey on a Qualtrics (an online survey program) website.
The subject of each email contained the title: “A 10 minute survey could earn you a $50
Visa Gift Card.” A significant limitation of internet surveys is the response rate because
of the ease of disregard for the invitation to participate. In order to encourage responses
to a survey that may have otherwise been of no interest to the individual participants an
incentive was offered. The incentive of a $50.00 Visa Gift Card was provided by the
Kentucky Department of Fish and Wildlife Resources (KDFWR) and was administered
by a random drawing. Upon completion of the survey participants were given the option

23
to enter their email address to be included in the random drawing. All email addresses
were destroyed after the random drawing took place.
Of the 27,529 invitations to participate 3,128 (11%) total surveys were returned
with 2,804 completed for a total response rate of 10%. As Vaske (2008) suggests, low
response rates warranted a non-response bias check (See Appendix B) which was
initiated. Since no other contact information was available for the sample, a follow up
email with a shortened survey was offered to those who did not respond to the original
invitation to participate.
A total of 247 individuals participated in the non-response bias check survey. Of
the questions asked on both surveys, no meaningful difference existed between the results
of the non-bias check and the original survey (Table 2). Vaske (2008) and others
(Crompton & Tian-Cole, 2001) note that an effective non-response bias check may be
more important than a high response rate in allowing for confidence in survey results.
Additionally statistical analysis was performed to determine if results were
skewed in any way because of differences in the number of responses from the three
universities. No meaningful relationships existed for demographic variables or the
cluster analysis that was performed in this study (Table 3). Strength of relationship was
determined using eta () and Cramer’s V (Vaske, 2008 p. 108; Gravetter & Wallnau
2004 p. 605).

24
Table 2
Comparison of full survey and non-response check survey
Full Survey
Non-Response
Check
Mean SD Mean SD d
Interested in Huntinga 3.12 1.48 3.53 1.40 .285
Interested in Hunting with
Groupa 3.05 1.43 3.58 1.31 .386
Timeb 3.26 1.40 3.02 1.58 .161
Knowledgeb 3.10 1.46 2.98 1.59 .079
Safetyb 2.43 1.3 2.36 1.52 .050
Age 24.71 8.72 27.26 10.24 .268
Full Survey
Non-Response
Check X2 df p
Male 32.4 30.9 1.93 1 .159
Female 67.6 69.1
White 86.1 88.6 1.461 1 .227
Non-White 13.9 11.4
a Scale: 1= strongly agree 5=strongly disagree
b Scale 1=Definitely not a barrier for me 5=A significant barrier for me

25
Data Analysis
Analysis on the data gathered in this survey was performed in a number of ways.
Frequency and descriptive statistics were used to identify key barriers to hunting among
college students in Kentucky. In addition, a cluster analysis was used to divide
participants into purposeful groups. The primary goal in this endeavor was to identify
specific variables that are associated with an “environmentally friendly” attitude. The
cluster analysis then forced each individual into a group that was considered
environmentally friendly or not environmentally friendly. Combining several variables
that expressed a respondent’s interest and level of participation in hunting a Potential
Hunter (PH) variable was created. Finally, One-Way ANOVA was also used to identify
Table 3
Statistical analysis of demographic differences among respondents by university
Chi-Square
Effect size
X2 df n p Cramer’s V
Gender 12.05 2 2804 0.002 0.066
Race 20.556 2 2804 0.000 0.086
ANOVA
F df n p
Age 15.472 2 2804 0.000 0.105
PH Group 3.077 2 2804 .046 .047
EINC
Cluster .030 2 2804 .970 .005

26
relationships among variables. Eta was used to determine effect size of significant
relationships found using One-Way ANOVA as suggested by Vaske (2008).
Limitations
There are several limitations to this study, the first was the method of survey
administration. While invitations to participate in the survey were sent without bias those
who chose to participate in the survey may have already had some association with
hunting. Students who had no interest in hunting may have seen the invitation to
participate in a survey about hunting in Kentucky, and disregarded the invitation
altogether.
It is also possible that the date or timing of invitation to participate in the survey
caused some students not to participate. With some universities on spring break or just
returning from spring break many may have disregarded the invitation to participate. The
same could be true for the academic calendar with regard to midterms or finals before
dismissal of the spring semester.
This study was implemented in the commonwealth of KY at three specific
universities. It is possible that results may not be representative of other states or
universities.

27
Chapter 4
Results
Demographics
Of the 2,804 respondents to the survey 67.6% (n=1,895) were female and 32.4% (n=909)
were male. For the ethnicity variable, 86.1% (n=2,413) of the participants described
themselves as white, 5.5% (n=154) described themselves as black, 3.6% (n=100)
described themselves as two or more races, and 2.6% (n=74) described themselves as
Asian with the remainder of the respondents selecting other race. Of the three universities
Western Kentucky University made up the largest percentage of the sample at 65.4%
(n=1,833), followed by Northern Kentucky University at 21.6% (n=607), and Eastern
Kentucky University at 13% (n=364). Respondents were equally divided on urban
(50.6% n=1,420) or rural (49.4% n=1,384) residency (urban defined as a population
greater than 30,000, rural less). Kentucky residents made up 80.1% (n=2,246) of the
respondents with Ohio (6.8% n=190) and Tennessee (4.9% n=136) the second and third
largest states of residence for the respondent population. The sample was overall
representative of the population surveyed (Figure 1).
0
20
40
60
80
100
Male Female White Black KY Resident
Pe
rce
ntg
e o
f To
tal
Sample PopulationFigure 1
Comparison of EKU, WKU, and NKU and sample demographics

28
Barrier Analysis
H1a states that the number of students who approve of hunting as a recreational
activity is greater than the number of students who participate in hunting. Data supported
this hypothesis. Of those students surveyed, 71% stated that they approved of legal
hunting on some level, with 44% reporting a strong approval of hunting. Students who
answered with some level of disapproval of hunting made up 11% of the sample. Further
confirming the general approval of hunting among college students in Kentucky, 17%
cited disapproval of hunting as some level of barrier to participation. In contrast to the
overwhelming approval of hunting, 70% of those surveyed had not participated in
hunting in the last three years (2011-2013) and only 25% of students had or planned to
participate in hunting in 2014.
H1b states that issues of time and money would be the greatest barriers to hunting
for college students in Kentucky who had participated in hunting over the previous three
years (2011-2013). This hypothesis was supported by the data. Not only did this group
report these variables as barriers, these are the only variables for which means were
greater than neutral (Table 4). Every other barrier variable had a mean of less than three
indicating that these variables were perceived as less of a barrier to their participation.
H1c states that those who reported no hunting in 2011-2013 showed Lack of
Interest as a significant barrier. ANOVA revealed statistically significant relationships
between certain barrier variables and number of times individuals had hunted in 2011-
2013. Significant relationships existed between number of times hunted in 2011 -2013
and Time, Knowledge, Cost of License, Cost of Equipment, Lack of Safety, Lack of Game,
Lack of Interest, and Disapproval of Hunting (Table 5). Lack of Interest, Knowledge,

29
Cost of Equipment, and Time were all perceived as barriers for those who did not hunt in
2011-2013 (Table 5). H1c, lack of interest in hunting is a significant barrier for those who
had not been hunting in 2011-2013 was supported.
According to Vaske (2008) effect size measurements of .243 - .370 reveal typical
relationships and of .371 or greater means a substantial relationship exists. Minimal
relationships between Hunting in 2011-2013 and the barriers of Cost of License and Lack
of Game existed (Table 5). Typical relationships existed for Time, and Lack of Safety.
Substantial relationships existed for Lack of Interest, Knowledge, and Disapproval of
Hunting. Though statistically significant relationships existed for Cost of Equipment and
Lack of Access the effect size revealed a less than minimal relationship.
Table 4
Barriers for Kentucky college students who hunted in 2011-2013
Barriers Mean SD
Time 3.81 1.188
Knowledge About Hunting 2.39 1.273
Cost of License 2.66 1.297
Cost of Equipment 3.09 1.317
Lack of Access 2.73 1.477
Lack of Safety 1.84 1.095
Lack of Game 2.22 1.125
Lack of Interest 1.87 1.179
Disapproval of Hunting 1.43 .88
Scale 1=Definitely not a barrier for me 5=A significant barrier for me

30
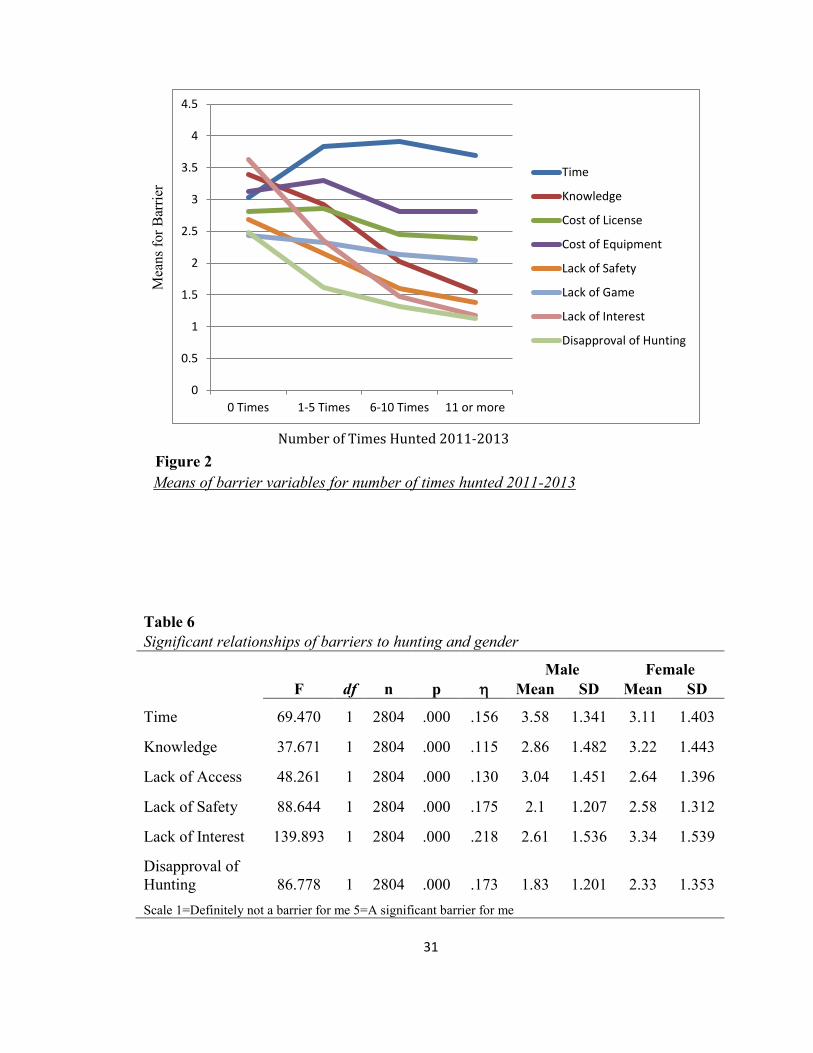
It is also significant that the means for many barrier variables differed based on
number of times an individual hunted in 2011-2013. A prime example is the barrier of
Knowledge about hunting. Means for Knowledge had an inverse relationship with amount
of days spent hunting. As the reported number of times in the field increased, reporting
Knowledge as a barrier decreased. Figure 2 shows this relationship is true for the barriers
Lack of Game, Lack of Interest, and Disapproval of Hunting.
Differences in barriers for different genders existed. ANOVA revealed
statistically significant relationship between gender and Time, Knowledge, Lack of
Access, Lack of Safety, Lack of Interest, and Disapproval of Hunting (Table 6). Males
reported Time and Lack of Access were significant barriers. Knowledge, Lack of Safety,
Lack of Interest, and Disapproval of Hunting were reported as more restrictive barriers
for females (Table 6).
Table 5
Relationship of barriers to hunting for number of times hunted 2011-2013
F df n p
Time 66.336 3 2812 0.000 0.257
Knowledge 174.257 3 2812 0.000 0.395
Cost of License 10.641 3 2812 0.000 0.106
Cost of Equipment 8.865 3 2812 0.000 0.009
Lack of Access 1.637 3 2812 0.179 0.002
Lack of Safety 115.718 3 2812 0.000 0.295
Lack of Game 11.129 3 2812 0.000 0.108
Lack of Interest 395.516 3 2812 0.000 0.510
Disapproval of Hunting 145.869 3 2812 0.000 0.355
31
Table 6
Significant relationships of barriers to hunting and gender
Male Female
F df n p Mean SD Mean SD
Time 69.470 1 2804 .000 .156 3.58 1.341 3.11 1.403
Knowledge 37.671 1 2804 .000 .115 2.86 1.482 3.22 1.443
Lack of Access 48.261 1 2804 .000 .130 3.04 1.451 2.64 1.396
Lack of Safety 88.644 1 2804 .000 .175 2.1 1.207 2.58 1.312
Lack of Interest 139.893 1 2804 .000 .218 2.61 1.536 3.34 1.539
Disapproval of
Hunting 86.778 1 2804 .000 .173 1.83 1.201 2.33 1.353
Scale 1=Definitely not a barrier for me 5=A significant barrier for me
0 Times 1-5 Times 6-10 Times 11 or more
0
0.5
1
1.5
2
2.5
3
3.5
4
4.5
Time
Knowledge
Cost of License
Cost of Equipment
Lack of Safety
Lack of Game
Lack of Interest
Disapproval of Hunting
Number of Times Hunted 2011-2013
Mea
ns
for
Bar
rier
Figure 2
Means of barrier variables for number of times hunted 2011-2013

32
The sample of college students in this study was made up of predominantly white
individuals (86%). This statistic is consistent with the population of the three universities
included in this study. Because of the low number of individuals of races other than white
who participated in this survey, for the purposes of this study ethnicity was simplified to
White/Non-white.
As with gender, ANOVA revealed statistically significant relationship between
barriers and ethnicity. Minimal relationships existed between ethnicity and barrier
variables for Time F(1,2804)=44.665, p=.000 (= .125), Lack of Safety
F(1,2804)=50.484, p=.000 (= .133), and Disapproval of Hunting F(1,2804)=43.767,
p=.000 (= .124). White students tended to report that Time (M=3.33, sd=1.373) was a
more significant barrier than non-white students (Time M=2.83, sd=1.488). Lack of Safety
and Disapproval of Hunting were greater barriers for non-white students; however,
means for these variables were less than neutral suggesting that they are relatively small
barriers for both white and non-white students.
Residence type proved to reveal the greatest differences in barriers for
demographic groups. ANOVA revealed minimal relationships between Residence Type
and Knowledge, Lack of Access, Lack of Safety, Lack of Game, Lack of Interest, and
Disapproval of Hunting (Table 7). Each of these barriers was greater for students whose
home residence was urban in nature.

33
Environmentally Inclined/ Environmentally Indifferent Groups
Cluster analysis of lifestyle factors revealed differences for college students
concerning environmentally friendly behaviors. A K-Means cluster using the ten
variables: Eating Healthy, Eating Locally Grown Foods, Eating Organic Foods,
Harvesting My Own Foods, Exercise, Being Active Outdoors, Enjoying Nature, Living in
an Environmentally Friendly Way, Activities that Challenge, and Activities with Friends
was performed. The results of the cluster analysis revealed two distinct groups. The
Environmentally Inclined (EINC) group (n=1,576) tended to report that environmentally
friendly behaviors were more important in their lifestyle as opposed to the
Environmentally Indifferent (EIND) group (n=1,322) who reported that environmentally
friendly behaviors were less important. Table 8 shows the means for each of these
lifestyle variables.
Table 7
Significant relationships of barriers to hunting and residency type
Urban Rural
F df n p Mean SD Mean SD
Knowledge 36.765 1 2804 .000 .114 3.26 1.472 2.93 1.439
Lack of Access 49.974 1 2804 .000 .132 2.96 1.434 2.58 1.393
Lack of Safety 61.778 1 2804 .000 .154 2.61 1.343 2.23 1.222
Lack of Game 44.339 1 2804 .000 .125 2.51 1.204 2.23 1.087
Lack of Interest 67.832 1 2804 .000 .154 3.34 1.558 2.86 1.557
Disapproval of
Hunting 102.624 1 2804 .000 .188 2.41 1.41 1.91 1.242
Scale 1=Definitely not a barrier for me 5=A significant barrier for me

34
ANOVA revealed statistically significant relationships between the EINC and
EIND clusters and Interested in Hunting F(1, 2,881)=31.443, p=.000. Examining effect
size showed the relationship was minimal (=.104). The EINC group agreed slightly
more (Table 8) with the statement “I am very interested in hunting as a recreational
activity” than did the EIND group. The EINC group also reported hunting slightly more
in 2011-2013 than the EIND group. There was also a minimal relationship (=.124)
between the EINC and EIND clusters and Number of Times Hunted F(1, 2,895)=45.381,
p=.000.
Table 8
Differences in lifestyle factors for Environmentally Inclined group and
Environmentally Indifferent group
Environmentally
Inclined
Environmentally
Indifferent
Lifestyle Factors Mean S.D.
Mean S.D.
Eating Healthy 4.69 .503
4.03 .799
Eating Local 4.33 .643
2.72 1.059
Eating Organic Foods 3.97 .963
2.19 1.016
Harvesting Own Food 3.82 1.060
1.92 .968
Exercise 4.59 .597
4.04 .880
Being Active Outdoors 4.66 .572
3.95 .936
Enjoying Nature 4.72 .495
4.08 .922
Environmentally
Friendly Living 4.57 .586
3.62 .966
Activities that Are
Challenging 4.47 .654
3.88 .911
Activities with Friends 4.58 .674 4.32 .829
Scale: 1=not important at all 5= very important

35
ANOVA also revealed statistically significant relationships between the barriers
Time F(1, 2828)=6.365, p=.012), Knowledge F(1, 2828)=12.043, p=.001), and Lack of
Interest F(1, 2828)=33.882, p=.000, and the clusters; with Lack of Interest (=.109) a
minimal relationship. Table 9 shows the EIND group reported Lack of Interest as more of
a barrier than did the EINC group. H2a “Students who rate “environmentally friendly
behaviors as important lifestyle factors will be more interested in hunting than those who
do not” was supported.
As Table 9 shows the EINC group showed slightly higher means for Interest in
Hunting with an Experienced Hunter and Interest in Hunting with a Group of Friends
than did the EIND group. These differences were statistically significant, (Interest in
Hunting with an Experienced Hunter F(1, 2828)= 26.651, p=.000 and Interest in Hunting
with a Group of Friends F(1, 2828)=11.668, p=.001) however, measures of association
revealed little relationship between these variables (=.097, =.064 respectively).
H2b “Students who rate “environmentally friendly” behaviors as important lifestyle
factors, will be more interested in participating in hunting as a social activity” was not
supported.
Potential Hunter Group
Using the variables Number of Times Hunted in 2011-2013 and Interested in
Hunting, Interested in Hunting with an Experienced Hunter, and Interested in Hunting
with a Group of Friends a Potential Hunter (PH) group was created. This variable was
designed to isolate respondents who expressed some level of interest in participating in
hunting, determined by responses of moderate or strong agreement with one or all of the
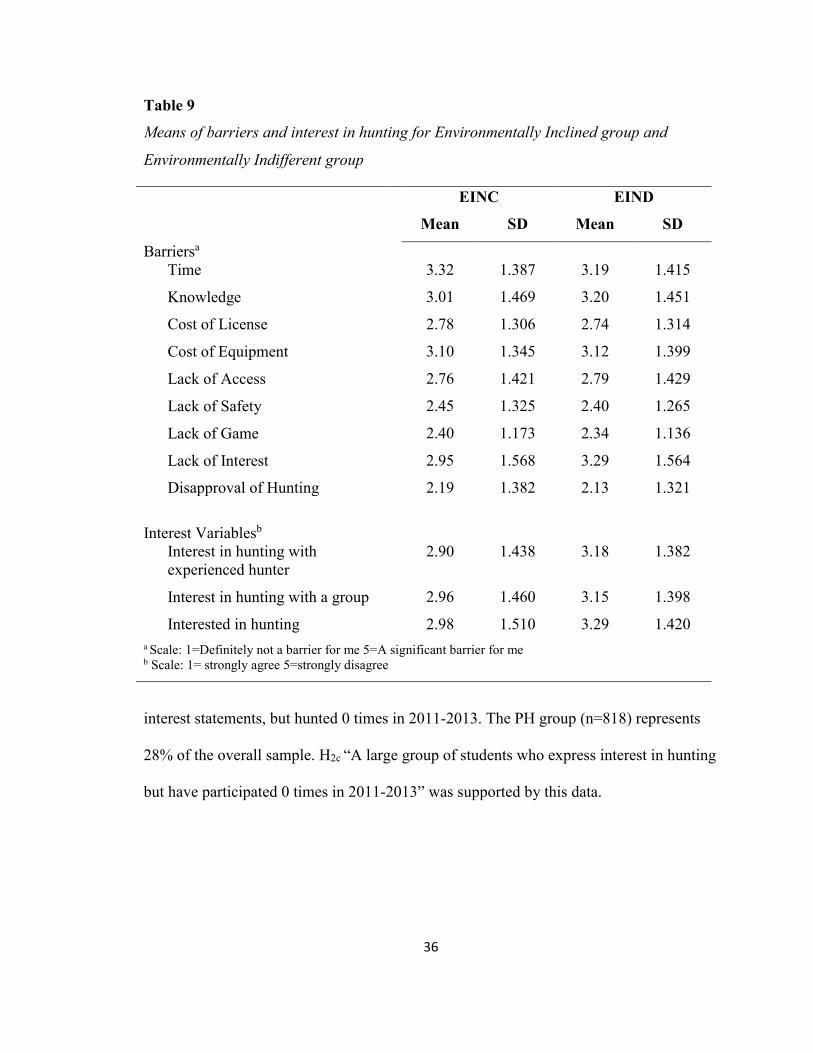
36
interest statements, but hunted 0 times in 2011-2013. The PH group (n=818) represents
28% of the overall sample. H2c “A large group of students who express interest in hunting
but have participated 0 times in 2011-2013” was supported by this data.
Table 9
Means of barriers and interest in hunting for Environmentally Inclined group and
Environmentally Indifferent group
EINC EIND
Mean SD Mean SD
Barriersa
Time
3.32
1.387
3.19
1.415
Knowledge 3.01 1.469 3.20 1.451
Cost of License 2.78 1.306 2.74 1.314
Cost of Equipment 3.10 1.345 3.12 1.399
Lack of Access 2.76 1.421 2.79 1.429
Lack of Safety 2.45 1.325 2.40 1.265
Lack of Game 2.40 1.173 2.34 1.136
Lack of Interest 2.95 1.568 3.29 1.564
Disapproval of Hunting 2.19 1.382 2.13 1.321
Interest Variablesb
Interest in hunting with
experienced hunter
2.90
1.438
3.18
1.382
Interest in hunting with a group 2.96 1.460 3.15 1.398
Interested in hunting 2.98 1.510 3.29 1.420
a Scale: 1=Definitely not a barrier for me 5=A significant barrier for me b Scale: 1= strongly agree 5=strongly disagree

37
Demographics of the PH group were consistent with demographics of the overall
sample. ANOVA revealed no statistically significant relationships for demographics for
this group. Additionally, no statistically significant relationships were found in the
Lifestyle Factor for the PH group.
ANOVA revealed statistically significant relationships between Barriers to
hunting for the PH group and those outside of it, with the exception of Lack of Safety,
Lack of Game, and Lack of Interest (Table 10). Within statistically significant results,
minimal relationships existed for the barriers of Time, Cost of License, Cost of
Equipment, Lack of Access, and Disapproval of Hunting. A typical relationship between
the barrier Knowledge and the PH group existed. As Table 11 shows he PH group
reported greater barriers for every variable with the exception of Lack of Interest and
Disapproval of Hunting.

38
Table 10
Relationship of barriers to hunting and PH Group
F df n p
Time 33.705 1 2828 0.000 0.109
Knowledge 302.23 1 2828 0.000 0.311
Cost of License 65.606 1 2828 0.000 0.151
Cost of Equipment 106.6 1 2828 0.000 0.191
Lack of Access 86.856 1 2828 0.000 0.173
Lack of Safety 13.14 1 2828 0.000 0.068
Lack of Game 7.069 1 2828 0.008 0.050
Lack of Interest 3.525 1 2828 0.061 0.035
Disapproval of Hunting 53.791 1 2828 0.000 0.137
Table 11
Means of barriers to hunting for those inside and outside the PH group
Potential Hunter
Group
Outside of PH
Group
Barriers Mean S.D. Mean S.D.
Time 3.50 1.313 3.16 1.424
Knowledge About
Hunting 3.82 1.301 2.81 1.425
Cost of License 3.07 1.290 2.64 1.297
Cost of Equipment 3.52 1.307 2.94 1.360
Lack of Access 3.16 1.434 2.62 1.391
Lack of Safety 2.57 1.248 2.37 1.314
Lack of Game 2.46 1.135 2.33 1.163
Lack of Interest 3.02 1.333 3.14 1.661
Disapproval of Hunting 1.87 1.110 2.28 1.424
Scale: 1=Definitely not a barrier for me 5=A significant barrier for me

39
Chapter 5
Discussion
Barriers
Data revealed that 71% of students surveyed approved of legal hunting and yet
only 17% of the sample had participated in hunting in the last three years (2011-2013).
This statistic seems consistent with the general sentiment towards hunting in the US,
where approval of hunting is high, but participation remains low. Studying barriers to
hunting may then provide useful information for ways to increase participation of specific
groups within the study population.
Gender
Females were less likely to have hunted in 2011-2013 with 76% of females
hunting 0 times as compared to 55% of males. These findings are consistent with existing
research. Other studies found that females who hunt tend to be introduced into hunting
later in life by male partners, i.e. husbands and boyfriends (Adams & Steen, 1997). Duda,
et al. (2001) found that women cited spending time with friends or loved ones as a
primary motivation for hunting. Through time spent in the field with a loved one or close
friend, barriers for these women are reduced. However, research has also shown that
individuals who are introduced into activities during youth have a stronger attachment to
those activities than those who are introduced later in life. Females who are introduced
later in life and whose primary interest is not necessarily the activity of hunting, but the
person with whom the activity is shared, will likely have more barriers to overcome in
regard to hunting.

40
Females also tended to report barriers that can be connected to education about
hunting and its potential merit and benefits (Knowledge, Lack of Safety, Lack of Interest,
and Disapproval of Hunting). This is of particular interest to management agencies who
are seeking ways to recruit more female hunters. This may be linked to why education
programs such as Becoming an Outdoors Woman can be successful recruitment tools.
More research would be helpful in finding ways increase initial interest in education
programs for women.
Barriers of Knowledge, Lack of Safety, Lack of Interest, and Disapproval of
Hunting may also all be related. For instance, if an individual disapproves of hunting,
they are likely to also cite a lack of interest in it. Lack of interest likely leads to minimal
knowledge about hunting and the proper safety practices of the activity. If one of these
barriers is lessened through education, there is significant potential for all of them to be
lessened and female participation to be increased.
Barriers cited in this study as more restrictive by males (Time and Lack of Access)
tend to be tangible barriers of opportunity, where the desire to hunt may be present but
something prevents participation. Education about access programs and public hunting
areas may also help mitigate these types of barriers for male college students.
Additionally, some states such as Montana offer services that connect private landowners
with hunters looking for land to hunt on. This type of program targeted toward college
students who are away from familiar areas and my struggle to make contacts within the
local community may be especially helpful.

41
Residence Type
Residence type held the greatest relationship to barriers of the demographic
variables. Of the barriers for which ANOVA revealed significant relationships those
individuals with urban residency consistently reported greater barriers to hunting. These
findings are consistent with past research. Barriers to outdoor recreation have been found
to be greater for urban residents (Ghimire et al., 2014).
It is logical that individuals from urban residences would face more significant
barriers than those from rural backgrounds as it is urban residences are inconsistent with
the description of a traditional hunter. Many of these barriers can be addressed through
education about hunting. It may be beneficial for management agencies to develop or
increase education programs specifically targeting urban populations. This is especially
true considering the increasing urbanization in America. With 80.7% of the US
population now residing in urban areas (an increase from 79% in 2000) a trend is
emerging; a trend that suggests hunter recruitment in urban areas will become
increasingly more important than it already is (US Census Bureau, 2012).
Education about hunting is an important piece to reducing hunting barriers. For
participants in this study, however, the most significant factor that indicated barrier
reduction was time spent hunting. As exemplified in Figure 2 the more days spent
hunting the less significant many barriers became. This study does not reveal causation;
whether more days were spent in the field because barriers were less significant or if
barriers were perceived as less significant because an individual’s desire to hunt
superseded barriers. However, it is important that a relationship exists between these

42
variables. This may suggest that programs that provide hunting experiences along with
education can be valuable tools to reduce barriers to future hunting.
Environmentally Inclined/ Environmentally Indifferent Groups
Legal hunting can be an environmentally responsible behavior. Hunting helps
control wildlife populations and provides funding for the management of game and non-
game species. There are also many independent sportsmen’s groups that are integral in
the process of wildlife habitat protection and restoration. Many hunters are advocates for
the protection of public lands in the form of national parks, forests, and wildlife
management areas. In a study from upstate New York, researchers found that wildlife
recreationists were 4-5 times more likely to engage in conservation behaviors (Cooper,
Larson, Dayer, Stedman, Decker, 2015). Hunters are wildlife recreationists by definition;
in this way hunting can fit as a part of an environmentally friendly lifestyle.
In this study, students who placed more importance on environmentally friendly
behaviors (EINC) were slightly more likely to be interested in hunting and slightly more
active hunters in 2011-2013. This is an interesting finding that may show many college
students see a link between environmentally friendly/responsible living and hunting.
However, of the 1,576 individuals who made up the EINC group 65% had not gone
hunting in 2011-2013 and roughly 55% had never been hunting in their lifetime. This
statistic shows that there is significant room for the growth of the number of hunters
within the EINC group. In order for an increase in the number of hunters who fall in the
EINC group to occur however, significant targeted and intentional education may need to
occur.

43
University campuses may be a prime area for hunter recruitment to take place.
Universities are often hotbeds of new and progressive ideas. Some have suggested that
universities are places where environmental attitudes and behaviors are fostered and
developed and that young adults, who reside at universities, will make the new push for
environmental progression (McDougle, Greenspan, & Handy, 2011). In this way
universities may be an ideal locations to include education regarding hunting as a pro-
environmental behavior.
Hunting may also find a place within the “locavore” movement. Individuals in
this movement seek to become more aware of the origins of food and take an active role
in harvesting it. Wild game represents an optimum source for organic meat. By its nature
there are no foreign hormones or connection to industrialized meat plants. Hunting also
means taking an active role in the harvesting and gathering of food. Some hunter
recruitment efforts in this realm do exist, however these programs are small and
experimental; often lacking the funding necessary to make a real impact.
Potential Hunter Group
Another promising outcome of this study is the Potential Hunter (PH) group. The
PH group was created in an attempt to isolate individuals who expressed some form of
interest in hunting, but had not been hunting in the past three years (2011-2013).
Theoretically, these individuals from this study would be prime subjects for hunter
recruitment, as the desire to participate exists, but a combination of barriers may be
preventing participation. Examining barriers to hunting for this group may also give clues

44
to managers about increasing participation for other groups who have low participation
rates.
The construction of the PH group revealed an interesting fact. The variable
Interested in Hunting addresses an individual’s general interest in hunting using a Likert
scale for the statement “I am very interested in hunting as a recreational activity”. Within
the PH group 391 respondents indicated some level of agreement with the statement of
interest in hunting. However the population of the PH group is 818, which indicates that
not all of the PH group showed interest in hunting specifically. In fact, 201 individuals
actively disagreed with a statement of interest. However, the 427 individuals who did not
express interest in hunting were included in the PH group because they responded
positively to one or both of the other interest statements, “I would be interested in
participating in hunting with an experienced hunter who attends my university” or “I
would be interested in participating in hunting with a group of friends who attend my
university”. This may indicate that though some individuals within the sample of this
study are not expressly interested in hunting, there may be potential for them to be
recruited and introduced into hunting through a social context.
The social element of this group reiterates the importance of mentor relationships
in hunting, even during the college years. University campuses hold great potential for
this type of social recruitment. College offers ample opportunities for new experiences
with new and varied groups of people. Management agencies may consider the
development of hunter clubs on university campuses for the purposes of encouraging
current hunters to reach out to friends who do not currently participate. These existing
and natural friendships are the most effective hunter mentoring relationships as they

45
better contribute to identity as a hunter (Enck et. al, 2000), which is linked to increased
participation (Schroeder, Fulton, Lawrence, & Cordts, 2013).
The PH group represented 28% of the overall sample. When the sample is limited
to only 18-24 year old (ages associated with traditional college students) the percentage
that the PH group represents raises to 30%. This number is significant when compared to
the overall 5% hunting participation rate for the 18-24 year old age bracket in the United
States (USFWS 2012). This may show that there is a significant amount of interest for
participation in hunting among college students that is not currently being realized.
Examining the barriers that may prevent participation may aid in the effort to
open up opportunities for hunting for the PH group. Means for barriers for the PH group
were greater for every barrier variable except Lack of Interest and Disapproval of
Hunting, than for those outside the group. That Lack of Interest and Disapproval of
Hunting are less significant for the PH group, which is defined by some level of interest
in hunting, seems logical. However, the result that all other barriers variables are greater
for those with some interest in hunting is surprising. This may suggest that the perception
of a barrier as present or significant depends on interest level. For instance, an individual
who is not interested in hunting, may not be aware of the cost of hunting equipment or
perceive that his/her lack of knowledge about hunting is a barrier to participate; therefore
these barriers are not significant for him/her.
The barrier with the most significant relationship associated with the PH group is
Knowledge, though there were minimal relationships with other barriers. Consistent with
previous research, this suggests that hunting requires special knowledge and equipment
that may prevent casual participation (Miller & Graefe, 2000; Scott & Shafer, 2001).
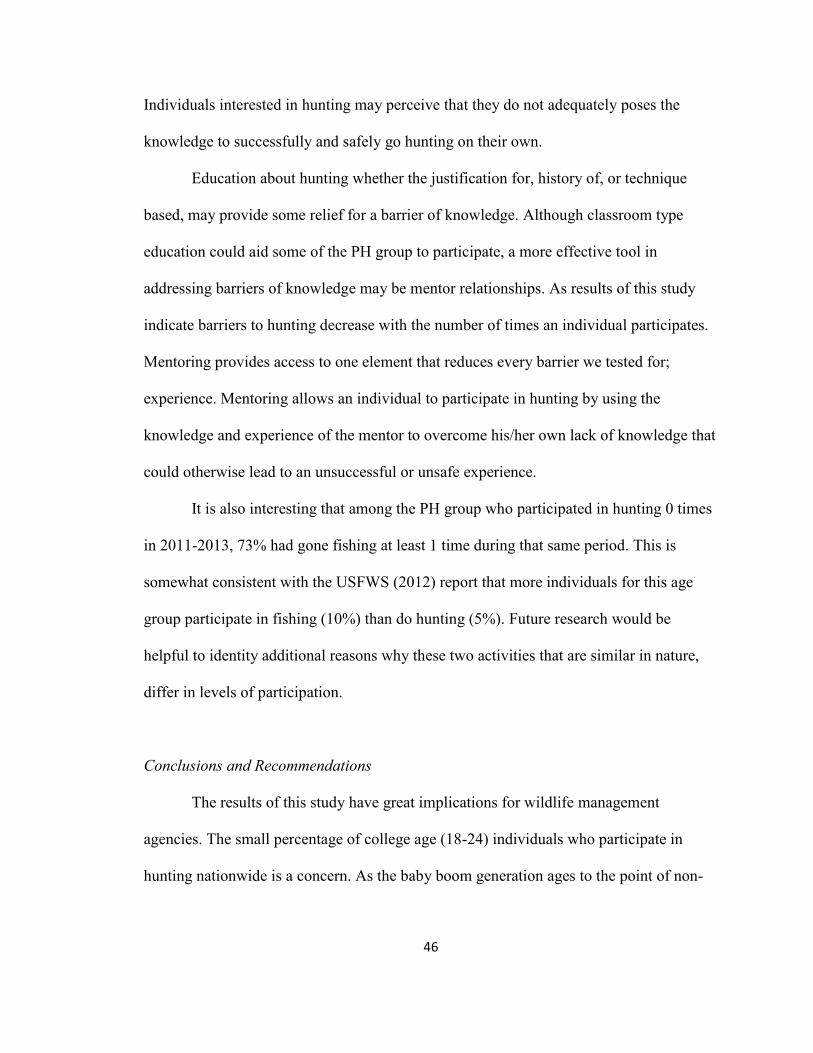
46
Individuals interested in hunting may perceive that they do not adequately poses the
knowledge to successfully and safely go hunting on their own.
Education about hunting whether the justification for, history of, or technique
based, may provide some relief for a barrier of knowledge. Although classroom type
education could aid some of the PH group to participate, a more effective tool in
addressing barriers of knowledge may be mentor relationships. As results of this study
indicate barriers to hunting decrease with the number of times an individual participates.
Mentoring provides access to one element that reduces every barrier we tested for;
experience. Mentoring allows an individual to participate in hunting by using the
knowledge and experience of the mentor to overcome his/her own lack of knowledge that
could otherwise lead to an unsuccessful or unsafe experience.
It is also interesting that among the PH group who participated in hunting 0 times
in 2011-2013, 73% had gone fishing at least 1 time during that same period. This is
somewhat consistent with the USFWS (2012) report that more individuals for this age
group participate in fishing (10%) than do hunting (5%). Future research would be
helpful to identity additional reasons why these two activities that are similar in nature,
differ in levels of participation.
Conclusions and Recommendations
The results of this study have great implications for wildlife management
agencies. The small percentage of college age (18-24) individuals who participate in
hunting nationwide is a concern. As the baby boom generation ages to the point of non-
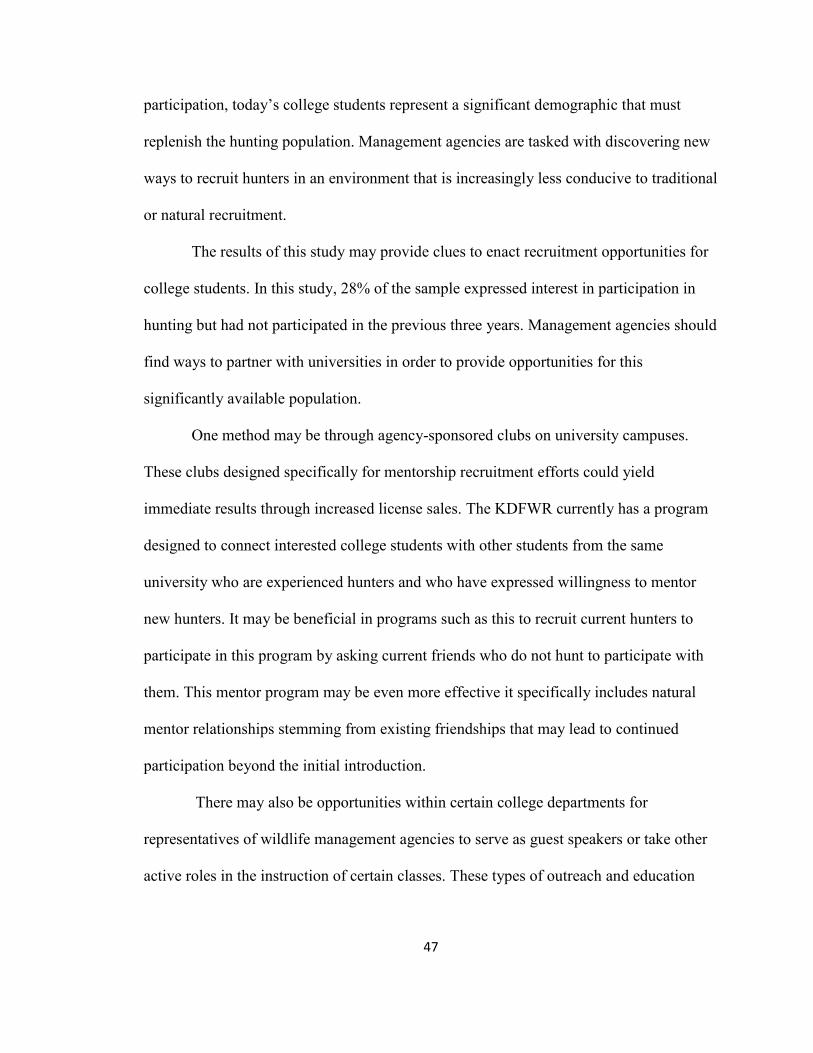
47
participation, today’s college students represent a significant demographic that must
replenish the hunting population. Management agencies are tasked with discovering new
ways to recruit hunters in an environment that is increasingly less conducive to traditional
or natural recruitment.
The results of this study may provide clues to enact recruitment opportunities for
college students. In this study, 28% of the sample expressed interest in participation in
hunting but had not participated in the previous three years. Management agencies should
find ways to partner with universities in order to provide opportunities for this
significantly available population.
One method may be through agency-sponsored clubs on university campuses.
These clubs designed specifically for mentorship recruitment efforts could yield
immediate results through increased license sales. The KDFWR currently has a program
designed to connect interested college students with other students from the same
university who are experienced hunters and who have expressed willingness to mentor
new hunters. It may be beneficial in programs such as this to recruit current hunters to
participate in this program by asking current friends who do not hunt to participate with
them. This mentor program may be even more effective it specifically includes natural
mentor relationships stemming from existing friendships that may lead to continued
participation beyond the initial introduction.
There may also be opportunities within certain college departments for
representatives of wildlife management agencies to serve as guest speakers or take other
active roles in the instruction of certain classes. These types of outreach and education

48
opportunities may be particularly effective in recruitment of individuals who would
identify with the EINC group.
In this study over half of the individuals identified in the PH group also fell into
the EINC group (Table 12). Environmental Science, Biology, Recreation and Park
Administration, Wildlife Management, Agriculture, and other similar departments may
hold higher concentrations of EINC type students yielding better results for recruitment
efforts of this type. At the most extreme level there may be potential for an abbreviated
class (1 credit hour) for college credit. A class of this type could be designed as a much
more in-depth hunter education course, be offered to students who had not previously
held a hunting license, and would culminate with a mentored hunting experience.
This study serves as a starting point for research in a currently understudied
population of hunter recruitment and retention. Findings may be tempered by a low
response rate but still add important contributions to the existing body of research.
Further research is necessary to establish what tools are most effective to reduce certain
barriers to participation for college students. University campuses provide a unique
Table 12
Members of Potential Hunter and
Environmentally Inclined groups
EIND EINC
Not interested
in hunting 927 1109
PH Group 386 432

49
opportunity to reach a large varied population from all sorts of demographic
backgrounds. In this way, recruitment efforts at universities could provide a significant
source of individuals for hunter recruitment in the United States.

50
REFERENCES
Adams, C. E., Brown, R. D., & Higginbotham, B. J. (2004). Developing a strategic plan
for future hunting participation in Texas. Wildlife Society Bulletin, 32(4), 1156-
1165.
Adams, C. E., & Steen, S. J. (1997). Texas females who hunt. Wildlife Society Bulletin,
25(4), 796-802.
Backman, S. J., Wright, B. A. (1993). An exploratory study of the relationship of attitude
and the perception of constraints to hunting. Journal of Park and Recreation
Administration. 11(2), 1-16.
Bissell, S., Duda, M., & Young, K. (1998). Recent studies on hunting and fishing
participation in the United States. Human Dimensions of Wildlife, 3(1), 75-80.
Bureau of Labor Statistics. (2013). American Time Use Survey. Washington D.C.
Buss, D. M. (2011). Evolutionary psychology: The new science of the mind (4th ed.).
Boston: Pearson.
Caesar, G. (1961). King of the mountain men; the life of Jim Bridger. ([1st ed.). New
York: Dutton.
Cahoone, L. (2009). Hunting as a moral good. Environmental Values 18(1), 67-89.
Campbell, J. M., & Mackay, K.J. (2009). Communicating the role of hunting for wildlife
management. Human Dimensions of Wildlife, 14(1), 21-36.
Cooper, C., Larson, L., Dayer, A., Stedman, R., & Decker, D. (2015). Are Wildlife
recreationists conservationists? Linking hunting, and pro-environmental behavior.
The Journal of Wildlife Management.
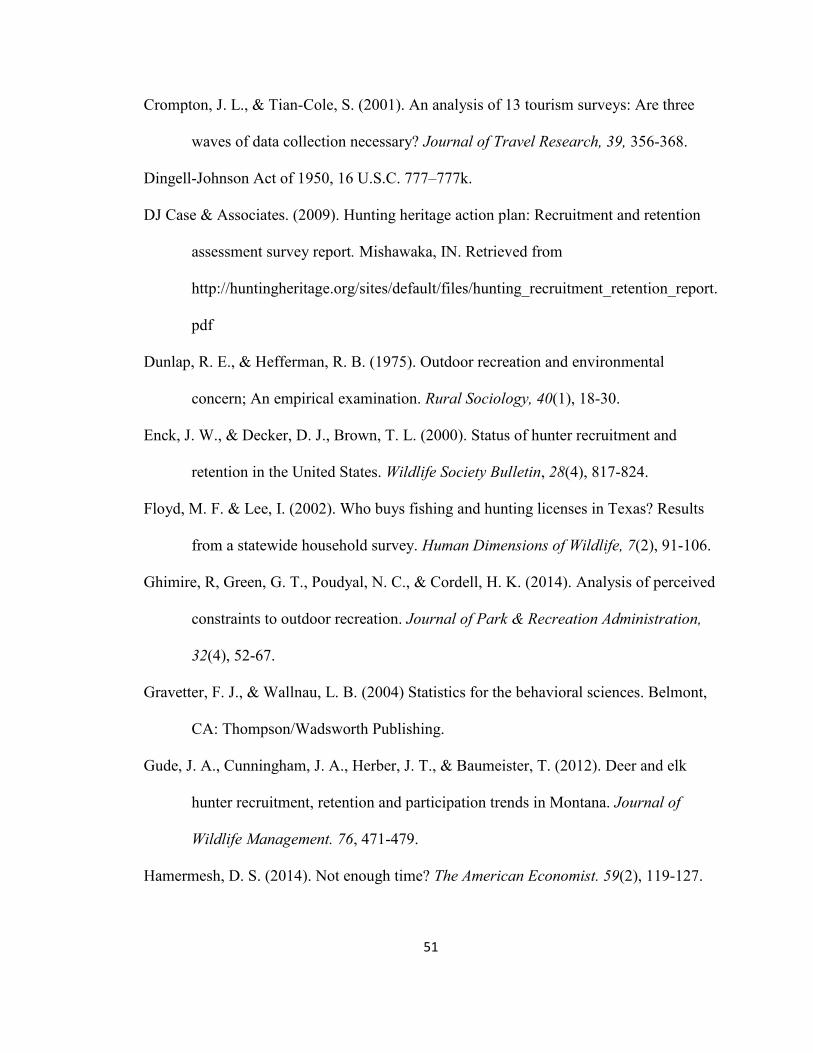
51
Crompton, J. L., & Tian-Cole, S. (2001). An analysis of 13 tourism surveys: Are three
waves of data collection necessary? Journal of Travel Research, 39, 356-368.
Dingell-Johnson Act of 1950, 16 U.S.C. 777–777k.
DJ Case & Associates. (2009). Hunting heritage action plan: Recruitment and retention
assessment survey report. Mishawaka, IN. Retrieved from
http://huntingheritage.org/sites/default/files/hunting_recruitment_retention_report.
Dunlap, R. E., & Hefferman, R. B. (1975). Outdoor recreation and environmental
concern; An empirical examination. Rural Sociology, 40(1), 18-30.
Enck, J. W., & Decker, D. J., Brown, T. L. (2000). Status of hunter recruitment and
retention in the United States. Wildlife Society Bulletin, 28(4), 817-824.
Floyd, M. F. & Lee, I. (2002). Who buys fishing and hunting licenses in Texas? Results
from a statewide household survey. Human Dimensions of Wildlife, 7(2), 91-106.
Ghimire, R, Green, G. T., Poudyal, N. C., & Cordell, H. K. (2014). Analysis of perceived
constraints to outdoor recreation. Journal of Park & Recreation Administration,
32(4), 52-67.
Gravetter, F. J., & Wallnau, L. B. (2004) Statistics for the behavioral sciences. Belmont,
CA: Thompson/Wadsworth Publishing.
Gude, J. A., Cunningham, J. A., Herber, J. T., & Baumeister, T. (2012). Deer and elk
hunter recruitment, retention and participation trends in Montana. Journal of
Wildlife Management. 76, 471-479.
Hamermesh, D. S. (2014). Not enough time? The American Economist. 59(2), 119-127.

52
Heffelfinger, J. R., Geist, V., & Wishart, W. (2013). The role of hunting in North
American wildlife conservation. International Journal of Environmental Studies,
70(3), 399-413.
Herberlein, T. A. (1987). Stalking the predator: A profile of the American hunter.
Environment, 29(7), 6-11, 30-33.
Heberlein, T. A., Serup, B., & Ericsson, G. (2008). Female Hunting Participation in
North America and Europe. Human Dimensions of Wildlife, 13(6), 443-458.
Jackson, E. L. (1988). Leisure constraints: A survey of past research. Leisure Sciences,
10, 203-215.
Jackson, E. L. (1991). Special issue introduction: Leisure constraints/constrained leisure.
Leisure Sciences, 13(4).
Jagnow, C. P., Stedman, R. C., Luloff, A. E., Julian, G. J., Finley, J.C., & Steele, J.
(2006). Why landowners in Pennsylvania post their property against hunting.
Human Dimensions of Wildlife, 11(1), 15-26.
Jensen, C. R., & Guthrie, S. (2006). Outdoor recreation in America (6th ed.). Champaign,
IL: Human Kinetics.
Kay, T., & Jackson, G. (1991). Leisure despite constraint: The impact of leisure
constraints on leisure participation. Journal of Leisure Research. 23, 301-313
Kentucky Department of Fish and Wildlife Resources. (2013) Annual research highlights
2012.
Larson, L. R., Stedman, R. C., Decker, D. J., Siemer, W. F., & Baumer, M. S. (2014).
Exploring the social habitat for hunting: toward a comprehensive framework for

53
understanding hunter recruitment and retention. Human Dimensions of Wildlife.
19(2), 105-122.
Larson, L. R., Whiting, J. W., & Green, G. T. (2011) Exploring the influence of outdoor
recreation participation on pro-environmental behavior in a demographically
diverse population. Local Environment. 16(1), 67-86.
Louv, Richard. (2008). Last child in the woods: saving our children from nature-deficit
disorder Chapel Hill, NC : Algonquin Books of Chapel Hill.
McDougle, L. M., Greenspan, I., & Handy, F. (2011). Generation green: Understanding
the motivations and mechanisms influencing young adults' environmental
volunteering. International Journal Of Nonprofit And Voluntary Sector
Marketing, 16(4), 235-341.
Mehmood, S., Zhang, D., & Armstrong, J. (2003). Factors associated with declining
hunting license sales in Alabama. Human Dimensions of Wildlife, 8(4), 243-262.
Miller, C.A. (2002). Big bucks: Balancing resident and nonresident bowhunter demand in
Illinois. In R. Warren (Ed.). Proceedings of the 1st National Bowhunting
Conference (pp. 125-133). The Wildlife Society: Bethesda, MD.
Miller, C. A., & Graefe, A. R. (2000). Degree and range of specialization across related
hunting activities. Leisure Sciences, 22(3), 195-204.
Miller, C. A., & Vaske, J. J. (2003). Individual and situational influences on declining
hunter effort in Illinois. Human Dimensions of Wildlife, 8(4), 263-276.
Mokdad, A. H., Serdula, M.K., Dietz, W. H., Bowman, B. A., Marks, J. S., Koplan, J.P.,
(1999). The spread of the obesity epidemic in the United States, 1991-1998).
JAMA: Journal of the American Medical Association, 282(16), 1519-1522.
54
Montgomery, R., & Blalock, M. G. (2010) The impact of access, cost, demographics and
individual constraints on hunting frequency and future participation. Academy of
Marketing Studies Journal, 14(2), 115-131.
Pauline, J. S. (2013). Physical activity behaviors, motivations, and self-efficacy among
college students. College Student Journal 47(1), 64-74.
Pittman-Robertson Act of 1937, 16 U.S.C 669-669i.
Pontius, J.B., Greenwood, D. A., Ryan, J. L., & Greenwood, E. A. (2013). Hunting for
ecological learning. Canadian Journal of Environmental Education, 18, 80-85.
Poudyal, N. C., Hodges, D. G., & Cho, S. (2008). Effects of urban sprawl on hunting
participation in the southeastern United States. Southern Journal of Applied
Forestry, 32(3), 134-138.
Riley, S. D., Decker, D. J., Enck, J. W., Curtis, P.D., Lauber, B., & Brown, T. L. (2003).
Deer populations up, hunter populations down: implications of interdependence of
deer and hunter population dynamics on management. Ecoscience. 10, 455-461.
Responsive Management (2008). The future of hunting and shooting sports: Research-
based recruitment and retention strategies.
Responsive Management (2013). Exploring recent increases in hunting and fishing
participation.
Rinella, S. (2007, December 14). Locavore, get your gun. New York Times. p. A41
Robinson, K. K. & Ridenour, D. (2012). Whither the love of hunting? Explaining the
decline of a major form of rural recreation as a consequence of the rise of virtual
entertainment and urbanism.” Human Dimensions of Wildlife, 17(6), 418-436.
55
Ryan, E., & Shaw, B. (2011). Improving hunter recruitment and retention. Human
Dimensions of Wildlife, 16(5), 311-317.
Schorr, R. A., Lukacus, P. M., & Gude, J. A. (2014). The Montana deer and elk hunting
population: the importance of cohort group, license price, and population
demographics on hunter retention, recruitment, and population change. Journal of
Wildlife Management, 78(5), 944-952.
Schulz, J. H., Millspaugh, J. J., Zekor, D. T., & Washburn, B. E. (2003). Enhancing sport
hunting opportunities for urbanites. Wildlife Society Bulletin, 31(2), 565-573.
Schroeder, S. A., Fulton, D. C., Lawrence, J. S., & Cordts, S. D. (2013). Identity and
specialization as a waterfowl hunter. Leisure Sciences, 35(3), 218-234.
Thompson, J. (2006) Society Choices: Land use changes, forest fragmentation and
conservation. Science Findings, 88(11,) 1-5.
Scott, D. (2005) Constraints to leisure. E. L. Jackson (Ed.) State College, PA: Venture
Publishing.
Scott, D., & Shafer, C.S. (2001). Recreational specialization: A critical look at the
construct. Journal of Leisure Research, 33(3), 319-343.
Shaw, S. M., Bonen, A., & McCabe, J. F. (1991). Do more constraints mean less leisure?
Examining the relationship between constraints and participation. Journal of
Leisure Research, 23, 286-300.
Sofranko, A. J., & Nolan, M. F. (2009). Early Life Experiences and Adult Sports
Participation.” Journal of Leisure Research, 41(3), 425-437.
Sparling, P. B., & Snow, T. K. (2002). Physical activity patterns in recent college alumni.
Research Quarterly for Exercise & Sport, 73(2), 200-205.

56
Tarrant, M. A. & Green, G. T., 1999. Outdoor recreation and the predictive validity of
environmental attitudes. Leisure Sciences, 21(1), 17-30.
Tedesco, Laura Anne. "Lascaux (ca. 15,000 B.C.)". In heilbrunn timeline of art history.
New York: The Metropolitan Museum of Art, 2000–.
http://www.metmuseum.org/toah/hd/lasc/hd_lasc.htm (October 2000).
Thomas, C. L., Lueck, D. H., & Farrell, P. A. (2007). Becoming and outdoors woman
planning guide. University of Wisconsin Stevens Point.
Tidball, K. G., Tidball, M. M., & Curtis, P. (2013). Extending the Locavore Movement to
Wild Fish and Game: Questions and Implications. Natural Sciences
Education, 42(1), 185-189.
Theodori, G.L., Luloff, A. E., & Willits, F. K. (1998). The association of outdoor
recreation and environmental concern: Reexamining the Dunlap-Hefferman
thesis. Rural Sociology, 63(1), 94-108.
United States Fish and Wildlife Service. (2012). 2011 National survey of fishing,
hunting, and wildlife-associated recreation. United States Department of the
Interior, United States Fish and Wildlife Service, and United States Department of
Commerce, Bureau of the Census, Washington, D.C., USA.
US Census Bureau. (2012). Growth in Urban Population Outpaces Rest of Nation,
Census Bureau Reports. Retrieved March 2, 2015.
http://www.census.gov/newsroom/releases/archives/2010_census/cb12-50.html
Vaske, J. J., (2008) Survey research and analysis: Applications in parks, recreation, and
human dimensions. State College, Pa: Venture Publishing.
57
Winkler, R., & Warnke, K. (2013). The future of hunting: An age-period-cohort analysis
of deer hunter decline. Population and Environment: A Journal of
Interdisciplinary Studies, 34(4), 460-480.
Wright, B. A., Rodgers, E., & Backman, K. F. (2001). Assessing the temporal stability of
hunting participation and the structure and intensity of constrains: A panel Study.
Journal of Leisure Research, 33(4) 450.

58
APPENDIX A:
Survey Instrument
59
Informed Consent Page
Discloser of all information in this study is voluntary. The following is an academic research study. Any records associated with this study will be kept
confidential under appropriate security. No private information is collected in the process of answering the survey.
This process should take no longer than 10 minutes to complete.
No one under the age of 18 shall participate in this study.
I understand that by continuing I have read the terms above and agree to participate in this study.
Thank you for you participation in this survey. As a way of saying thank you for your completed
survey we would like to offer you a chance at a random drawing for a Visa gift card in the amount of $50.00. At the end of the survey you may enter your email address for consideration.
All information will be kept confidential on a protected computer, and will be destroyed once the drawing takes place.
60
Hunting as a Recreational Activity for College
Students
Section 1- Hunting and Fishing- Please provide us with information about your past experience
with hunting or fishing.
1. Have you ever been hunting or fishing?
I have been…
Fishing
Hunting
Both Hunting and Fishing
Neither Hunting nor Fishing
<If hunting, fishing, or both is selected, display this page>
1a. How many different times have you participated in hunting in the past 3 calendar years (2011-
2013)?
0 times
1-5 times
6-10 times
11 or more times
1b. How many different times have you participated in fishing in the past 3 calendar years (2011-
2013)?
0 times
1-5 times
6-10 times
11 or more times
1c. Do you plan to hunt or fish in 2014, or have you done either already this year?
In 2014 I have already or plan to go…
Fishing
Hunting
Both Hunting and Fishing
Neither Hunting nor Fishing
Section 2- Lifestyle factors- Various lifestyle factors influence our recreational habits. Please
provide us with information about the following lifestyle factors to help us better understand your
recreational choices.

61
2. How important are the following lifestyle factors to you? Please select the level of importance
to you for each factor.
Not Important Very Important
Eating healthy 1 2 3 4 5
Eating locally grown foods whenever possible 1 2 3 4 5
Eating Organic foods whenever possible 1 2 3 4 5
Harvesting my own foods whenever possible 1 2 3 4 5
Regular physical exercise 1 2 3 4 5
Being active outdoors 1 2 3 4 5
Enjoying nature 1 2 3 4 5
Living in an environmentally friendly way 1 2 3 4 5
Activities that challenge me 1 2 3 4 5
Activities with friends 1 2 3 4 5
Section 3- Hunting as Recreation- Please share with us about your opinion of hunting as a
recreational activity.
3. In general, do you approve or disapprove of legal hunting?
Strongly approve
Moderately approve
Neither approve nor disapprove
Moderately disapprove
Strongly disapprove
4. Do you agree or disagree with this statement? I am very interested in hunting as a recreational
activity.
Strongly agree
Moderately agree
Neither approve nor disapprove
Moderately disagree
Strongly Disagree
5. Do you agree or disagree with this statement? Hunting is a safe recreational activity.
Strongly agree
Moderately agree
Neither agree nor disagree
Moderately disagree
Strongly Disagree
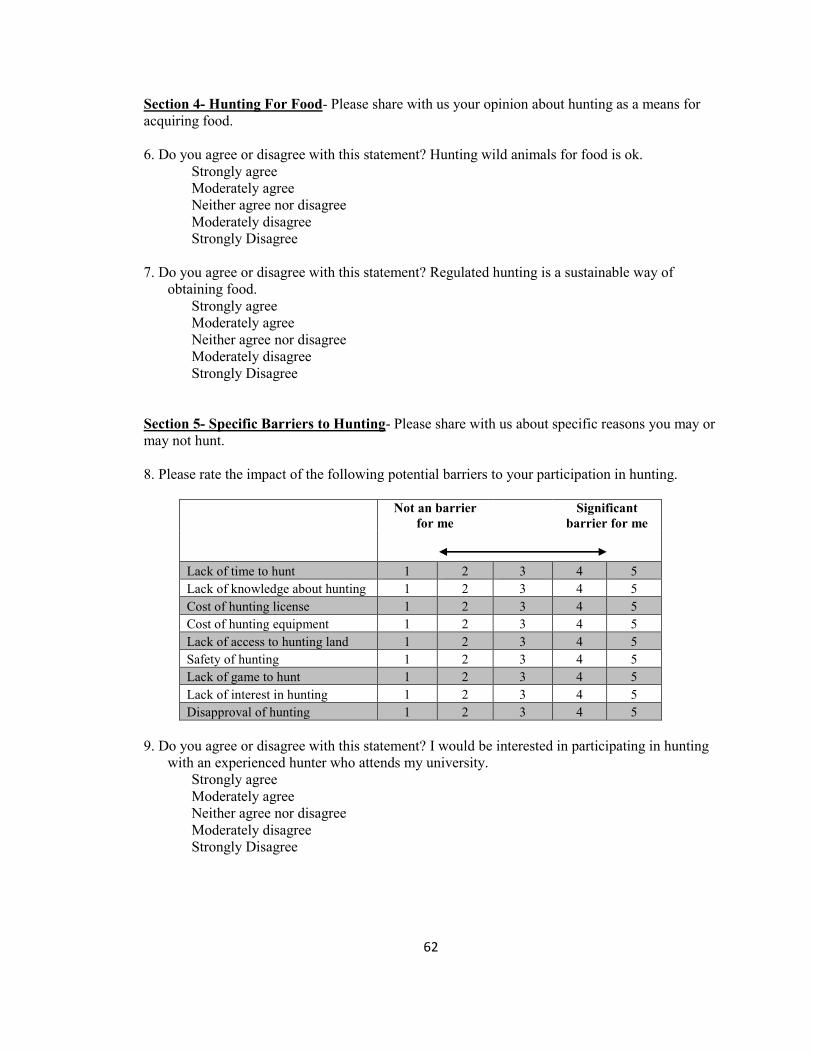
62
Section 4- Hunting For Food- Please share with us your opinion about hunting as a means for
acquiring food.
6. Do you agree or disagree with this statement? Hunting wild animals for food is ok.
Strongly agree
Moderately agree
Neither agree nor disagree
Moderately disagree
Strongly Disagree
7. Do you agree or disagree with this statement? Regulated hunting is a sustainable way of
obtaining food.
Strongly agree
Moderately agree
Neither agree nor disagree
Moderately disagree
Strongly Disagree
Section 5- Specific Barriers to Hunting- Please share with us about specific reasons you may or
may not hunt.
8. Please rate the impact of the following potential barriers to your participation in hunting.
Not an barrier
for me Significant
barrier for me
Lack of time to hunt 1 2 3 4 5
Lack of knowledge about hunting 1 2 3 4 5
Cost of hunting license 1 2 3 4 5
Cost of hunting equipment 1 2 3 4 5
Lack of access to hunting land 1 2 3 4 5
Safety of hunting 1 2 3 4 5
Lack of game to hunt 1 2 3 4 5
Lack of interest in hunting 1 2 3 4 5
Disapproval of hunting 1 2 3 4 5
9. Do you agree or disagree with this statement? I would be interested in participating in hunting
with an experienced hunter who attends my university.
Strongly agree
Moderately agree
Neither agree nor disagree
Moderately disagree
Strongly Disagree

63
10. Do you agree or disagree with this statement? I would be interested in participating in hunting
with a group of friends who attend my university.
Strongly agree
Moderately agree
Neither agree nor disagree
Moderately disagree
Strongly Disagree
Section 6-Demographic Information – Please tell us a little about yourself. All information is
kept confidential.
Age:
Gender:
Race:
Year in school:
University you attend:
State of Residence while not at school:
Residential type:
o Urban-area population greater than 30,000 people
o Rural-area population less than 30,000 people
Growing up did you have a family member or close friend who participated in hunting?
Yes
No
Thank you for you participation in this survey. As a way of saying thank you for your
participation we would like to offer you a chance at a random drawing for a Visa gift card in the
amount of $50.00.
If you would like to be considered for this random drawing please enter your email in the space
below.
All information will be kept confidential on a protected computer, and will be destroyed once the
drawing takes place.
(Enter email here)

64
You have now completed the survey.
If you are interested in more information about hunting or fishing in Kentucky click here.
{link: http://fw.ky.gov]

65
APPENDIX B:
Non-Response Bias Check Instrument

66
Hunting As a Recreational Activity for College Students
1. Do you agree or disagree with this statement? I am very interested in hunting as a recreational
activity.
Strongly agree
Moderately agree
Neither approve nor disapprove
Moderately disagree
Strongly Disagree
2. Please rate the impact of the following potential barriers to your participation in hunting.
Not an barrier
for me Significant
barrier for me
Lack of time to hunt 1 2 3 4 5
Lack of knowledge about hunting 1 2 3 4 5
Safety of hunting 1 2 3 4 5
3. Do you agree or disagree with this statement? I would be interested in participating in hunting
with a group of friends who attend my university.
Strongly agree
Moderately agree
Neither agree nor disagree
Moderately disagree
Strongly Disagree
Demographic Information
Age:
Gender:
Race
Enter your email address here if you would like to be considered for the $50 Visa Gift Card
drawing
______________________