outlook for current and prospective commodities max foster
TRANSCRIPT

Outlook for current and prospective commodities
Max Foster
Overview
• Kimberley region agriculture
• Beef industry
– WA live cattle exports
– Kimberley cattle property performance
• Ord River Irrigation Area
– Existing crops
– Prospective crops
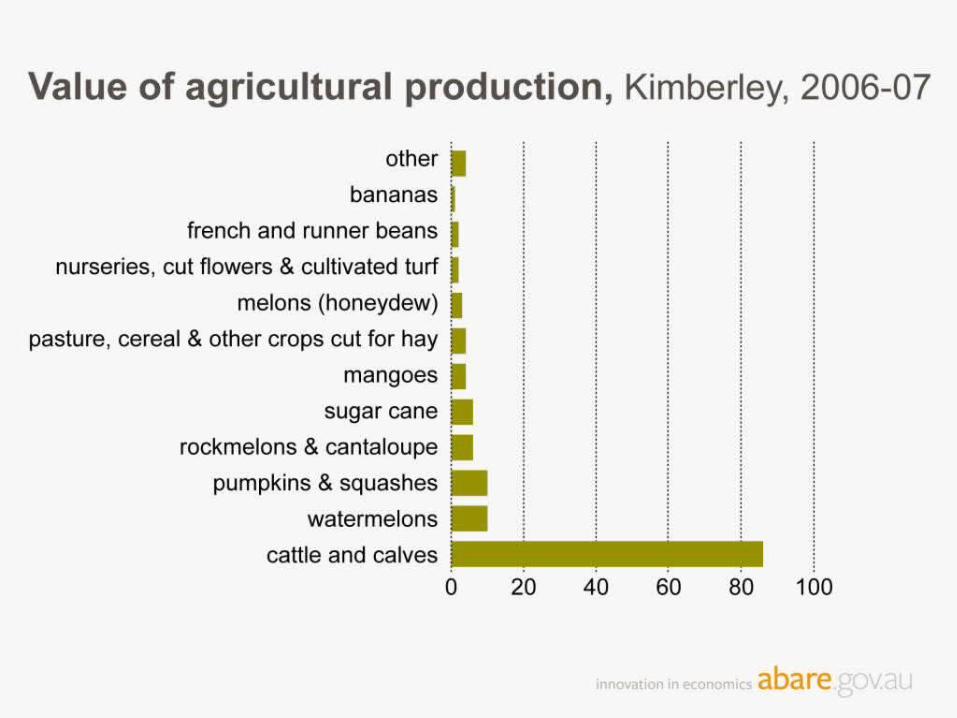
Value of agricultural production, Kimberley, 2006-07
20 40 60 80 100
bananas
french and runner beans
nurseries, cut flowers & cultivated turf
melons (honeydew)
pasture, cereal & other crops cut for hay
mangoes
sugar cane
rockmelons & cantaloupe
pumpkins & squashes
watermelons
cattle and calves
$m
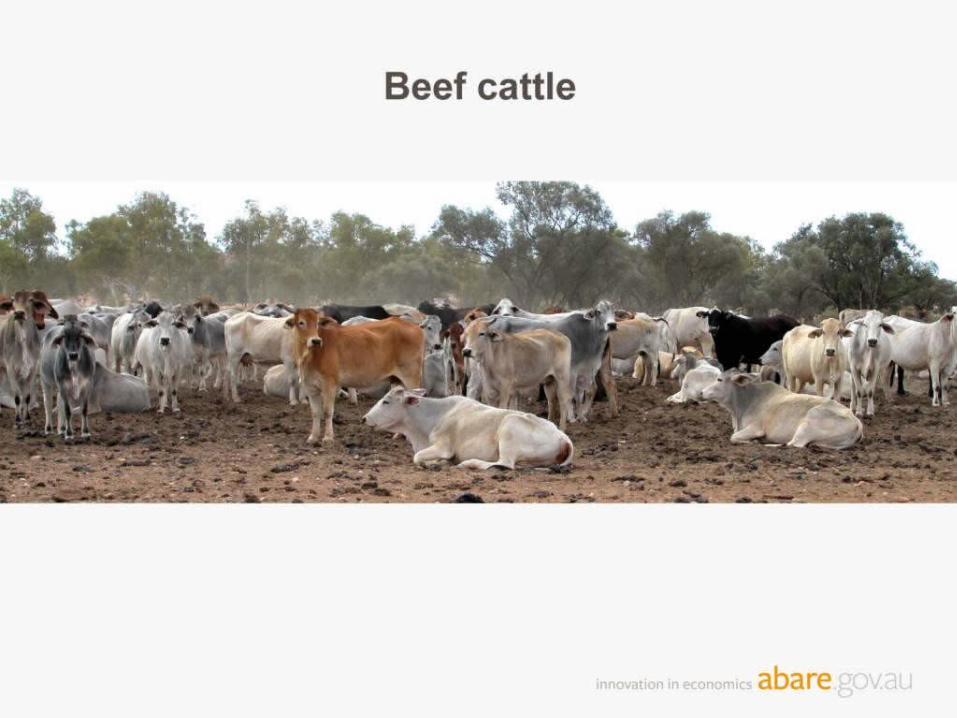
Beef cattle
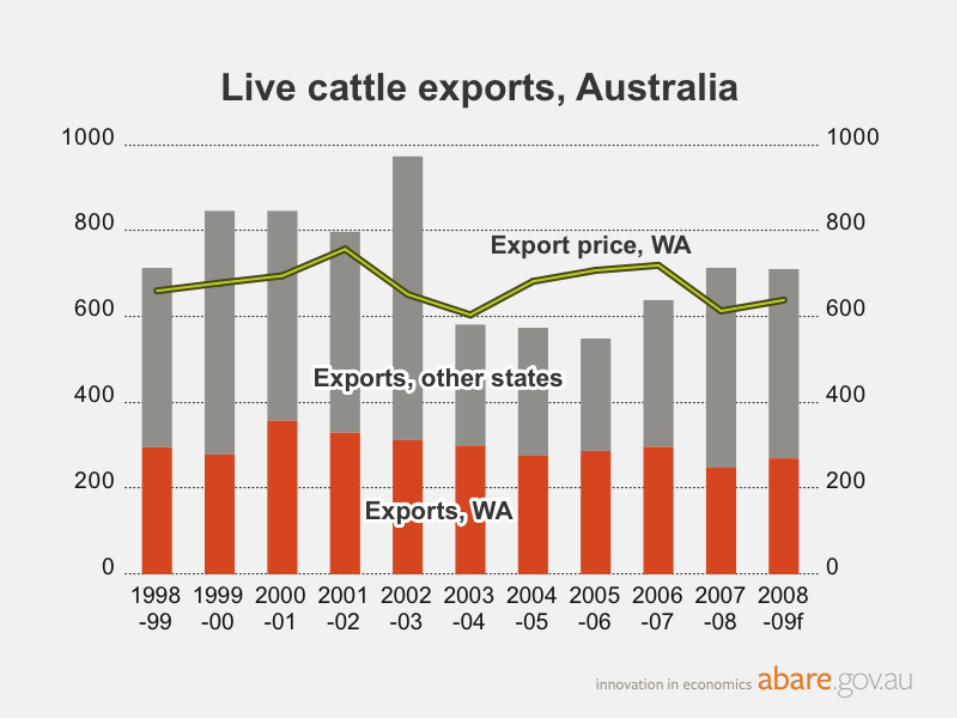
Live cattle exports, Australia
300
600
900
1200
1998-99 2000-01 2002-03 2004-05 2006-07 2008-09f
200
400
600
800
Exports, WA
Exports, other states
Export price, WA
$/hd 2008-09‘000
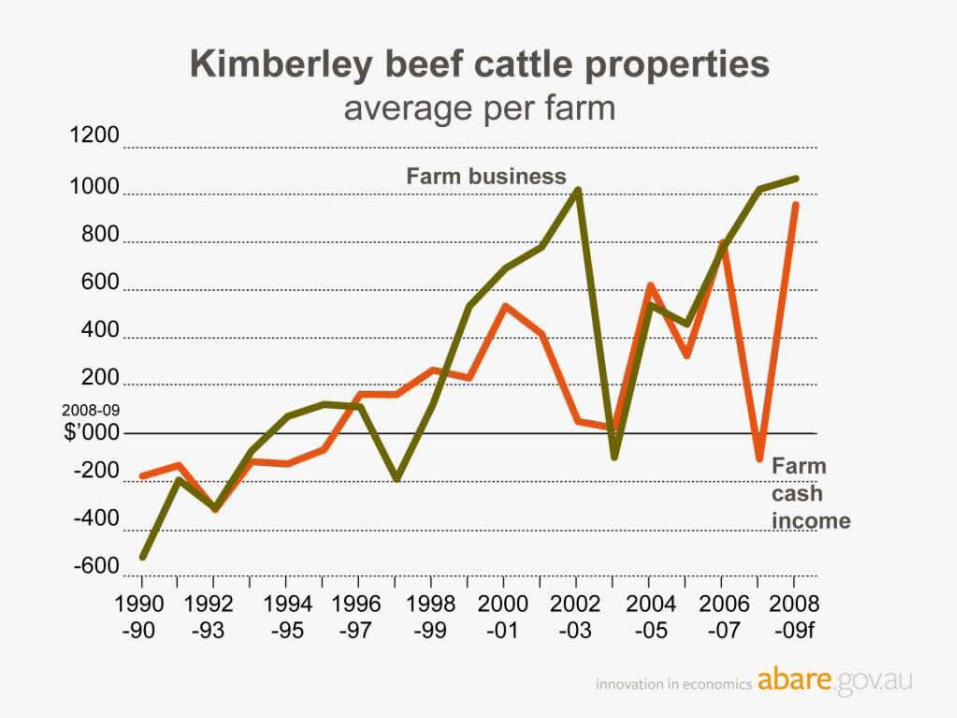
Kimberley beef cattle propertiesAverage per farm
-600
-300
0
300
600
900
1200
1990-91 1993-94 1996-97 1999-20 2002-03 2005-06 2008-09f
Farm cash income
Farm business profit
$’000 2008-09
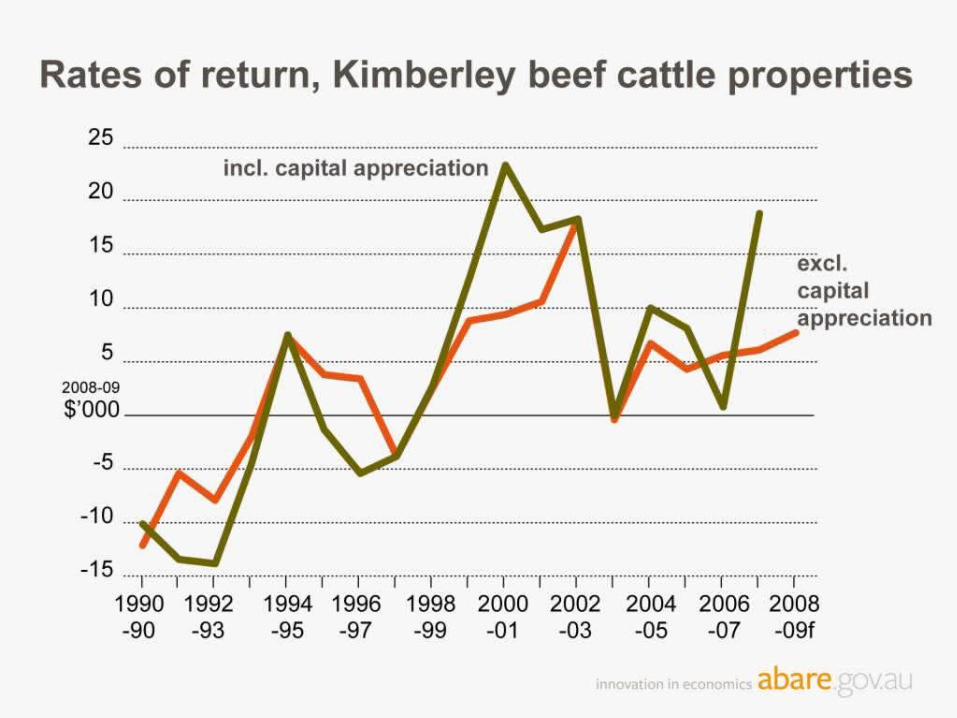
Rates of return, Kimberley beef cattle properties
-20
-10
0
10
20
30
1990-91
1993-94
1996-97
1999-20
2002-03
2005-06
2008-09f
excl. capital appreciation
incl. capital appreciation
%
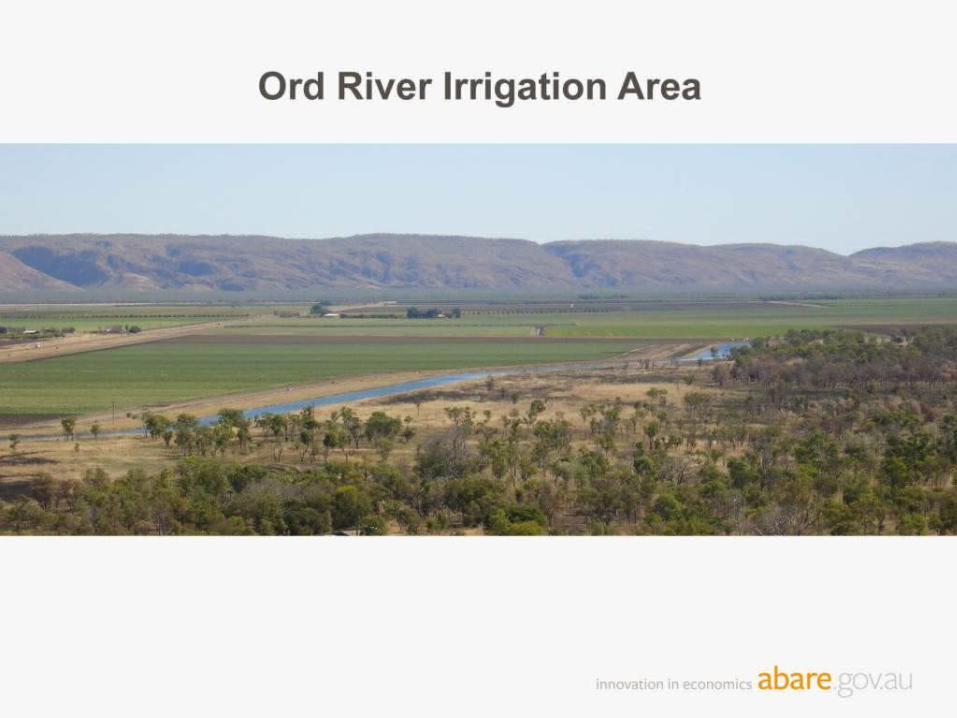
Ord River Irrigation Area

Ord River Irrigation AreaLand use, 2007-08
Field crops
Tropical forestry
Prepared but not planted
Hybrid seed Cover
crops
Horticulture
Melons
Pumpkins
Mangoes
Grapefruit
Other horticulture
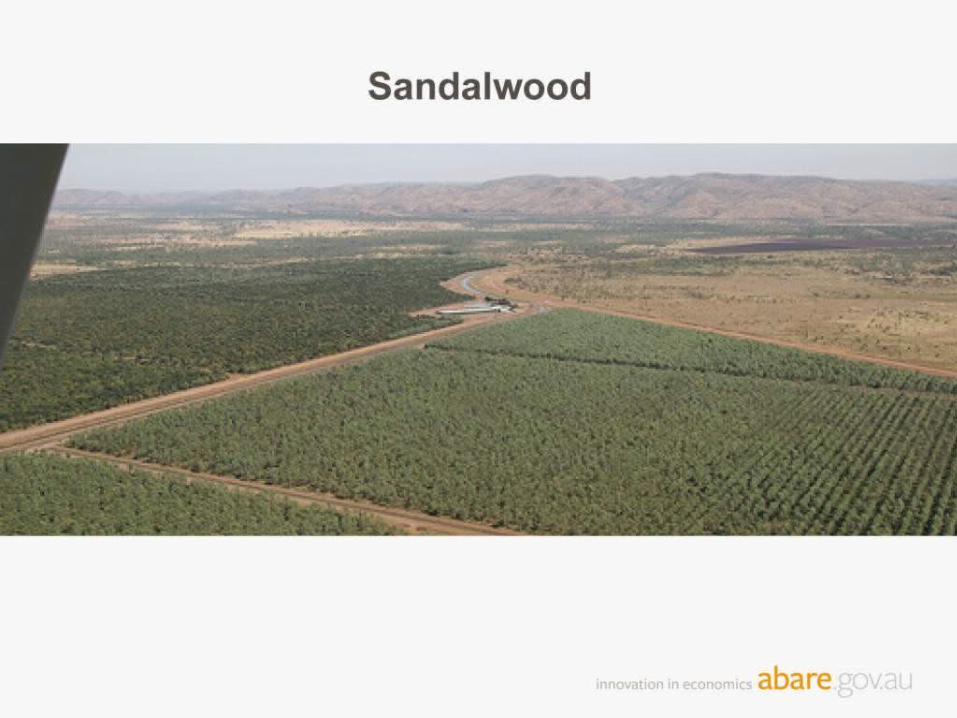
Sandalwood
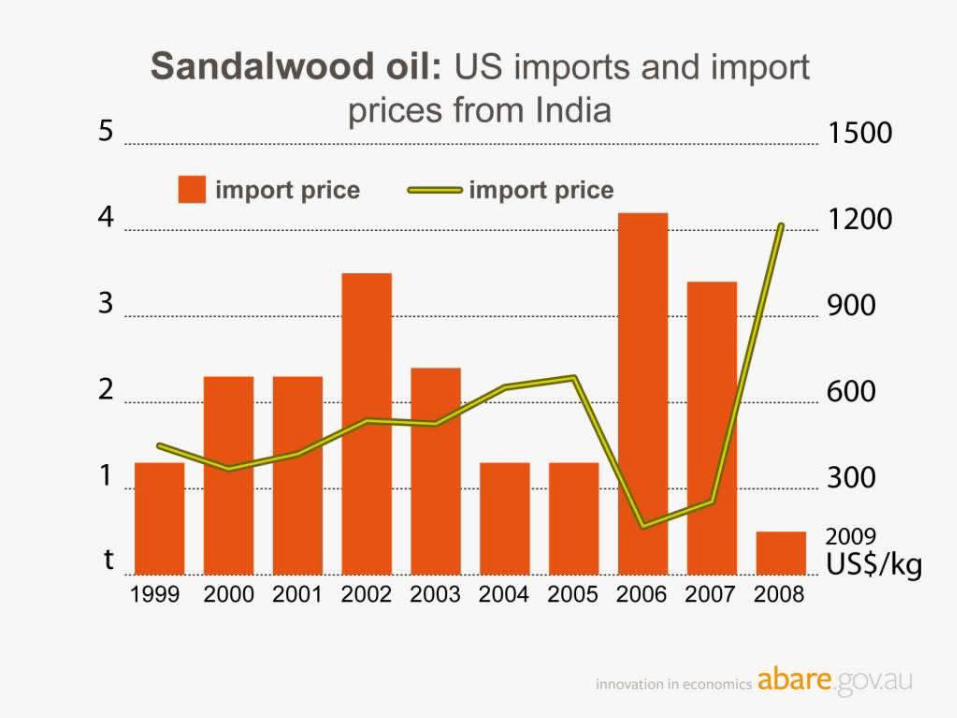
Sandalwood oil: US imports and import prices from India
1
2
3
4
5
1999 2001 2003 2005 2007
300
600
900
1200
1500Imports Import price
tUS$/kg
2009
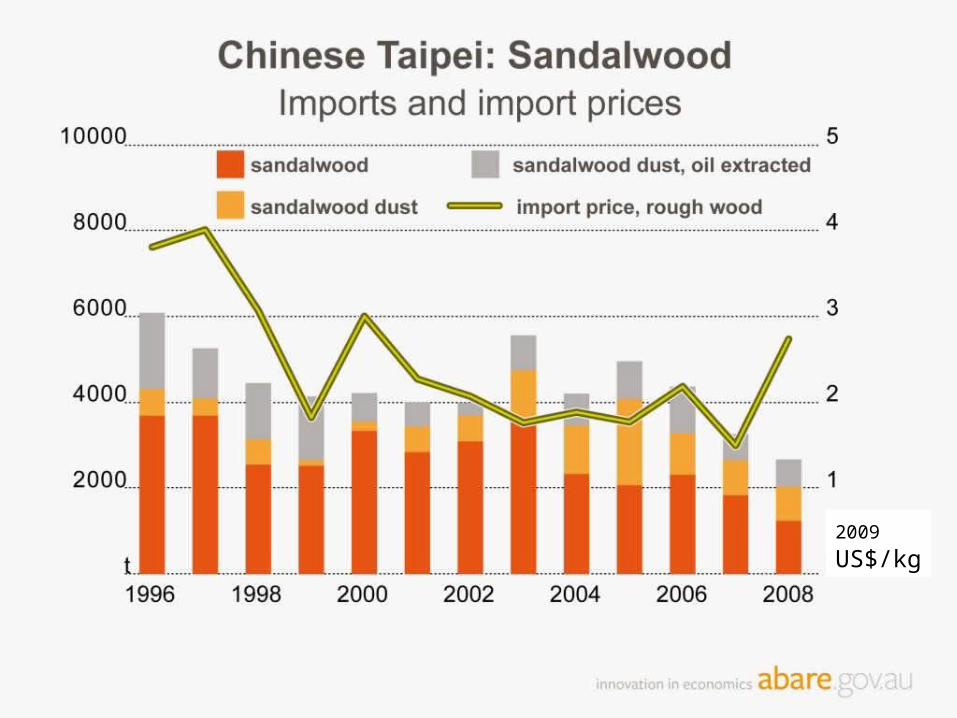
Chinese Taipei: Sandalwood Imports and import prices
t US$/t
2009 US$/kg

Horticulture

Horticulture outlook
Domestic markets
• Strong growth in demand, particularly for fresh produce
• ORIA producers benefiting from seasonal price
premiums
World markets
• Rapid growth in the value of world fruit, nut and
vegetable trade
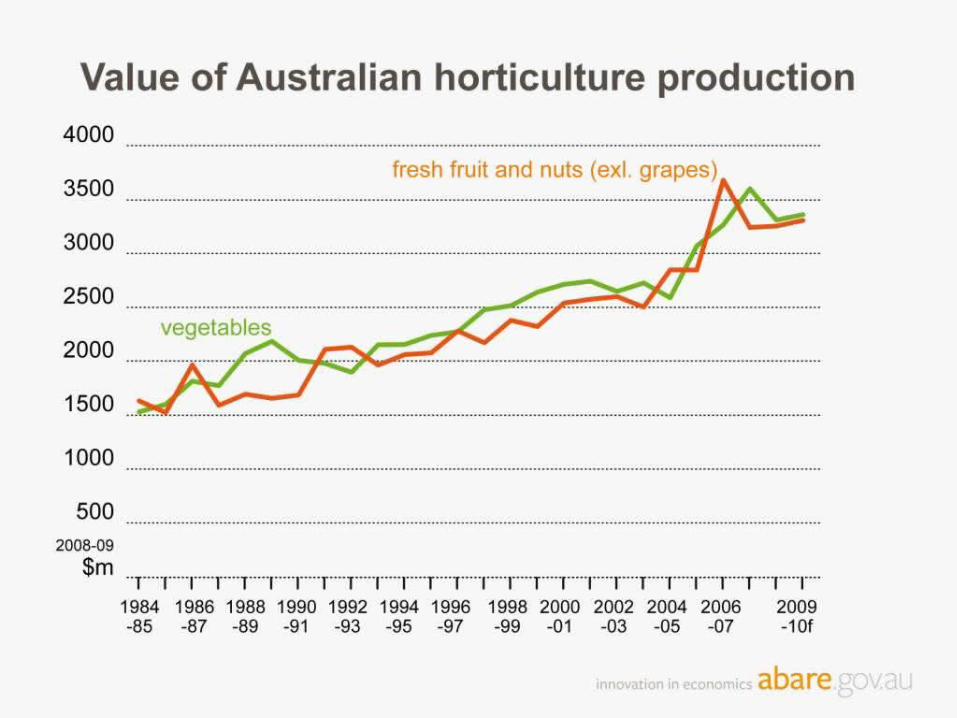
Value of Australian horticulture production
1000
2000
3000
4000
1984-85
1989-90
1994-95
1999-00
2004-05
2009-10f
Fruit and nuts (excl. grapes)
Vegetables
$m 2008-09
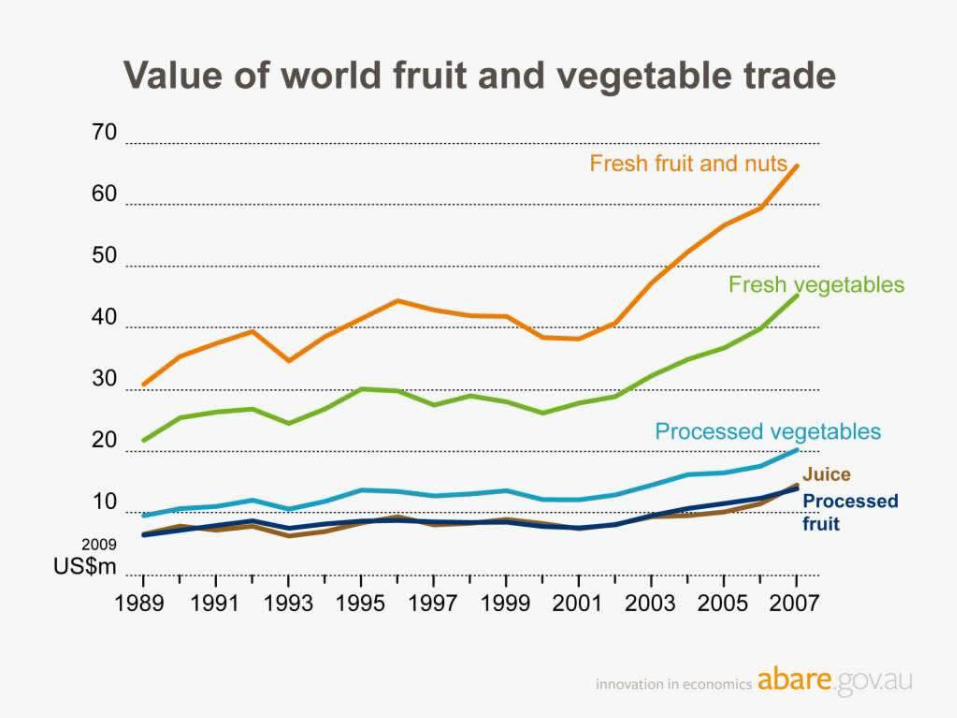
Value of world fruit and vegetable trade
10
20
30
40
50
60
70
1989 1991 1993 1995 1997 1999 2001 2003 2005 2007
Fresh fruit and nuts
Processed fruitJuice
Processed vegetables
Fresh vegetables
US$m 2009
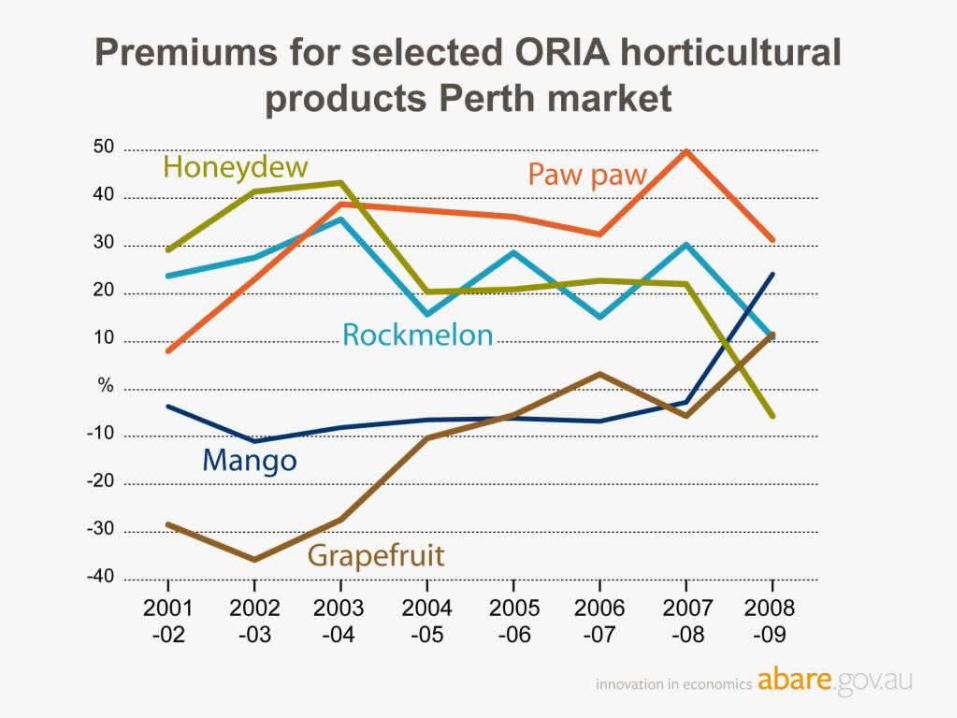
Premiums for selected ORIA horticultural products Perth market
-60
-40
-20
0
20
40
60
2001-02 2002-03 2003-04 2004-05 2005-06 2006-07 2007-08 2008-09
GrapefruitMango
Paw pawHoneydew melon
Rockmelon
%
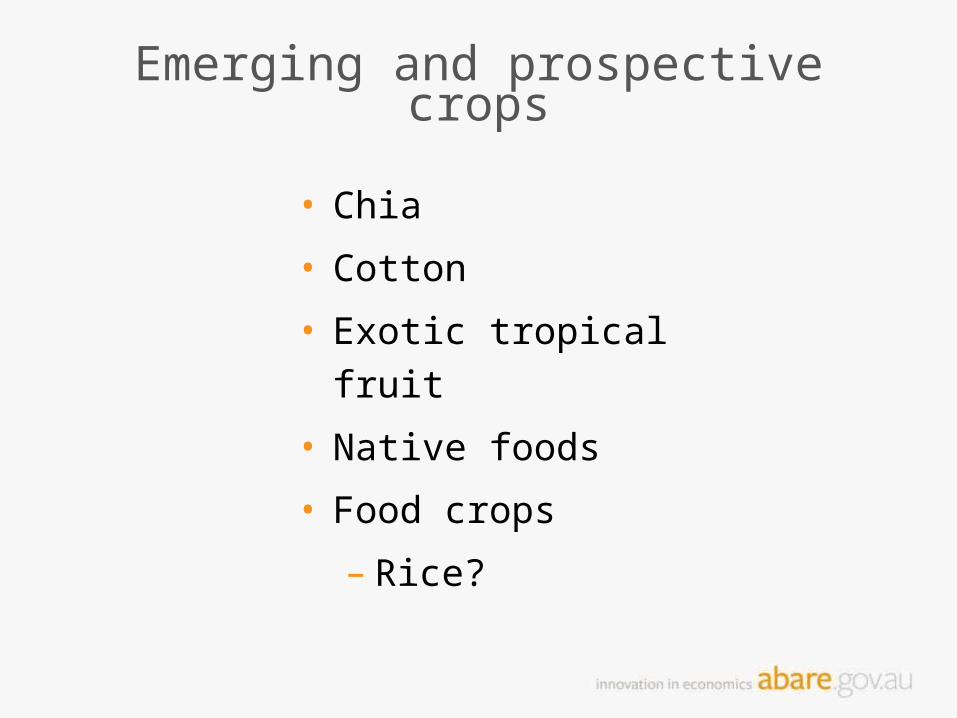
Emerging and prospective crops
• Chia
• Cotton
• Exotic tropical fruit
• Native foods
• Food crops
– Rice?
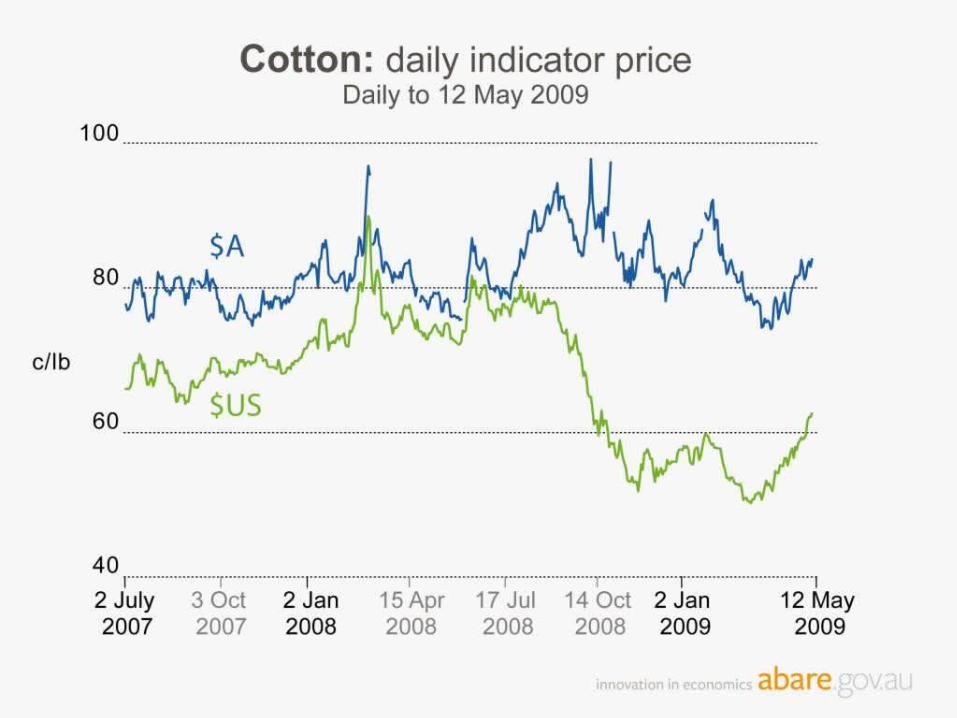
Cotton: daily indicator priceDaily to 12 May 2009
50
60
70
80
90
100
02-Jul-07
15-Nov-07
30-Mar-08
13-Aug-08
27-Dec-08
12-May-09
US$$AMarch forecast
c/lb
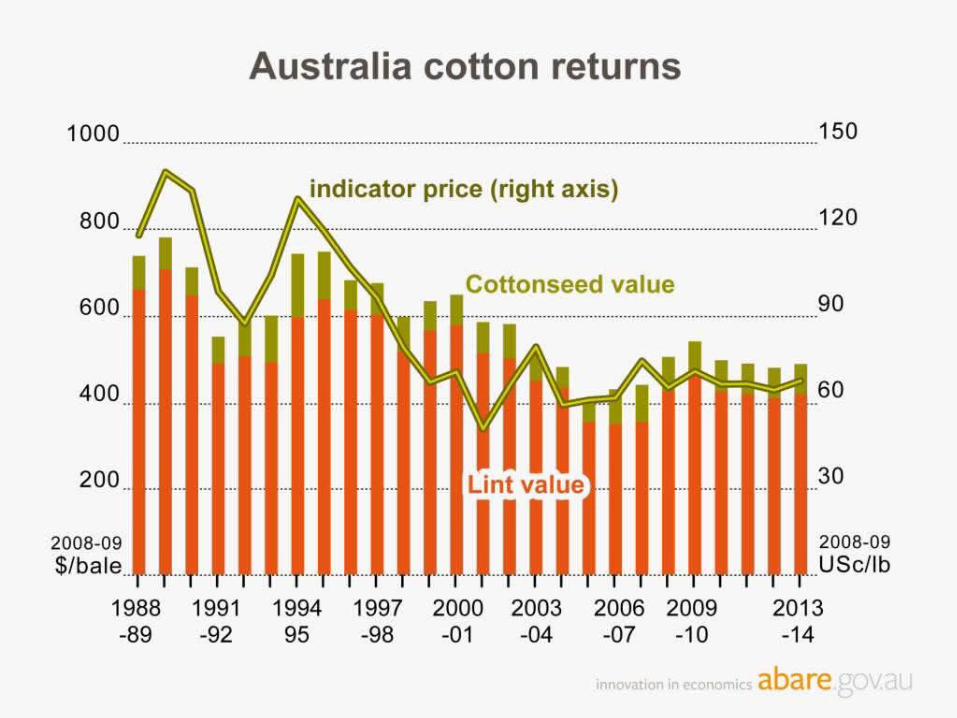
Australia cotton returns
200
400
600
800
1000
1988-89 1993-94 1998-99 2003-04 2008-09 2013-14
30
60
90
120
150Cottonseed valueLint valueIndicator price
$/bale 2008-09
USc/lb2008-09
Summary of outlook
• Solid returns to the Kimberley beef industry
• Continuing strong demand for ORIA horticultural products
– However, expansion in production of some horticultural products could pressure
seasonal price premiums
• Interesting possibilities for ‘new’ irrigated crops