outline( - teded introduction carlson.pdf · outline • the(fuel ......
TRANSCRIPT

Outline • The fuel demands of movements • How we mobilize fuel • When we use certain fuel pathways • Various case studies of the energy demands of sport
• Effects of underfueling • How the movements drive nutri?on prescrip?on
Athletes’ Performance Mission
To provide the finest performance methods, specialists, and facili?es seamlessly integrated to efficiently and
ethically enhance our athletes’ performance.
“The Refuge”

Athletes’ Performance Goals
Rela/onships & Results ©
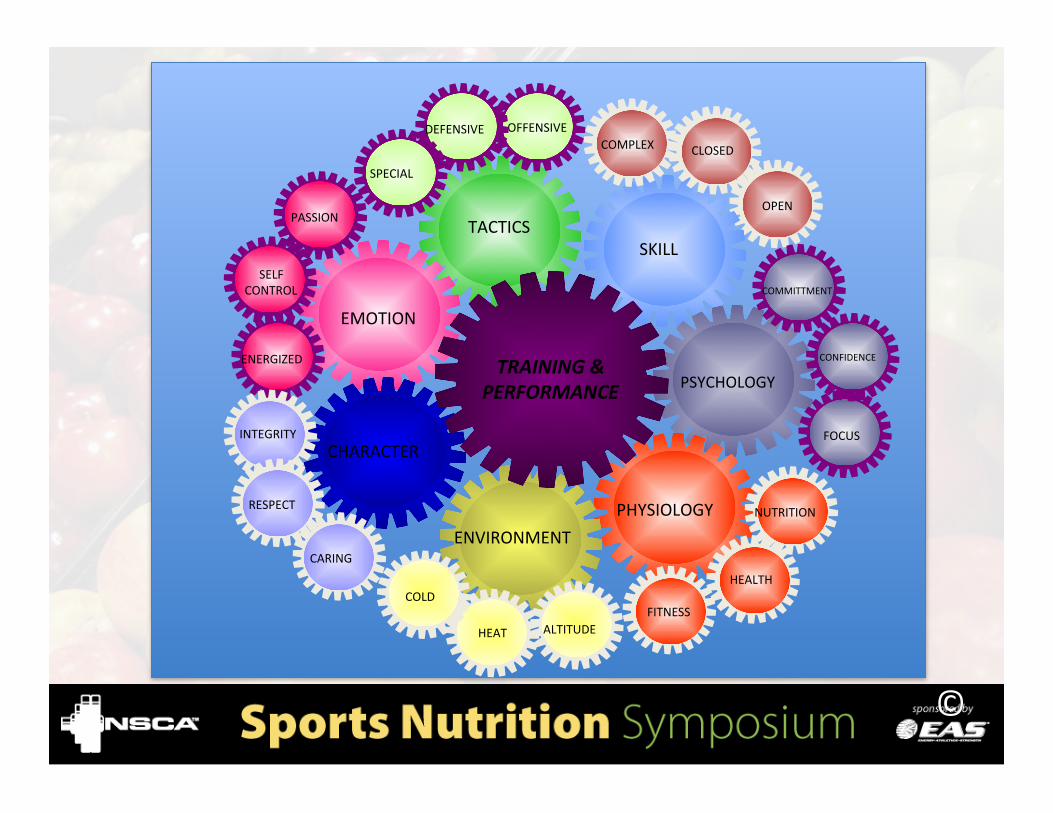
OPEN
SKILL
PSYCHOLOGY
PHYSIOLOGY
TACTICS
EMOTION
CHARACTER
ENVIRONMENT
ALTITUDE HEAT
COLD HEALTH
NUTRITION
FOCUS
CONFIDENCE
COMMITTMENT
CLOSED COMPLEX OFFENSIVE DEFENSIVE
SPECIAL
PASSION
SELF CONTROL
ENERGIZED
INTEGRITY
RESPECT
CARING
FITNESS
TRAINING & PERFORMANCE
©

NUTRITION
CONSISTENCY
TIMING
FUEL/NUTRIENTS
BREAKING DOWN
NUTRITION
“Nutrition can make a good athlete great, or a great athlete good
HYDRATION
©

Bioenerge?cs……
©
The scien?fic study of the flow and transforma?on of energy in and between living organisms and between living organisms and their environment
In rela/onship to sport…….
Katch and Katch, Chapter 4
“The human body con?nuously extracts energy from its fuel nutrients and harnesses it to perform its many biologic func?ons” The Laws of Thermodynamics: Energy is neither created nor destroyed, but instead, transforms from one state to another without being used up.

Crude Oil
• “This energy transduc?on can be viewed as one giant biological refining process that in many respects is similar to the refining of gasoline from crude oil. If we let gasoline represent ATP, then our cells take food molecules (*crude oil) and refine them to produce ATP (*high-‐test gasoline). The food molecule themselves do not provide any direct energy to cells, but instead provide the raw materials to make ATP, which like gasoline in a car engine is used directly in our biological engines to power the metabolic processes of the cell.”

Carbon and Energy Flow
CO2 + H2O
Carbs Proteins Lipids + O2
Photosynthesis Cellular (Aerobic) Respira@on (ATP Produced)

ENERGY TRANSFER • Metabolism
– The sum of all chemical reac?ons that occur in the body – Energy transfer occurs through thousands of complex chemical reac?ons using a balanced mix of macronutrients and micronutrients and a con?nual supply and use of oxygen
• Aerobic – Oxygen requiring energy reac?ons
• Anaerobic – Chemical reac?ons that generate energy rapidly for short dura?ons without oxygen
©Katch and Katch, Chapter 4

Where does the energy come…….. For the movement that we need to create?
Muscle Energy Pathway
Duration of Activity
Type of Activity (%MHR)
Immediate ATP in Muscles ATP+PCr
ATP+PCr+ Muscle Glycogen
1-6 sec 7-20 sec 20-45 sec
Surges and sprints (>80-90)
Short-Term Muscle Glycogen Muscle Glycogen +
Lactic Acid
45-120 sec 120-180 sec
Moderate intensity running (70-79)
Long-Term Muscle Glycogen + Free Fatty Acids
>30 min limited by Oxygen
Low-moderate-intensity running
(<69)

Energy System Produc?on
©Katch and Katch, Chapter 4

CATEGORY PATHWAY SPORTS High Intensity
(Max Effort Las@ng < 30 secs)
Phosphocrea?ne Pathway
Sprinters Jumping/Hurdles Cycle/Swim Sprint Throwing
Olympic Weight Liging Power Liging Gymnas?cs
High Intensity Short Dura@on
Glycolysis Swimmers (200 – 1500m) Runners (1,500 – 2000m) Rowing Wrestling/Boxing
Crew Mountain Biking Speed Ska?ng
IntermiPent High Intensity
Aerobic/Anaerobic Soccer Football Basketball Field Hockey
Ice Hockey Rugby Volleyball Tennis Squash
Endurance Muscle Glycogen + Free Fatty Acids
>2 Hours ½ Marathon Marathon Ironmam Ultraendurance

Where does the energy come…….. For the movement that we need to create?
Muscle Energy Pathway
Duration of Activity
Type of Activity (%MHR)
Immediate ATP in Muscles ATP+PCr
ATP+PCr+ Muscle Glycogen
1-6 sec 7-20 sec 20-45 sec
Surges and sprints (>80-90)
Short-Term Muscle Glycogen Muscle Glycogen +
Lactic Acid
45-120 sec 120-180 sec
Moderate intensity running (70-79)
Long-Term Muscle Glycogen + Free Fatty Acids
>30 min limited by Oxygen
Low-moderate-intensity running
(<69)

Stage I: ATP from the Muscle
• ATP -‐ Adenosine Triphosphate: a complex chemical compound formed with the energy released from food and stored in all cells, par?cularly muscles.
• Only from the energy released by the breakdown of this compound can the cells perform work. The breakdown of ATP produces energy and ADP.

ATP: The Energy Carrier
• Poten?al energy from food is conserved within the bonds of ATP. – In the degrada?on of one mole of ATP to adenosine diphosphate (ADP), the outermost phosphate bond splits and liberates approximately 7.3 kCal of free energy.
• ATP is the compound that is directly used to fuel many chemical reac?ons.

ATP: The Energy Currency • Food provides the major sources of poten?al energy to rejoin ADP and phosphate ion to form ATP.
• Some energy for ATP resynthesis, however, comes directly from the anaerobic splirng of a phosphate from phosphocrea?ne (PCr).

ATP ADP + P + Energy
ATPase
PCr ADP + P +
Crea?ne phosphokinase
Energy

Where does the energy come…….. For the movement that we need to create?
Muscle Energy Pathway
Duration of Activity
Type of Activity (%MHR)
Immediate ATP in Muscles ATP+PCr
ATP+PCr+ Muscle Glycogen
1-6 sec 7-20 sec 20-45 sec
Surges and sprints (>80-90)
Short-Term Muscle Glycogen Muscle Glycogen +
Lactic Acid
45-120 sec 120-180 sec
Moderate intensity running (70-79)
Long-Term Muscle Glycogen + Free Fatty Acids
>30 min limited by Oxygen
Low-moderate-intensity running
(<69)


Carbohydrate As a Fuel Source • During glycolysis, a net of 2 ATP molecules forms during anaerobic substrate-‐level phosphoryla?on.
• Pyruvate converts to acetyl-‐CoA within the mitochondria.
• Acetyl-‐CoA then progresses through the citric acid cycle.

Carbohydrate As a Fuel Source
• Hydrogen atoms released during glucose breakdown oxidize via the respiratory chain; the energy generated couples to ADP phosphoryla?on.
• Electron transport serves as the final common pathway where the electrons extracted from hydrogen pass to oxygen.

Carbohydrate As a Fuel Source • More than 90% of ATP synthesis takes place in the respiratory chain by oxida?ve reac?ons coupled with phosphoryla?on.
• The complete oxida?on of a glucose molecule in skeletal muscle theore?cally yields a net total of 36 ATP molecules.

Where does the energy come…….. For the movement that we need to create?
Muscle Energy Pathway
Duration of Activity
Type of Activity (%MHR)
Immediate ATP in Muscles ATP+PCr
ATP+PCr+ Muscle Glycogen
1-6 sec 7-20 sec 20-45 sec
Surges and sprints (>80-90)
Short-Term Muscle Glycogen Muscle Glycogen +
Lactic Acid
45-120 sec 120-180 sec
Moderate intensity running (70-79)
Long-Term Glycogen + Free Fatty Acids
>30 min limited by Oxygen
Low-moderate-intensity running
(<69)

Lipid As a Fuel • Stored fat represents the body’s most plen?ful source of poten?al energy.
• The complete breakdown of a triacylglycerol molecule yields about 460 molecules of ATP.

Moderate Aerobic Energy Grams Kcals
Liver glycogen 110 451
Muscle glycogen 500 2050
Glucose 15 62
Total 625 2563
Subcutaneous and Visceral Fat
7,800 73,320
Intramuscular Fat
161 1513
Total 7961 74,833
From Wilmore and Costill

Lipid As a Fuel • Numerous interconversions take place among the food nutrients.
• Fawy acids represent a noteworthy excep?on, as they cannot be synthesized to glucose.
• Fawy acid catabolism requires oxygen.

Sources for Fat Catabolism • Triacylglycerol stored within the muscle fiber • Circula?ng triacylglycerol in lipoprotein
complexes – Hydrolyze – catalyzed by lipoprotein lipase
• Circula?ng free fawy acids mobilized from adipose ?ssue
Glycerol
• Breakdown of a single glycerol molecule generates a total of 19 ATP molecules.
• Glycerol provides carbon skeletons for glucose synthesis.

Fawy Acids • Beta (ß)-‐oxida?on converts a free fawy acid to mul?ple acetyl-‐CoA molecules. – Acetyl-‐CoA molecules are oxidized further in the citric acid cycle.
– The released hydrogens oxidize through the respiratory chain.
– Each 18-‐carbon fawy acid molecule generates 147 molecules of ATP.
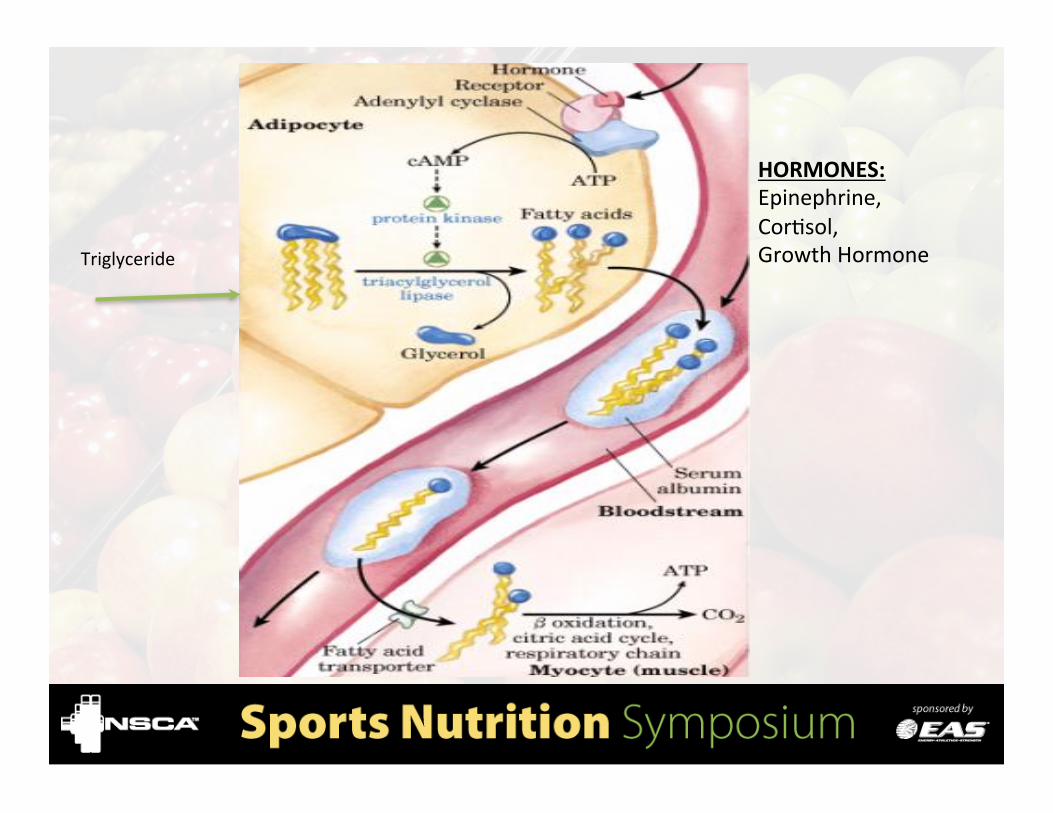
Triglyceride
HORMONES: Epinephrine, Cor?sol, Growth Hormone


Protein • Protein serves as a poten?ally important energy substrate.
• Nitrogen is removed from the amino acid molecule via deamina?on.
• The remaining carbon skeletons enter metabolic pathways to produce ATP.

Control of Metabolic Pathways • Compounds that either inhibit or ac?vate enzymes at key control points in the oxida?ve pathways modulate control of glycolysis and the citric acid cycle.
• Cellular ADP concentra?on exerts the greatest effect on the rate-‐limi?ng enzymes that control energy metabolism.

Control of Bioenerge/cs
Pathway Rate-limiting
Enzyme Stimulators Inhibitors
ATP-PC Creatine kinase ADP ATP
Glycolysis Phosphofructo-kinase ADP, ↑pH ATP, ↓pH
Krebs Isocitrate Dehydrogenasese ADP, Ca, NAD ATP, NADH
E.T.C. Cytochrome oxidase ADP, P ATP

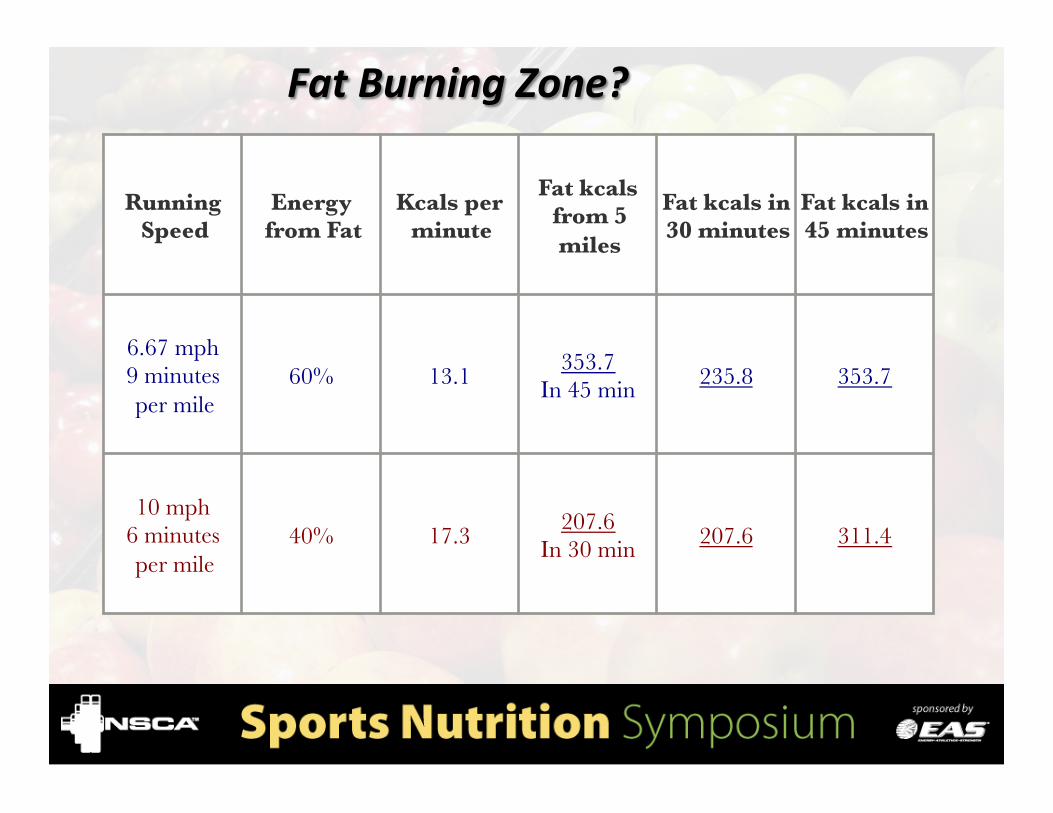
Fat Burning Zone?
Running Speed
Energy from Fat
Kcals per minute
Fat kcals from 5 miles
Fat kcals in 30 minutes
Fat kcals in 45 minutes
6.67 mph 9 minutes per mile
60% 13.1 353.7
In 45 min 235.8 353.7
10 mph 6 minutes per mile
40% 17.3 207.6
In 30 min 207.6 311.4

Sport Specific Examples

FOOTBALL
©

DEMANDS OF FOOTBALL
1. Iosa, MF. 2008

COMPARISON OF ANTHROPMETRICS
1. Kaiser, GE, 2008 2. Kramer, WJ, 2005

ENERGY SYSTEMS
1. Pincivero, DM, 1997, 2. Hitchcock, 2007
• Previously, it has been assumed that football relies primarily on an anaerobic source of energy for adenosine triphosphate (ATP) resynthesis with approximately 90% coming from the phosphocreatine (PCr) energy system. • In lieu of research conducted specifically with football players, it appears that the energy contribution from the anaerobic glycolytic pathway in this sport has been underestimated. The elevated blood lactate levels observed in football players following game participation cast doubt on this hypothesis.

ENERGY SYSTEMS
1. Pincivero, DM, 1997, 2. Hitchcock, 2007

ENERGY SYSTEMS
1. Pincivero, DM, 1997, 2. Hitchcock, 2007

ENERGY/NUTRIENT NEEDS The nutri?onal needs of the 11 players on the team are dependent upon posi?on and minutes played. Games are long, there are many stops, and there is a half-‐?me break, which must be taken into considera?on to provide op?mal fuel. A stress on size and power has lead to an increase in training; therefore, an increase in energy needs.

BASKETBALL
©

DEMANDS OF BASKETBALL
• Short, intense sequences, which reoccur over a longer period such as the course of a game or a prac?ce using both the aerobic and anaerobic energy systems.
• Physical awributes include: – quickness, lateral mobility, agility and balance, jumping ability, coordina?on, physical strength, and a combina?on of aerobic and anaerobic fitness.

DEMANDS OF BASKETBALL • Played by teams of five players • NBA
• 40 minutes playing ?me • Comprised of four quarters of 10 minutes each
• NCAA • 1 hour playing ?me • 2 -‐ 30 minute halves
• With ?me outs and pauses throughout the game, players will ogen be on-‐court upwards of 60 minutes

What are players doing? • 105 +/-‐ 52 high-‐intensity runs (mean dura?on 1.7 s) was recorded for each game, resul?ng in one high-‐intensity run every 21 s during live ?me.
• A mean total of Sixty percent of live ?me was spent engaged in low-‐intensity ac?vity, while 15% was spent in high-‐intensity ac?vity.
• 75% of live ?me was spent with a HR response of greater than 85% peak HR
• The mean blood lactate concentra?on was 6.8 +/-‐ 2.8 mM, indica?ng the involvement of glycolysis in the energy demands of basketball

TENNIS

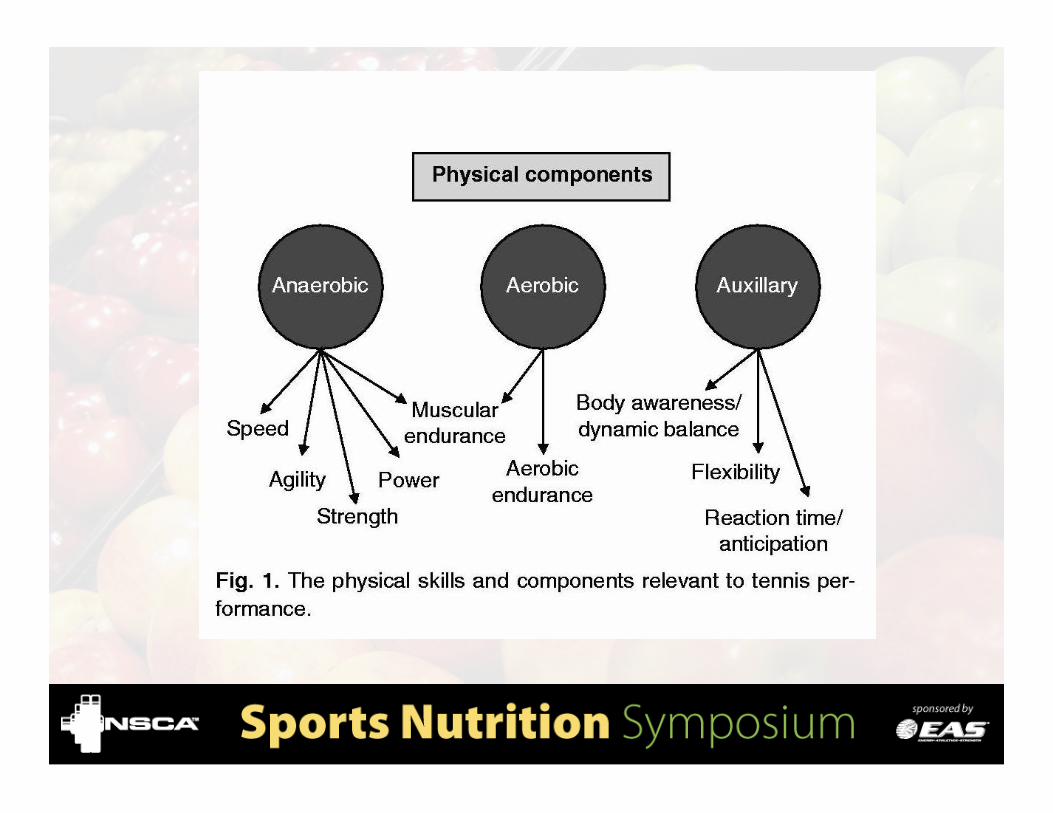
DEMANDS OF TENNIS " Mixture of anaerobic skills: speed, agility, power;
combined with high aerobic capabilities.
" Work-to-rest ratios range between 1:3 and 1:5
" Male athletes " Maintain body fat <12% " Have maximal oxygen uptake values >50 - 70 mL/kg/min
" Average point length is >6 s
" Advancements in the game - the avg point duration in professional tennis matches has decreased

DEMANDS OF TENNIS " Maximum time players are allowed to take between
points: " 20 seconds " 5.2 seconds is avg
" Rest allowed 90sec every 2 games played
" Taking into account average point durations and rest periods, players can therefore expect to rest for 2.3-3.2sec for every second of work performed.
" Future Research: " Fatigue " Recovery " Hormonal " Injury

TENNIS DEMANDS
" Tennis requires anaerobic power, aerobic condi?oning, strength, and agility. Dura?on and intensity can vary each match.
" Male professional singles players must win three of five sets and singles typically last 2-‐4 hours. Females play the best of three sets.
" Most tournaments are 1 week in length but major tournaments are 2 weeks long.

RUGBY
©

RUGBY DEMANDS
Figure 6. High-intensity work breakdown for the four positional groups (mean data, n=29). The figure illustrates the relative contributions of
various work activities to the total work performed.
1. Simon, 2008

RUGBY DEMANDS
Figure 2. Total distance (m) travelled over each 10-min period during match-play (n = 10). *Significantly different to 0-10 min (P < 0.05).
1. Simon, 2008

Figure 3. Distance travelled for 'running work' over each 10-min period of match-play (n = 10).

RUGBY DEMANDS
Figure 4. Time spent performing work activities during each 10-min period of match-play (n = 10).
1. Simon, 2008
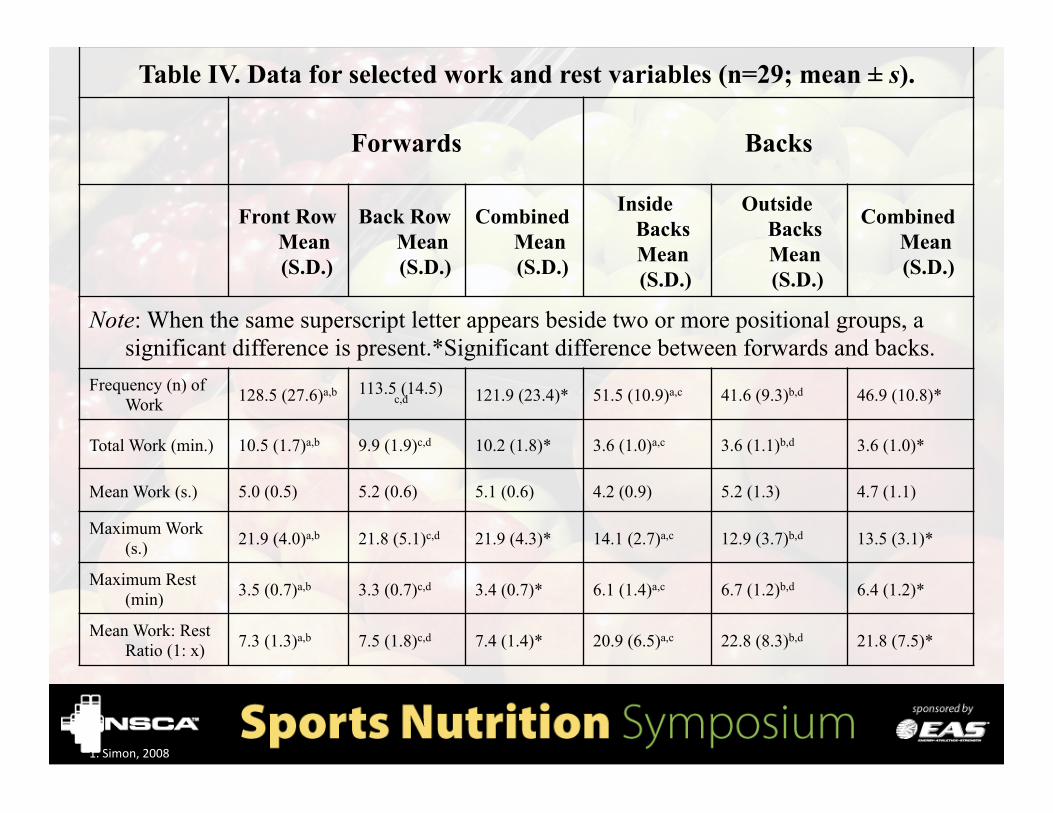
Table IV. Data for selected work and rest variables (n=29; mean ± s).
Forwards Backs
Front Row Mean (S.D.)
Back Row Mean (S.D.)
Combined Mean (S.D.)
Inside Backs Mean (S.D.)
Outside Backs Mean (S.D.)
Combined Mean (S.D.)
Note: When the same superscript letter appears beside two or more positional groups, a significant difference is present.*Significant difference between forwards and backs.
Frequency (n) of Work 128.5 (27.6)a,b 113.5 (14.5)
c,d 121.9 (23.4)* 51.5 (10.9)a,c 41.6 (9.3)b,d 46.9 (10.8)*
Total Work (min.) 10.5 (1.7)a,b 9.9 (1.9)c,d 10.2 (1.8)* 3.6 (1.0)a,c 3.6 (1.1)b,d 3.6 (1.0)*
Mean Work (s.) 5.0 (0.5) 5.2 (0.6) 5.1 (0.6) 4.2 (0.9) 5.2 (1.3) 4.7 (1.1)
Maximum Work (s.) 21.9 (4.0)a,b 21.8 (5.1)c,d 21.9 (4.3)* 14.1 (2.7)a,c 12.9 (3.7)b,d 13.5 (3.1)*
Maximum Rest (min) 3.5 (0.7)a,b 3.3 (0.7)c,d 3.4 (0.7)* 6.1 (1.4)a,c 6.7 (1.2)b,d 6.4 (1.2)*
Mean Work: Rest Ratio (1: x) 7.3 (1.3)a,b 7.5 (1.8)c,d 7.4 (1.4)* 20.9 (6.5)a,c 22.8 (8.3)b,d 21.8 (7.5)*
1. Simon, 2008

ENERGY SYSTEMS
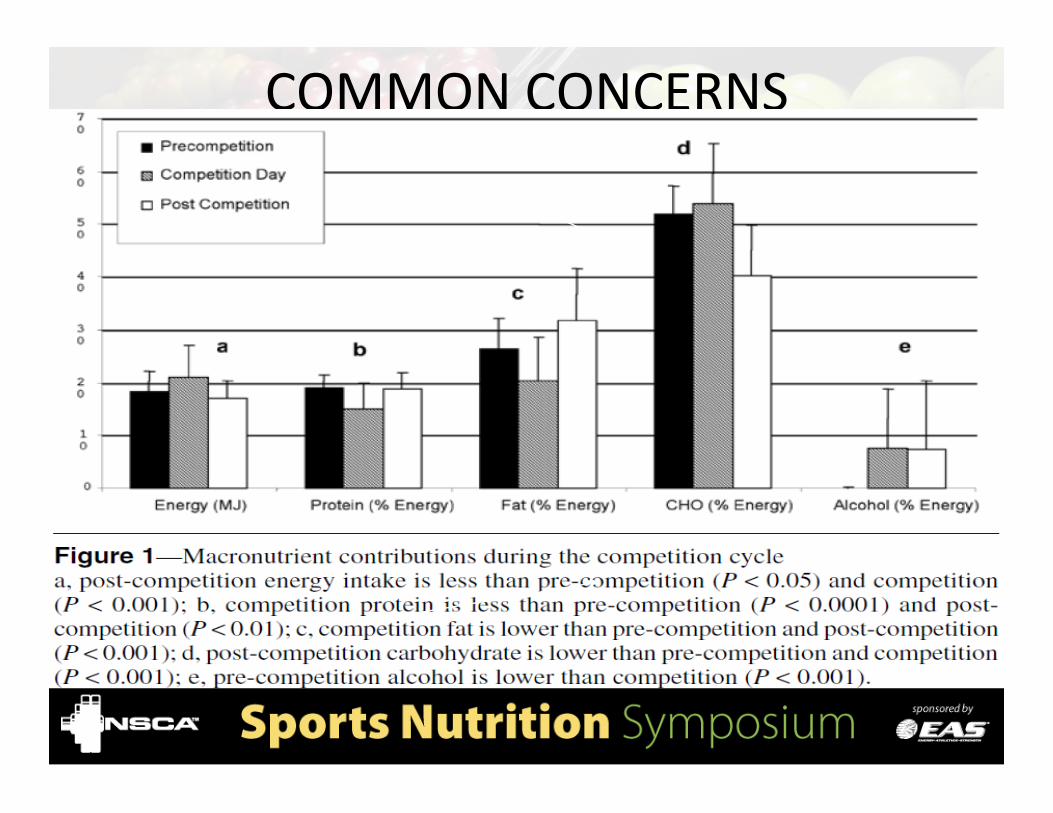
COMMON CONCERNS

HOCKEY
©

HOCKEY DEMANDS • 45-‐90 seconds shigs • 3 -‐ 20 min periods (15 min breaks between periods)
• 15-‐30 minutes of ice ?me • On ice heart rate avg 85% of VO2 max, peak at 90% max
• Varies with player’s efficiency
• Aerobic and Anaerobic pathways are used for energy, further aerobic training ogen needed for higher levels of on-‐ice performance. Stop and go nature of the sport uses both types of muscle fibers
• Energy expenditure higher for forwards in comparison to
defensemen because they cover more ice and require more intense bursts of speed

TYPICAL HOCKEY PLAYER " Professional players range from 180-‐210 lbs and burn 12-‐14 calories/kg/hr OR about 4.5-‐6.7 calories/lb/hr
" Players can expend 3,000-‐6,000 Kcal/day " 150 lb player requires 72 Kcal/Kg which equals 5400 Kcal/day
Twist, et al. A Physiological Analysis of Ice Hockey Posi?ons. Na?onal Strength and Condi?oning Associa?on Journal. 2008;15(6):44-‐46.
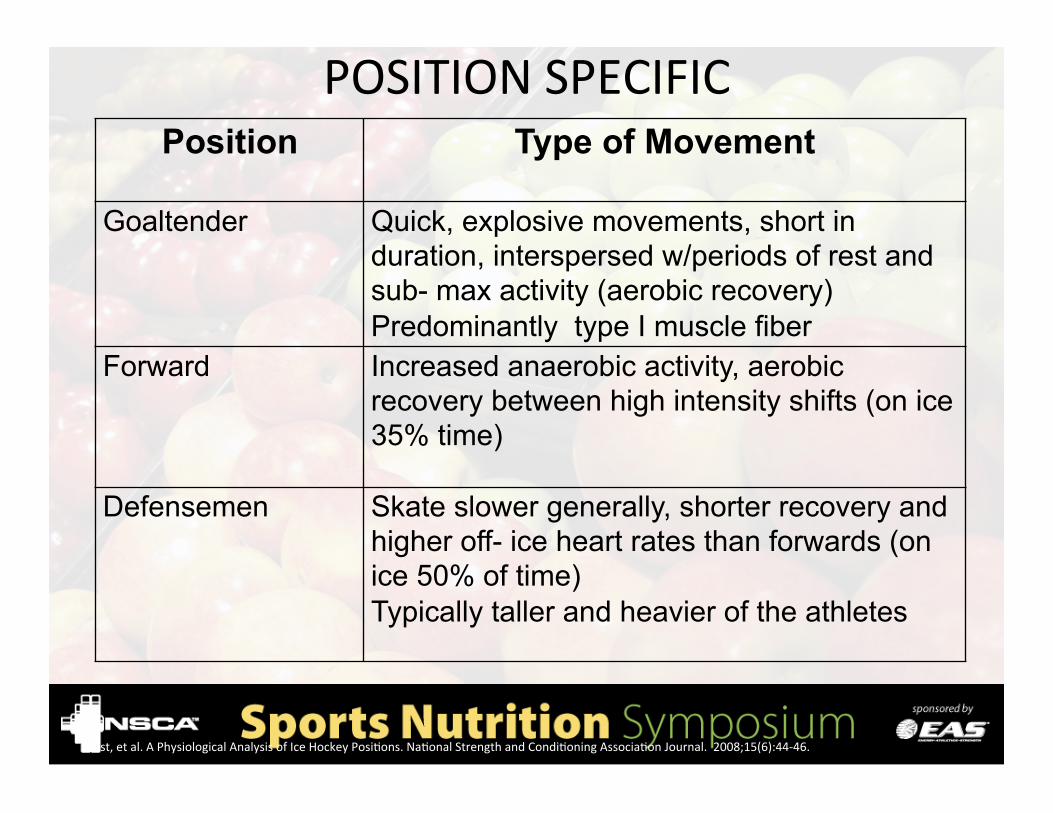
POSITION SPECIFIC Position Type of Movement
Goaltender Quick, explosive movements, short in
duration, interspersed w/periods of rest and sub- max activity (aerobic recovery) Predominantly type I muscle fiber
Forward Increased anaerobic activity, aerobic recovery between high intensity shifts (on ice 35% time)
Defensemen Skate slower generally, shorter recovery and higher off- ice heart rates than forwards (on ice 50% of time) Typically taller and heavier of the athletes
Twist, et al. A Physiological Analysis of Ice Hockey Posi?ons. Na?onal Strength and Condi?oning Associa?on Journal. 2008;15(6):44-‐46.

PROFESSIONAL HOCKEY SCHEDULE • In the regular season, each team plays 82 games
– 41 games at home and 41 on the road – Each team plays 24 games in its division (6 against each divisional opponent)
– 40 games against non-‐divisional intra-‐conference opponents. • That is, 4 games against each team in its conference, but not in its own division.
– Each team plays every team in the other conference at least once (one game each against 12 teams and two games against the remaining 3 teams).
• Approximately 3 games/week plus travel

SOCCER CASE STUDY

Soccer: What defines it?
• Short, intense bursts of ac?vity combined with moderately intense exercise and occasional rest periods.
• The field is larger than that of a football field and players will cover ~5-‐7 miles in a game. The game consists of two, 45 minute halves with a 15 minute halgime.
• A 75 kg player may expend 1500 kcal in a game and could lose about 1.5 L of flud.

Energy Demands • Typically these athletes train to improve endurance capacity as
well as muscle strength and condi?oning. Both anaerobic and aerobic energy produc?on is important.
• Anaerobic energy produc?on is essen?al for high-‐intensity exercise, although sprin?ng occurs less than 1% of total playing ?me.
• Total energy expended during a soccer match is directly related to the distance covered during the 90 minutes of the game (and warm up).
• The stop and go nature uses both types of muscle fibers, the fast twitch fibers exhibit the greatest degree of glycogen deple?on and slow twitch are ac?vated at lower workloads.
Energy Demands
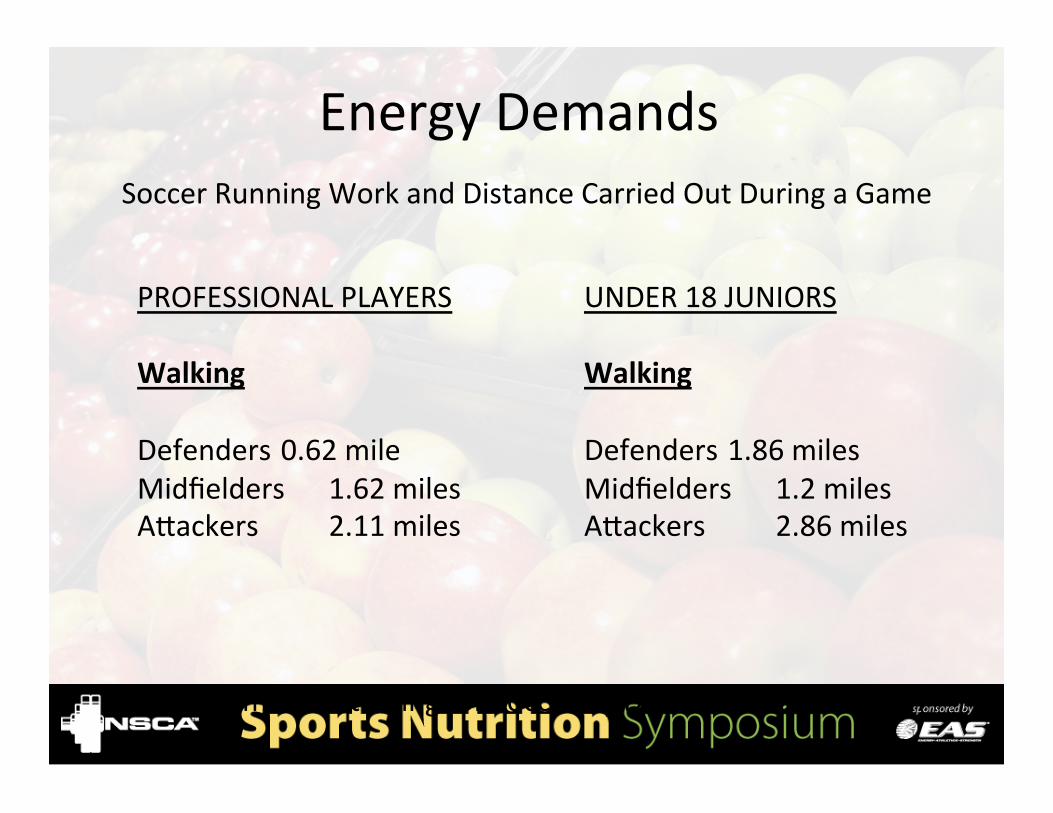
PROFESSIONAL PLAYERS Walking Defenders 0.62 mile Midfielders 1.62 miles Awackers 2.11 miles
UNDER 18 JUNIORS Walking Defenders 1.86 miles Midfielders 1.2 miles Awackers 2.86 miles
Soccer Running Work and Distance Carried Out During a Game
* Data from Condi?oning for Soccer by Dr. Raymond Verheijen

Energy Demands
PROFESSIONAL PLAYERS Jogging Defenders 1.2 miles Midfielders 3.2 miles Awackers 1.2 miles
UNDER 18 JUNIORS Jogging Defenders 1.6 miles Midfielders 3.7 miles Awackers 1.4 miles
Soccer Running Work and Distance Carried Out During a Game
* Data from Condi?oning for Soccer by Dr. Raymond Verheijen

Energy Demands
PROFESSIONAL PLAYERS Running Defenders 0.9 mile Midfielders 1.1 miles Awackers 1 mile
UNDER 18 JUNIORS Running Defenders 0.75 mile Midfielders 0.75 mile Awackers 0.74 mile
Soccer Running Work and Distance Carried Out During a Game
* Data from Condi?oning for Soccer by Dr. Raymond Verheijen

Energy Demands
Soccer Running Work and Distance Carried Out During a Game
PROFESSIONAL PLAYERS Sprin?ng Defenders 0.87 mile Midfielders 0.64 mile Awackers 1.1 miles
UNDER 18 JUNIORS Sprin?ng Defenders 0.56 mile Midfielders 0.50 mile Awackers 0.81 mile
* Data from Condi?oning for Soccer by Dr. Raymond Verheijen

Energy Demands
Soccer Running Work and Distance Carried Out During a Game
PROFESSIONAL PLAYERS Total Distance Defenders 5.2 miles Midfielders 6.8 miles Awackers 6.1 miles
UNDER 18 JUNIORS Total Distance Defenders 5.0 miles Midfielders 6.6 miles Awackers 5.8 miles
* Data from Condi?oning for Soccer by Dr. Raymond Verheijen

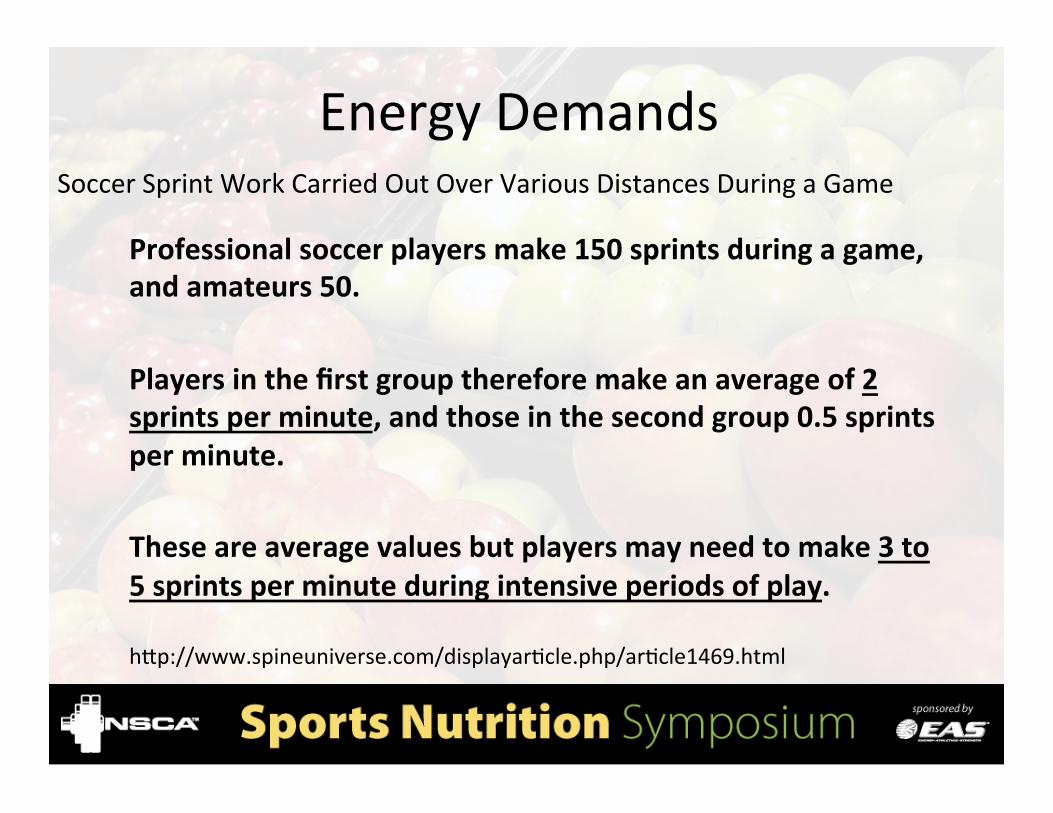
Energy Demands Soccer Sprint Work Carried Out Over Various Distances During a Game
PROFESSIONAL PLAYERS Total Number of Sprints Defenders 162 Midfielders 127 Awackers 182
UNDER 18 JUNIORS Total Number of Sprints Defenders 101 Midfielders 094 Awackers 134
Energy Demands Soccer Sprint Work Carried Out Over Various Distances During a Game
Professional soccer players make 150 sprints during a game, and amateurs 50. Players in the first group therefore make an average of 2 sprints per minute, and those in the second group 0.5 sprints per minute. These are average values but players may need to make 3 to 5 sprints per minute during intensive periods of play.
hwp://www.spineuniverse.com/displayar?cle.php/ar?cle1469.html

©
Soccer players who are under-‐fueled tend to cover less ground in the second half Soccer players who are op4mally fueled are able to perform 33% more HIGH intensity running during games and prac?ces Soccer players who are just slightly dehydrated experienced:
1. Slower running speeds 2. Deteriorated dribbling skills 3. Training and play seemed harder PROPER NUTRITION WILL HELP YOUR PERFORMANCE AND
RECOVERY!
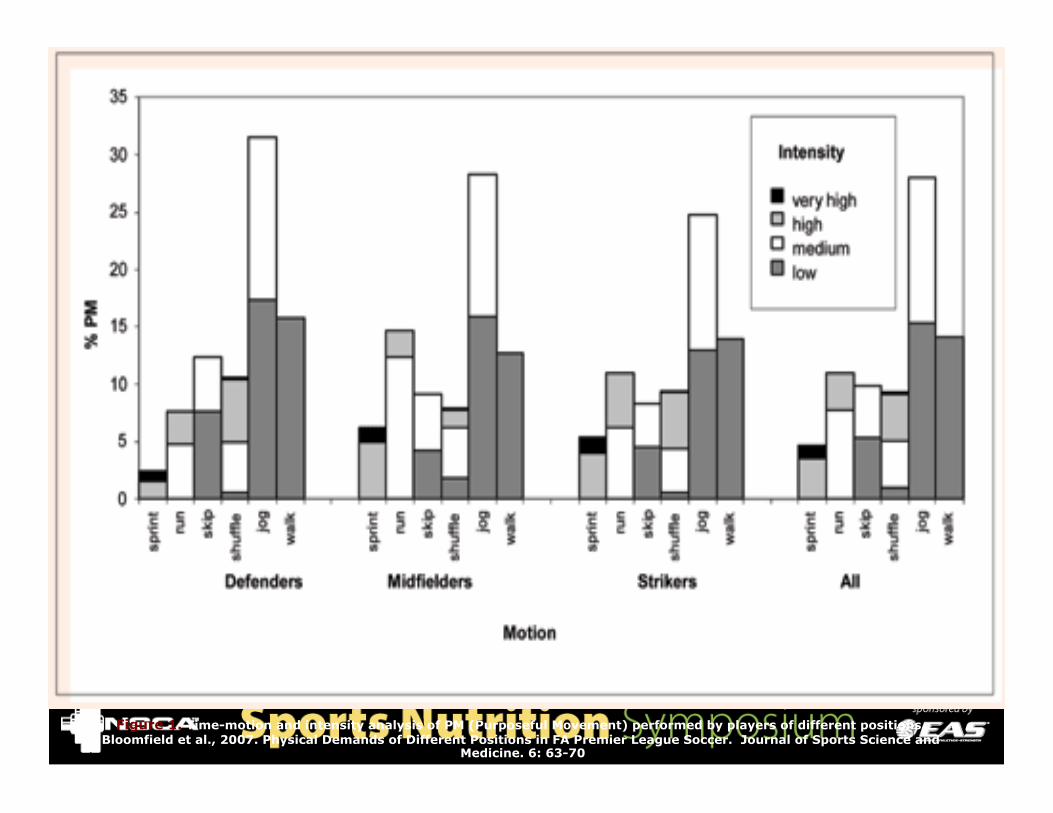
Figure 1. Time-motion and intensity analysis of PM (Purposeful Movement) performed by players of different positions. Bloomfield et al., 2007. Physical Demands of Different Positions in FA Premier League Soccer. Journal of Sports Science and
Medicine. 6: 63-70


Muscle Glycogen Concentra?on

Muscle Glycogen Concentra?on

Muscle Glycogen Concentra?on

The match is averaged at
70% of VO2 Max
Muscle Energy Pathway
Duration of Activity
Type of Activity (%MHR)
Immediate ATP in Muscles ATP+PCr
ATP+PCr+ Muscle Glycogen
1-6 sec 7-20 sec 20-45 sec
Surges and sprints (>80-90)
Short-Term Muscle Glycogen Muscle Glycogen +
Lactic Acid
45-120 sec 120-180 sec
Moderate intensity running (70-79)
Long-Term Muscle Glycogen + Free Fatty Acids
>30 min limited by Oxygen
Low-moderate-intensity running
(<69)

Energy Expenditure vs. Intake
• German Football Club (2006) – Training Day:
• Energy Expenditure = 3,859 + 823 kcal/day • Energy Intake = 2,780 + 823 kcal/day • CHO Expenditure = 444.57 + 18.2 g/day • CHO Intake = 327.00 + 168.3 g/day

Energy Expenditure vs. Intake
• German Football Club (2006) – Match Day:
• Energy Expenditure = 5,021 + 1,269 kcal/day • Energy Intake = 2,809 + 1,178 kcal/day • CHO Expenditure = 663.93 + 338.57 g/day • CHO Intake = 318.62 + 132.87 g/day • ***Energy expenditure was significantly higher during the second half (717 kcal) vs. the first half (622 kcala)
• CHO expenditure was significanly higher during the second half (152g) vs. the first half (125g)

Energy Expenditure vs. Intake
• German Football Club (2006) – Rest Day:
• Energy Expenditure = 2,985 kcal/day + 434 kcal/day • Energy Intake = 2,485 + 857 kcal/day • No significant difference between CHO intake and expenditure
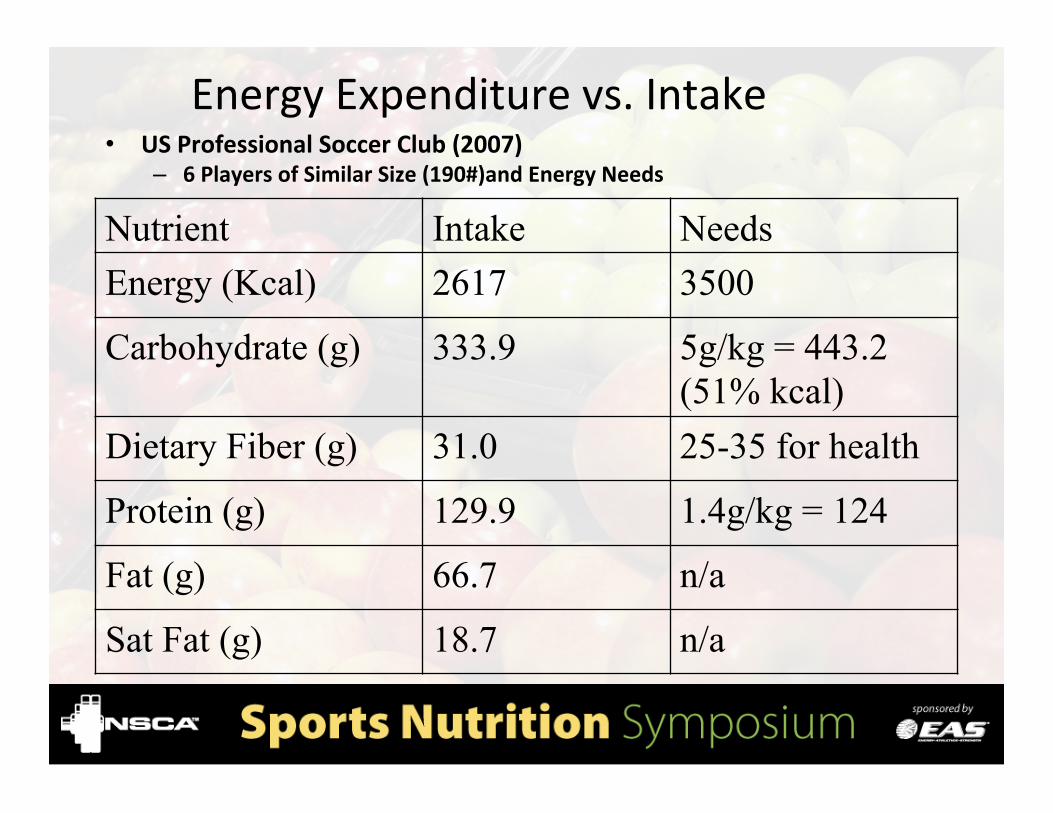
Energy Expenditure vs. Intake
• US Professional Soccer Club (2007)
– 6 Players of Similar Size (190#)and Energy Needs
Nutrient Intake Needs Energy (Kcal) 2617 3500
Carbohydrate (g) 333.9 5g/kg = 443.2 (51% kcal)
Dietary Fiber (g) 31.0 25-35 for health
Protein (g) 129.9 1.4g/kg = 124
Fat (g) 66.7 n/a
Sat Fat (g) 18.7 n/a

Energy Expenditure vs. Intake
• Qatar Professional Soccer Club
– 10 Players of Similar Size (147#)and Energy Needs
Nutrient Intake Needs Energy (Kcal) 3387 3500
Carbohydrate (g) 458 5g/kg = 335 (51% kcal)
Dietary Fiber (g) 17.8 25-35 for health
Protein (g) 141 1.4g/kg = 124
Fat (g) 120 n/a
Sat Fat (g) 45 n/a

Interna?onal Journal of Sports Physiology & Performance, Jun2007, Vol. 2 Issue 2, p111-‐127
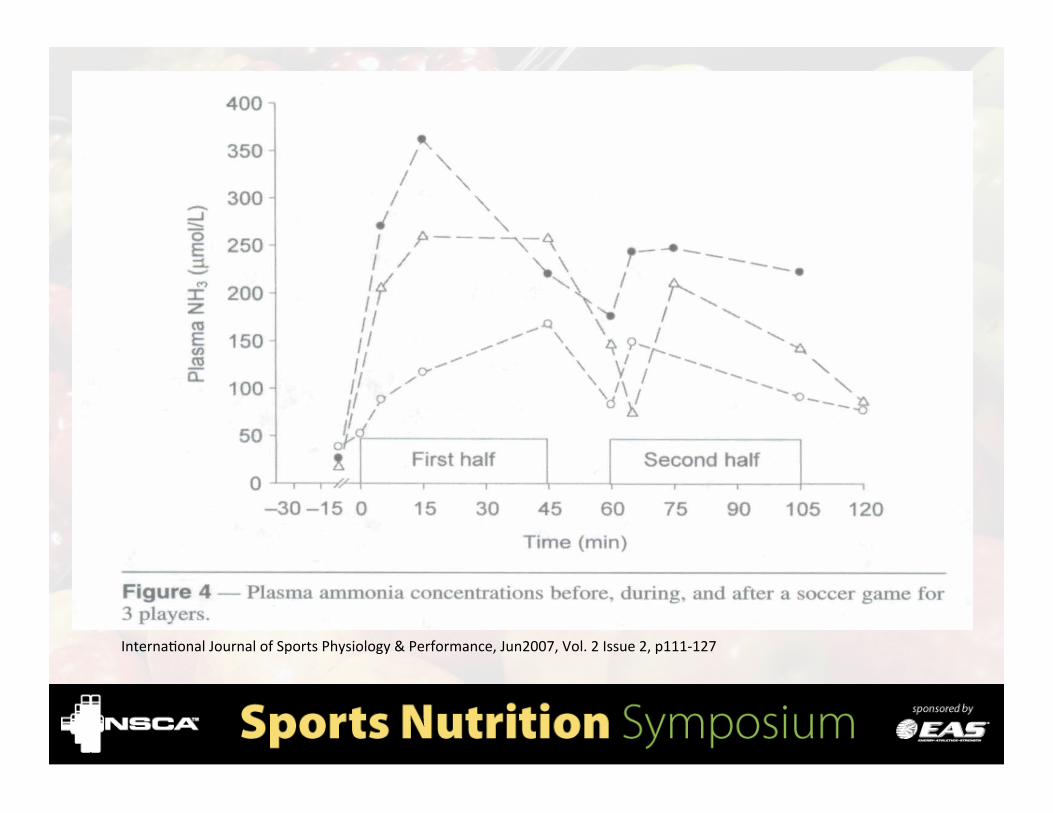
Interna?onal Journal of Sports Physiology & Performance, Jun2007, Vol. 2 Issue 2, p111-‐127


Journal of Sports Sciences, Jul2006, Vol. 24 Issue 7, p665-‐674


Breaking Down Performance Nutri?on
Training Day
Game or Race Day
Vs.

Everyday Nutri?on/Hydra?on: The founda/on to performance Nutri/on
Performance Nutri/on
TIMING
FUEL/FLUIDS
©

“Sport is not Science, but Science may improve the Level of
Sport” (Modified Bangsbo, 1993)

1. Noun
1. The act or process of nourishing or being nourished: the sum of the
processes by which an animal or plant takes in and utilizes food
©
To suckle, nourish, flow, damp, “it drips”
HABITUAL INTAKE

Amanda Carlson, MS, RD, CSSD [email protected]
480-‐449-‐9000 www.athletesperformance.com www.coreperformance.com
For more info on our educa@on programs: www.athletesperformance.com/educa?on