outline overview overview gdp growth gdp growth the global financial and economic crisis the global...
TRANSCRIPT

A REVIEW OF RECENT A REVIEW OF RECENT
MACROECONOMIC MACROECONOMIC
PERFORMANCEPERFORMANCE

OUTLINEOUTLINE• OVERVIEWOVERVIEW• GDP GROWTHGDP GROWTH• THE GLOBAL FINANCIAL AND THE GLOBAL FINANCIAL AND
ECONOMIC CRISISECONOMIC CRISIS• PRICE MOVEMENTSPRICE MOVEMENTS• GOVERNMENT FINANCEGOVERNMENT FINANCE
– RevenueRevenue– ExpenditureExpenditure– Foreign ResourcesForeign Resources
• NATIONAL DEBT DEVELOPMENTSNATIONAL DEBT DEVELOPMENTS– External DebtExternal Debt– Domestic DebtDomestic Debt
OUTLINE (ContdOUTLINE (Contd11))
• MONEY AND CREDIT DEVELOPMENTSMONEY AND CREDIT DEVELOPMENTS– Money SupplyMoney Supply– Credit to the Private SectorCredit to the Private Sector– Interest Rates DevelopmentsInterest Rates Developments– Exchange RatesExchange Rates
• THE SECOND GENERATION FINANCIAL THE SECOND GENERATION FINANCIAL SECTOR REFORMSECTOR REFORM
• EXTERNAL SECTOR PERFORMANCEEXTERNAL SECTOR PERFORMANCE– ExportsExports– ImportsImports– Balance of PaymentsBalance of Payments
OUTLINE (ContdOUTLINE (Contd22))
• PRIVATE SECTOR DEVELOPMENTPRIVATE SECTOR DEVELOPMENT– InvestmentsInvestments– Foreign Direct InvestmentForeign Direct Investment

OVERVIEWOVERVIEW•Strong economic performanceStrong economic performance
– Despite the impact of the global Despite the impact of the global financial/economic crisisfinancial/economic crisis• GDP growthGDP growth
– 7.4% in 20087.4% in 2008– 7.1% in 20077.1% in 2007
•Projected to grow at 5.0% in 2009Projected to grow at 5.0% in 2009– Impact of the global financial/economic Impact of the global financial/economic
crisiscrisis– Prolonged droughtProlonged drought

OVERVIEW (Contd)OVERVIEW (Contd)
– High growth registered inHigh growth registered in• Communications (20.5%)Communications (20.5%)•Financial intermediation (11.9%)Financial intermediation (11.9%)•Construction (10.5%)Construction (10.5%)
– Substantial slowdown registered inSubstantial slowdown registered in•Mining and QuarryingMining and Quarrying
– 10.7% (2007)10.7% (2007)– 2.5% (2008)2.5% (2008)
•Electricity and gasElectricity and gas– 10.9% (2007)10.9% (2007)– 5.4% (2008)5.4% (2008)

Trends in selected macroeconomic indicators 2000 Trends in selected macroeconomic indicators 2000 - 2008- 2008 20002000 20012001 20022002 20032003 20042004 20052005 20062006 20072007 20082008
Real GDP Growth - %Real GDP Growth - % 4.94.9 6.06.0 7.27.2 6.96.9 7.87.8 7.47.4 6.76.7 7.17.1 7.47.4
Inflation - annual average - %Inflation - annual average - % 6.06.0 5.15.1 4.34.3 5.35.3 4.74.7 5.05.0 7.37.3 7.07.0 10.310.3
Exchange Rate (Tshs/USD) – annual Exchange Rate (Tshs/USD) – annual averageaverage 803.3803.3 877.3877.3 967.1967.1 744.8744.8 1038.91038.9 1089.11089.1 1129.21129.2 1253.91253.9 1196.31196.3
Exchange Rate (Tshs/USD) – end of Exchange Rate (Tshs/USD) – end of periodperiod 803.3803.3 916.3916.3 976.3976.3 1063.61063.6 1043.01043.0 1165.51165.5 1261.61261.6 1132.11132.1 1280.31280.3
Merchandise Exports (mil. Merchandise Exports (mil. US$) - FOBUS$) - FOB 763.8763.8 752.6752.6 588.5588.5 543.3543.3 663.3663.3 851.3851.3 979.6979.6 1216.11216.1 1473.11473.1
Merchandise Imports (mil. US$) - FOBMerchandise Imports (mil. US$) - FOB 663.3663.3 851.3851.3 979.6979.6 1216.11216.1 1481.61481.6 1,679.11,679.1 1,743.31,743.3 2,024.22,024.2 2688.92688.9Export/Import ratio (Goods) - %Export/Import ratio (Goods) - % 49.649.6 54.654.6 64.864.8 62.962.9 59.759.7 56.056.0 45.145.1 41.641.6 41.841.8Current Account Balance (% of GDP)Current Account Balance (% of GDP) -6.9-6.9 9.39.3 9.49.4 2.02.0 -6.1-6.1 -6.1-6.1 -8.0-8.0 -9.4-9.4 -11.0-11.0Investment/GDP ratio ( % of GDP)Investment/GDP ratio ( % of GDP) 17.617.6 17.017.0 18.918.9 18.518.5 21.021.0 22.022.0 23.423.4 24.424.4 26.326.3Foreign Direct Investment ( mil. USD)Foreign Direct Investment ( mil. USD) 463.4463.4 467.2467.2 387.6387.6 308.2308.2 330.6330.6 447.6447.6 616.6616.6 653.4653.4 695.5695.5Foreign Reserves (months of imports)Foreign Reserves (months of imports) 5.75.7 6.66.6 8.78.7 9.29.2 7.77.7 6.06.0 5.05.0 4.84.8 4.64.6
2000/012000/01 2001/022001/02 2002/032002/03 2003/042003/04 2004/052004/05 2005/062005/06 2006/072006/07 2007/082007/08 2007/092007/09
Govt. Domestic Revenue (% GDPmp)Govt. Domestic Revenue (% GDPmp) 10.810.8 10.710.7 10.810.8 11.211.2 11.811.8 12.412.4 14.114.1 16.016.0 15.915.9Total Govt. Expenditure (% GDPmp)Total Govt. Expenditure (% GDPmp) 15.115.1 1515 15.415.4 19.319.3 21.221.2 23.523.5 23.023.0 22.822.8 25.325.3Fiscal Bal. (before grants) % GDPmpFiscal Bal. (before grants) % GDPmp -4.3-4.3 -4.3-4.3 -4.6-4.6 -8.1-8.1 -9.3-9.3 -11.1-11.1 -8.9-8.9 -6.8-6.8 -10.9-10.9Fiscal Bal.(after grants) - % GDPmpFiscal Bal.(after grants) - % GDPmp -1.0-1.0 -0.4-0.4 -0.2-0.2 -2.8-2.8 -4.5-4.5 -5.1-5.1 -3.9-3.9 0.00.0 -4.7-4.7Average Deposit rate - %Average Deposit rate - % 4.24.2 3.53.5 3.13.1 2.42.4 2.52.5 2.612.61 2.542.54 2.592.59 2.682.68Average Lending rate - %Average Lending rate - % 19.619.6 16.416.4 15. 715. 7 1414 14.414.4 15.415.4 16.416.4 16.0316.03 16.0516.05
Domestic debt/Total public debtDomestic debt/Total public debt 12.512.5 11.111.1 13.213.2 13.813.8 1616 21.221.2 37.837.8 38.038.0 34.734.7
External Debt/Total Public DebtExternal Debt/Total Public Debt 87.587.5 88.988.9 86.886.8 86.286.2 8484 78.578.5 62.262.2 62.062.0 64.664.6
Total Public Debt/GDPTotal Public Debt/GDP 65.665.6 61.661.6 58.458.4 53.553.5 48.948.9 50.850.8 48.248.2 32.032.0 30.030.0
External debt services/ExportsExternal debt services/Exports 18.218.2 1111 13.713.7 11.311.3 8.78.7 5.75.7 2.52.5 2.12.1 2.42.4
Domestic debt servi./domestic revenueDomestic debt servi./domestic revenue 26.726.7 25.425.4 51.651.6 28.128.1 28.828.8 53.753.7 39.739.7 38.138.1 12.312.3

REAL GDP GROWTH RATESREAL GDP GROWTH RATES ECONOMIC ACTIVITYECONOMIC ACTIVITY 20012001 20022002 20032003 20042004 20052005 20062006 20072007 20082008 20092009
Agriculture, Hunting and ForestryAgriculture, Hunting and Forestry 4.94.9 4.94.9 3.13.1 5.95.9 4.34.3 3.83.8 4.04.0 4.64.6 2.72.7CropsCrops 5.35.3 5.65.6 3.23.2 6.66.6 4.44.4 4.04.0 4.54.5 5.15.1 2.92.9
Cash CropsCash Crops 9.69.6 13.713.7 8.68.6 10.710.7 -0.2-0.2 2.82.8 3.73.7 6.96.9 3.83.8 Food CropsFood Crops 4.74.7 4.44.4 2.32.3 5.95.9 5.25.2 4.34.3 4.64.6 4.94.9 2.82.8
LivestockLivestock 4.04.0 2.82.8 2.22.2 4.14.1 4.44.4 2.42.4 2.42.4 2.62.6 2.52.5Hunting and ForestryHunting and Forestry 3.63.6 3.33.3 3.03.0 2.72.7 3.63.6 4.64.6 2.92.9 3.43.4 1.61.6
FishingFishing 4.84.8 6.86.8 6.06.0 6.76.7 6.06.0 5.05.0 4.54.5 5.05.0 3.03.0Industry and constructionIndustry and construction 6.66.6 9.49.4 10.910.9 10.910.9 10.410.4 8.58.5 9.59.5 8.68.6 5.65.6
Mining and quarryingMining and quarrying 13.913.9 16.916.9 17.117.1 16.016.0 16.116.1 15.615.6 10.710.7 2.52.5 2.02.0ManufacturingManufacturing 5.05.0 7.57.5 9.09.0 9.49.4 9.69.6 8.58.5 8.78.7 9.99.9 6.66.6Electricity, gasElectricity, gas 5.95.9 6.26.2 7.27.2 7.57.5 9.49.4 -1.9-1.9 10.910.9 5.45.4 3.03.0Water supplyWater supply 3.53.5 2.82.8 4.54.5 5.25.2 4.34.3 6.26.2 6.56.5 6.66.6 5.05.0ConstructionConstruction 7.67.6 11.911.9 13.813.8 13.013.0 10.110.1 9.59.5 9.79.7 10.510.5 6.36.3
ServicesServices 6.46.4 7.77.7 7.87.8 7.87.8 8.08.0 7.87.8 8.18.1 8.58.5 6.06.0Trade and repairsTrade and repairs 6.46.4 8.38.3 9.79.7 5.85.8 6.76.7 9.59.5 9.89.8 10.010.0 6.86.8Hotels and restaurantsHotels and restaurants 4.84.8 6.46.4 3.23.2 3.63.6 5.65.6 4.34.3 4.44.4 4.54.5 1.91.9TransportTransport 4.94.9 5.95.9 5.05.0 8.68.6 6.76.7 5.35.3 6.56.5 6.96.9 5.25.2CommunicationsCommunications 8.78.7 10.410.4 15.615.6 17.417.4 18.818.8 19.219.2 20.120.1 20.520.5 13.513.5Financial intermediationFinancial intermediation 6.96.9 10.110.1 10.710.7 8.38.3 10.810.8 11.411.4 10.210.2 11.911.9 7.47.4Real estate/ business servicesReal estate/ business services 4.24.2 7.17.1 6.56.5 6.86.8 7.57.5 7.37.3 7.07.0 7.17.1 4.94.9Public administrationPublic administration 10.510.5 9.29.2 9.69.6 13.613.6 11.411.4 6.56.5 6.76.7 7.07.0 5.25.2EducationEducation 11.411.4 7.07.0 2.82.8 4.04.0 4.04.0 5.05.0 5.55.5 6.96.9 5.35.3HealthHealth 5.65.6 8.68.6 8.78.7 7.87.8 8.18.1 8.58.5 8.88.8 9.09.0 6.96.9Other social/personal servicesOther social/personal services 3.13.1 2.12.1 2.02.0 3.03.0 2.62.6 3.73.7 3.23.2 3.13.1 2.62.6
Gross Value Added before adjustmentsGross Value Added before adjustments 6.06.0 7.27.2 6.96.9 7.87.8 7.47.4 6.86.8 7.37.3 7.57.5 5.05.0less FISIMless FISIM 2.52.5 8.78.7 11.711.7 10.110.1 11.811.8 14.914.9 15.315.3 11.011.0 7.67.6
Gross Value Added at current basic pricesGross Value Added at current basic prices 6.06.0 7.27.2 6.96.9 7.87.8 7.47.4 6.76.7 7.27.2 7.47.4 5.05.0add Taxes on productsadd Taxes on products 6.06.0 7.27.2 6.96.9 7.87.8 7.47.4 6.86.8 6.96.9 7.87.8 5.75.7GDP at market pricesGDP at market prices 6.06.0 7.27.2 6.96.9 7.87.8 7.47.4 6.76.7 7.17.1 7.47.4 5.05.0

Trends in GDP Performance: 2000 - Trends in GDP Performance: 2000 - 20082008

GLOBAL ECONOMIC RECESSION AND THE GLOBAL ECONOMIC RECESSION AND THE MEDIUM TERM OUTLOOKMEDIUM TERM OUTLOOK
• The global economy pulling out the recession The global economy pulling out the recession
(October 2009 WEO)(October 2009 WEO)
– Stabilization uneven Stabilization uneven – Recovery to be slowRecovery to be slow– Financial conditions improving, more Financial conditions improving, more
than expected, owing mainly to than expected, owing mainly to Government intervention in:Government intervention in:•Public capital injectionPublic capital injection
•Easing monetary policy stanceEasing monetary policy stance
•Fiscal stimulus packagesFiscal stimulus packages

GLOBAL ECONOMIC RECESSION AND THE GLOBAL ECONOMIC RECESSION AND THE MEDIUM TERM OUTLOOK (Contd)MEDIUM TERM OUTLOOK (Contd)
• Global economic forecasts Global economic forecasts – To contract in 2009 by 1.4% To contract in 2009 by 1.4% – Expand in 2010 by 2.5%Expand in 2010 by 2.5%– Growth in emerging Asian economies Growth in emerging Asian economies
revised upwards to 5.5% in 2009 rising to revised upwards to 5.5% in 2009 rising to 7.0% by 20107.0% by 2010

GLOBAL ECONOMIC RECESSION AND THE GLOBAL ECONOMIC RECESSION AND THE MEDIUM TERM OUTLOOK (Contd)MEDIUM TERM OUTLOOK (Contd)
• Tanzania like all other countries affected by the Tanzania like all other countries affected by the Global financial/economic crisis, albeit to a Global financial/economic crisis, albeit to a lesser extent lesser extent – GDP Growth expected to slow down to 5.0% GDP Growth expected to slow down to 5.0%
in 2009 in 2009 – GDP growth expected to pick up in the GDP growth expected to pick up in the
medium-termmedium-term• Mitigating measuresMitigating measures
– Rescue packageRescue package•Ensure food securityEnsure food security•Protect employmentProtect employment•Support critical social programmesSupport critical social programmes•Protect potential investmentProtect potential investment
– Kilimo KwanzaKilimo Kwanza

GLOBAL ECONOMIC RECESSION AND THE GLOBAL ECONOMIC RECESSION AND THE MEDIUM TERM OUTLOOK (Contd)MEDIUM TERM OUTLOOK (Contd)
• Mitigating measuresMitigating measures– ThroughThrough
•Compensation to lossesCompensation to losses– Coffee, cotton etc.Coffee, cotton etc.
•Guarantees for exporters and SMEsGuarantees for exporters and SMEs•Expanded fertilizer subsidyExpanded fertilizer subsidy
– Operational guidelines on condition of Operational guidelines on condition of access, procedures of evaluations, access, procedures of evaluations, eligibility etc. put in placeeligibility etc. put in place
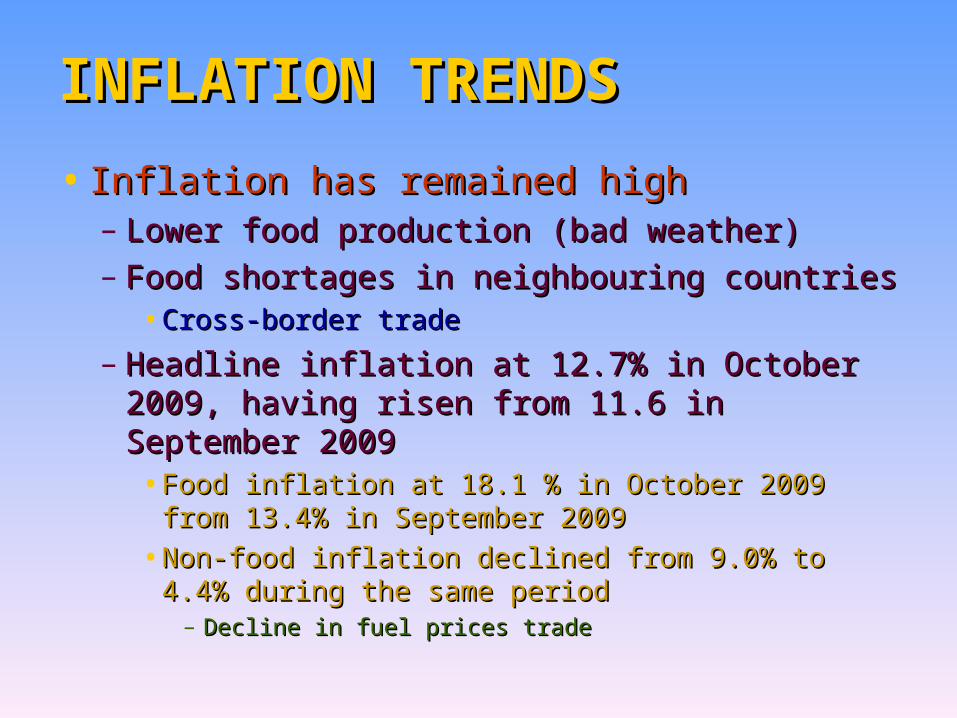
INFLATION TRENDSINFLATION TRENDS
• Inflation has remained highInflation has remained high– Lower food production (bad weather)Lower food production (bad weather)– Food shortages in neighbouring countriesFood shortages in neighbouring countries
•Cross-border tradeCross-border trade
– Headline inflation at 12.7% in October Headline inflation at 12.7% in October 2009, having risen from 11.6 in September 2009, having risen from 11.6 in September 20092009•Food inflation at 18.1 % in October 2009 from Food inflation at 18.1 % in October 2009 from
13.4% in September 200913.4% in September 2009
•Non-food inflation declined from 9.0% to 4.4% Non-food inflation declined from 9.0% to 4.4% during the same periodduring the same period
– Decline in fuel prices tradeDecline in fuel prices trade

Overview of the World Economic Outlook Overview of the World Economic Outlook ProjectionsProjections
1515

INFLATION TRENDSINFLATION TRENDS
• Inflation under 5.0% since 2001Inflation under 5.0% since 2001– Hovering around 4.0% until mid-2004 Hovering around 4.0% until mid-2004
when it started inching up, reaching when it started inching up, reaching 6.5% in March 20066.5% in March 2006•Food shortagesFood shortages
– DroughtDrought– Cross-border tradeCross-border trade
•Petroleum pricesPetroleum prices
– Expected harvests to improve food Expected harvests to improve food suppliessupplies• Inflation expected to declineInflation expected to decline

Monthly Inflation Trend 2008 - 2009
18
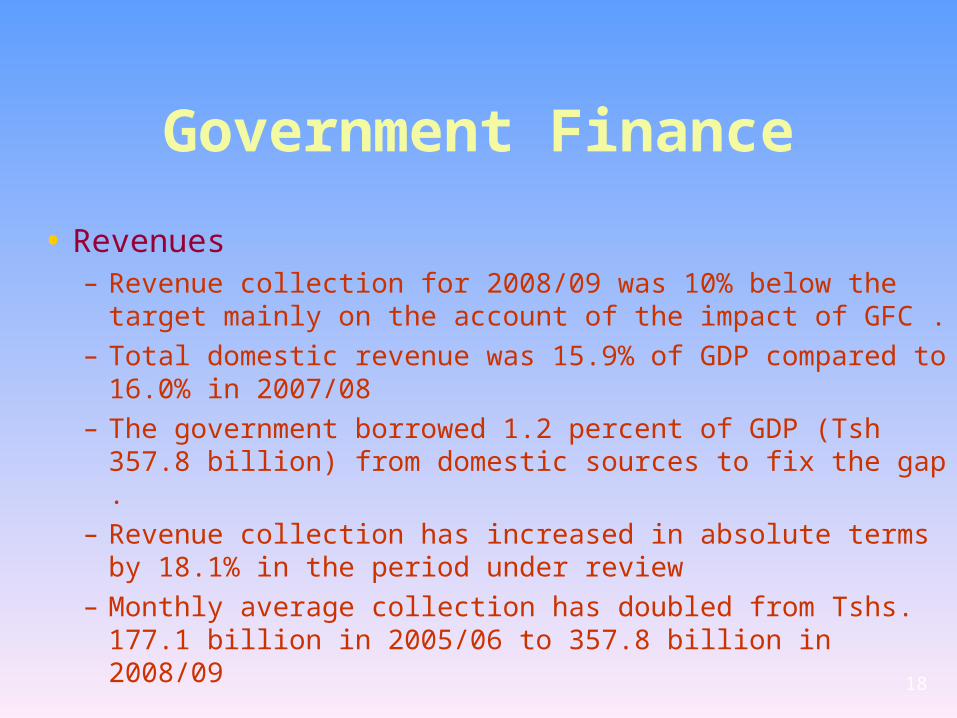
Government Finance
• Revenues– Revenue collection for 2008/09 was 10% below the
target mainly on the account of the impact of GFC . – Total domestic revenue was 15.9% of GDP
compared to 16.0% in 2007/08– The government borrowed 1.2 percent of GDP (Tsh
357.8 billion) from domestic sources to fix the gap .
– Revenue collection has increased in absolute terms by 18.1% in the period under review
– Monthly average collection has doubled from Tshs. 177.1 billion in 2005/06 to 357.8 billion in 2008/09

Government Finance.
Revenues (contd)– The Fiscal Performance during July – Sept.
2009/10 also characterized by a shortfall in revenue collection•Domestic revenue =Tshs 1,107.2 billion,
equivalent to 87.4% of the target for the period compared to 96% last year
•Total grant for the period under review was Tshs 494 billion, equivalent to 60% of the target.
19

Government Finance
• Expenditure– Total expenditure in 2008/09 was 25.3% of GDP compared
to 22.9% in 2007/08 • 95.0% of the total estimate for the period
– Dev. expenditure was 14.0% below budget estimates while recurrent expenditure was broadly in line with budget estimates
– Expenditure during the first quarter of 2009/10 was 88.4% of the target compared to 81%
– Recurrent and dev. expenditures in the same period was 86 and 94 % of the estimate respectively, higher compared to 85 and 73% percent respectively in year 2007/08
20
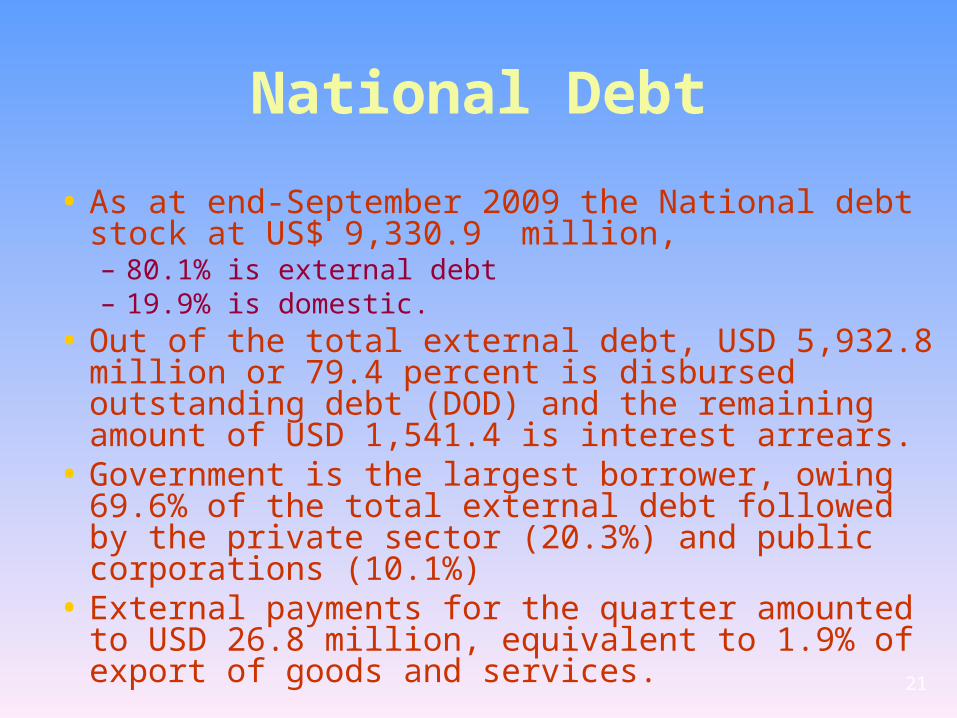
National Debt
• As at end-September 2009 the National debt stock at US$ 9,330.9 million, – 80.1% is external debt – 19.9% is domestic.
• Out of the total external debt, USD 5,932.8 million or 79.4 percent is disbursed outstanding debt (DOD) and the remaining amount of USD 1,541.4 is interest arrears.
• Government is the largest borrower, owing 69.6% of the total external debt followed by the private sector (20.3%) and public corporations (10.1%)
• External payments for the quarter amounted to USD 26.8 million, equivalent to 1.9% of export of goods and services.
21
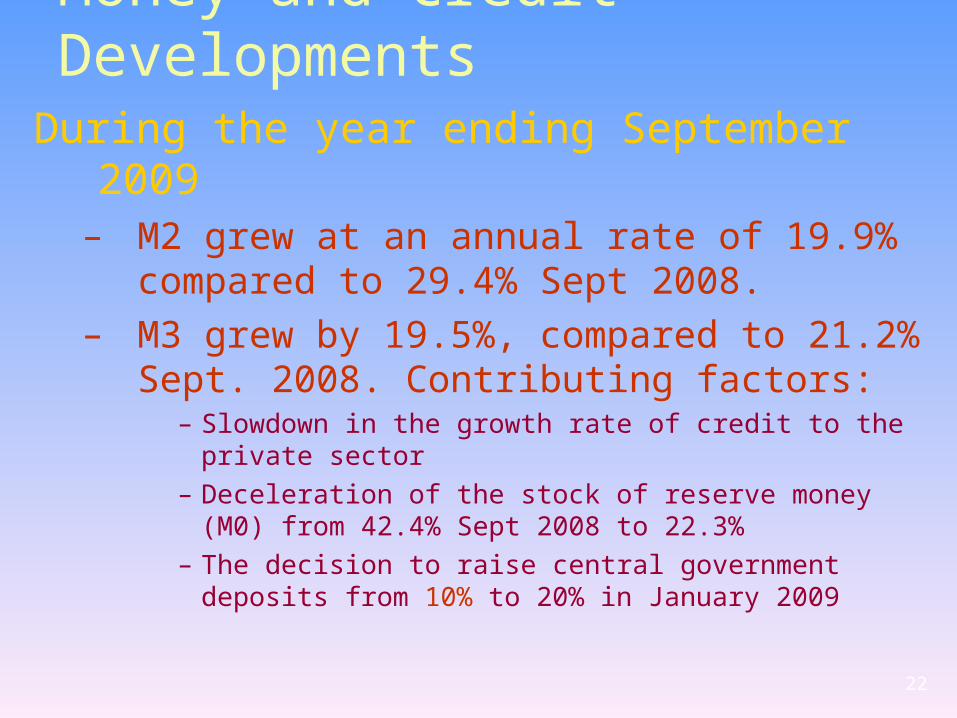
Money and Credit Developments
During the year ending September 2009– M2 grew at an annual rate of 19.9%
compared to 29.4% Sept 2008. – M3 grew by 19.5%, compared to 21.2%
Sept. 2008. Contributing factors:– Slowdown in the growth rate of credit to the private
sector– Deceleration of the stock of reserve money (M0) from
42.4% Sept 2008 to 22.3%– The decision to raise central government deposits
from 10% to 20% in January 2009
22

Annual Growth Rates of Monetary Annual Growth Rates of Monetary AggregatesAggregates
2323
10
15
20
25
30
35
40
45
Jul-
07
Aug
-07
Sep
-07
Oct
-07
Nov
-07
Dec
-07
Jan
-08
Feb
-08
Mar
-08
Apr
-08
May
-08
Jun
-08
Jul-
08
Aug
-08
Sep
-08
Oct
-08
Nov
-08
Dec
-08
Jan
-09
Feb
-09
Mar
-09
Apr
-09
May
-09
Jun
-09
Jul-
09
Aug
-09
Sep
-09
Perc
ent
Stock of Reserve money (M0) Average reserve money (M0) Extended broad money (M3)
Broad money (M2) Narrow money (M1)
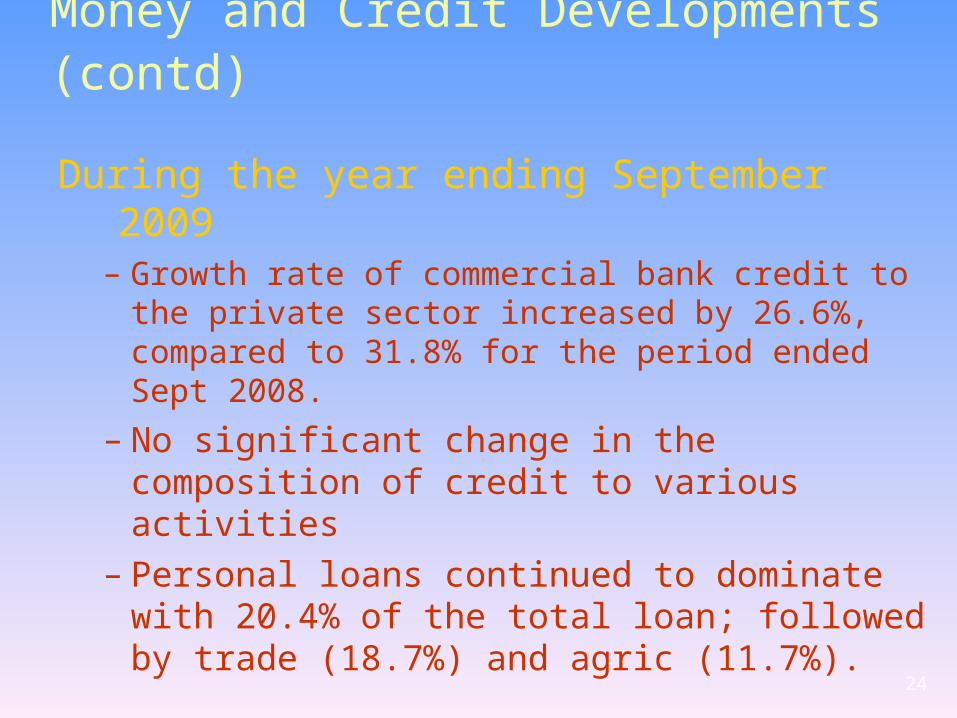
Money and Credit Developments (contd)
During the year ending September 2009– Growth rate of commercial bank credit to the
private sector increased by 26.6%, compared to 31.8% for the period ended Sept 2008.
– No significant change in the composition of credit to various activities
– Personal loans continued to dominate with 20.4% of the total loan; followed by trade (18.7%) and agric (11.7%).
24

Money and Credit Money and Credit DevelopmentsDevelopments
During the year ending September 2009– Overall time deposit rate improved slightly to
an average of 6.63% from 6.59% in Sept 2008.– Negotiated deposit rates decreased to 9.27%
from an average of 10.27% in Sept 2008– Savings deposit rates have generally stabilized
at around 2.7% – On the other hand: Overall lending rate
averaged 14.90%, the same rate as it was in Sept 2008
– Negotiated lending rate increased slightly to 13.81% from 12.91% in Sept 2008
– Short term (up to one year) lending rate decreased to 13.98% from 14.04% in Sept 2008

Second Generation Financial Sector Second Generation Financial Sector ReformReform
• Tanzania’s financial sector is undergoing comprehensive reforms under the joint World Bank-IMF Financial Sector Assessment Program (FSAP)
• The recent assessment of the program has shown substantial progress in the development and stability of the financial sector and liquidity management– The banking system is generally well capitalized
and sound, notwithstanding a modest increase in non-performing loans in the wake of the GFC
26
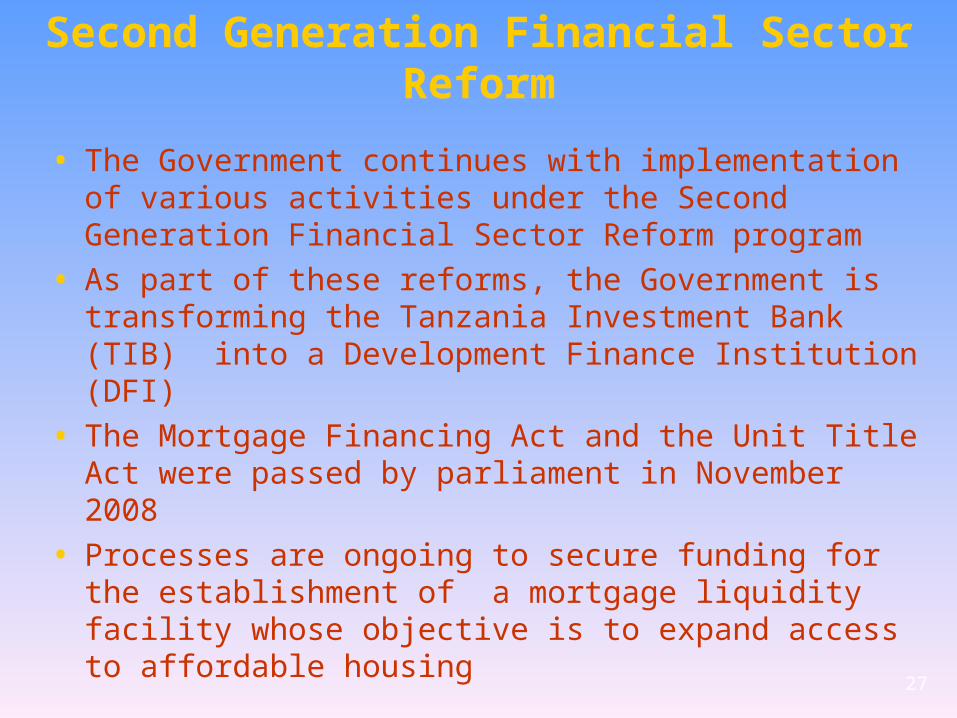
Second Generation Financial Sector Reform
• The Government continues with implementation of various activities under the Second Generation Financial Sector Reform program
• As part of these reforms, the Government is transforming the Tanzania Investment Bank (TIB) into a Development Finance Institution (DFI)
• The Mortgage Financing Act and the Unit Title Act were passed by parliament in November 2008
• Processes are ongoing to secure funding for the establishment of a mortgage liquidity facility whose objective is to expand access to affordable housing
27

External Trade Performance • Exports
– Export earnings (Goods and services) increased by 3.2%, from USD 4463.7million in Sept 2008 to USD 4,606.6 million in Sept 2009.
– The increase was attributed to:•The increase in the value of tradition exports specifically
coffee, tobacco and cloves. • Improved export performance in manufactured goods,
horticultural products, fish and fish products
– Services receipts decreased by 2.6% mainly caused by 18% decline in transportation receipts resulting from GFC.
– Travel (including tourism) which accounts for about 60% of services receipts recorded a marginal increase of 0.9%. 28
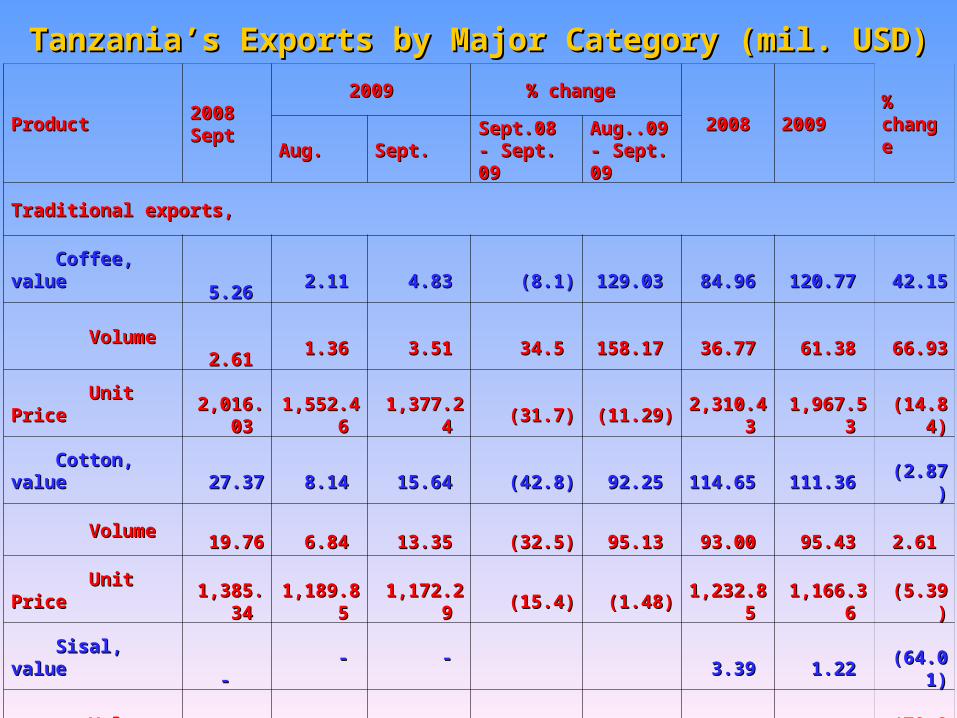
Tanzania’s Exports by Major Category (mil. USD)Tanzania’s Exports by Major Category (mil. USD)
ProductProduct 2008 Sept2008 Sept20092009 % change % change
20082008 20092009 % % changechange
Aug.Aug. Sept.Sept. Sept.08 - Sept.08 - Sept. 09Sept. 09
Aug..09 - Aug..09 - Sept. 09Sept. 09
Traditional exports, Traditional exports,
Coffee, value Coffee, value 5.26 5.26 2.11 2.11 4.83 4.83 (8.1)(8.1) 129.03 129.03 84.96 84.96 120.77 120.77 42.15 42.15
Volume Volume 2.61 2.61 1.36 1.36 3.51 3.51 34.5 34.5 158.17 158.17 36.77 36.77 61.38 61.38 66.93 66.93
Unit Price Unit Price 2,016.03 2,016.03 1,552.46 1,552.46 1,377.24 1,377.24 (31.7)(31.7) (11.29)(11.29) 2,310.43 2,310.43 1,967.53 1,967.53 (14.84)(14.84)
Cotton, value Cotton, value 27.37 27.37 8.14 8.14 15.64 15.64 (42.8)(42.8) 92.25 92.25 114.65 114.65 111.36 111.36 (2.87)(2.87)
Volume Volume 19.76 19.76 6.84 6.84 13.35 13.35 (32.5)(32.5) 95.13 95.13 93.00 93.00 95.43 95.43 2.61 2.61
Unit Price Unit Price 1,385.34 1,385.34 1,189.85 1,189.85 1,172.29 1,172.29 (15.4)(15.4) (1.48)(1.48) 1,232.85 1,232.85 1,166.36 1,166.36 (5.39)(5.39)
Sisal, value Sisal, value - - - - - - 3.39 3.39 1.22 1.22 (64.01)(64.01)
Volume Volume - - - - - - 3.22 3.22 0.68 0.68 (78.88)(78.88)
Unit Price Unit Price - - - - - - 1,054.85 1,054.85 1,802.37 1,802.37 70.87 70.87

Tanzania’s Exports by Major Category (mil. USD)Tanzania’s Exports by Major Category (mil. USD)
ProductProduct 2008 Sept2008 Sept20092009 % change % change
20082008 20092009 % % changechange
Aug.Aug. Sept.Sept. Sept.08 - Sept.08 - Sept. 09Sept. 09
Aug..09 - Aug..09 - Sept. 09Sept. 09
Traditional exports, (contd)Traditional exports, (contd)
Tea, value Tea, value 2.55 2.55 1.57 1.57 1.40 1.40 (45.0)(45.0) (10.61)(10.61) 37.60 37.60 30.00 30.00 (20.21)(20.21)
Volume Volume 1.32 1.32 0.78 0.78 0.64 0.64 (51.3)(51.3) (17.91)(17.91) 25.29 25.29 18.28 18.28 (27.72)(27.72)
Unit Price Unit Price 1,927.38 1,927.38 2,002.40 2,002.40 2,180.49 2,180.49 13.1 13.1 8.89 8.89 1,486.60 1,486.60 1,641.17 1,641.17 10.40 10.40
Tobacco, value Tobacco, value 13.21 13.21 24.15 24.15 20.45 20.45 54.8 54.8 (15.31)(15.31) 69.76 69.76 160.41 160.41 129.95 129.95
Volume Volume 3.13 3.13 8.56 8.56 8.25 8.25 163.6 163.6 (3.58)(3.58) 27.22 27.22 55.70 55.70 104.63 104.63
Unit Price Unit Price 4,222.51 4,222.51 2,822.96 2,822.96 2,479.38 2,479.38 (41.3)(41.3) (12.17)(12.17) 2,562.94 2,562.94 2,879.73 2,879.73 12.36 12.36
Cashewnuts, value Cashewnuts, value - - - - - - 55.84 55.84 51.51 51.51 (7.75)(7.75)
Volume Volume - - - - - - 76.64 76.64 68.16 68.16 (11.06)(11.06)
Unit Price Unit Price - - - - - - 728.54 728.54 755.72 755.72 3.73 3.73
Cloves, value Cloves, value 1.17 1.17 1.48 1.48 2.71 2.71 131.9 131.9 82.86 82.86 6.24 6.24 17.21 17.21 175.80 175.80
Volume Volume 0.29 0.29 0.52 0.52 0.89 0.89 205.3 205.3 71.92 71.92 1.70 1.70 5.37 5.37 215.88 215.88
Unit Price Unit Price 4,011.66 4,011.66 2,881.55 2,881.55 3,064.88 3,064.88 (23.6)(23.6) 6.36 6.36 3,664.67 3,664.67 3,205.25 3,205.25 (12.54)(12.54)
Sub Total Sub Total 49.56 49.56 37.45 37.45 45.05 45.05 (9.1)(9.1) 20.29 20.29 372.43 372.43 492.49 492.49 32.24 32.24
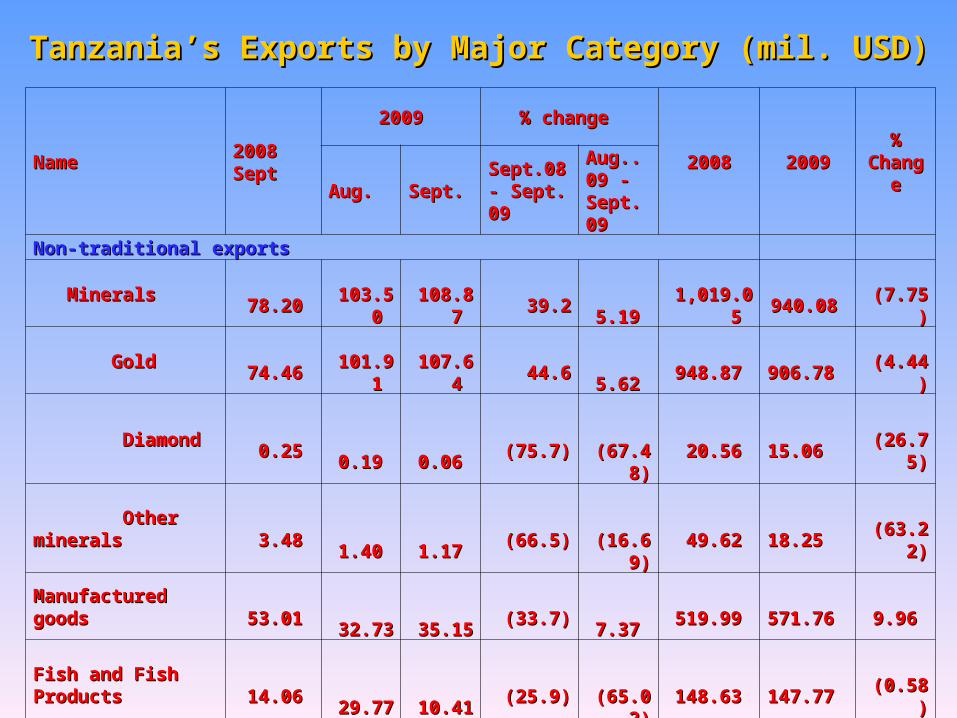
NameName 2008 Sept2008 Sept20092009 % change % change
20082008 20092009 % % ChangeChange
Aug.Aug. Sept.Sept. Sept.08 - Sept.08 - Sept. 09Sept. 09
Aug..09 - Aug..09 - Sept. 09Sept. 09
Non-traditional exportsNon-traditional exports
MineralsMinerals 78.20 78.20 103.50 103.50
108.87 108.87 39.2 39.2
5.19 5.19 1,019.05 1,019.05 940.08 940.08 (7.75)(7.75)
GoldGold 74.46 74.46 101.91 101.91
107.64 107.64 44.6 44.6
5.62 5.62 948.87 948.87 906.78 906.78 (4.44)(4.44)
DiamondDiamond 0.25 0.25 0.19 0.19
0.06 0.06 (75.7)(75.7)
(67.48)(67.48) 20.56 20.56 15.06 15.06 (26.75)(26.75)
Other mineralsOther minerals 3.48 3.48 1.40 1.40
1.17 1.17 (66.5)(66.5)
(16.69)(16.69) 49.62 49.62 18.25 18.25 (63.22)(63.22)
Manufactured goodsManufactured goods 53.01 53.01 32.73 32.73
35.15 35.15 (33.7)(33.7)
7.37 7.37 519.99 519.99 571.76 571.76 9.96 9.96
Fish and Fish ProductsFish and Fish Products 14.06 14.06 29.77 29.77
10.41 10.41 (25.9)(25.9)
(65.02)(65.02) 148.63 148.63 147.77 147.77 (0.58)(0.58)
Horticultural ProductsHorticultural Products 3.06 3.06 10.91 10.91
1.79 1.79 (41.7)(41.7)
(83.63)(83.63) 27.23 27.23 43.29 43.29 58.98 58.98
Re-ExportsRe-Exports 3.50 3.50 5.36 5.36
25.59 25.59 631.1 631.1
377.43 377.43 129.07 129.07 135.25 135.25 4.79 4.79
Other ExportsOther Exports 33.20 33.20 26.35 26.35
60.30 60.30 81.6 81.6
128.84 128.84 259.75 259.75 341.05 341.05 31.30 31.30
Sub Total Sub Total 185.03 185.03 208.61 208.61 242.10 242.10 30.8 30.8 16.05 16.05 2,103.72 2,103.72 2,179.19 2,179.19 3.59 3.59
Grand TotalGrand Total 234.59 234.59 246.06 246.06
287.15 287.15 22.4 22.4
16.70 16.70 2,476.15 2,476.15 2,671.69 2,671.69 7.90 7.90
Tanzania’s Exports by Major Category (mil. USD)Tanzania’s Exports by Major Category (mil. USD)

Share of Goods Export Earnings for the Year Share of Goods Export Earnings for the Year ending September 2009ending September 2009
3232

• Imports– Imports of goods declined by 7.8% during the
period ending September 2009• Decrease in imports of intermediate goods particularly
oil
– Imports volume of oil during the period increased by 31.9 BUT the value of oil imports declined by 24.2%• Decline in oil prices in the world market
– The world market price of oil declined by 45.4% from USD 977.0 million per ton to USD 533.7 million per ton as a result of the global economy recession.
– Service payments rose by 9.1 percent to USD 1,687.3 million
33
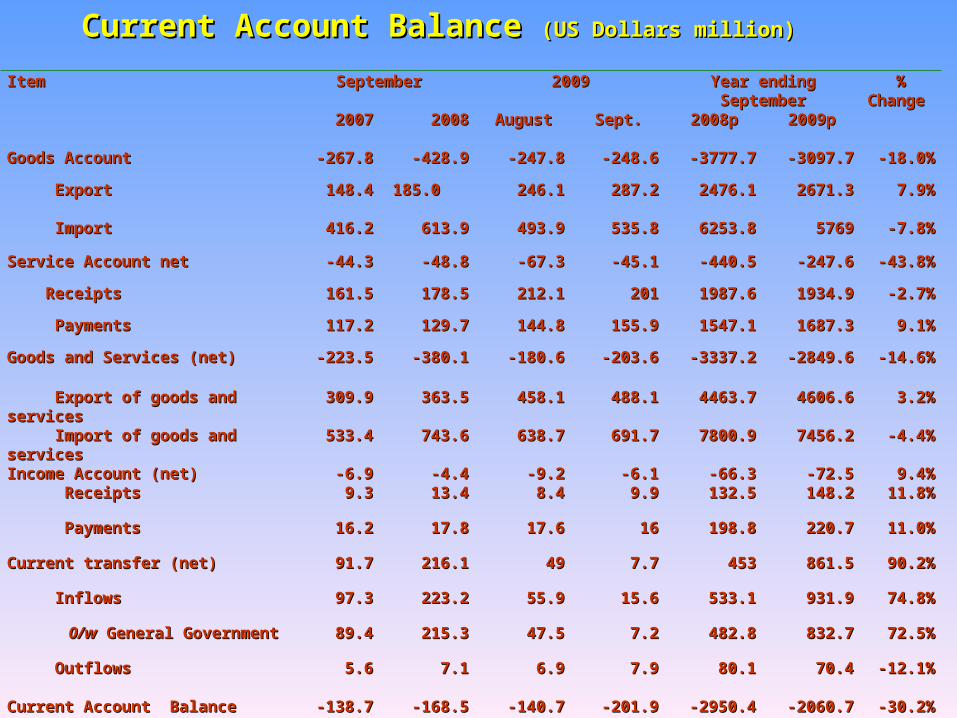
ItemItem September September 20092009 Year ending Year ending SeptemberSeptember
% % Change Change
20072007 20082008 AugustAugust Sept.Sept. 2008p2008p 2009p2009p
Goods AccountGoods Account --267.8267.8 -428.9-428.9 -247.8-247.8 -248.6-248.6 -3777.7-3777.7 -3097.7-3097.7 -18.0%-18.0%
ExportExport 148.4148.4 185.0 185.0 246.1246.1 287.2287.2 2476.12476.1 2671.32671.3 7.9%7.9%
ImportImport 416.2416.2 613.9613.9 493.9493.9 535.8535.8 6253.86253.8 57695769 -7.8%-7.8%
Service Account netService Account net -44.3-44.3 -48.8-48.8 -67.3-67.3 -45.1-45.1 -440.5-440.5 -247.6-247.6 -43.8%-43.8%
ReceiptsReceipts 161.5161.5 178.5178.5 212.1212.1 201201 1987.61987.6 1934.91934.9 -2.7%-2.7%
PaymentsPayments 117.2117.2 129.7129.7 144.8144.8 155.9155.9 1547.11547.1 1687.31687.3 9.1%9.1%
Goods and Services (net)Goods and Services (net) -223.5-223.5 -380.1-380.1 -180.6-180.6 -203.6-203.6 -3337.2-3337.2 -2849.6-2849.6 -14.6%-14.6%
Export of goods and Export of goods and servicesservices
309.9309.9 363.5363.5 458.1458.1 488.1488.1 4463.74463.7 4606.64606.6 3.2%3.2%
Import of goods and Import of goods and servicesservices
533.4533.4 743.6743.6 638.7638.7 691.7691.7 7800.97800.9 7456.27456.2 -4.4%-4.4%
Income Account (net)Income Account (net) -6.9-6.9 -4.4-4.4 -9.2-9.2 -6.1-6.1 -66.3-66.3 -72.5-72.5 9.4%9.4% Receipts Receipts 9.39.3 13.413.4 8.48.4 9.99.9 132.5132.5 148.2148.2 11.8%11.8%
PaymentsPayments 16.216.2 17.817.8 17.617.6 1616 198.8198.8 220.7220.7 11.0%11.0%
Current transfer (net)Current transfer (net) 91.791.7 216.1216.1 4949 7.77.7 453453 861.5861.5 90.2%90.2%
InflowsInflows 97.397.3 223.2223.2 55.955.9 15.615.6 533.1533.1 931.9931.9 74.8%74.8%
0/w0/w General General Government Government
89.489.4 215.3215.3 47.547.5 7.27.2 482.8482.8 832.7832.7 72.5%72.5%
OutflowsOutflows 5.65.6 7.17.1 6.96.9 7.97.9 80.180.1 70.470.4 -12.1%-12.1%
Current Account Balance Current Account Balance -138.7-138.7 -168.5-168.5 -140.7-140.7 -201.9-201.9 -2950.4-2950.4 -2060.7-2060.7 -30.2%-30.2%
Current Account Balance Current Account Balance (US Dollars million)(US Dollars million)

Shares of Imports for the Year Ending September Shares of Imports for the Year Ending September 20092009
3535
Balance of Payments• The overall balance of payment recorded a surplus
of USD 620.4 million up from a deficit of USD 115.1.million recorded in the preceding year.– Mainly attributed to the reduction in the current account
deficit as a result of an increase in exports of goods and services coupled with a decline in the imports bill.
• Gross reserve position stood at USD 3,560.3 million as at end September 2009 – This level of reserve was enough to cover about 5.7
months of imports of goods and services
36
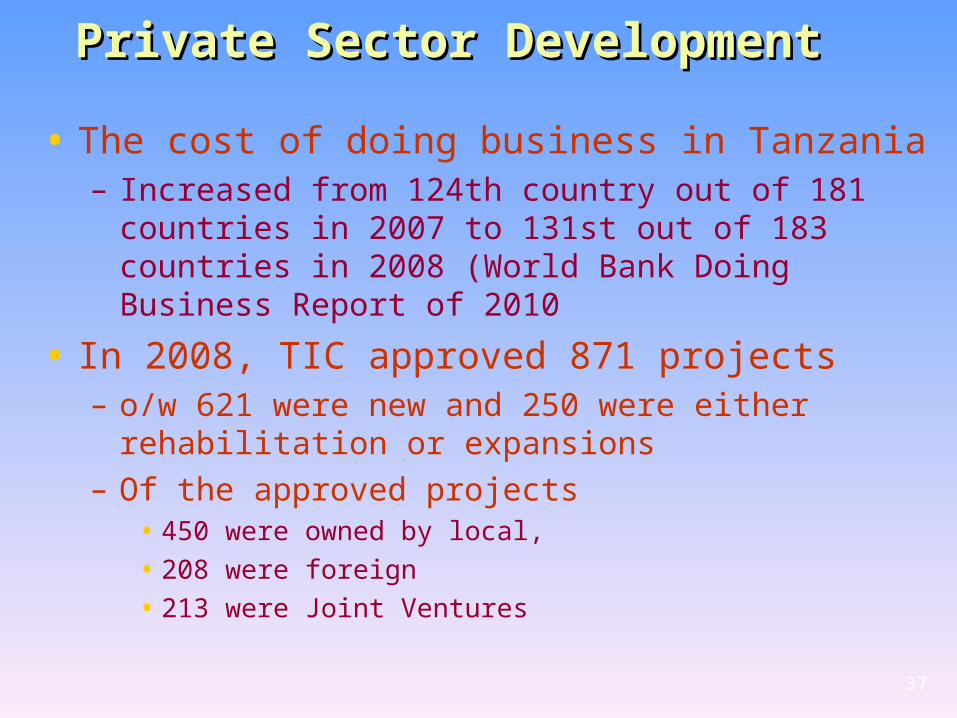
Private Sector DevelopmentPrivate Sector Development
• The cost of doing business in Tanzania– Increased from 124th country out of 181
countries in 2007 to 131st out of 183 countries in 2008 (World Bank Doing Business Report of 2010
• In 2008, TIC approved 871 projects– o/w 621 were new and 250 were either
rehabilitation or expansions– Of the approved projects
• 450 were owned by local,
• 208 were foreign
• 213 were Joint Ventures
37