outline
DESCRIPTION
Smart Antenna and MC-SCDMA Next Generation Technologies for Wireless Broadband Guanghan Xu, CTO Navini Networks. Outline. Comparative Analysis of CDMA, OFDM, and MC-SCDMA Comparative Analysis of Smart Antennas vs Conventional Antennas Comparative Analysis of TDD vs. FDD - PowerPoint PPT PresentationTRANSCRIPT

April 19, 2023 April, 12 2001 1
C802.20-03/29
Smart Antenna and MC-SCDMA Next Generation Technologies for Wireless Broadband
Guanghan Xu, CTONavini Networks

C802.20-03/29
Outline
• Comparative Analysis of CDMA, OFDM, and MC-SCDMA
• Comparative Analysis of Smart Antennas vs Conventional Antennas
• Comparative Analysis of TDD vs. FDD
• Optimal Integration of Technologies to Create a Broadband Solution
• Field Trial Results of the Integrated Technologies

C802.20-03/29
Wireless Broadband Challenges
f
t
Time Domain
0.1 1 2 3 5 10 20 km
City
Suburban
Rural
Path Loss (Link Budget)14.4Kbps to 1Mbps = 69 times or 18dB more power
Free space
Frequency Domain
Multipath Fading Intercell Interference
F1 F1 F1
F1
F1
F1 F1
F1
F1
Mixture of Broadband& Narrowband (voice)

C802.20-03/29
OFDM Multiple Access
Transmitted OFDM Spectrum
Signal Threshold
Received OFDM Spectrum
• OFDM offers very good immunity to multipath issues.• FFT is very efficient in channelization NlogN instead of O(N2).• OFDM needs much higher fade margin requiring higher signal levels and complex coding. • OFDM has high peak to average ratio that impacts link budget due to large PA backoff.• OFDMA is difficult to reliably transmitting narrowband data or voice due to the spectrum nulls. Frequency hopping does smooth out the probability of hitting the nulls.• OFDM is susceptive to intercell interference in the N=1 deployment while all the neighboring cells are fully loaded.
f
f

C802.20-03/29
Conventional CDMA
Code 1 Code 2 Code 3 Code 4
+
++
• CDMA (1XEVDO, EVDV & WCDMA) all have asynchronous CDMA uplink.• Due to high spreading gain, CDMA (1X and WCDMA) signals are more resistant to intercell interference which enables N=1 deployment.• Since each code has sufficient bandwidth, signal fading is marginal. • Due to high intercode or intracell interference, the link budget is adversely impacted leading to the cell breathing effect.• The high intracell interference also considerably reduces the capacity or throughput of the system.
fFrequency Domain
Signal
Interference
Frequency Domainf
Transmitted CDMASpectrum
Received CDMASpectrum

C802.20-03/29
Synchronous CDMA (SCDMA)
+
++
Code 1 Code 2 Code 3 Code 4
Symbol Period
• Synchronous CDMA (SCDMA) can maintain code orthogonality and its multipath interference or intercode interference is minimized.• Due to the spreading gain, the SCDMA signals are also more resistant to intercell interference which enables N=1 deployment.• Since each code has sufficient bandwidth, signal fading is marginal.

C802.20-03/29
Multipath Effect to SCDMA
Multipath Channel of User 1
+
Multipath Channel of User 2
User 1 Signal
Self Interference
++
+
++
+
Other User Interference
Code 1 Code 2
User 2 Signal
Code 3 Code 4
+
+
Symbol Period

C802.20-03/29
Joint Detection for SCDMA
• Joint detection is the solution to effectively handle the multipath in multi-user CDMA systems.
• Joint detection is computationally expensive and its complexity is O(N2L), where N is the spreading factor and L is the channel length.
• Increasing N leads to more resistence to signal fading and the ability to assign lower data rates to handle the mixture of narrowband and broad applications
• Increase N does increase the complexity of joint detection quadratically.
• Wide bandwidth (1.2288Mcps for IS-95 or 1X, 3.84Mbps for WCDMA) also leads to small chip periods or relatively increases L which will increase the complexity and degrade the performance.

C802.20-03/29
Optimal Tradeoff: MC-SCDMA
ff
f
f
f f
WCDMABest on signal fading
Worst on multipath interferenceGood on intercell interference
OFDMBest on multipath interferenceBad on intercell interference
Worst on signal fading
MC-SCDMAOptimal tradeoff among multipath interference, intercell interference,
and signal fading
C802.20-03/29
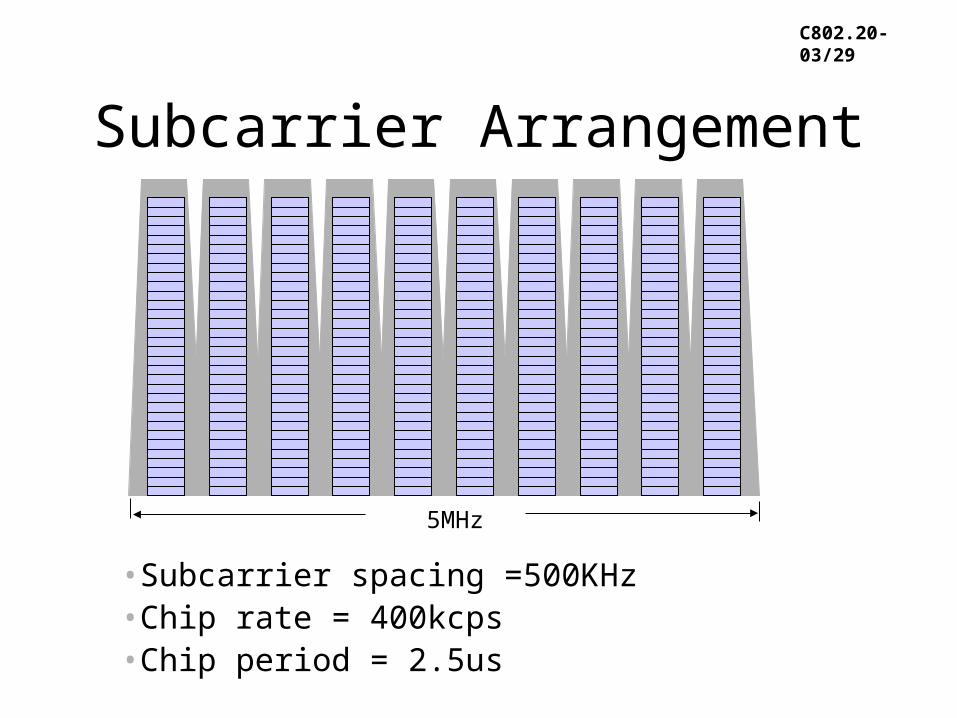
Subcarrier Arrangement
•Subcarrier spacing =500KHz•Chip rate = 400kcps•Chip period = 2.5us
5MHz
C802.20-03/29
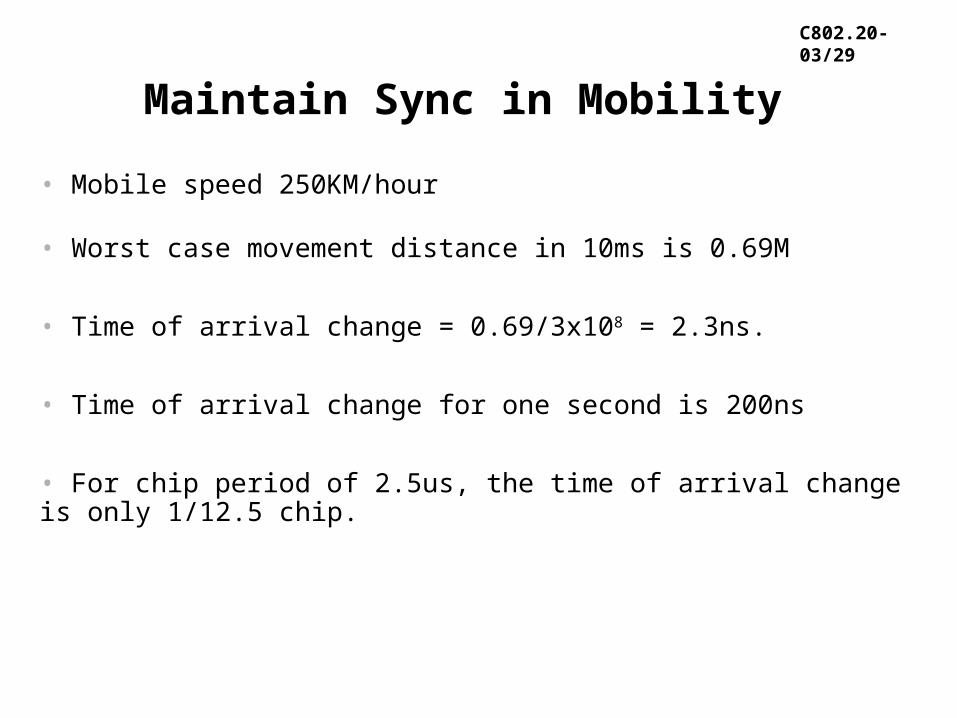
Maintain Sync in Mobility
• Mobile speed 250KM/hour
• Worst case movement distance in 10ms is 0.69M
• Time of arrival change = 0.69/3x108 = 2.3ns.
• Time of arrival change for one second is 200ns
• For chip period of 2.5us, the time of arrival change is only 1/12.5 chip.

C802.20-03/29
Competitive Analysis SUI Propagation Model (IEEE802.16)
SUI Channel model index Tap 1 Tap 2 Tap3
1 0 s, 0 dB 0.4 s, -15 dB 0.8 s, -20 dB
2 0 s, 0 dB 0.5 s, -12 dB 1 s, -15 dB
3 0 s, 0 dB 0.5 s, -5 dB 1 s, -10 dB
4 0 s, 0 dB 2 s, -4 dB 4 s, -8 dB
5 0 s, 0 dB 5 s, -5 dB 10 s, -10 dB
6 0 s, 0 dB 14 s, -10 dB 20 s, -14 dB
C802.20-03/29
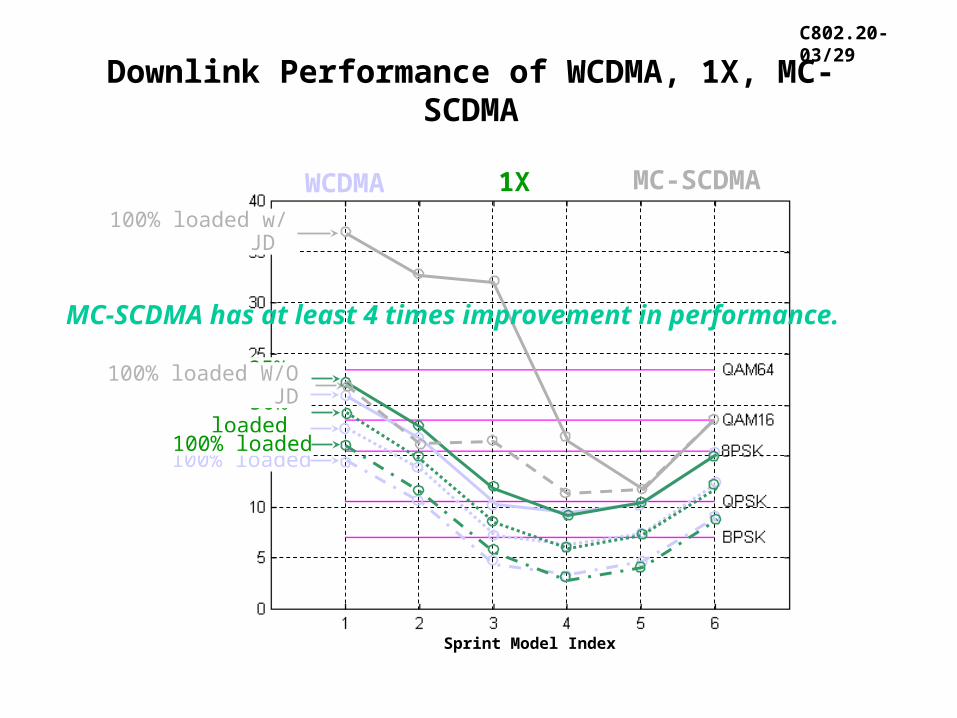
Downlink Performance of WCDMA, 1X, MC-SCDMA
WCDMA
25% loaded50% loaded
100% loaded
25% loaded50% loaded
100% loaded
100% loaded W/O JD
100% loaded w/ JD
1X MC-SCDMA
Sprint Model Index
MC-SCDMA has at least 4 times improvement in performance.
C802.20-03/29
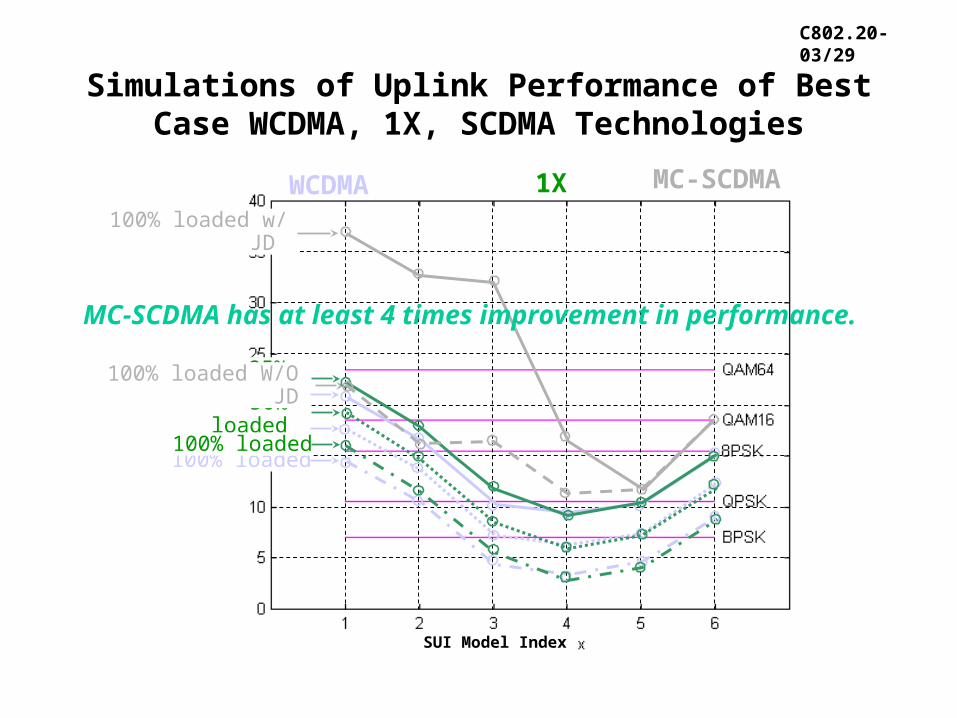
Simulations of Uplink Performance of Best Case WCDMA, 1X, SCDMA Technologies
WCDMA
25% loaded50% loaded
100% loaded
25% loaded50% loaded
100% loaded
100% loaded W/O JD
100% loaded w/ JD
1X MC-SCDMA
SUI Model Index
MC-SCDMA has at least 4 times improvement in performance.

C802.20-03/29
Fade Margins of OFDM vs MC-SCDMA
95% reliability
99% reliability
Reliability OFDM
SCDMA SCDMA Joint Detection
95% 13dB 7dB 8dB
99% 20dB 9dB 11dB
The fade margin for OFDM with 99% reliability is about 10dB more than MC-SCDMA.
32 tones or 32 codes in 500KHz bandwidthfor SUI model 4

C802.20-03/29
Comparison among WCDMA/1X, OFDM, & MC-SCDMA
• With respect to intercell interference, MC-SCDMA has similar performance as WCDMA/1X and outperforms OFDM significantly due to spreading gain.
• With respect to intercode interference, MC-SCDMA with low complexity joint detection has similar performance as OFDM and outperforms WCDMA/1X significantly in the presence of multipath.
• With respect to signal fading, MC-SCDMA with low complexity joint detection has similar performance as WCDMA/1X and outperforms OFDM significantly in the presence of multipath.
• With respect to mixture of narrowband and broadband, the MC-SCDMA performs similarly as WCDMA and has the similar low complexity as OFDM (leveraging FFT).

C802.20-03/29
Adaptive Antenna Array
Legacy Legacy RF SystemRF System
Power Distribution
Power Amplifier ModulePower Level
128W
Signal Interference from other users
Low CapacityLow Capacity
High Complexity
ConventionalConventional
PatentedPatentedSmart AntennaSmart Antenna
SoftwareSoftware
Power Distribution
Power AmplifierPower Level
2 W
High CapacityHigh Capacity
Signal Interference from other users
Low Complexity
SmartSmartAntennaAntenna

C802.20-03/29
Link Budget Advantages
Adaptive Phased Array2 Watts + 18 dB Gain
Conventional2 Watts + 0 dB Gain
Same scale, same terrain, same clutter, same location

C802.20-03/29
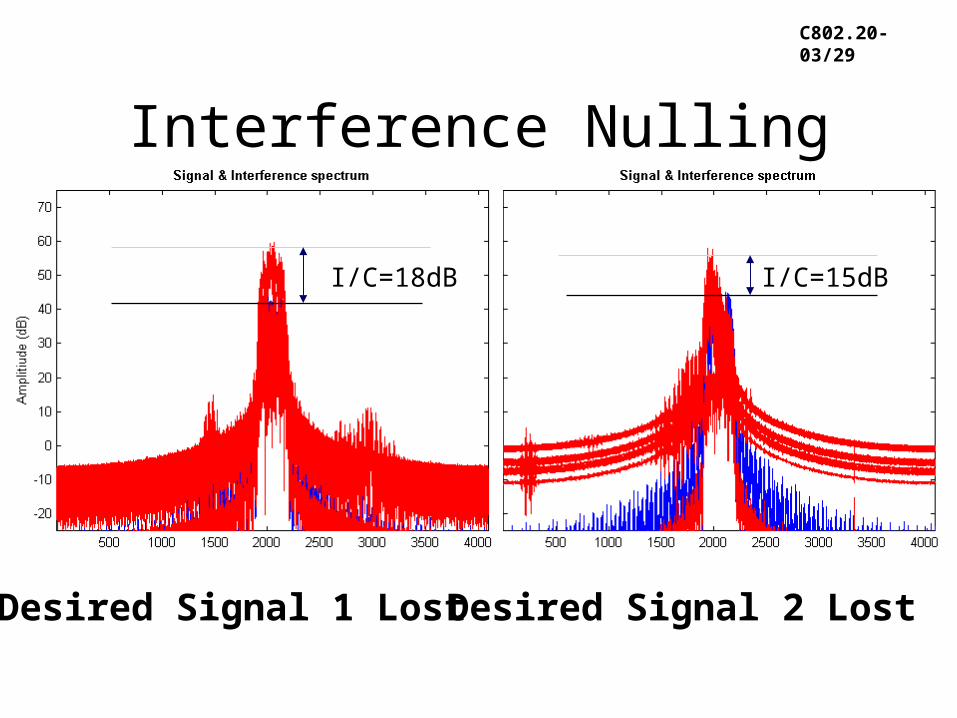
Interference Nulling
Desired Signal 1 Desired Signal 2
C802.20-03/29
Interference Nulling
Desired Signal 1 Lost Desired Signal 2 Lost
I/C=18dB I/C=15dB

C802.20-03/29
Interference Nulling
Simple CDMA with a Single Antenna

C802.20-03/29
Interference Nulling
Simple Beamforming

C802.20-03/29
Interference Nulling
Interference Nulling

C802.20-03/29
Interference Nulling Example
Actual Signal Measured at 2.4GHzSignal Without Interference
BTS Receive Period
BTS Transmit Period

C802.20-03/29
Interference Nulling for N=1 Deployment
Simulation Assumptions:
• 3 sectors linear array with 8 elements
• Each sector has 10 simultaneous users each has the same data rate

C802.20-03/29
FDD vs TDD
Frequency division duplex (FDD) requires at least 30-40 MHz guard band between up and down streams to make the duplexer feasible.
>30MHzUnusableSpectrum
Up/down stream
Down/up stream
Duplexer filteringProfiles

C802.20-03/29
FDD vs TDD
Summary of FDD Advantages:
1. Guard time of TDD fundamentally limits the communication distance while FDD does not have such a restriction.
2. TDD may not be backward compatible to existing FDD wireless communication systems such as cellular phones.
3. FDD has 3dB more link budget than TDD in uplink link budget for symmetric separation.
Summary of TDD Advantages:
1. Flexibility of selecting a carrier for providing services.
2. Flexibility of providing dynamic asymmetric services for both uplink and downlink.
3. Exploitation of full benefits of smart antenna technologies leading to high capacity, high performance, and low cost.

C802.20-03/29
Optimal Integration of Smart Antennas, MC-SCDMA, and TDD
• Smart Antennas with TDD• Smart uplink and smart downlink (same carrier frequencies)
• Smart Antennas with MC-SCDMA• Simple smart antenna algorithms and robust performance• Low complexity joint detection algorithms
• TDD and MC-SCDMA• Simple open-loop power control scheme for mobile
communications
• Smart Antennas + TDD + MC-SCDMA• Require simple signaling protocol• Multiple antennas lead to high redundancy• Can localize the terminal and predict handoff
C802.20-03/29
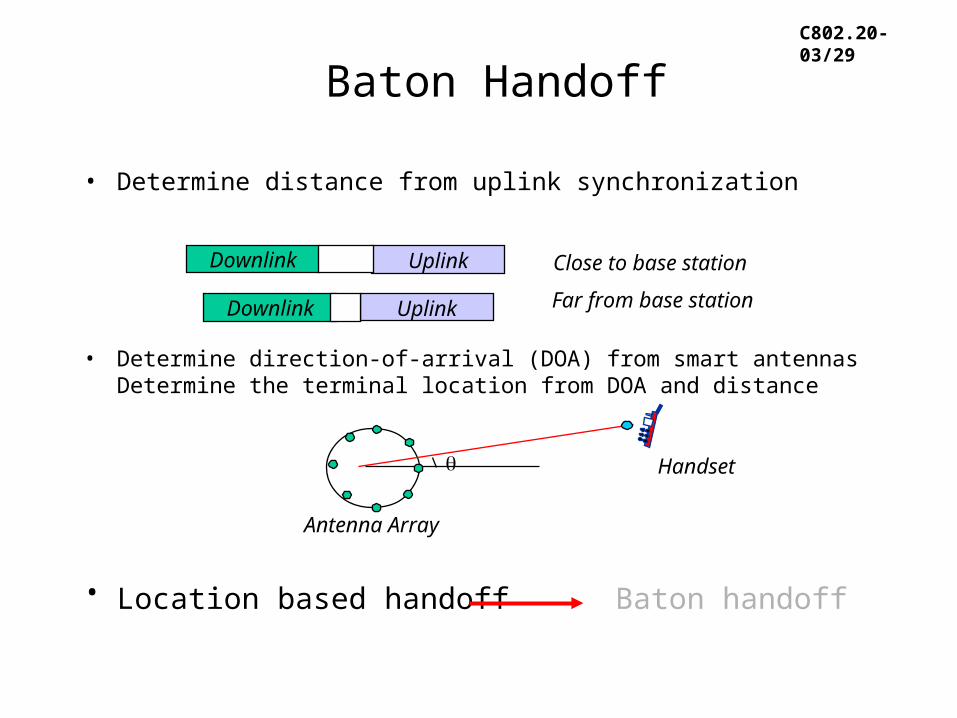
Baton Handoff
• Determine distance from uplink synchronization
• Determine direction-of-arrival (DOA) from smart antennas Determine the terminal location from DOA and distance
• Location based handoff Baton handoff
Antenna Array
Handset
Downlink Uplink
Downlink Uplink
Close to base station
Far from base station

C802.20-03/29
Base Station• Antenna installation on 30m PCS tower
• Outdoor cabinet

C802.20-03/29
Frequency Planning
F2
F2
F2
E2E2
E3
Frequency Reuse
E2: 2608-2614MHzF2: 2614-2620MHzE3: 2620-2626MHz

C802.20-03/29
Outdoor Tests
Omni antenna used for drive test, CPE located inside car
C802.20-03/29
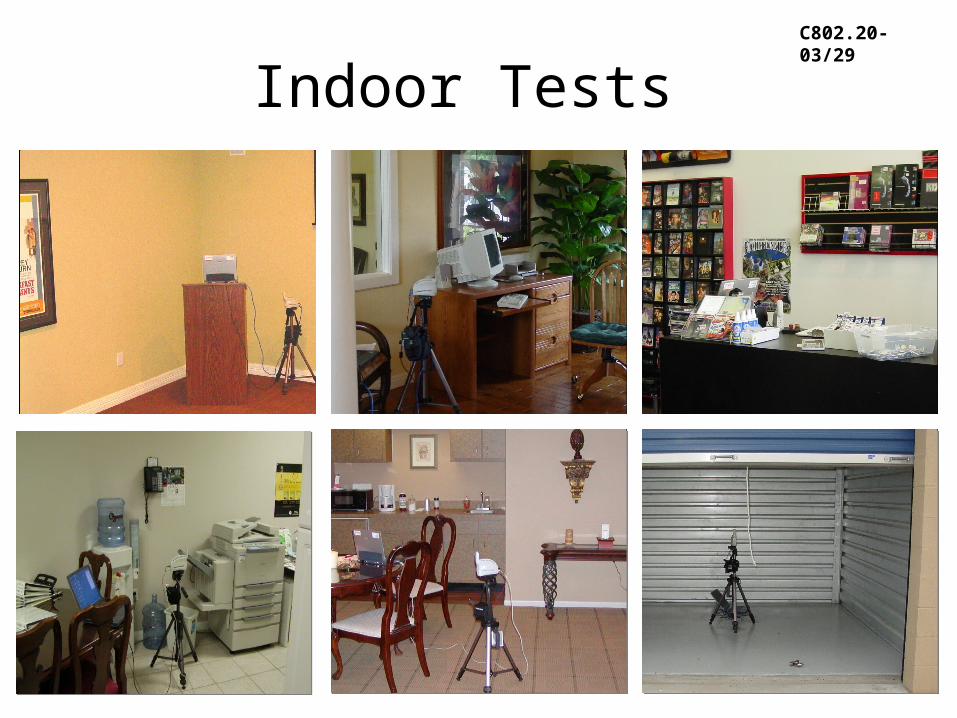
Indoor Tests

C802.20-03/29
Test Items in the Trials– Technology
1) Beamforming Gain Stability (Up and Down Link)2) C/I Comparative Performance (Up and Down Link)3) Effectiveness of Interference Rejection Technology
– Product and Network Deployment1) Data Rates vs Distance2) Coverage Prediction Accuracy3) Service Level Agreement Stability Across System Load Levels4) System Stability with Large Number of Simultaneous Users 5) System Stability with under High User Contention Load6) CPE Portability (Roaming) Between Cells7) System Recovery Speeds8) Cell Coverage Stability Across System Loads9) Quality of Service/Grade of Service10) Indoor Penetration Loss

C802.20-03/29
Beam Pattern
• Many beam patterns suggests high levels of multipath during data rate tests• This multipath is exploited by adaptive antennas. • This multipath would severely degrade conventional systems.
C802.20-03/29
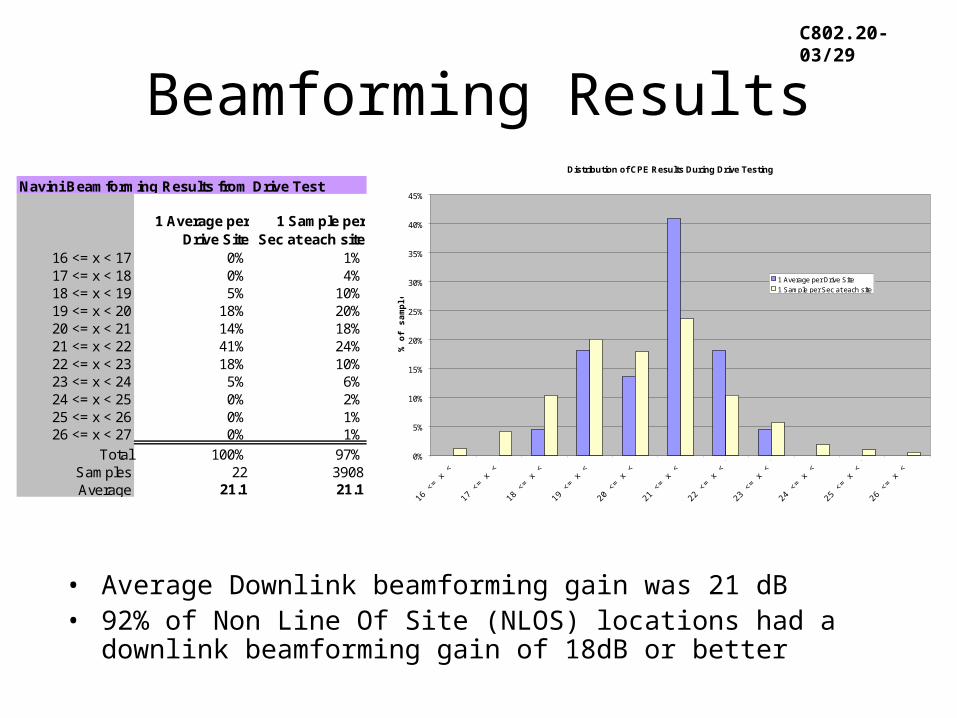
Beamforming Results
• Average Downlink beamforming gain was 21 dB• 92% of Non Line Of Site (NLOS) locations had a downlink beamforming
gain of 18dB or better
Distribution of CPE Results During Drive Testing
0%
5%
10%
15%
20%
25%
30%
35%
40%
45%
16 <
= x <
17
17 <
= x <
18
18 <
= x <
19
19 <
= x <
20
20 <
= x <
21
21 <
= x <
22
22 <
= x <
23
23 <
= x <
24
24 <
= x <
25
25 <
= x <
26
26 <
= x <
27
% o
f s
am
ple
s
1 Average per Drive Site
1 Sample per Sec at each site
Navini Beamforming Results from Drive Test
1 Average per Drive Site
1 Sample per Sec at each site
16 <= x < 17 0% 1%17 <= x < 18 0% 4%18 <= x < 19 5% 10%19 <= x < 20 18% 20%20 <= x < 21 14% 18%21 <= x < 22 41% 24%22 <= x < 23 18% 10%23 <= x < 24 5% 6%24 <= x < 25 0% 2%25 <= x < 26 0% 1%26 <= x < 27 0% 1%
Total 100% 97%Samples 22 3908Average 21.1 21.1
C802.20-03/29
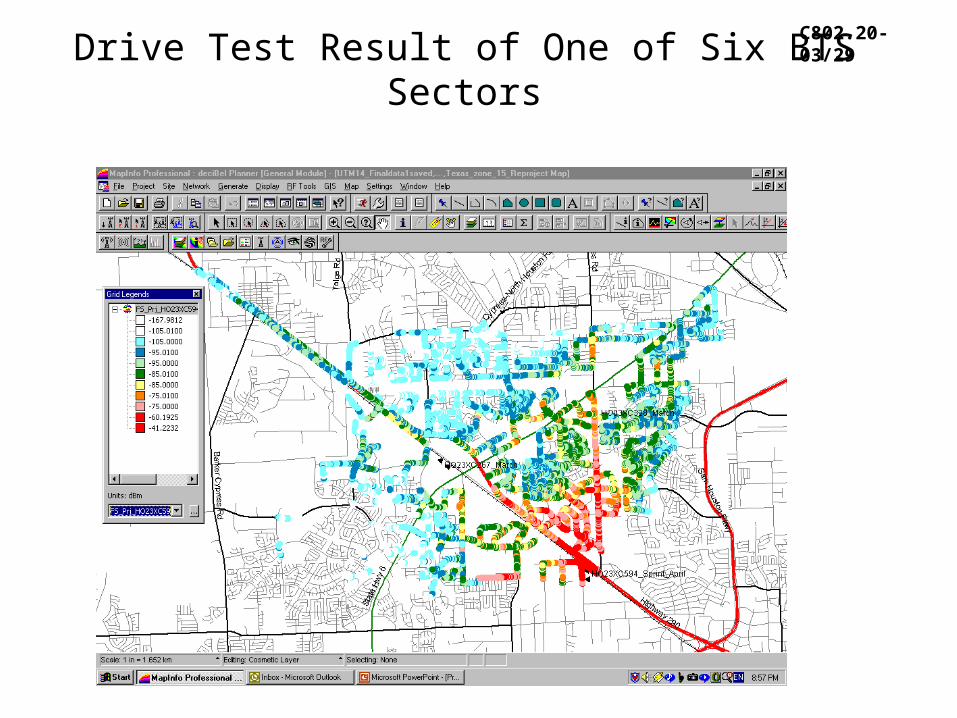
Drive Test Result of One of Six BTS Sectors
C802.20-03/29
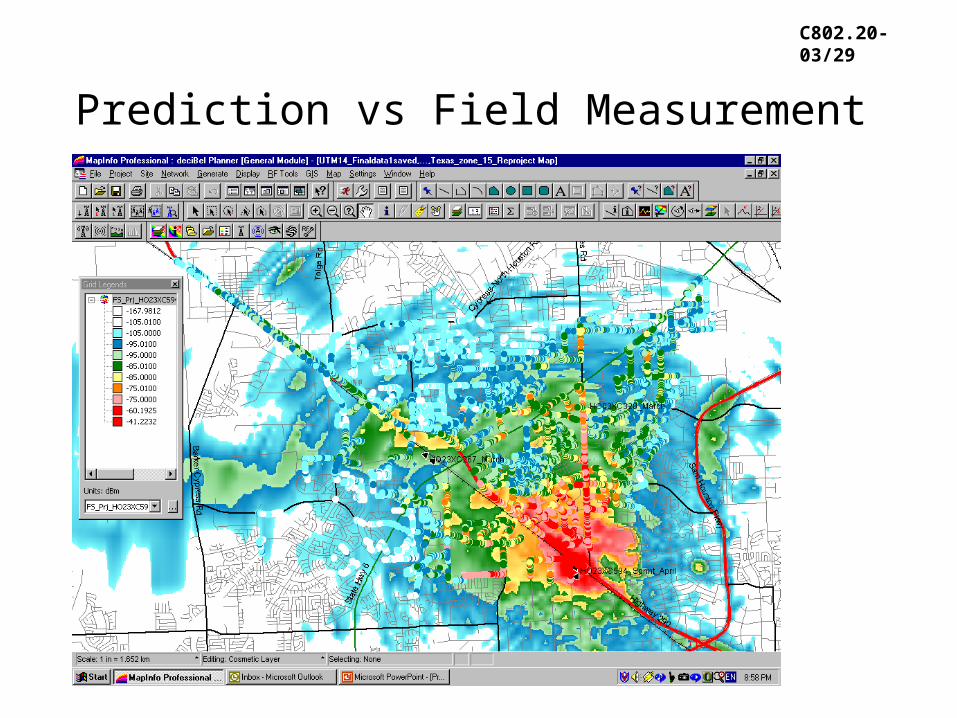
Prediction vs Field Measurement

C802.20-03/29
FTP Raw Downlink Data Rates
FTP Downlink Data Rates (Raw bit throughput in upto 2 MHz @ 50% Duty Cyle)
(Site with SLA Coverage, Single BTS)
0
500
1000
1500
2000
2500
3000
3500
4000
- 1.0 2.0 3.0 4.0 5.0 6.0
Distance (km)
kb
/s (
Raw
Data
Rate
) 1A
2A
3A
4A
5A
6A
Avg Front of Home
Avg Inside Good
Avg Inside Worst