our clear commitment topics whip around the world customer needs & trends the changing financial...
TRANSCRIPT

Our Clear Commitment
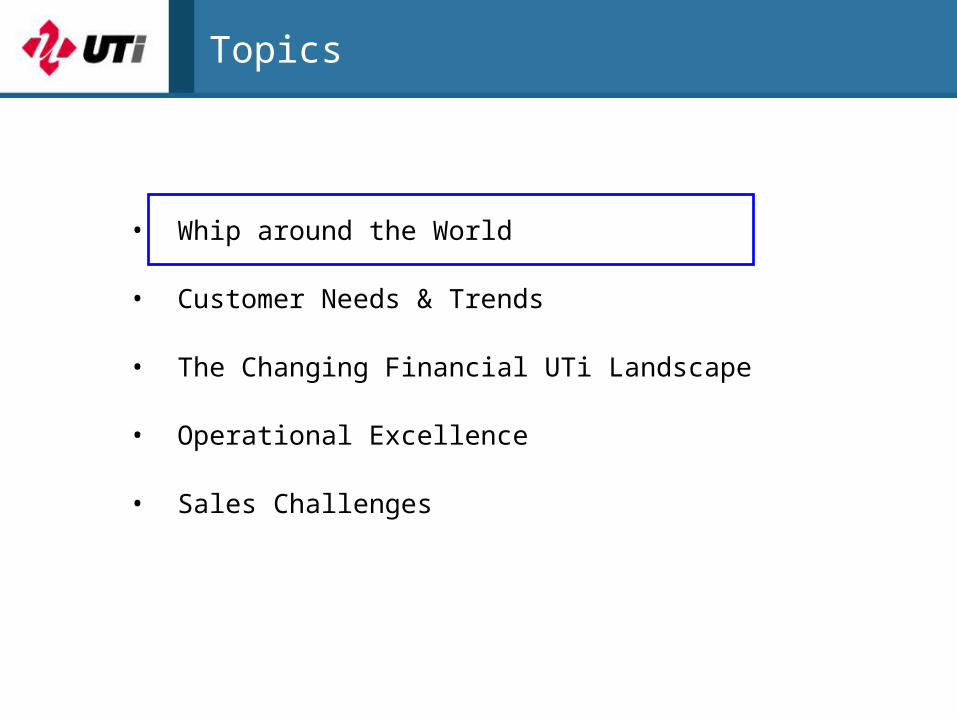
Topics
• Whip around the World
• Customer Needs & Trends
• The Changing Financial UTi Landscape
• Operational Excellence
• Sales Challenges
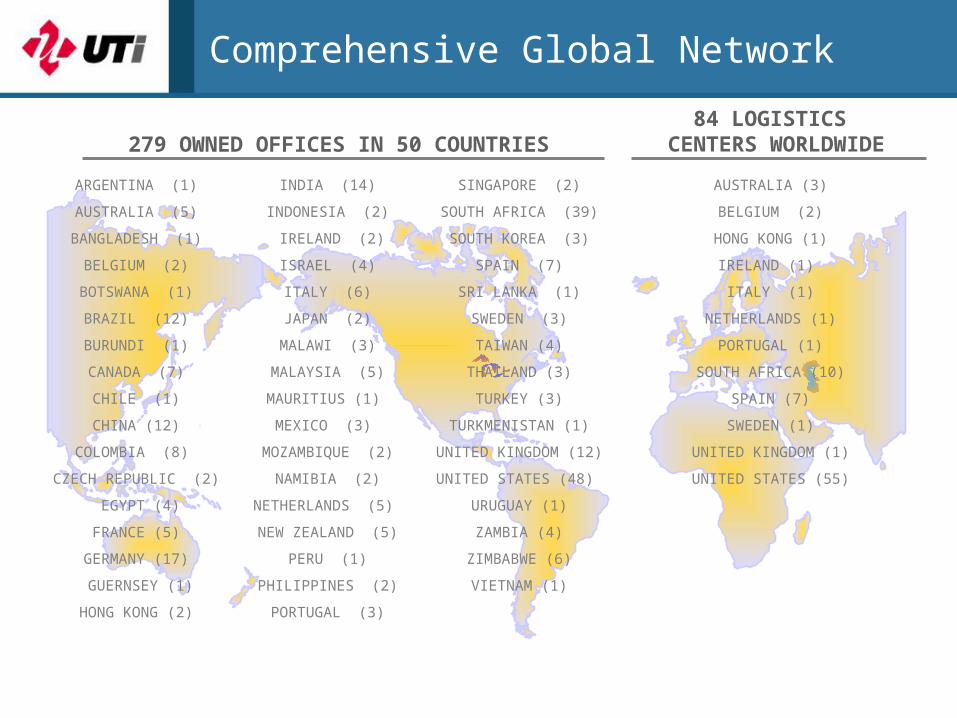
279 OWNED OFFICES IN 50 COUNTRIES84 LOGISTICS
CENTERS WORLDWIDE
Comprehensive Global Network
... AND 158 EXCLUSIVE AGENT OFFICES IN AN ADDITIONAL 83 COUNTRIES
ARGENTINA (1) INDIA (14) SINGAPORE (2) AUSTRALIA (3)
AUSTRALIA (5) INDONESIA (2) SOUTH AFRICA (39) BELGIUM (2)
BANGLADESH (1) IRELAND (2) SOUTH KOREA (3) HONG KONG (1)
BELGIUM (2) ISRAEL (4) SPAIN (7) IRELAND (1)
BOTSWANA (1) ITALY (6) SRI LANKA (1) ITALY (1)
BRAZIL (12) JAPAN (2) SWEDEN (3) NETHERLANDS (1)
BURUNDI (1) MALAWI (3) TAIWAN (4) PORTUGAL (1)
CANADA (7) MALAYSIA (5) THAILAND (3) SOUTH AFRICA (10)
CHILE (1) MAURITIUS (1) TURKEY (3) SPAIN (7)
CHINA (12) MEXICO (3) TURKMENISTAN (1) SWEDEN (1)
COLOMBIA (8) MOZAMBIQUE (2) UNITED KINGDOM (12) UNITED KINGDOM (1)
CZECH REPUBLIC (2) NAMIBIA (2) UNITED STATES (48) UNITED STATES (55)
EGYPT (4) NETHERLANDS (5) URUGUAY (1)
FRANCE (5) NEW ZEALAND (5) ZAMBIA (4)
GERMANY (17) PERU (1) ZIMBABWE (6)
GUERNSEY (1) PHILIPPINES (2) VIETNAM (1)
HONG KONG (2) PORTUGAL (3)
OPO
LISNAP
BLQ
MXP/MLI
ROM
LEHCDG
PSA
TRN
LYS
MRS
BOD
MLH
TLS
ZRH
LODZ
GVA
WAW
GDY
KRK
VIE
INNGRZ
LNZ
KLU
SZG
PRG
BUD
EINRTM
ANR/DeurneBRU
AMS
STO
MMA
HELOSL
VNO
LAHTI
SNN
TMP
RIX
ORK
GOT
DUB
MAD BCN
CDZ
LCGSCQ
BFS
ABZ
QLX
BUH
BHX FXT
LHR
GLA
MAN
MGR
AVE
CND
SOF
ATH
SKG
LUX
KOPERLJU
REK
IEV
TLL
DUS
BER
CGN
NCEGrasse
DTM
FRA
HAM
HAJ
QHH
KSF
FMO
MUC
NUESTR
MHX
QVS
BRE
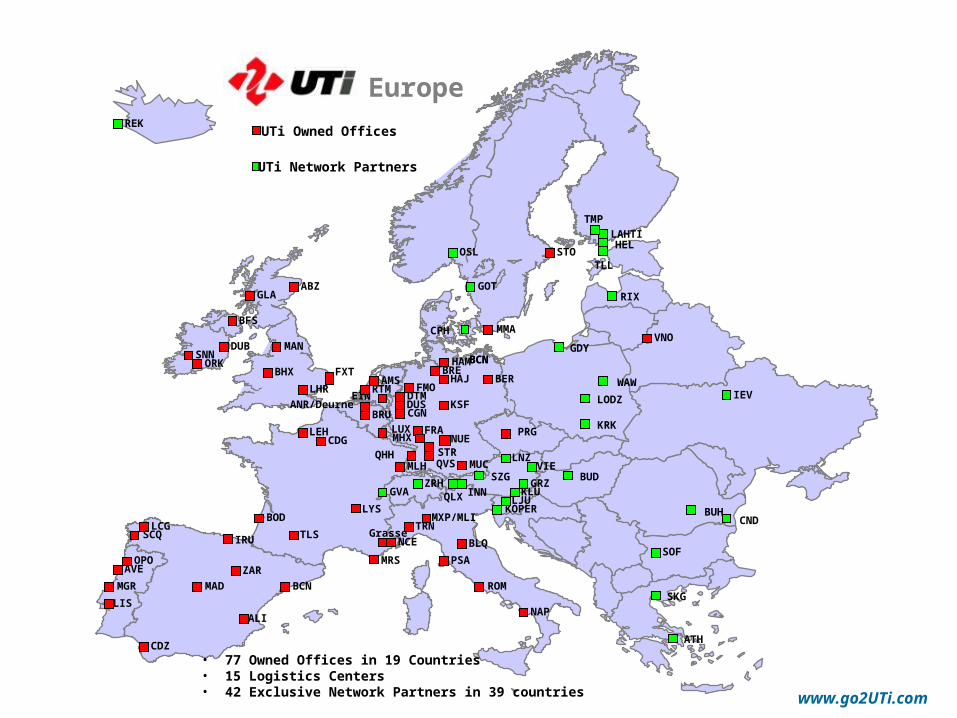
Europe
www.go2UTi.com
BCNBCN
IRU
ALI
ZAR
• 77 Owned Offices in 19 Countries• 15 Logistics Centers• 42 Exclusive Network Partners in 39 countries
UTi Owned Offices
UTi Network Partners
CPH
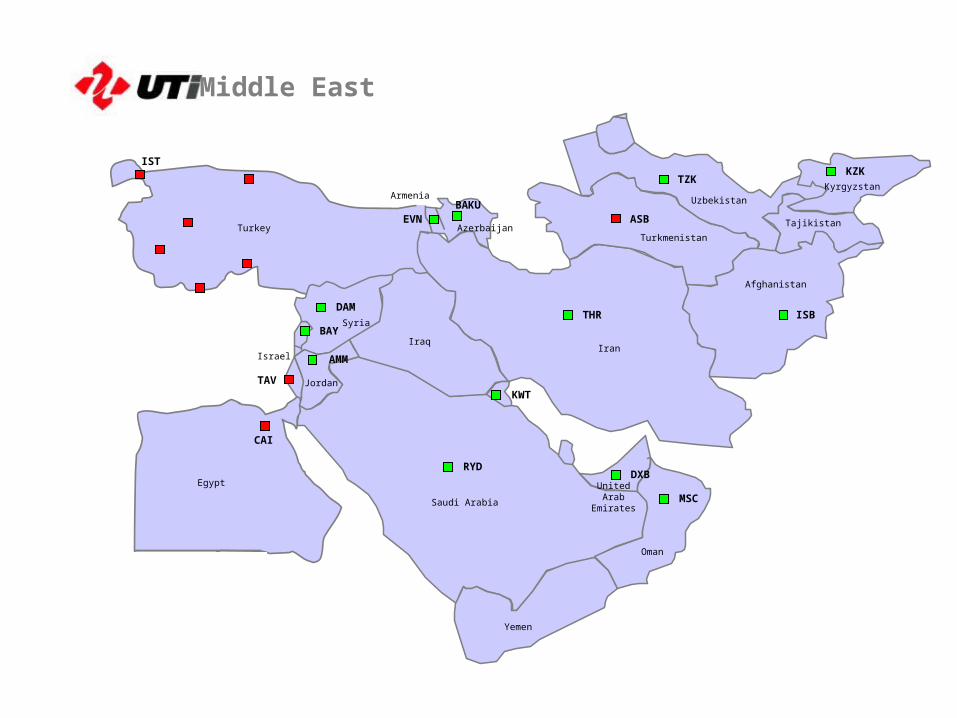
Middle East
CAI
IST
RYD
TAVKWT
DAM
DXB
MSC
AMM
ASB
THR ISB
TZKKZK
BAY
EVNTurkey
Egypt
Jordan
Saudi Arabia
Iraq
Syria
IsraelIran
Yemen
Oman
UnitedArab
Emirates
Armenia
AzerbaijanTurkmenistan
BAKU
Afghanistan
Uzbekistan
Kyrgyzstan
Tajikistan
SEA
ORF
MCO
MIA
TPA
ATL
SAV
STL
SLC
LAX
SFO
MKE
PHLCLE
ILM
CHS
CLTRDU
GSO
CVG
LRD
DFW
HOU
MEM
DTT
ORD
MSPJFK
EWR
GSP
BOS
BWI
DEN
JEC
IAD
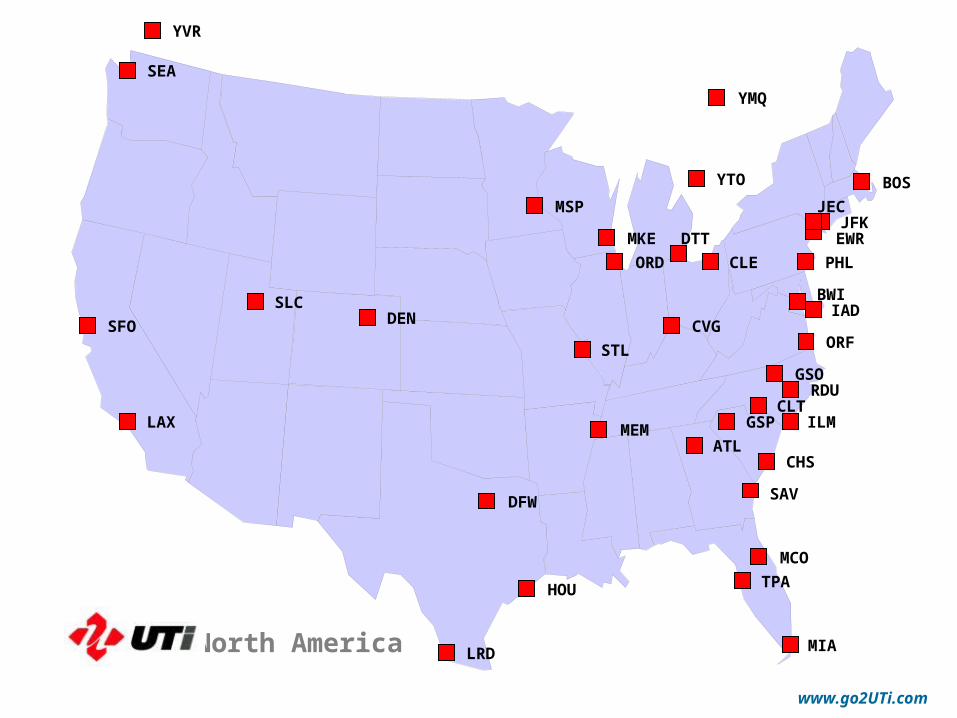
North America
www.go2UTi.com
YMQ
YTO
YVR
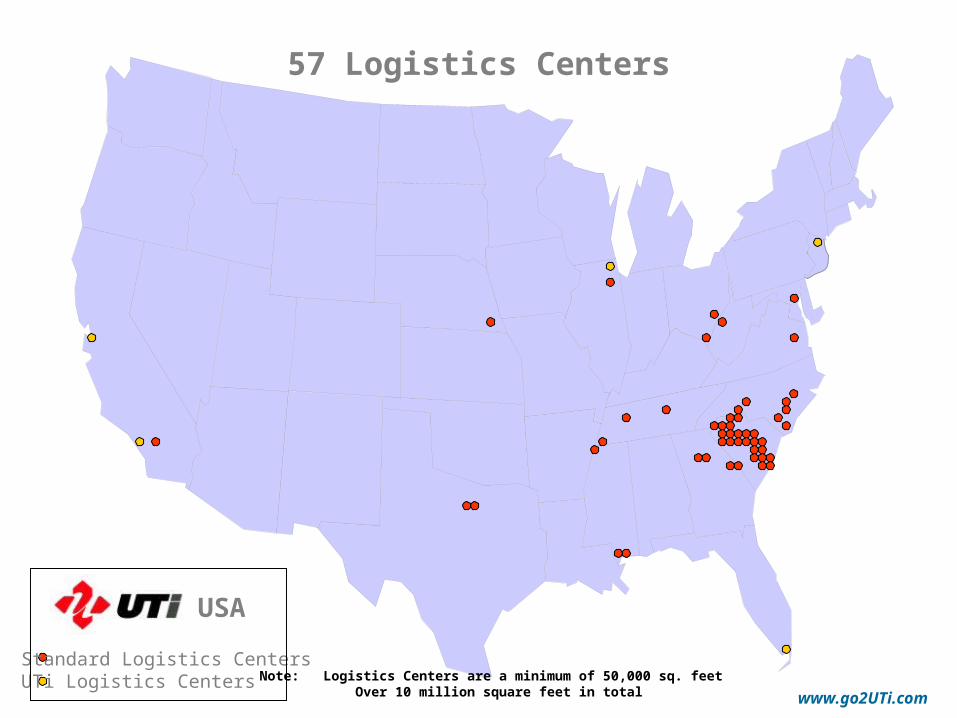
57 Logistics Centers
USA
Standard Logistics CentersUTi Logistics Centers
www.go2UTi.com
Note: Logistics Centers are a minimum of 50,000 sq. feet Over 10 million square feet in total
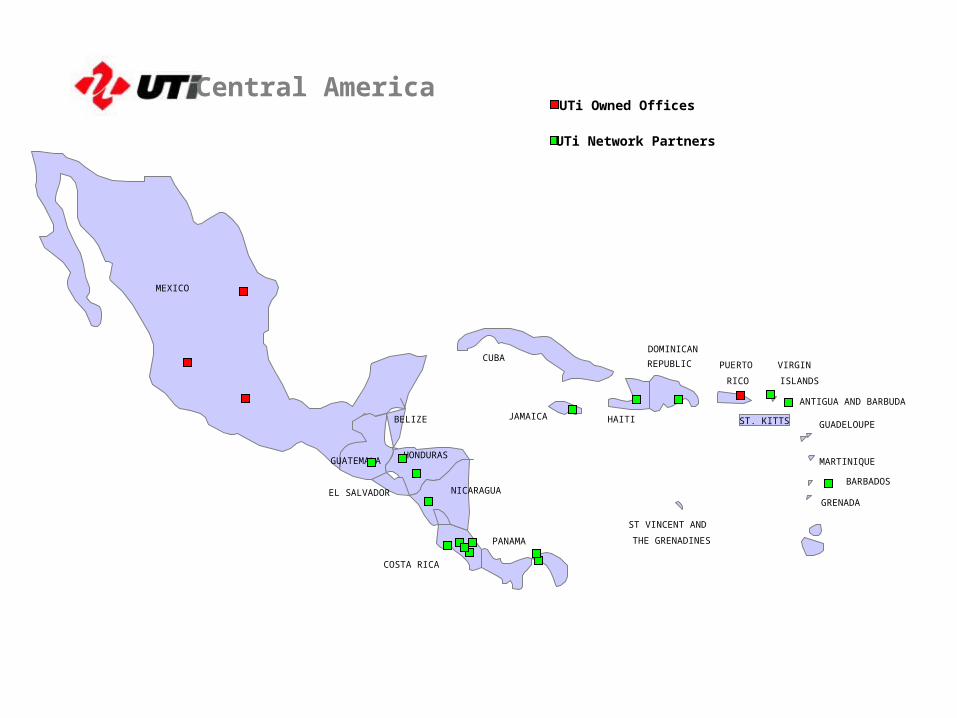
Central America
MEXICO
GUATEMALA
BELIZE
HONDURAS
NICARAGUA
COSTA RICA
PANAMA
CUBADOMINICAN
REPUBLIC
JAMAICA HAITI
EL SALVADOR
PUERTO
RICO
VIRGIN
ISLANDS
ST. KITTS
ANTIGUA AND BARBUDA
GUADELOUPE
MARTINIQUE
ST VINCENT AND
THE GRENADINES
GRENADA
BARBADOS
UTi Owned Offices
UTi Network Partners
BRAZIL
COLOMBIA
VENEZUELAGUYANA
SURINAME
ECUADOR
PERU
BOLIVIA
PARAGUAY
CHILE
ARGENTINAURUGUAY
FRENCH GUIANA
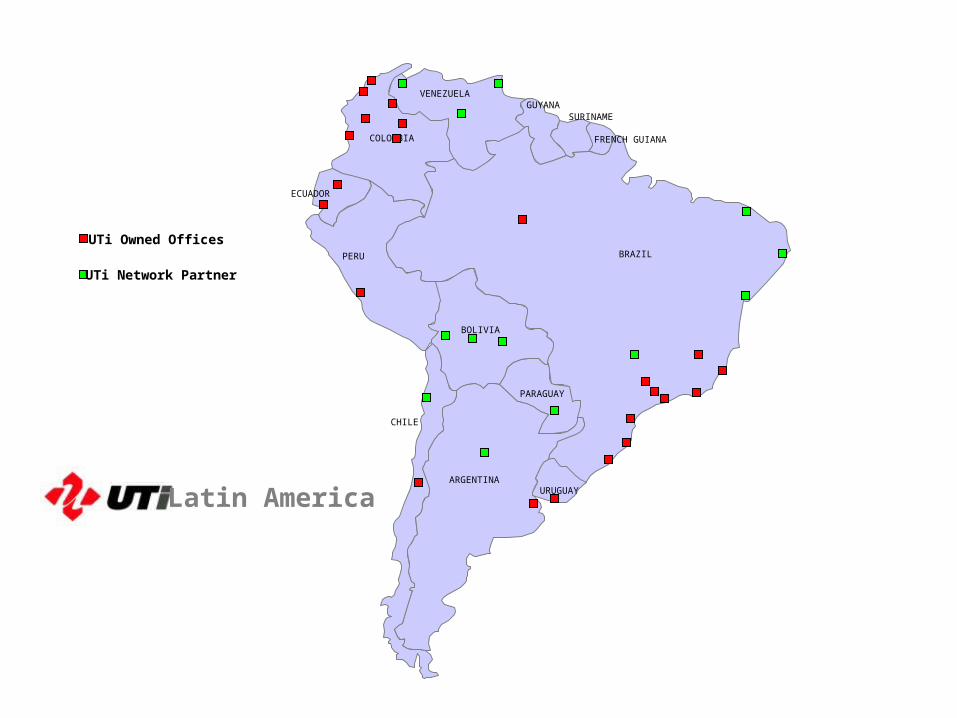
Latin America
UTi Owned Offices
UTi Network Partner
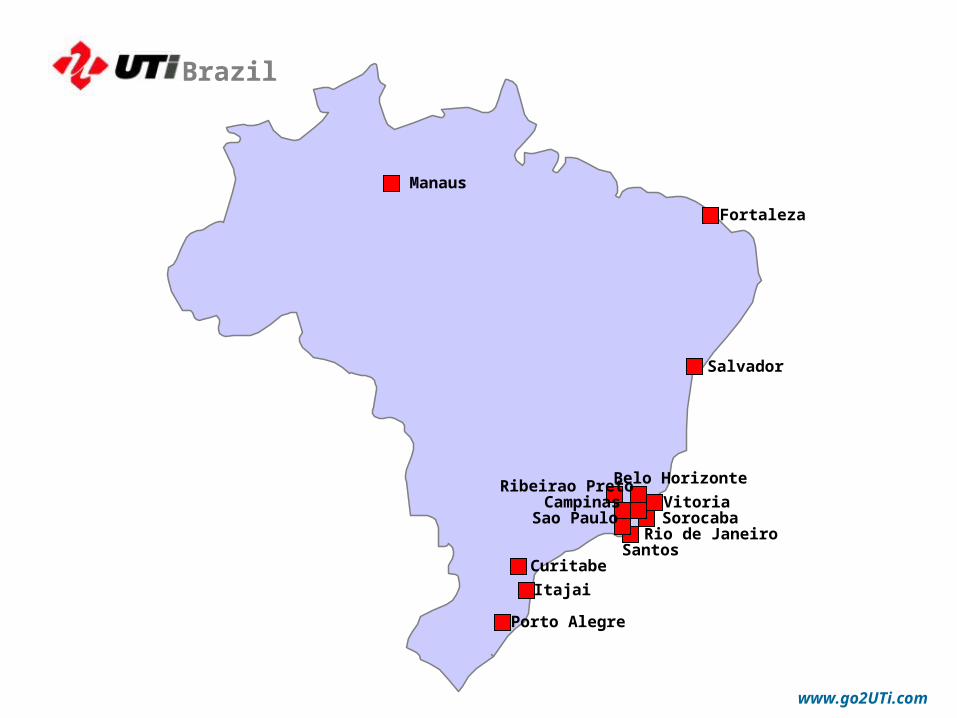
Brazil
Belo Horizonte
Curitabe
Fortaleza
Itajai
Manaus
Porto Alegre
Rio de Janeiro
Salvador
Santos
Sao Paulo Vitoria Sorocaba
CampinasRibeirao Preto
www.go2UTi.com
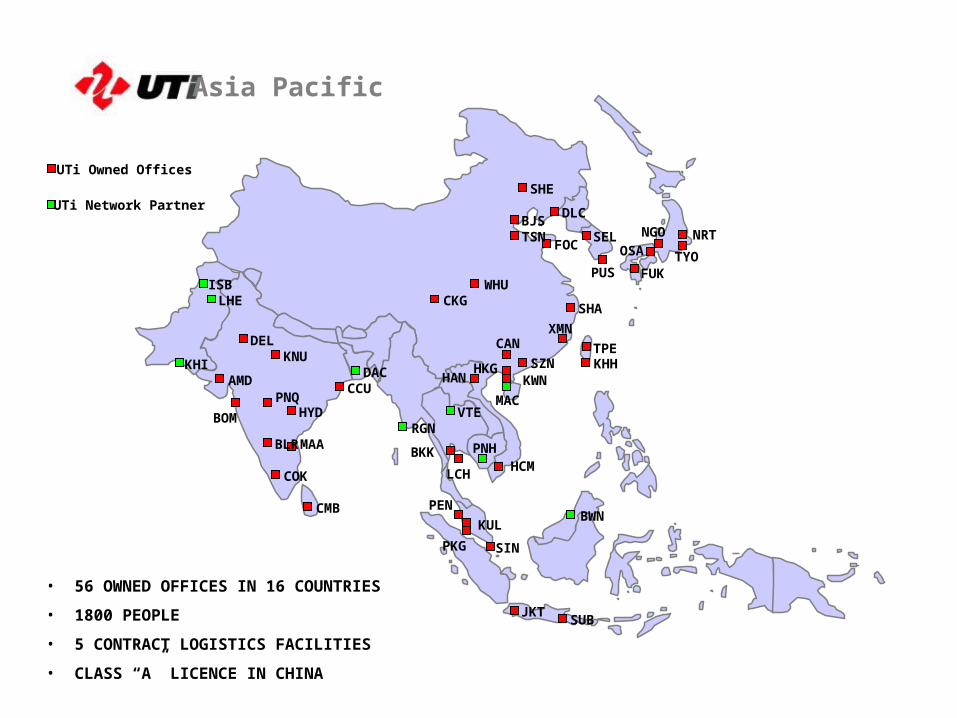
Asia Pacific
• 56 OWNED OFFICES IN 16 COUNTRIES
• 1800 PEOPLE
• 5 CONTRACT LOGISTICS FACILITIES
• CLASS “A” LICENCE IN CHINA
UTi Owned Offices
UTi Network Partner
PEN
PKG
HKG
SHE
DLC
FOC
BJSTSN
SHA
WHUCKG
XMNCAN
SZNKWN
KUL
NRT
KNUDEL
AMD
BOM
PNQHYD
BLR
COK
MAA
CCU
OSA
NGO
TYOFUK
KHI
ISB
RGN
MACVTE
HAN
HCMLCH
BKK
TPE
SIN
DAC
CMBBWN
PNH
LHE
SEL
PUS
SUBJKT
KHH
www.go2UTi.com
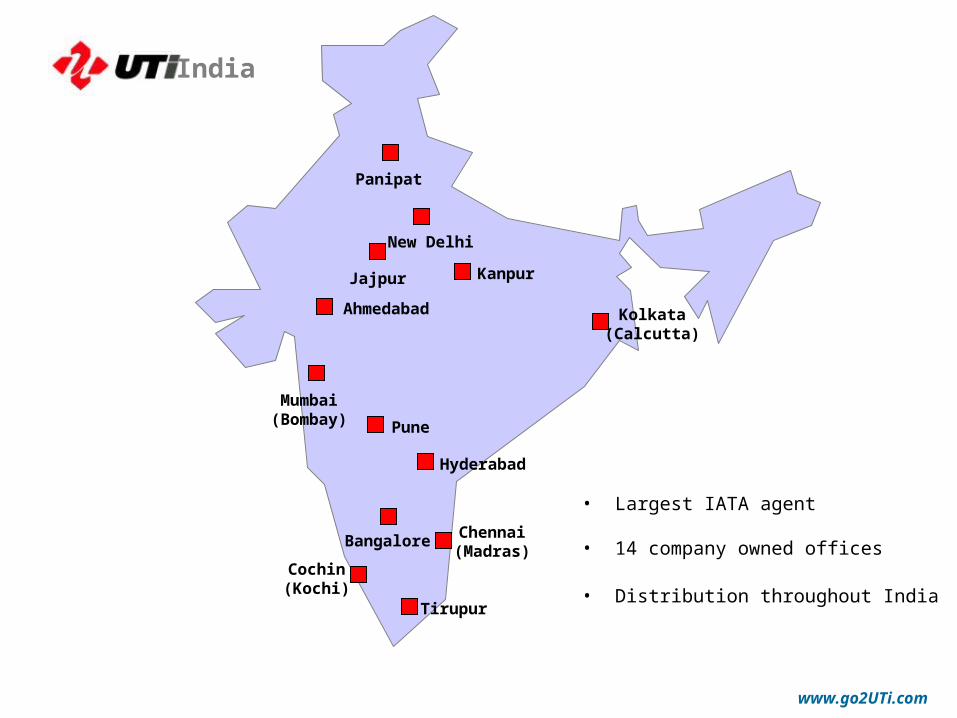
India
Ahmedabad
Bangalore Chennai(Madras)
Kolkata(Calcutta)
Panipat
Cochin(Kochi)
Hyderabad
Kanpur
Mumbai(Bombay)
New Delhi
Tirupur
Pune
Jajpur
• Largest IATA agent
• 14 company owned offices
• Distribution throughout India
www.go2UTi.com
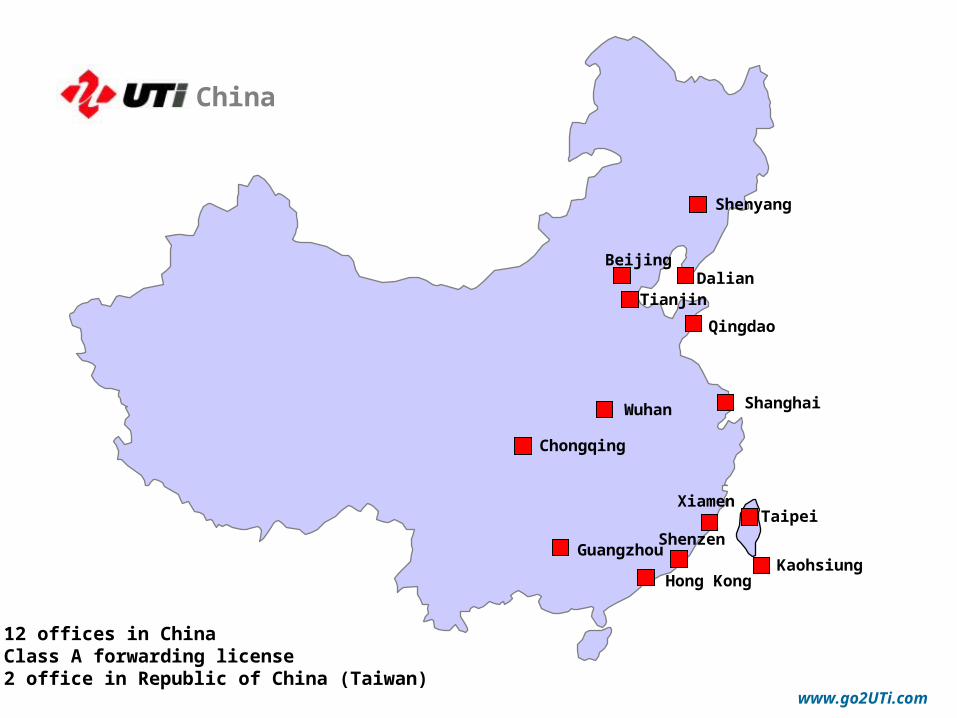
Beijing
Guangzhou
Tianjin
Shanghai
Hong Kong
Qingdao
Wuhan
Dalian
XiamenTaipei
China
Kaohsiung
Shenyang
Chongqing
Shenzen
12 offices in ChinaClass A forwarding license2 office in Republic of China (Taiwan)
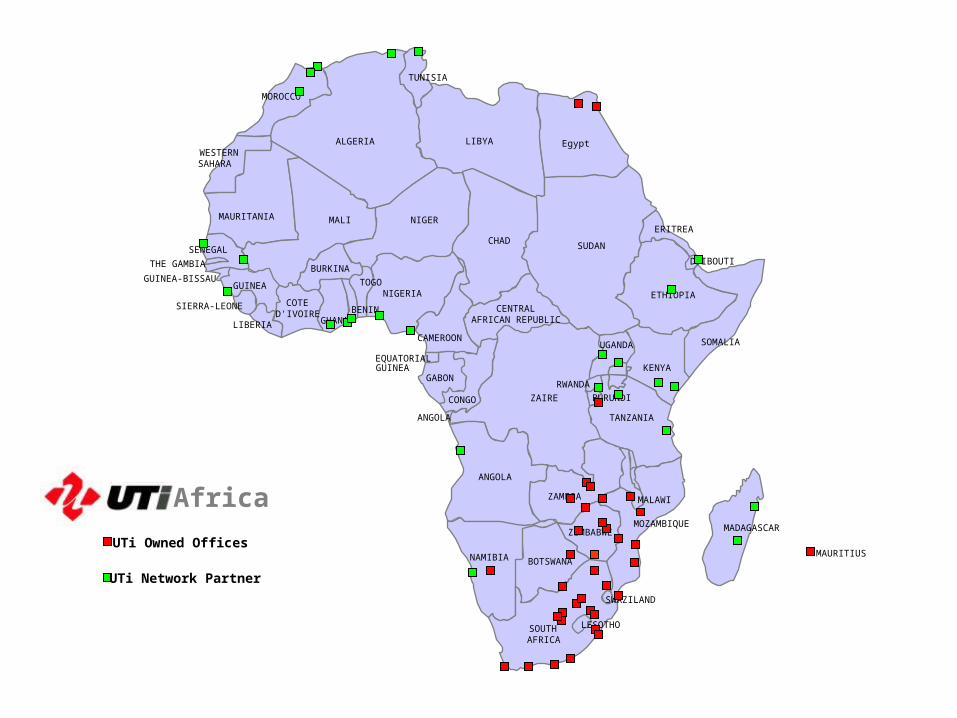
EgyptLIBYAALGERIA
MOROCCO
NIGERMAURITANIA
WESTERNSAHARA
MALI
CHADSUDAN
ZAIRE
ANGOLA
NAMIBIA
SOUTHAFRICA
BOTSWANA
ETHIOPIA
SOMALIA
NIGERIAGUINEA
TUNISIA
ERITREA
CENTRALAFRICAN REPUBLIC
MADAGASCAR
TANZANIA
GABON
BURKINA
GHANA
COTED'IVOIRE
ZAMBIA
ZIMBABWE
CAMEROON
TOGO
BENIN
UGANDA
KENYA
MOZAMBIQUE
LESOTHO
SWAZILAND
CONGO
SENEGAL
THE GAMBIA
GUINEA-BISSAU
SIERRA-LEONE
LIBERIA
EQUATORIAL GUINEA
ANGOLA
RWANDA
BURUNDI
MALAWI
DJIBOUTI
Egypt
Africa
UTi Owned Offices
UTi Network Partner
MAURITIUS
Topics
• Whip around the World
• Customer Needs & Trends
• The Changing Financial UTi Landscape
• Operational Excellence
• Sales Challenges
17
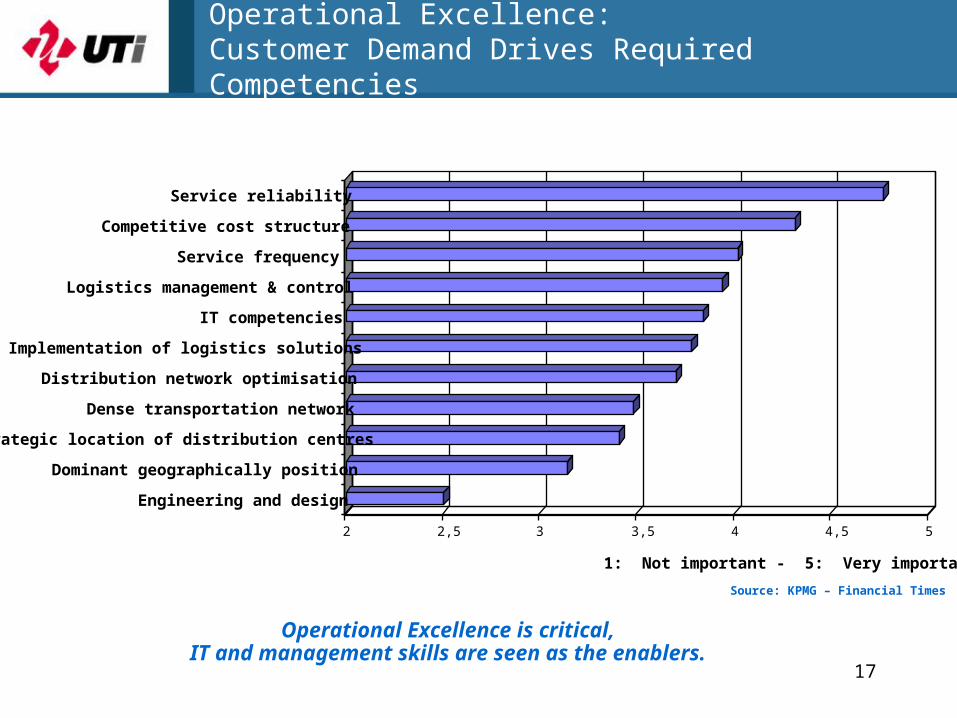
1: Not important - 5: Very important
2 2,5 3 3,5 4 4,5 5
Engineering and design
Dominant geographically position
Strategic location of distribution centres
Dense transportation network
Distribution network optimisation
Implementation of logistics solutions
IT competencies
Logistics management & control
Service frequency
Competitive cost structure
Service reliability
Operational Excellence is critical,IT and management skills are seen as the enablers.
Source: KPMG – Financial Times
Operational Excellence: Customer Demand Drives Required Competencies
18
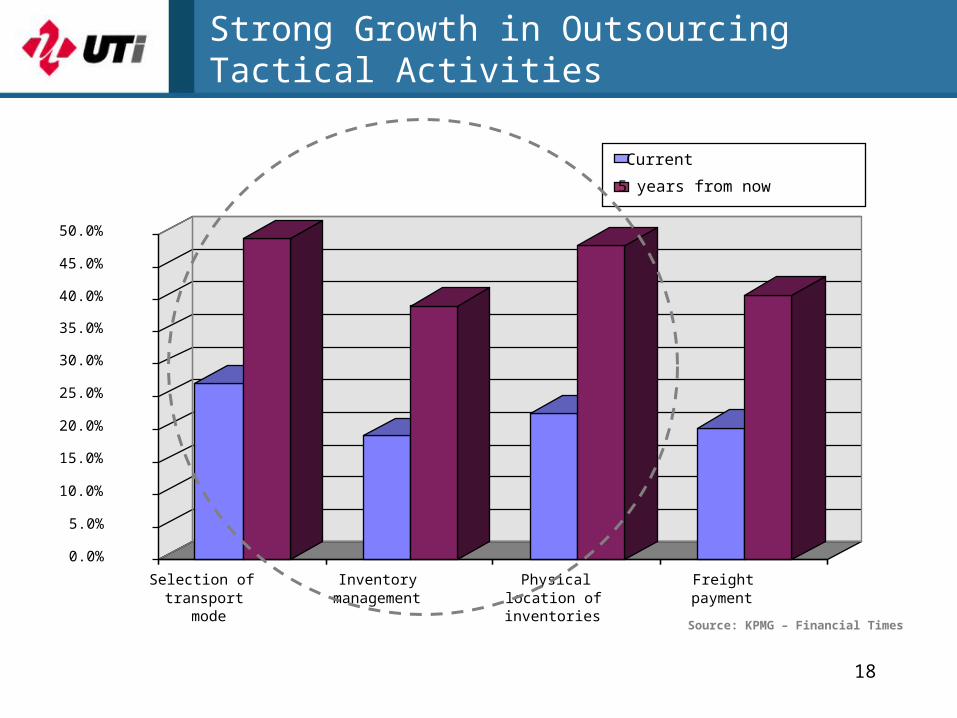
Current
5 years from now
0.0%
5.0%
10.0%
15.0%
20.0%
25.0%
30.0%
35.0%
40.0%
45.0%
50.0%
transportSelection of
mode
Inventorymanagement
Physicallocation ofinventories
Freightpayment
Source: KPMG – Financial Times
Strong Growth in Outsourcing Tactical Activities
Topics
• Whip around the World
• Customer Needs & Trends
• The Changing Financial UTi Landscape
• Operational Excellence
• Sales Challenges
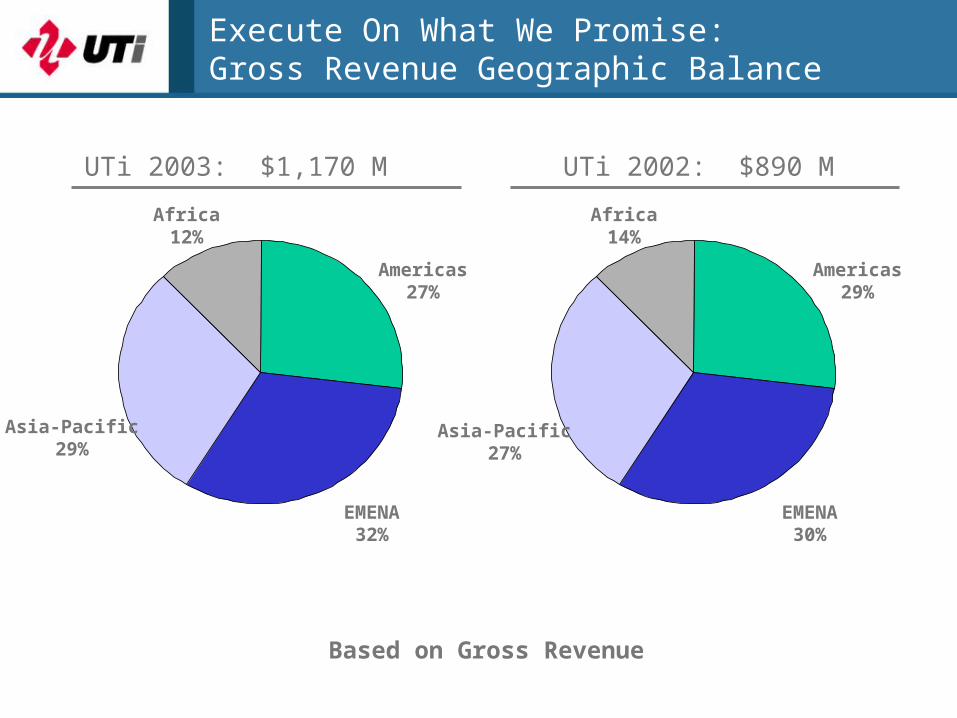
Execute On What We Promise:Gross Revenue Geographic Balance
UTi 2003: $1,170 M UTi 2002: $890 M
EMENA32%
EMENA30%
Americas27%
Americas29%
Africa12%
Asia-Pacific29%
Asia-Pacific27%
Africa14%
Based on Gross Revenue
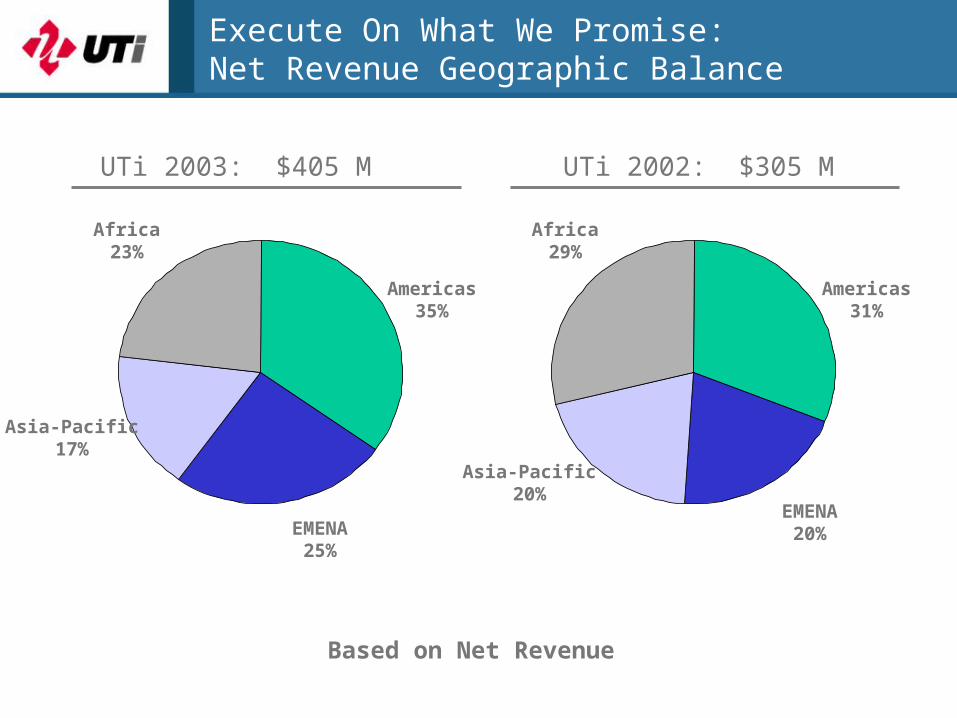
Execute On What We Promise:Net Revenue Geographic Balance
UTi 2003: $405 M UTi 2002: $305 M
EMENA25%
EMENA20%
Americas35%
Americas31%
Africa23%
Asia-Pacific17%
Asia-Pacific20%
Africa29%
Based on Net Revenue
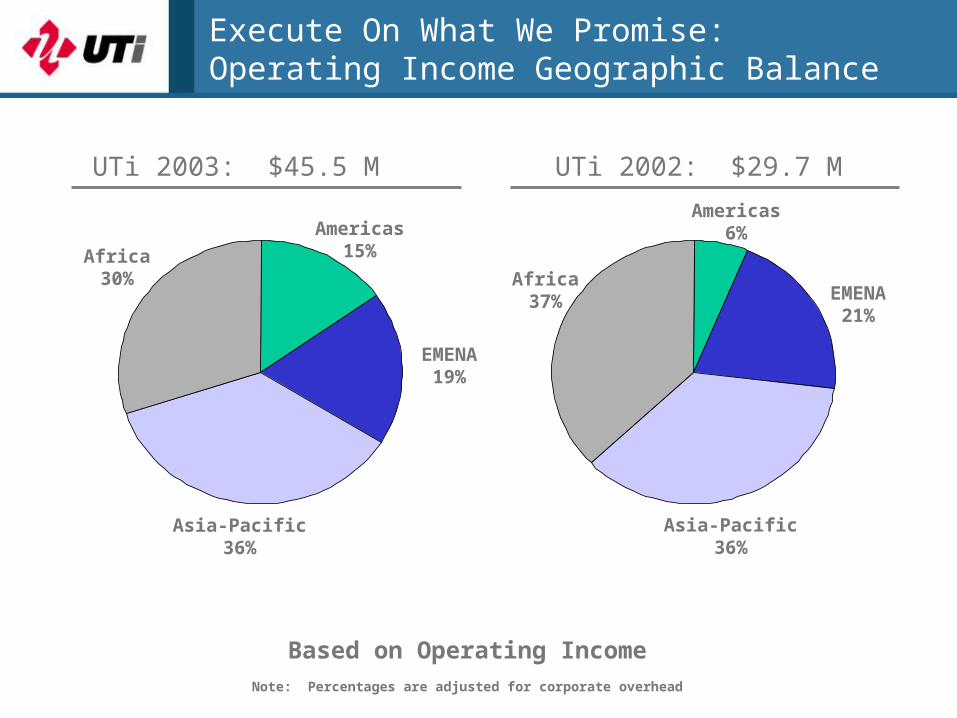
Execute On What We Promise:Operating Income Geographic Balance
UTi 2003: $45.5 M UTi 2002: $29.7 M
EMENA19%
EMENA21%
Americas15%
Americas6%
Africa30%
Asia-Pacific36%
Asia-Pacific36%
Africa37%
Based on Operating IncomeNote: Percentages are adjusted for corporate overhead
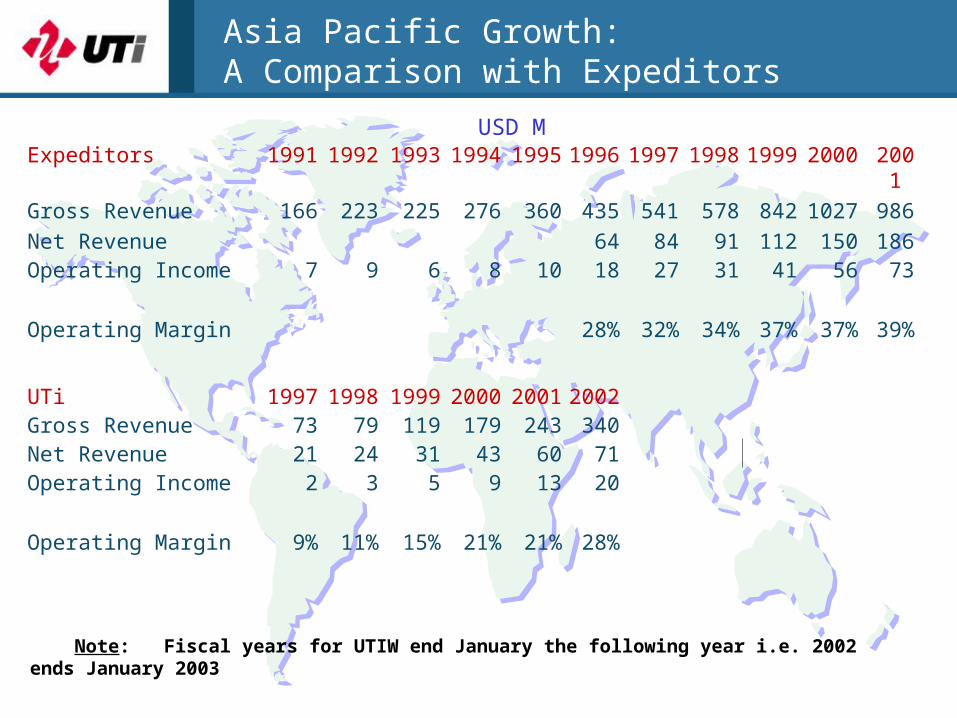
Asia Pacific Growth: A Comparison with Expeditors
USD M
Expeditors 1991 1992 1993 1994 1995 1996 1997 1998 1999 2000 2001
Gross Revenue 166 223 225 276 360 435 541 578 842 1027 986
Net Revenue 64 84 91 112 150 186Operating Income 7 9 6 8 10 18 27 31 41 56 73
Operating Margin 28% 32% 34% 37% 37% 39%
UTi 1997 1998 1999 2000 2001 2002Gross Revenue 73 79 119 179 243 340Net Revenue 21 24 31 43 60 71Operating Income 2 3 5 9 13 20
Operating Margin 9% 11% 15% 21% 21% 28%
Note: Fiscal years for UTIW end January the following year i.e. 2002 ends January 2003
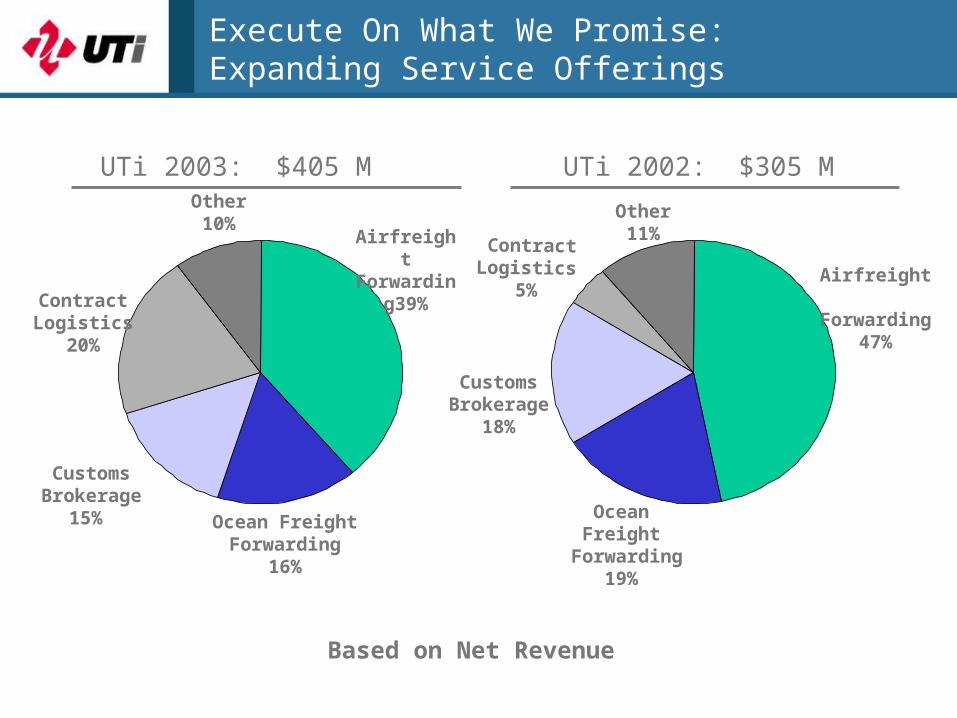
Execute On What We Promise:Expanding Service Offerings
Airfreight
Forwarding 47%
Ocean Freight
Forwarding 19%
Customs Brokerage
18%
ContractLogistics
5%
Other 11%Airfreight
Forwarding39%
Ocean FreightForwarding
16%
CustomsBrokerage
15%
Other 10%
ContractLogistics
20%
UTi 2003: $405 M UTi 2002: $305 M
Based on Net Revenue
Topics
• Whip around the World
• Customer Needs & Trends
• The Changing Financial UTi Landscape
• Operational Excellence
• Sales Challenges
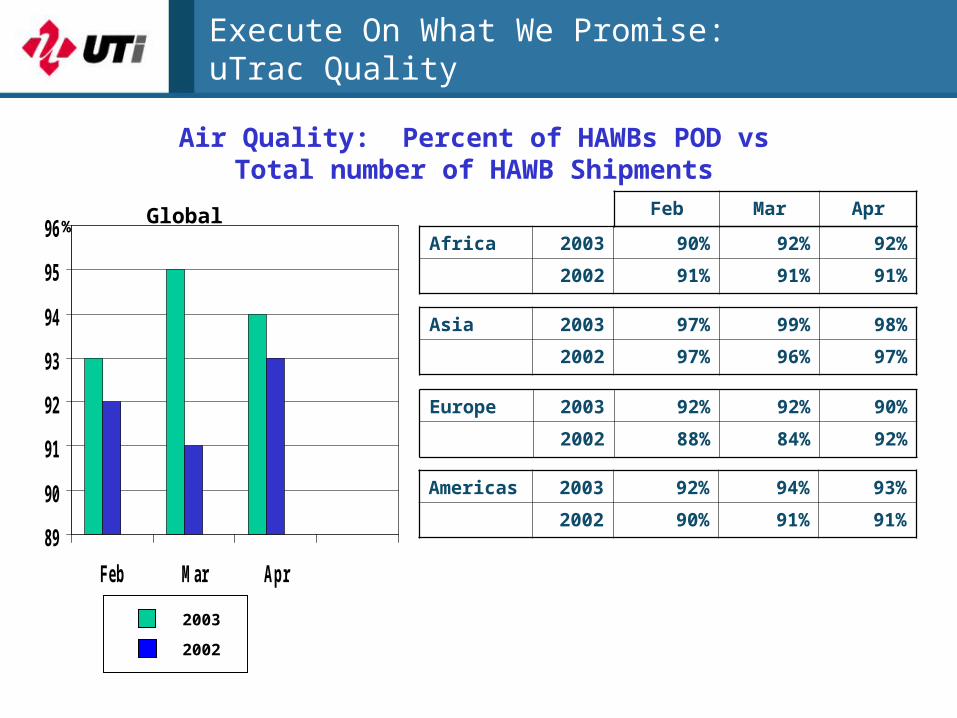
Execute On What We Promise: uTrac Quality
Africa 2003 90% 92% 92%
2002 91% 91% 91%
Asia 2003 97% 99% 98%
2002 97% 96% 97%
Europe 2003 92% 92% 90%
2002 88% 84% 92%
Americas 2003 92% 94% 93%
2002 90% 91% 91%89
90
91
92
93
94
95
96
Feb Mar Apr
%
2003
2002
Air Quality: Percent of HAWBs POD vsTotal number of HAWB Shipments
Global Feb Mar Apr
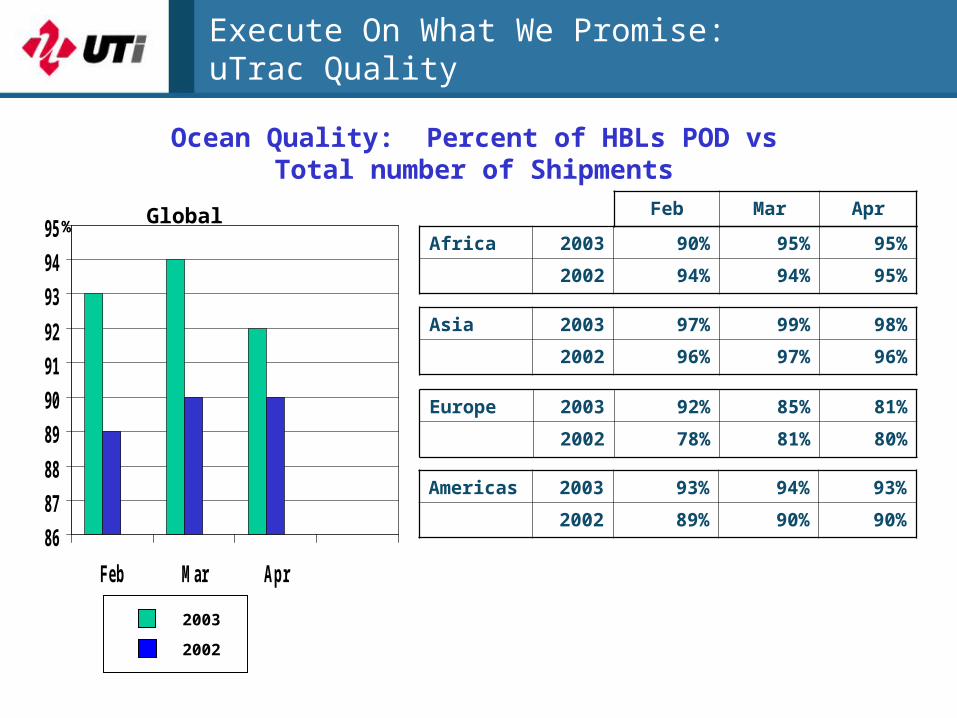
Execute On What We Promise: uTrac Quality
Africa 2003 90% 95% 95%
2002 94% 94% 95%
Asia 2003 97% 99% 98%
2002 96% 97% 96%
Europe 2003 92% 85% 81%
2002 78% 81% 80%
Americas 2003 93% 94% 93%
2002 89% 90% 90%86
87
88
89
90
91
92
93
94
95
Feb Mar Apr
%
2003
2002
Ocean Quality: Percent of HBLs POD vsTotal number of Shipments
Global Feb Mar Apr
OriginGateways
Origin
Origin
Origin
Origin
DestinationGateways
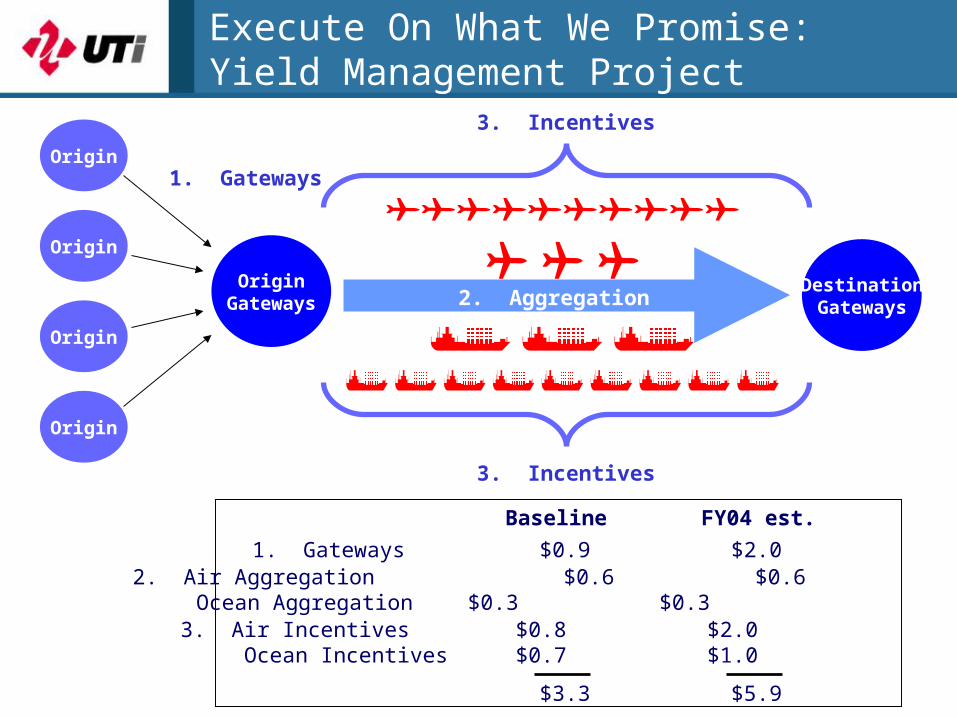
1. Gateways
1. Gateways $0.9 $2.0
Baseline FY04 est.
Execute On What We Promise:Yield Management Project
3. Incentives
2. Aggregation
2. Air Aggregation $0.6 $0.6 Ocean Aggregation $0.3 $0.3
3. Incentives
3. Air Incentives $0.8 $2.0 Ocean Incentives $0.7 $1.0
$3.3 $5.9
Topics
• Whip around the World
• Customer Needs & Trends
• The Changing Financial UTi Landscape
• Operational Excellence
• Sales Challenges
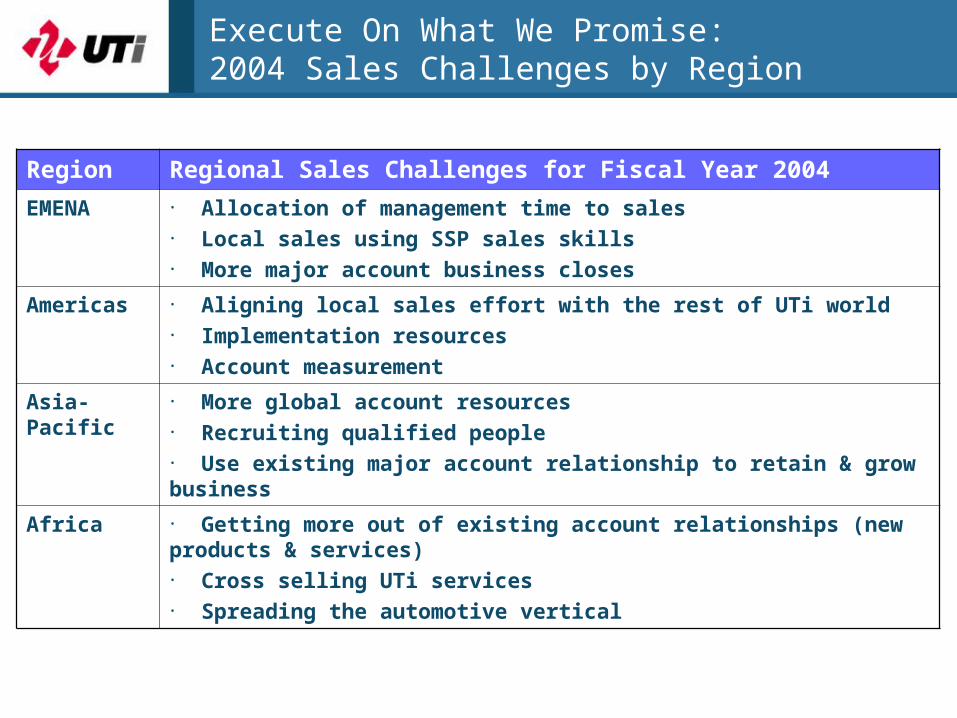
Execute On What We Promise:2004 Sales Challenges by Region
Region Regional Sales Challenges for Fiscal Year 2004
EMENA • Allocation of management time to sales • Local sales using SSP sales skills• More major account business closes
Americas • Aligning local sales effort with the rest of UTi world• Implementation resources• Account measurement
Asia-Pacific • More global account resources• Recruiting qualified people• Use existing major account relationship to retain & grow business
Africa • Getting more out of existing account relationships (new products & services)• Cross selling UTi services• Spreading the automotive vertical
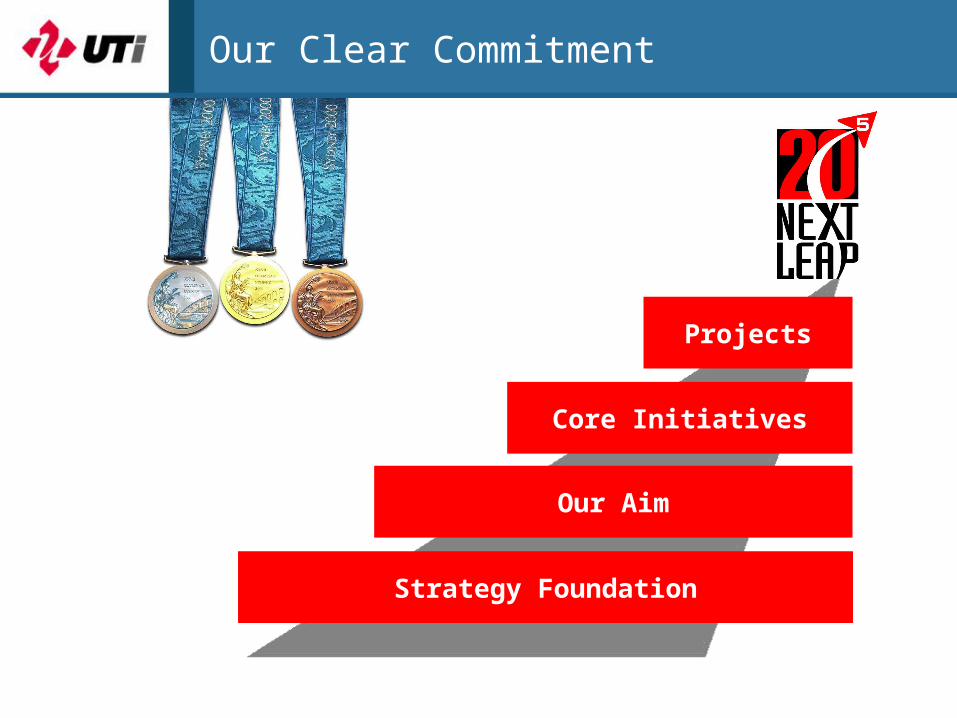
Our Clear Commitment
Our Aim
Core Initiatives
Projects
Strategy Foundation