oulu business school - search homejultika.oulu.fi/files/nbnfioulu-201305201282.pdf · oulu business...
TRANSCRIPT

OULU BUSINESS SCHOOL
Artturi Roitto
FACTORS EFFECTING CORPORATE SOCIAL
RESPONSIBIITY DISCLOSURE RATINGS:
AN EMPIRICAL STUDY OF FINNISH LISTED COMPANIES
Master’s thesis
Accounting
April 2013

UNIVERSITY OF OULU ABSTRACT OF THE MASTER'S THESIS
Oulu Business School
Unit
Oulu Business School Author
Roitto, Antti-Pekka *Artturi Supervisor
Nilsson H. Visiting Prof. (SSE) Title
Factors Effecting Corporate Social Responsibility Disclosure Ratings:
An Empirical Study of Finnish Listed Companies Subject
Accounting Type of the degree
Master’s thesis Time of publication
29.04.2013 Number of pages
72
As Corporate Social Responsibility (CSR) disclosure is becoming more common
practise amongst companies, it is valuable to understand the underlying factors in-
volved. The Goal of this thesis is to examine if the factors suggested by previous
studies seem to have significance in a Finnish sample composed of 31 listed compa-
nies. As an ancillary research question linkage between Corporate Governance rec-
ommendation deviations and CSR ratings were examined.
The research was executed by utilizing raw data from Thomson ONE Banker finan-
cial database, public information available in the 2012 annual reports, corporate
governance statements and company web sites. This data was used to construct 10
independent variables. The CSRHub overall rating was applied to form the depend-
ent variable. The raw data was then processed using linear regression.
The results were limited as in many variables’ case no significance was found. Age
and profitability factors alone had an anticipated affect on CSR disclosure ratings,
but other variables fell short when trying to demonstrate positive or negative signifi-
cant linkages. Average age of board members showed negative significant relation-
ship with CSR ratings at a 1 % level, profitability at a 5 % level.
The relative homogenous nature of Finnish listed companies can be argued to hinder
the results. It is unlikely that the variables used in this thesis have such insignificant
affect on CSR disclosure in all situations. It can be argued that the Finnish cultural
environment is most likely the cause of the variables’ indifference. Finland is seen
as a “model student” of the European Union and this cultural atmosphere might be
the single most powerful determinant. More important than any specific company
characteristic. It would be highly interesting to see more studies thriving to examine
this perspective. Keywords
CSR, Responsibility Reporting, GRI, Global Reporting Initiative, CG, Corporate
Governance, CSRHub Additional information

ACKNOWLEDGEMENTS
I would like to thank and apologize to my girlfriend Emilia, my family and my
friends for the extensive and constant babble about thesis. Fortunately this lasted
only two months and before they even knew it, other topics to babble about already
emerged.
I am in gratitude to my supervisor Professor Henrik Nilsson from Stockholm School
of Economics who was always ready to provide answers to my puzzling questions
and guided my work to a swift end. I would also like to thank Professor Juha-Pekka
Kallunki from Oulu School of Economics for making this co-operation possible and
for providing me some additional answers. Thank you Leena Mäkela for checking
the text for grammar errors.
Sincerely,
Artturi Roitto
Written in Oulu 10.4.2013

TABLE OF CONTENTS
Abstract / Acknowledgements
Table of Contents
Figures and Tables
1 INTRODUCTION ............................................................................................... 7
1.1 Background .................................................................................................... 7
1.2 Previous Research .......................................................................................... 8
1.3 Purpose ......................................................................................................... 11
1.4 Structure ....................................................................................................... 11
2 THEORIES OF CORPORATE SOCIAL RESPONSIBILITY .................... 13
2.1 Defining Corporate Social Responsibility ................................................... 13
2.2 Psycho-social Theories ................................................................................ 18
2.3 Economic Theories ...................................................................................... 23
2.4 Driving Forces of CSR ................................................................................. 25
2.5 Framework of Thesis ................................................................................... 26
2.6 Relationship Between Board of Directors, CSR and CG ............................ 28
2.7 Finnish Corporate Governance Code for Listed Companies ....................... 32
2.8 Global Reporting Initiative .......................................................................... 32
2.9 CSRHub Rating System ............................................................................... 34
3 EFFECTING FACTORS: BUILDING THE HYPOTHESIS ....................... 37
3.1 Industry Sensitivity ...................................................................................... 37
3.2 Company Size .............................................................................................. 38
3.3 Media Exposure ........................................................................................... 39
3.4 Institutional Ownership ................................................................................ 39
3.5 Profitability .................................................................................................. 40
3.6 Leverage ....................................................................................................... 41
3.7 Liquidity ....................................................................................................... 42

3.8 Gender .......................................................................................................... 42
3.9 Age ............................................................................................................... 43
3.10 Independence ............................................................................................... 43
3.11 Ancillary Corporate Governance Factor ...................................................... 44
4 RESEARCH DESIGN AND METHOD .......................................................... 45
4.1 Variables ...................................................................................................... 45
4.1.1 Dependent variable ........................................................................... 45
4.1.2 Independent variables ....................................................................... 46
4.2 Sample .......................................................................................................... 49
4.3 Empirical Model .......................................................................................... 51
4.4 Ancillary Corporate Governance Issue ........................................................ 51
RESULTS AND DISCUSSION .............................................................................. 53
4.5 Descriptive Statistics and Correlation Coefficients ..................................... 53
4.6 Factors Effecting CSR Disclosure Ratings .................................................. 56
4.7 Complying the Code .................................................................................... 59
4.8 Limitations and Further Study ..................................................................... 61
5 CONCLUSIONS ................................................................................................ 63
REFERENCES ......................................................................................................... 65

FIGURES
Figure 1. Evolution of CSR research focus in last six decades (Carroll 1999). ......... 14
Figure 2. Hierarchy of needs (Maslow & Herzeberg 1954). ...................................... 17
Figure 3. Psycho-social factors (Bamberg & Möser 2007)........................................ 19
Figure 4. Stakeholder Theory (Polonsky 1995). ........................................................ 22
Figure 5. Framework effecting CSR disclosure ratings. ............................................ 27
Figure 6. Relationship between Board of Directors, CSR and CG. ........................... 30
Figure 7. Structure of CSR rating (CSRHub 2013). .................................................. 35
Figure 8. Weighted rating elements and overall rating (Gidwani 2011).................... 36
Figure 9. Scatter plot diagrams of AGE and ROA factors. ........................................ 59
TABLES
Table 1. Sample's industry distribution and representation. ...................................... 50
Table 2. Descriptive statistics for the dependent and independent variables. ............ 53
Table 3. Correlation coefficients among independent variables. ............................... 54
Table 4. Regression results of CSR ratings on the independent variables, part I. ..... 56
Table 5. Regression results of CSR ratings on the independent variables, part II. .... 57
Table 6. Deviations from Finnish CG code. .............................................................. 60

7
1 INTRODUCTION
1.1 Background
Corporate Social Responsibility as an idea has roots at least six decades long but it
has become more familiar to the public only a few years ago. The growth of CSR
awareness can be linked to the growing environmental concern and green movement
that has been popularized across the media. Companies’ obligations have gradually
shifted from narrow shareholder vision, to cover more vast groups of stakeholders.
Due to the high-speed information of social media, the asymmetry of knowledge has
grown so little that it is impossible or impractical to hide doubtful actions. This
means that ethical operations are seen more and more as a norm for viable business.
Although CSR is voluntary by Finnish law, it is increasingly compulsory for a com-
pany to maintain its brand. Public reactions to uncovered wrongdoings spread like
wildfire across social and conventional media having terrifying impacts on the target
company’s image. Voluntary CSR disclosures are a way to communicate that the
company values are in line with the public’s values. To further encourage and stand-
ardize the process of CSR disclosing, organizations such as Global Reporting Initia-
tive (GRI) were founded in the beginning of 21st century. Organizations such as
CSRHub were founded to collect and rate these reports to form comprehensive and
comparable directories.
Other topics like Corporate Governance are also related to the disclosure issue. After
such cases as Enron and Parmalat, more regulatory actions have sprouted to guide
aspects of board composition and work. It can be asked if these issues are related to
the growth of CSR engagements, and if so, why. At the end it can also be said, that
nowadays it is increasingly difficult for a company to detach itself from surrounding
society. Every action has a counterforce, whether desirable or undesirable.

8
1.2 Previous Research
A large number of theories have been gathered to construct the theoretical frame-
work for the thesis. In this section, these theories are summarized to give an over-
view of the issues that are later explicated. The theory section of the thesis is divided
into two parts. The first one presents a vast collection of general CSR related theories
and the second part concentrates on the theories linked to specific factors. The evolu-
tion of the modern CSR notion is described by several scholars including Asongu
(2007), Carroll (1999) and Moura-Leite & Padgett (2011). They describe the devel-
opments specifically from the 1950’s to 2000’s. From a historical point of view, one
of the most important CSR scholars is Bowen (1953), who is said to coin the con-
cept. Many other scholars have also contributed to CSR research during the last dec-
ades (Davis 1960, Frederick 1960, Johnson 1971, Maslow & Herzeberg 1954,
McGuire 1963, Tuzzolino & Armandi 1981).
Major theories related to CSR issues can be divided into Psycho-social Theories,
Economic Theories and theories explaining the Driving Forces behind CSR disclo-
sures. Psycho-social theories involve factors that are built in individual thinking pro-
cesses and social constructs. The theories describe how individual thinking is trans-
lated into pro-environmental behavior. (Bamberg & Möser 2007, Hines et al.
1986/87, Schmitz et al. 2012.)
Interpersonal and intrapersonal motivational triggers are also linked (Weiner 2001).
The affect of attitudes on sustainable choices is argued by Hines et al. (1986/87) and
Oskamp et al (1991). Resistance to chance is also linked to a previous line of theo-
ries. (Kotter 2007) House (1996) brings forth some elaborate motivational theories to
further explicate human nature. Other important theories include Political Economy,
Stakeholder, Legitimacy and Institutional theories. Political Economy theory is ex-
plicated by Merlo (2005), Stakeholder theory by Freeman (2009) and Mitchell et al.
(1997). Legitimacy theory is presented referring Tilling (2004) and Institutional theo-
ries referring Scott (2004).

9
The second category of theories is economical. This section presents a list of theories
with an evident link to CSR disclosures. Economical theories are important due to
the fact that they are intuitively the easiest way to communicate CSR benefits to
management in such terms as profitability. Important economical theories covered in
this section are Positive Accounting Theory (PAT), Agency Theories, Voluntary
Disclosure Theory (VDT), Signaling Theory, Resource-based Theory and Proprie-
tary Cost Theory. These theories are explicated through various prominent scholars
such as Zimmerman & Watts (1986), Mitnick (1973), Ross (1973), Guidry & Patten
(2012), Verrecchia (1983), Spence (1973), Wernerfelt (2006), Ellis et al. (2012).
Driving forces of CSR are examined to further construct the underlying theoretical
framework for the issue at hand. Different approaches to these forces are presented
and briefly discussed in this section. Plausible theories are provided by Chandler &
Werther (2010: 94-107) who have built an impressive model in their book. Scholars
such as Pederson (2010) and Visser (2008) give a bit of alternative sets of drivers to
the table, but the overall idea is the same. The next section describes the relationship
between the Board, CSR and CG brings light to the theoretical base needed in ancil-
lary research question. It also combines sources such as Finnish Corporate Govern-
ance Code (2010), Jamali et al. (2008), Friedman (1970), Knudsen et al. (2012),
Zollo et al. (2009) and Chih et al. (2010) to open up the aspects involving the rela-
tionship.
After the major framework of theories the thesis moves to more specific variable
related issues. Each variable in this section is individually justified by a string of the-
ories. Industry sensitivity variable is based on such studies as Adams et al. (1998),
Gray et al. (1995), Jenkins & Yakovleva (2006), Line et al. (2002), Ness & Mirza
(1991) and Clarke & Gibson-Sweet (2004). It also combines knowledge from Bowen
(2000), Hoffman (1999) and Reverte (2009).
Company size variable is a collection of ideas suggested by Rahman & Widyasari
(2009), Watts & Zimmerman (1986), Hackston & Milne (1996b), Adams et al.

10
(1998), Clarke & Gibson-Sweet (1999), Gray et al. (1995), Cullen & Christopher
(2002) and Patten (2002). These theories explain that company size has something to
do with CSR disclosures and this thesis thrives to prove this result. Media exposure
is the next variable included in the study. Such studies as Patten (2002), Simon
(1992), Bansal & Roth (2000) and Bansal & Clelland (2004) are utilized to explain
the linkage. Institutional ownership variable is constructed using knowledge attained
from Coffey & Fryxell (1991), Graves & Waddock (1994a), Fauzi et al. (2007),
Saleh et al. (2010) and Cox et al. (2004).
The three financial variables used in the thesis are profitability, leverage and liquidi-
ty. Profitability was chosen based on studies done by Cowen et al. (1987), Ismail &
Chandler (2005), Brammer & Pavelin (2008), Hackston & Milne (1996a), Freeman
(2009), Belkaoui & Karpik (1989), Inchausti (1997), Ng & Koh (1994) and Tilling
(2004). There was a formidable amount of studies related to CSR’s profitability as-
pect. The link of CSR and leverage is also backed by several studies (Brammer &
Pavelin 2008, Jensen & Meckling 1976, Purushothaman et al. 2000, Webb 2005), as
well as link between CSR and liquidity of a company (Abd-Elsalam & Weetman
2003, Aly et al. 2010, Ezat & El-Masry 2008, Samaha & Dahawy 2011).
The last part of the variables is describing companies board member related charac-
teristics such as gender diversity, independence and average age. Proof of gender
diversity’s affect on CSR disclosure was gathered from a quantity of previous studies
and some of these were included (Babcock 2012, Grosser & Moon 2005, Soares et
al. 2011a). Similar method with independence variable (Honnold 1984, Vlosky &
Vlosky 1999) and average age (Ibrahim & Angelidis 1995, Wang & Dewhirst 1992,
Webb 2004).
The last section consists of theory related to the ancillary CG issue. It attempts to
build a theoretical foundation for a claim that CG recommendation deviances are
linked to CSR disclosures. This relationship would manifest itself in a way that when
the number of deviances grows higher, the CSR rating consequently suffers. The

11
theory is backed by a list of findings. (Babcock 2012, Nasrullah 2010, Ibrahim &
Angelidis 1995.)
1.3 Purpose
The purpose of this thesis is to examine whether the factors described in prior re-
search seem to have an affect on Finnish listed companies. The idea was to collect a
comprehensive gestalt of variables that seem to have something to do with CSR dis-
closures and test if these variables have a significant relationship to the Finnish sam-
ple. The variables are gathered from numerous studies trying to indentify factors that
affect CSR disclosures significantly in a positive or negative way. The factors are a
collection of issues describing board composition, financial and general company
characteristics. This collection is meant to give an ample picture of the factors that
could be important in explaining high or low CSR ratings.
The primary research question of this thesis can be expressed as follows: Do factors
presented in prior studies seem relevant in explaining Corporate Social Responsibil-
ity disclosure ratings amongst Finnish listed companies? The data used in the thesis
also allowed constructing a secondary research question to briefly examine the link-
age between Corporate Governance deviations and Corporate Social Responsibility
disclosure ratings: Is there a link between deviations from Finnish Corporate Gov-
ernance Code and CSR rating?
1.4 Structure
The thesis starts with an introduction which sheds light on the background of CSR
issues, summarizes previous studies and explains the purpose and structure. After the
introduction it begins to explain the theoretical framework it utilizes in order to lay a
foundation for answering the primary and secondary research questions. In the next
portion of the study, some elementary CSR theories are introduced and explained.
These theories are divided into more specific areas of interest such as psycho-social

12
and economic theories. This section also explicates the historical evolution of mod-
ern CSR, proposes some driving forces and examines the relationship between the
Board, CSR and CG. The latter part of the section is meant to describe important
elements such as Finnish Corporate Governance Code, Global Reporting Initiative
and CSRHub Rating System. These institutions are highly needed to construct a
comprehensive framework for the thesis. The theoretical framework is followed
more specific theories that involve specific variables. This way the thesis is focusing
its vision from encompassing to much more concentrated issues. The direction of the
whole thesis is from general to specific. In this section each variable used in the the-
sis is explained individually. The validity is examined through prior studies and some
direction for the expected significance is presented. After the background of an indi-
vidual factor is examined, a hypothesis is formed.
Research design and method chapter informs how the variables are collected and
measured. It presents the sample and expresses some sample related issues. As the
thesis utilizes the linear regression model, the model is then constructed and briefly
explained. This section ends with issues related to the secondary or ancillary research
question. The results and discussion section brings forth the results after the raw data
is processed. It begins with some elementary statistics to describe the data and pre-
sents correlation coefficients in the form of tables and supporting explanations. It
then continues with the presentation of factors effecting CSR disclosure ratings.
Some regression results are shown and discussed. After the results related to the pri-
mary research question, the secondary results related to CG are examined. This sec-
tion concludes with the discussion of limitations and ideas for further studies.
The thesis ends with concluding remarks and a list of references used. The list con-
sists of large a variety of books, research papers and internet sources. Most of the
papers are accessed through Scopus database, but many other resources are utilized.
The thesis follows all the guidelines for a Master’s thesis provided by Oulu Business
School. Pictures and tables are all drawn to fit the guidelines. Some streamlining has
been done to make sure the figures are more useful.

13
2 THEORIES OF CORPORATE SOCIAL RESPONSIBILITY
This “theoretical inventory” paragraph works as an introduction to general theoreti-
cal framework of CSR by presenting some valuable studies, theories and scholars
behind it. The word ‘inventory’ depicts the section’s toolbox-like quality which en-
deavors to help building an encircling frame for the thesis’ actual research question
issues, addressed later on in the thesis. After this broader perspective the thesis con-
tinues to more specific studies related to the selected variables and the hypothesis
building.
2.1 Defining Corporate Social Responsibility
The purpose of this section is to explain how the CSR came to be over the decades
and which characteristics were on the top any given time. Simply put, the section
provides the thesis its historical perspective and this way hopes to contribute the big
picture of this research. Some environmental laws can be traced almost 5000 years
(Asongu 2007), but the modern notion of Corporate Social Responsibility or shortly
CSR came into play over 60 years ago.
The development continued through the half century and came across many different
forms (Carroll 1999). Some people have felt it concealing a profoundly anti-
corporate agenda and having a nature that condemns the old ways of doing business,
but the widely accepted definition of CSR is that it’s about the processes a corpora-
tion conducts that benefit the society in which it operates in (Baker 2004). Figure 1
shows how CSR research has moved towards a higher level of refinement in course
of decades. It also includes some scholars and their research regarding CSR issues.
These specifics are explained more thoroughly later in the section.
As mentioned in the beginning, the journey of modern CSR started in the 1950’s and
at this time was only named as SR. The lack of corporate emphasis is believed to
stem out of the era’s mentality that did not yet recognise the dominance of the busi-

14
ness sector. The clear landmark to note the rise of CSR is argued to be Howard. R.
Bowen’s (1953) publication: “Social Responsibilities of the Businessman”. The men-
tality of the era can also be seen in the title, which indicates the corporate world was
highly masculine. (Carroll 1999)
1950 1960 1970 1980 1990 Decade
Ref
inem
ent
of
Th
eory
THE MODERN ERA
OF CSR BEGINS
● Bowen (1953)
CSR LITERATURE
EXPANDS
● Davis (1960)
● Frederick (1960)
● McGuire (1963)
DEFINITIONS OF CSR
PROLIFERATE
● Johnson (1971)
● CED (1971)
FEWER DEFINITION,
MORE RESEARCH AND
ALTERNATIVE THEMES
● Tuzzolino & Armandi
(1981)
CSR FURTHER YIELDS TO
ALTERNATIVE THEMES
● CSP, Corporate Citizenship
● etc.
Figure 1. Evolution of CSR research focus in last six decades (Carroll 1999).
Carroll (1999) describes Bowen as the “Father of Corporate Social Responsibility”
as he laid the foundation to the discipline with his seminal work over half a century
ago. Although Bowens work was stamped by the mentality of the time, meaning that
the simple idea that a firm could have other than monetary obligations was ground
breaking, he was the first one to say so. It was absolutely controversial to say that the
beneficiaries of the firms “manna” should included stakeholders other than share-
owners. (Bowen 1953, Carroll 1999.) After Bowen, many more seem to have
adopted his original idea of CSR and the cultivation of the seminal thought that leads
to our days had began (Carroll 1999).

15
The next decade, the 1960’s, meant explosive expansion in the field of CSR litera-
ture. The era was characterised by a drive to formalise and standardise the subject. In
other words the topic was trying to find a solid common ground to stand and univer-
sal language to share ideas with. (Asongu 2007, Carroll 1999, Moura-Leite &
Padgett 2011.) The most significant figure in the 1960’s CSR research scene seems
to be Keith Davis (1960). He brought CSR to the next level by bringing the notion of
possible long-term financial benefit to the table. He suggested in his work that being
socially responsible cannot just be perceived as a charity function, but as a way of
boosting company’s profitability. He also explained the linkage between social
power and social responsibility. Irresponsible actions lead to corrosion of social
power. (Carroll 1999, Davis 1960.)
There were also a few other heroes of the CSR cause in the 1960’s who had precious
ideas on the topic of how firms should extend their obligations over the legal and
economical boundaries. Such researchers include Joseph W. McGuire (1963) and
William C. Frederick (1960). The overall mentality shifted more and more to include
moral guidelines to effect institutions, not just individuals. Ideas of voluntarism also
emerged, stating that organisations should voluntarily, not by coercion, participate in
society benefitting actions and accept the possible costs without money as an incen-
tive. (Asongu 2007, Carroll 1999, Moura-Leite & Padgett 2011.)
In the 1970’s the definitions of CSR rapidly increased. Some studies concentrated on
identifying the motivations behind CSR. Idea of companies balancing with multiple
objectives was beginning to form. One of these theories was lexicographic view of
social responsibility by Johnson (1971). It explained that firms have a set of goals
that they place in order of importance. Some firms might emphasize economic fac-
tors as some social. These states of order are built around certain factors that affect
the emphasis. This further indicates that firms with strong profit maximising goals
primarily endeavour to fill monetary goals and later move to social ones. This leads
to a situation where some firms pretend to care about the responsibility issues more
than they actually do. (Carroll 1999, Johnson 1971.)

16
The most influential finding was made by the Committee for Economic Development
(1971), when it published its report on CSR. They had noted that the social fabric
between society and businesses had started to change in important and substantial
ways. The businesses were more connected to the society than before and they were
asked to serve a wider range of human values than before. After the arduous defini-
tion searching of the 1970’s, years of 1980’s brought with them less definitions but
more research and alternative themes. The previous focus had now stemmed into
various kinds of themes and alternative ways to approach the issue of CSR. (Asongu
2007, Carroll 1999, Moura-Leite & Padgett 2011.)
One of the most intriguing research efforts was done by a duo, Frank Tuzzolino and
Barry Armandi (1981). They felt that CSR research was in a need of a hierarchy
model and decided to implement the one composed by famous Abraham Maslow
(1954). Maslow’s (1954) hierarchy of needs dictates that we all have different level
needs which start from basic needs like sleep, food, breathing and shelter. When
these are fulfilled we are able to step to the next level of needs and so work our way
to the top, where lies the high-level functions like creativity and morality.
Tuzzolino and Armandi (1981) stated in their research that like individuals, also
companies share this need hierarchy. This indicates that if a company is to imple-
ment CSR reporting and other related functions, it has basic needs it has to fulfil be-
fore. A company’s lowest level basic functions could be for example related to fun-
damental economical issues and profitability. Figure 2 shows the total 5 levels of
Maslow’s (Maslow & Herzeberg 1954) need hierarchy. When you look at the struc-
ture of the theory and the descriptions of the levels it’s easy to imagine the adaptation
from individual to organisational. The viewpoint is collective rather than personal,
but the theory seems credible.
In the 1990’s only a few new unique contributions to CSR research were made. The
theory-base stabilized, but the new alternative themes still continued to emerge. New
theories made use of the formed building blocks of CSR and were guided by the

17
CSR-thinking. Some of these mentioned theories include CSP (Corporate Social Per-
formance), stakeholder theory, business ethics theory and corporate citizenship. Al-
though these theories fall into the realm of CSR, they have their own strong literature
and due to this they are left without further discussion. CRS responsibility related
studies mainly consisted of revision to older models and definitions. One of these
was Carroll’s (1999) revision to his four-part definition of CSR.
Biological and Physiological Needs
Air, Food, Drink, Shelter, Warmth, Sleep
Safety Needs
Protection, Security, Order, Law, Limits, Stability
Belonging and Love Needs
Family, Affection, Relationships, Work Group
Esteem Needs
Achievement, Status, Responsibity, Repuration
Self-actualisation
Personal Growth and Fulfillment
Figure 2. Hierarchy of needs (Maslow & Herzeberg 1954).
Nowadays CSR-thinking is as important as ever. Unnerving news concerning mal-
practices have swept the media, as some companies like the Swedish healthcare
company Carema Care, have been caught practicing at best questionable ideas. The
firm has been accused of neglecting elderly care in its units by absolutely minimizing
the services and the workforce. (YLE news 2012.) To my understanding the com-
pany started this drastic profit maximisation behaviour after it was sold to North-
American equity investors. Not that the problem has anything to do with the buyers

18
being Americans, but the issue lies in the social and physical distance. Before the
trend of outsourcing healthcare began, these units were closely tied to surrounding
community which protected customer rights from major corrosion.
Healthcare industry wrongdoings in general and previous types of malpractices are
very good examples of cases that can be avoided with good CSR practices (YLE
news 2012). These are one of the most sensitive industries in situation of building
lack of social conscience, and these types of firms should not only operate in bounda-
ries drawn by state, but construct their own social standards over the bare outside
coercion. Spreading CSR standards help them to build this mindset. The selected
sample of this thesis unfortunately does not contain examples of these types of com-
panies, as this would have been highly interesting. Nevertheless, the understanding
of this, let’s say trend, is vital especially in the healthcare industry and other similar
industries. (EFPIA 2013.)
2.2 Psycho-social Theories
To entirely understand the underlying relationship between organisations and the
quality of their responsibility disclosure ratings, some portion to human psyche in
form of psycho-social determinants must be explored. The contribution of this sec-
tion is to help the thesis in providing the larger framework with environmentally and
socially beneficial actions.
The previously mentioned objectives are achieved by reviewing pre-environmental
human behaviour research literature and linking this to the elements of the thesis
with some discretion as the presented viewpoint are mostly from the fields of psy-
chology and sociology. As these views are highly important elements, the emphasis
of the thesis is still selected to be mainly economical.
As the other aspects of the framework like Finnish Corporate Governance Code,
Global Reporting Initiative Standards, CSRHub rating system and sample restric-

19
tions, the behaviour sheds light on the mental processes we are all subject to. The
motives that drive us to work towards an environmentally and socially better corpo-
rate world are this sections top interests.
IntentionProblem
Awareness
Internal
Attribution
PBC
Feelings of Guilt
Behaviour
Moral Norm
Social Norm Attitude
Figure 3. Psycho-social factors (Bamberg & Möser 2007).
It has been almost 30 years since Hines, Hungerford and Tomera (1986/87) con-
ducted an impressive meta-analysis of 57 samples describing the motivation behind
pro-environmental behaviours. Their research was later revisited by a pair of German
academics Bamberg and Möser (2007) who used the old research as a platform by
replicating it and also extending it to be more comprehensive. Although these studies
focus on the environmental side of responsibility, the theories are quite universal in
the realm of human psyche and are excellent in explaining the reasoning behind any
other form of similar responsibility. (Schmitz et al. 2012.)
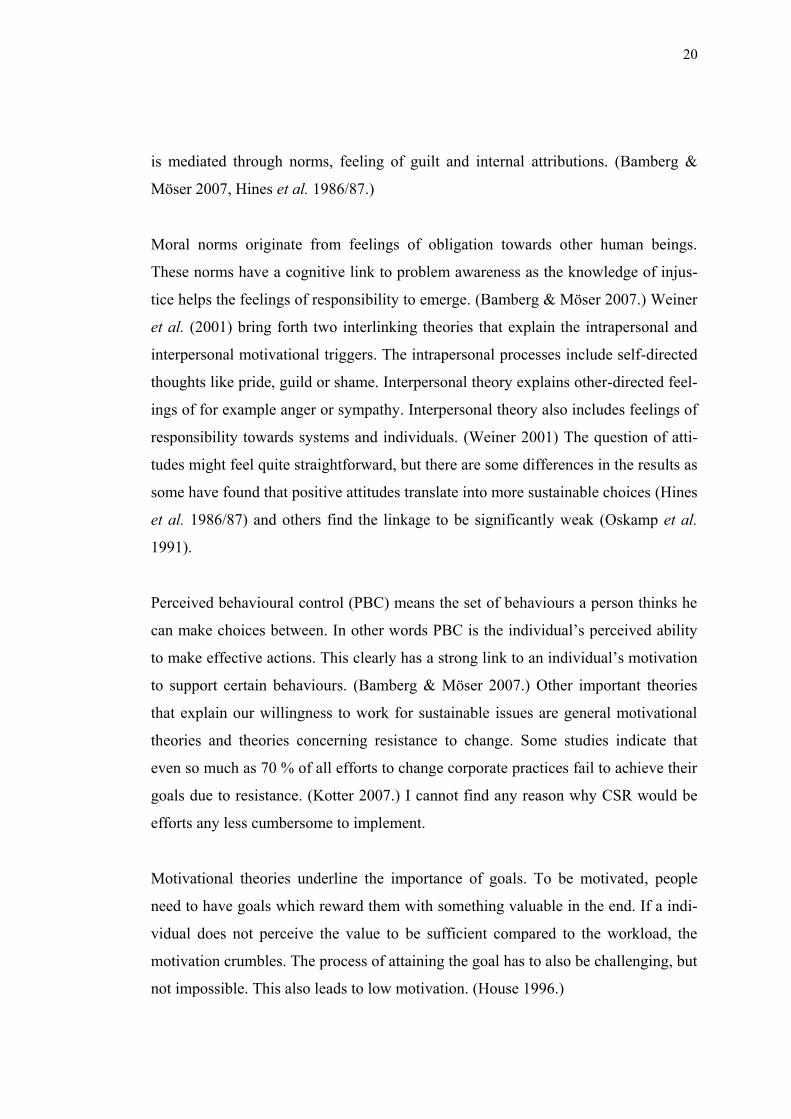
Figure 3 loosely presents the determinants of pro-environmental behavioural actions
as they are explained by Bamberg & Möser (2007). The meta-analysis suggests that
moral and social norms, feelings of guilt, internal attributions, attitudes and per-
ceived behavioural control have direct connection to behavioural intentions which
ultimately share unity with resulting pro-environmental actions. Problem awareness
20
is mediated through norms, feeling of guilt and internal attributions. (Bamberg &
Möser 2007, Hines et al. 1986/87.)
Moral norms originate from feelings of obligation towards other human beings.
These norms have a cognitive link to problem awareness as the knowledge of injus-
tice helps the feelings of responsibility to emerge. (Bamberg & Möser 2007.) Weiner
et al. (2001) bring forth two interlinking theories that explain the intrapersonal and
interpersonal motivational triggers. The intrapersonal processes include self-directed
thoughts like pride, guild or shame. Interpersonal theory explains other-directed feel-
ings of for example anger or sympathy. Interpersonal theory also includes feelings of
responsibility towards systems and individuals. (Weiner 2001) The question of atti-
tudes might feel quite straightforward, but there are some differences in the results as
some have found that positive attitudes translate into more sustainable choices (Hines
et al. 1986/87) and others find the linkage to be significantly weak (Oskamp et al.
1991).
Perceived behavioural control (PBC) means the set of behaviours a person thinks he
can make choices between. In other words PBC is the individual’s perceived ability
to make effective actions. This clearly has a strong link to an individual’s motivation
to support certain behaviours. (Bamberg & Möser 2007.) Other important theories
that explain our willingness to work for sustainable issues are general motivational
theories and theories concerning resistance to change. Some studies indicate that
even so much as 70 % of all efforts to change corporate practices fail to achieve their
goals due to resistance. (Kotter 2007.) I cannot find any reason why CSR would be
efforts any less cumbersome to implement.
Motivational theories underline the importance of goals. To be motivated, people
need to have goals which reward them with something valuable in the end. If a indi-
vidual does not perceive the value to be sufficient compared to the workload, the
motivation crumbles. The process of attaining the goal has to also be challenging, but
not impossible. This also leads to low motivation. (House 1996.)

21
The final part of the motivational scene is the probability of achieving the goal that
has been set. If an individual experiences that the probability is insufficient, he or she
might undergo desperation which harms the person’s motivation. The before-
mentioned ideas and theories bring us to discussion about the determinants behind
motivation to conduct SCR reporting. Companies are built around people like every-
thing else, so it’s natural to assume that we take also the same needs and mental as-
sets to the corporate decision making. (House 1996.) For example the board of direc-
tors that ultimately makes the decision whether to implement CSR reporting or not,
is truly influenced by the same interpersonal and intrapersonal traits that were ex-
plained above. This is just a simple case of deduction.
The board is only the tip of the ice berg, since motivational thinking is easily applied
to individuals. Nevertheless it indirectly influences every part of the company, like
wise, because the company consists of people. It must be mentioned though that the
financial ratios and company characteristics have many aspects which are quite far
from being easily explained through simple motivational reasons. (House 1996.) Due
to these and many more reasons, thesis continues to make the final judgements based
on regression model explained a bit further. This does not hinder the importance of
mental processes which are highly useful. These are factors that must be taken in to
account when thinking about all problems involving human beings. The idea of this
section was not to provide so many answers, but to give the reader a holistic view of
the research framework and this way expand the whole picture.
Other related studies include Political Economy, Stakeholder, Legitimacy and Institu-
tional theories. Political Economy Theory and later International Political Economy
Theory explain the relationships and behaviours in settings that include political ele-
ments like law and government, as well as economical elements. These studies re-
search how these affect each other and in process develop into social systems like
capitalism and communism. (Merlo 2005.)
22
Legal ORGANISATION
General Public
Competitors
Consumers
Employees
Suppliers
Financial
Institutions
Media
Government
Interest Groups
Scientific
Community
Shareholders
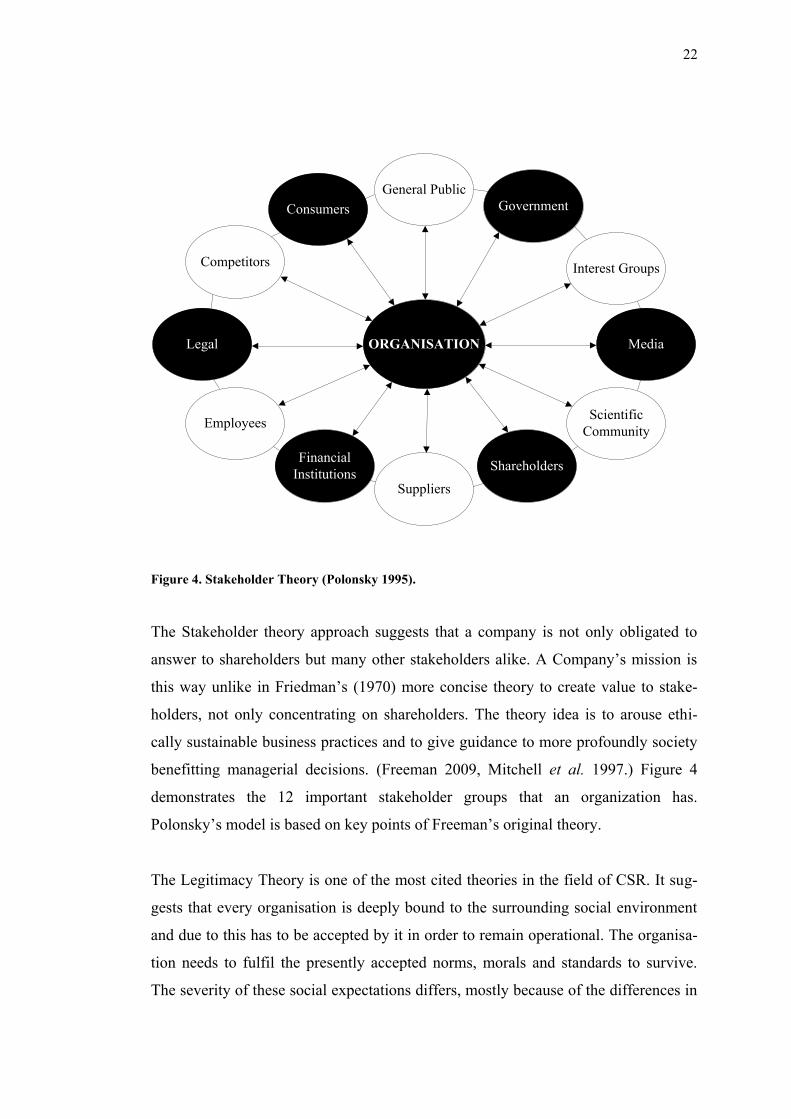
Figure 4. Stakeholder Theory (Polonsky 1995).
The Stakeholder theory approach suggests that a company is not only obligated to
answer to shareholders but many other stakeholders alike. A Company’s mission is
this way unlike in Friedman’s (1970) more concise theory to create value to stake-
holders, not only concentrating on shareholders. The theory idea is to arouse ethi-
cally sustainable business practices and to give guidance to more profoundly society
benefitting managerial decisions. (Freeman 2009, Mitchell et al. 1997.) Figure 4
demonstrates the 12 important stakeholder groups that an organization has.
Polonsky’s model is based on key points of Freeman’s original theory.
The Legitimacy Theory is one of the most cited theories in the field of CSR. It sug-
gests that every organisation is deeply bound to the surrounding social environment
and due to this has to be accepted by it in order to remain operational. The organisa-
tion needs to fulfil the presently accepted norms, morals and standards to survive.
The severity of these social expectations differs, mostly because of the differences in
23
economic systems. For instance, a socialistic country’s ideals greatly vary from capi-
talistic ideals. (Tilling 2004.) The Institutional Theory emphasises on the hardy and
ever-chancing social structures. It explains how things such as social norms and rules
become behaviour effecting elements and coerce our decisions in conscious and sub-
conscious levels. It strives to explain how these elements are shaped, used and even-
tually discarded in cycles. (Scott 2004.)
2.3 Economic Theories
While psycho-socio-political theories are very interesting and valuable sources of a
broader understanding of CSR, the economic theories are very much needed when
we are talking about profit seeking entities such as Finnish listed companies. This
section sheds light on some of the most important theories covering the economical
motives of CSR behaviour. Some of these theories include Positive Accounting The-
ory (PAT), Agency Theories, Voluntary Disclosure Theory (VDT), Signaling Theory,
Resource-based Theory and Proprietary Cost Theory.
The Positive Accounting Theory (PAT) explains how and why accounting policy
decisions are made and how the adopted practices affect the people involved. PAT
studies try to identify “positive” or benefitting accounting practices and normatively
aspire to construct found positive features into guidelines. The guidelines given by
PAT analysis are utilized to maximize company’s survival potential. (Watts & Zim-
merman 1986.)
Two agency theories were coined roughly at the same time in the 1970’s by Barry
Mitnick (1973) and Stephen Ross (1973). The first one is the scholar behind institu-
tional agency theory and the second one, the researcher behind economic agency
theory. Both theories are based on the same ideas, but the assumptions were differ-
ent. Ross (1973) suggests that the issue is mainly involved with incentives. To make
the motivational gap between the principle and the agent as small as possible, well
placed and measured incentives are the best way to do it. For instance, in order to

24
line CEO’s needs with shareowner needs, he must be granted with stocks as an in-
centive to make him care more about the share value. He is now also an owner with
owner motives. Mitnick (1973) sees the issue in a different way. He suggests that
institutional systems are built around the problematic relationship between the prin-
ciple and the agent. The relationship is imperfect and the institutions purpose is to
mellow these imperfections with regulations and structures.
Voluntary Disclosure Theory (VDT) studies explain how and why companies volun-
tarily disclose. It thrives to explain what the endogenous factors are driving voluntary
disclosure and the consequences of disclosing. According to the theory, companies
conduct voluntary disclosure to minimize information asymmetry between manage-
ment and investors. This model is much used in the realm of financial accounting,
but it is very useful in explaining CSR disclosures as well. (Guidry & Patten 2012,
Verrecchia 1983.) Signalling Theory in economics is suggesting that in order to
minimize the information gap between a company and stakeholders in general is to
give most credible information of its operations it possibly can. The idea is easily
explained through a job market example. A job searcher or potential employee has a
couple of ways to communicate his competence to a potential employer. (Spence
1973.)
He can tell the employer how good he is, or he can show some credentials, for in-
stance certificates. Obviously the certificates are a more credible way to communi-
cate competence and so the information asymmetry is lowered. This example is simi-
lar to a company’s situation. (Spence 1973.) If a company wants to gain something
concrete from its CSR disclosure efforts, credible signalling is crucial. Resource-
based Theory describes how a company can transform its tangible and intangible
resources into a competitive advantage. To gain sustainable long term advantage
from a resource it has to be complex and immimicable. It also can’t be very volatile
to give any long term gains. (Wernerfelt 2006.) This theory can be valuable in ex-
plaining CSR disclosure’s beneficial affect.

25
Proprietary Cost Theory suggests that there is a threshold to the amount of informa-
tion a company should disclose. Some amount of information must be disclosed to
lower the information asymmetry between company and stakeholders, but too open
disclosure might be aiding competitions. This leads to a situation where a company’s
viability is in danger to be harmed. In other words there is a point in how much
should be disclosed and it should not be crossed. It is a matter of balancing pros and
cons. (Ellis et al. 2012.)
2.4 Driving Forces of CSR
Many forces drive CSR developments across companies and many theories have
emerged to categorise these drivers. One viewpoint divides the drivers into five basic
categories: Increased Affluence, Ecological Sustainability, Globalisation, Free Flow
of Information and The Power of the Brand. (Chandler & Werther Jr 2010: 94-107.)
Increased affluence means that CSR’s role as a giver of economic growth and stabili-
sation is heightened. Foremost in developed countries companies have reached a
situation where more sublime actions are needed to boost development. (Chandler &
Werther Jr 2010: 94-96.) As mentioned before, companies have Maslow’s (1954)
hierarchy of needs built into them. Ecological sustainability refers to the interest
towards economical choices and nature preservation. Reduction of waste, pollution,
depletion of natural resources and the menacing climate change are forces that push
companies to ensure their operations longevity. (Chandler & Werther Jr 2010: 96-
98.)
Globalisation of companies makes their impact to society and environment far
greater than before. Some companies’ authority is exceeding authority of many small
countries, which heightens the public pressure they are facing. (Chandler & Werther
Jr 2010: 98-101.) Free flow of information makes this pressure even more intense, as
bloggers and twitters alike are following every aspect of companies’ operations.
(Chandler & Werther Jr 2010: 101-104.) Flow of information has everything to do
with the power of the brand. Without positive image it is impossible for a company

26
to compete in today’s market situation. Positive and unique brand is nowadays
strongly linked to sustainable way of doing business. It is a very big part of every
large brand out there. (Chandler & Werther Jr 2010: 104-107.)
Although the division to five major drivers seems appealing some studies suggest
there is much more to it. Visser (2008) suggests that the forces should be divided into
national and international drivers first. He found six different national drivers: Politi-
cal reform, Cultural tradition, Socio-economic priorities, Governance gaps, Crisis
response and Market access. The four international drivers he suggests are: Interna-
tional Standardisation, Investment Incentives, Stakeholder Activism and Supply
Chain. Pedersen (2010) adds to the mix some further drivers. He gives examples of
more concrete forces like Consumer preference, Employee recruitment and retention,
Resource shortages and ROI projects. This means there will be hard dollar justifica-
tions for companies to still push towards greater efficiency. Projects might include
better material usage and decreased energy usage. The discussion is endless regard-
ing what forces are in affect. The fact still remains that CSR is needed and the whole
gravity of modern environmental development rushes to improve.
2.5 Framework of Thesis
In this section of the thesis I began to build the framework around the actual research
problem. Now that we understand the historical side of CSR research and have
grasped some underlying psycho-social factors that guide out thinking, including
motivational elements, our interest should focus on the overall framework that I op-
erate in this thesis. Figure 5 demonstrates the research problem of this thesis with all
key elements. In the middle of the thesis is the rating of the CSR disclosure as de-
fined and composed by the organisation named CSRHub. The rating system in use is
thoroughly discussed further in the thesis. The rating is used as the dependent vari-
able.

27
The framework is constructed around a two-tier-model where the inner tier includes
the effecting factors or explanatory variables, which are further divided into three
groups to simplify the idea. The first group consists of variables affecting board of
directors. The selected explanatory variables are: average age of board members, %
of women amongst board members and finally % of independent board members. The
second group consists of financial figures, as these are also interesting when we are
talking about economical entities. The selected variables include Return on Assets,
Leverage and Liquidity.
BOARD OF DIRECTORS
Average age
% of women
% of independent members
FINANCIAL FIGURES
Return on Assets
Leverage
Liquidity
Finnish Corporate
Governance Code
Global Reporting
Initiative Standards (GRI)Pro-environmental
Behaviour
CSR DISCLOSURE RATING(CSRHub)
GENERAL COMPANY
CHARACTERISTICS
Media exposure
Company size
Institutional ownership
Industry sensitivity
Sample specific characteristics
Figure 5. Framework effecting CSR disclosure ratings.
The last group of the three is more general in nature compared to the other two. The
group consists of general company characteristics which are also unique to each
company in the sample. These variables include: media exposure, company size, in-

28
stitutional ownership and industry sensitivity. The thesis thrives to explain the
changes in disclosure ratings with this set of 10 variables provided in the prior CSR
research literature. The variables are elaborately explained later on in the thesis.
The first tier with the 10 explanatory variables and the dependent rating variable con-
struct the core of the research. The second tier is a gestalt of institutions as Finnish
Corporate Governance Code (later abbreviated FCGC) and Global Reporting Initia-
tive (GRI), as well as other significant factors like previously explicated psycho-
social determinants of pro-environmental behaviour and sample specific characteris-
tics. These four indirectly affect the research core and due to this fact are important
in comprehending the possible relationships between selected variables. To give an
example, the composition of board of directors is directly linked to FCGC.
I also wanted to add sample specific characteristics to the second tier. These charac-
teristics include limitation to Finnish listed companies and companies which CSR
reports follow GRI 3 or 3.1 standards. All of the sample companies have also been
given a rating by CSRHub ranging 0–100. The firms are also all listed on the Hel-
sinki Stock Exchange.
2.6 Relationship Between Board of Directors, CSR and CG
In the centre of this section is the trinity illustrated in the Figure 6. This trinity is
constructed around three of the most influential institutions in this thesis: the Board
of Directors, the Corporate Social Responsibility and the Corporate Governance. On
the top of the triangle is the Board of Directors. It is perhaps the single most impor-
tant decision-making element in an organisation. This is true in the sense that it is
responsible for implementing the bottom of the triangle, meaning CSR and CG. To
be able to comply with FCGC (2010) a Finnish listed company needs to appoint the
board members each year in a shareholder’s meeting. This is done using a voting
procedure. If the company fails to comply with the code, it is obligated to explain the
deviance. (Securities Market Association 2010.)

29
So even though the code dictates certain rules the company has plenty of freedom to
choose which recommendations it wishes to comply with. Of course the social pres-
sure to comply with as much accuracy as possible is huge. The willingness to comply
can be seen from my research data. Over 70 % out of 31 Finnish listed companies
complied with the FCGC with accuracy of 100 %. The topic related to willingness to
comply is handled in detail later on in the thesis.
The research literature has treated CG and CSR as separate and mainly independent
issues. This is due to the fact they have unrelated accountability models, guidelines,
reporting standards and oversight mechanisms. In other words, they basically do not
share the same foundations. (Jamali et al. 2008.) Regardless of their differences they
are both designed to avoid the company from abusing its position. Let that abuse be
for instance CEO’s value destructive behaviour in case of CG or in CSR case gained
excess returns by disclosing lower than actual pollution quantities to officials.
The dichotomy of CSR and CG is also based on the obligation differences. Both are
built over the idea of responsibility, but the target groups differ greatly. By conduct-
ing CSR actions, the firm carries out its liabilities towards the society and by com-
plying with the present CG code, it is setting itself on a track that serves the owners’
financial wellbeing. The double arrowhead in Figure 6 indicates the traditional view
that emphasises the Board of Directors responsibility towards owners. This view is
built on Milton Friedman’s (1970) idea of Corporate Social Responsibility, or more
accurately, lack of it. In his opinion the company’s only responsibility is to maximise
shareowner value. The double arrowhead also indicates the important notion that
follows previously discussed Maslow’s (1954) need hierarchy. To engage CSR
goals, the firm needs to make sure its finances are in order. If a company cannot en-
sure its longevity, its other efforts are rendered useless.
Historically, the board members main duty has been guarding the interest of owners
by making well based strategic decisions and by acting as a supervisory organ to
other leaders, foremost the CEO. As mentioned, traditionally the focus has been in

30
profit maximisation (Friedman 1970). Fortunately the contrasting of CSR and profit-
ability has come to an end, according to Knudsen et al. (2012).
BOARD OF DIRECTORS
CGCSR
Obligation towards
Society
Obligation towards
Shareholders
Shared abuse-preventing
purpose
Unintegrated foundation● Accountability models
● Guidelines
● Reporting standards
● Oversight mechanisms
Figure 6. Relationship between Board of Directors, CSR and CG.
Even though the focus towards CSR and CG issues has risen interestingly only few
firms actually have specific action plans for either of them. Most boards have not
included CSR into their strategy and do not have processes in place to evaluate
shareholder demands. The lack of board oversight in these issues leads into skinny
results. Knudsen et al. (2012) found three conditions that the company must attain to
achieve better CSR. The company must succeed in these following aspects: board
mind-set, board competences and compensation structure. (Knudsen et al. 2012.)
The mind-set means how board members view responsibility and what is their under-
standing of CSR is. The Economist (2008) claimed that companies with stronger
share performance also performed well in CSR by paying more attention to CSR
issues in general. Knudsen et al. (2012) set off to prove this argument. The contrast-
ing claim was that board members actually do not see this value creation to be true
and assess CSR costs as additional strain on budget, nothing more. In other words

31
they pursued to find out whether the board members see a situation of conflicting
interests between goals set for CSR and CG. Do they see CSR as a valuable and inte-
grated part of corporate strategy or as a separate act of goodwill towards stake-
holders, something to do with philanthropy, not so much with business. (Knudsen et
al. 2012.)
In the CSR point of view the results were crude. Board members still had strong loy-
alty towards owners and saw themselves mainly as a supervisor and strategist in
these aspects. They felt they didn’t need to discuss CSR issues very often and per-
ceived these functions to be highly operational, in contrast to strategic. (Knudsen et
al. 2012.) The rhetorical and the action-side seem to differ greatly when CSR issues
are considered in strategic framework. Many firms seem to speak about financial
rewards of CSR, but the work to actually cultivate the issues falls short in most cases.
This is a good indication that companies do not believe in the concrete monetary
benefit of implementing CSR, but they perceive only the PR side of it. It is good
public relations to say you are for instance pro-environmental, but turning the bluster
into progress is harder. (Zollo et al. 2009.)
Taking the relationship between CSR and CG back into consideration, there seems to
be interesting linkage between CSR disclosure and strong shareholder rights, as these
seem to share negative correlation. In countries that exercise strong pro-shareholder
regulation, companies are less willing to engage in CSR activities. It seems that self-
regulatory companies operate in countries with better employee relationships, better
macro-economical situation and management schools. (Chih et al. 2010.) It can be
argued that is this indication of the fact that more morally self-guiding environments
need less shareholder right regulations and this more morally aware atmosphere is
also reflected on the CSR disclosure.

32
2.7 Finnish Corporate Governance Code for Listed Companies
The Finnish Corporate Governance Code is implemented in order to raise the level of
self-regulation in the stock exchange. As a side-note this proficiency in self-
regulation was also proven beneficial to the CSR cause (Chih et al. 2010). The or-
ganisation behind the Code is Securities Market Association, which duties include
participating in drafting the regulation standards concerning listed companies and
when necessary interpreting them (SMA 2013).
Securities Market Association is a co-operation organ founded by the Confederation
of Finnish Industries EK, NASDAQ OMX Helsinki Ltd. and Finland’s Chamber of
Commerce in December 2006. The Market Practice Board is founded by the Securi-
ties Market Association and is set to promote the idea of good CG and good securi-
ties market practices within Finnish listed companies. (SMA 2013.) The Code be-
came effective first in 2004 after major fraud cases like Enron emerged. Its intention
was to increase companies’ credibility as secure investments to both foreign and do-
mestic investors. (Grünberg & Hägg 2007.) Since then many updated versions have
been published. The latest version came into force October 1st 2010. The code con-
sists of 54 recommendations that a Finnish listed firm needs to comply with. If a
company is not able to or wishes not to comply with a certain recommendation, it is
obligated to explain the deviance. This method is called: comply or explain. The rec-
ommendations are mostly set to guide certain abuse-preventing aspects of board
composition. (SMA 2013.)
2.8 Global Reporting Initiative
Global Reporting Initiative (GRI) is an international initiative to create vastly ex-
cepted reporting guidelines for CSR disclosure. Material for GRI is built by several
different stakeholders as a co-op project. GRI is an independent foundation and a co-
operational organ of United Nations Environment Programme (UNEP). GRI is an
un-profit seeking organisation. (GRI 2013.)

33
GRI’s mentality is to combine long term profitability with social justice and envi-
ronmental awareness. They provide organisations the means to start their own sus-
tainability reporting and increase their transparency and accountability towards a
large group of stakeholders. GRI is working on a network basis. The global network
consists of about 30.000 people, many of them sustainability experts. GRI’s vision is
to build “a sustainable global economy where organisations manage their economic,
environmental, social and governance performance and impacts responsibly and
report transparently.” Their mission is “to make sustainability reporting standards
practice by providing guidance and support to organisations”. GRI is provided with
institutional funding from many governments and agencies such as the Swedish In-
ternational Development Cooperation Agency, the Norwegian Ministry of Foreign
Affairs, German’s state-owned Deutsche Gesellschaft für Internationale Zusam-
menarbeit (GIZ) and the Australian government. (GRI 2013.)
Latest GRI guidelines are G3 and G3.1. These are used by all Finnish listed compa-
nies conducting CSR reporting. The new G4 guideline is currently in a development
phase. The third generation G3 guidelines were launched in 2006 and 2011 some
features were added to form G3.1. G4 plans to be launched in May 2013 as a part of
GRI’s commitment to continuous development of the guidelines. All guidelines fol-
low a system where there are three different levels of disclosure. Each level is more
demanding and needs more effort from the company’s part. The levels are A, B and
C, where A is the most comprehensive reporting level. To indicate third-party check-
ing, plus signs are added accordingly. For instance, level A disclosure with third-
party (not the company itself or GRI) validation is turned into A+. (GRI 2013.)
G3.1’s disclosure performance indicators are set into three groups: Economic, Envi-
ronmental and Social. To further break down the Social group, its subgroups are La-
bor, Human Rights, Society and Product Responsibility. Indicator Protocols are used
to uniform disclosure indicators. These explain how indicator data should be com-
piled, the intended scope and relevance. Protocols are the recipe on how to construct
the performance indicators. Guideline’s structure is divided into two parts. Part one

34
consists of principles and guidance. Principles define the report content such as Ma-
teriality, Stakeholder Inclusiveness, Sustainability Context and Completeness. Re-
porting quality is also defined: Balance, Comparability, Accuracy, Timeliness, Reli-
ability and Clarity. Part two gives guidance to Standard Disclosures. What is the
strategy and profile of individual company and what is the management approach.
Specific performance indicators are also explained. (GRI 2013.)
2.9 CSRHub Rating System
CSRHub is a gateway to access CSR ratings on over 7.000 companies in 135 differ-
ent industries and in 90 countries. CSRHub’s idea is to form a single comprehensive
directory to find CSR disclosure and Sustainability performance ratings and a portal
to compare these across supply chains, regions and industries. CSRHub webpage
encourages organisations to run operations in a transparent, responsible and sustain-
able way. The database provides a vast set of different tools and metrics to enhance
managerial and stakeholder decision-making processes. The database is composed of
over 200 sources. (CSRHub 2013.)
CSRHub rates twelve subcategories which constitute four main ratings including
environment, community, employee and CG issues. The database is composed of
socially responsible research companies’ data, well-known indexes and publications.
These research companies are: Thomson Reuters, Carbon Disclosure Project, EIRIS,
Corporate Library, IW Financial, Risk Metrics IVA and Impact Monitor, Trucost and
Vigeo. These companies provide the data needed to constitute the rating. CSRHub is
a Benefit Company and an organisational stakeholder with the GRI (Global Report-
ing Initiative) a silver partner with CDP (Carbon Disclosure Project) and a founding
member of ATBE (Alliance of Trustworthy Experts). It also supports guidelines of
GISR (Global Initiative for Sustainability Rating) and IIRC (International Integrated
Rating Committee). (CSRHub 2013.)

35
This thesis is using CSRHub overall rating as a dependent variable. The overall rat-
ing follows beta distribution and the idea is that there is a standard for each 12 differ-
ent measures and four main categories the overall score is composed of. Companies
that are following the standard are given a rating of 50 on a 0 to 100 scale. If the
firms CSR disclosure is below standard the rating is between 0–49 and companies
that exceed the standard expectations are given a rating of 51–100. (CSRHub 2013,
Gidwani 2011.)
1) Board
2) Community Dev & Philanthropy
3) Compensation & Benefits
4) Diversity & Labor Rights
5) Energy & Climate Change
6) Environmental Policy & Reporting
7) Human Rights & Supply Chain
8) Leadership Ethics
9) Product
10) Resource Management
11) Training, Health & Safety
12) Transparency & Reporting
Community
Employees
Environment
Governance
Overall Rating
SUBCATEGORIES MAIN CATEGORIES
Figure 7. Structure of CSR rating (CSRHub 2013).
Each firm is rated by many different sources and the total score is an average taken
from these ratings. Thus the rating is a collective perception of each specific com-
pany’s disclosure quality and credibility. CSRHub has total of 2.000.000 separate
rating contributions of the 7.000+ companies. There is however always the chance
that the collective is wrong and the actual quality of a disclosure is higher or lower
than the rating indicates. (CSRHub 2013.)
To be more specific, the 12 subcategories are rolled up into four main ratings: com-
munity, employees, environment and governance. The overall rating is average of
these four ratings (scaled 0–100 as previously mentioned). All the scores from the 12

36
subcategories to 4 main ratings, given by different sources, are compared and by ana-
lysing variations possible biases are determined. Each source is weighted based on
CSRHub’s estimate of its credibility and value. If a certain rating does not contain
enough information it is dropped. For instance CSRHub requires data from at least
nine subcategories from at least two different sources before they attempt to publish
the overall rating. The rating pattern is close to normal distribution. All overall rat-
ings taken in account compare their curve against normal curve with a SD of 20.5
and a median of 1.5. Figure 8 shows the distribution graph and Figure 7 presents the
rating structure as previously depicted. Figure 8 shows how much each individual
score differs from the overall score. If a company gets an overall score of 43, an in-
dividual data point score of 60 gives the difference of 43 – 60 = -17. The chart is
adjusted in a way that the different element weightings are in place. (CSRHub 2013,
Gidwani 2011.)
Actual Distribution of
Differences
Normal Distribution
Fre
quen
cy o
f O
ccu
rence
Overall Rating
0.350%
0.300%
0.250%
0.200%
0.150%
0.100%
0.050%
0.000%
0 75
50
25
10
0
-50
-75
-10
0
-25
Figure 8. Weighted rating elements and overall rating (Gidwani 2011).

37
3 EFFECTING FACTORS: BUILDING THE HYPOTHESIS
This section’s purpose is to identify all variables used in this thesis and to provide
some prior direct theoretical background for them. The previous section aspired to
build a more holistic view of the CSR issues, but this section aims to start answering
the research questions. After handling the theoretical issues related to each variable
the, hypothesis’ are constructed. The first 10 hypothesis are related to the primary
research question and the final CG variable is an extra for the secondary research
question.
3.1 Industry Sensitivity
Studies indicate that industry sensitivity is one of the most powerful factors affecting
company’s CSR disclosure ratings according to Adams et al. (1998) and Gray et al.
(1995). This sensitivity means the extent in which a certain industry is creating envi-
ronmentally potentially harmful materials or chemicals. Thus, the more environmen-
tally hazardous the industry is perceived, the more sensitive it is and the more social
pressure is directed towards it. Such sensitive classified industries include mining, oil
and chemical industries mainly due to the health and environment issues related to
the chemicals involved (Jenkins & Yakovleva 2006, Line et al. 2002, Ness & Mirza
1991). In contrast, industries such as financing and service are emphasizing more
social aspects in their reports. They do not share the same magnitude burden of obli-
gation towards nature preservation as the previously mentioned more heavy indus-
tries. (Clarke & Gibson‐Sweet 1999, Line et al. 2002.)
Many studies indicate that industries such as pulp and paper, power generation, wa-
ter, chemicals, metal and resource industries also share high environmental impacts,
mainly due to the same reasons that previously mentioned industries such as mining
did. These industries are classified as sensitive (Bowen 2000, Hoffman 1999). Newer
more environmentally tuned firms that have been built around the idea of preserva-
tion and ideas of responsibility are not sensitive and are not strongly associated to

38
environmental issues. The pressure from stakeholders is less coercive and the incen-
tive to conduct reporting is less intense. (Reverte 2009) The prior research gives
enough guidance to involve industry sensitivity as an independent variable to be used
in linear regression in determining the Corporate Social Responsibility disclosure
ratings.
H1: There is a positive significant relationship between industry environmental
sensitivity and CSR disclosure rating.
3.2 Company Size
Company size is a frequently used independent variable in explaining variances in
financial disclosures (Rahman & Widyasari 2009). This provides a good basis for
adding this variable to explain CSR disclosure rating variances. Legitimacy theory
explains the pressures that a company has to face when its visibility is heightened for
instance due to size. The larger a company becomes, the more affects are imposed
against it by the surrounding society and fore most government. The political cost
hypothesis is also backing this. It explains how bigger companies are more scruti-
nised by the society. (Watts & Zimmerman 1986.)
Size of a company is related to its market share and power which also adds to its
newsworthiness. Bigger companies also have a larger field of stakeholders and
through this more interest groups and needs to fulfil to avoid public resentment.
(Hackston & Milne 1996a) The incentive to report might be explained with an at-
tempt to avoid unnecessary regulation and perhaps penalty costs. (Adams et al. 1998,
Clarke & Gibson‐Sweet 1999, Gray et al. 1995). When proof of political visibility’s
linkage to CSR is added to the theory base the company size factor seems very well
based (Adams et al. 1998, Cullen & Christopher 2002, Patten 2002). It is beneficial
for this study as an independent variable in explaining CSRHub overall rating.

39
H2: There is a positive significant relationship between company size and CSR
disclosure rating.
3.3 Media Exposure
If a company is always under strict public scrutiny an incentive to build a more posi-
tive public image arises. Patten (2002) in his extension to legitimacy theory describes
how media forms new pressures to fulfil certain obligations towards stakeholders.
The visibility of a company increases as its media coverage or exposure is height-
ened. In the modern world the media is more than ever an image shaper that actively
influences companies’ processes through positive or negative announcements. The
relatively new social media is a major player in mobilizing campaigns in favour for
or against organisations. People collectively, through social media, form norms and
standards for business operations such as CSR. (Simon 1992) Some studies state that
effect of media is particularly factor affecting CSR related issues (Bansal & Roth
2000, Bansal & Clelland 2004). These findings give good reason to add media expo-
sure as an independent variable.
H3: There is a positive significant relationship between CSR disclosure rating
and media exposure.
3.4 Institutional Ownership
According to prior research, institutional ownership has a positive significant rela-
tionship with CSR disclosures. Companies conducting CSR are explained to be more
attractive in the eyes of investors and especially institutional investors. (Coffey &
Fryxell 1991). This finding was also confirmed by Graves & Waddock (1994b).
Studies concerning institutional ownerships’ linkage to CSR are mainly conducted in
North America and Europe, but some interest has recently emerged in Malaysia and
Indonesia. (Graves & Waddock 1994b). Recently conducted studies from the Far
East have also confirmed the positive significant relationship which adds to the

40
knowledge that this is a global phenomenon not just confined to developed countries
(Fauzi et al. 2007, Saleh et al. 2010). The relationship seems to have much to do
with the fact that due to their size, institutions cannot exit investments very flexibly.
By investing into high CSR companies, institutions increase their chances to avoid
bad investments in terms of public image and subsequent profit, as these two seem to
be also related. (Cox et al. 2004.)
H4: There is a positive significant relationship between institutional ownership
and CSR disclosure rating.
3.5 Profitability
This is probably one of the most interesting variables due to the fact that if an unam-
biguous result would be revealed to explain that CSR disclosure actually positively
affects company’s profitability by giving it for instance a clear competitive advan-
tage, it would perhaps increase its commonness. This would subsequently lower
negative corporate social and environmental impact. Profitability’s linkage to CSR
disclosure ratings has divided researchers’ opinions in many cases. It involves many
theories and many different opinions. Some have found good evidence to indicate
that there is a positive significant relationship between the two (Cowen et al. 1987,
Ismail & Chandler 2005) and some argue that there is no such thing (Brammer &
Pavelin 2008, Hackston & Milne 1996b).
Studies examining the linkage between profitability and CSR disclosure are mainly
based on stakeholder theory that explains companies’ obligations to wide range of
stakeholder groups instead of only shareholders (Freeman 2009). One important fac-
tor in building the bridge between CSR disclosure and profitability measures is the
management and its positive understanding of both aspects. Vast knowledge is
needed to transfer the economic thinking into CSR disclosure actions. (Belkaoui &
Karpik 1989.)

41
Agency and political cost theories are also valuable in explaining the linkage. These
theories suggest that managers working in profitable companies are motivated to
improve CSR disclosure in order to ensure the longevity of their position. (Inchausti
1997). More profitable companies are also in many cases larger companies which
could lead to bigger visibility and this way down to size (Ng & Koh 1994). It might
be that CSR is not in any means positively affecting profitability but the other way
round. The more profitable the company is, the more it has resources to invest into
CSR issues. This is probably the easiest way to interpret the linkage. (Cowen et al.
1987.)
Legitimacy theory suggested that due to company’s deep bond to its surrounding
society, it is obligated to show that its profits are earned following certain norms and
ethical conducts. From this perspective CSR disclosure serves well in situations
where high profits are explained to the public. It also serves well in situations where
poor profitability is explained and future improvement is promised based on com-
petitive advantage. (Tilling 2004.) After examining all these viewpoints I hypothe-
sise that there is some significant relationship between CSR disclosure ratings and
profitability. Greatly different opinions about the sign, so it is not speculated further.
H5: There is a significant relationship between profitability and CSR disclosure
rating.
3.6 Leverage
Many studies describing leverage’s relationship with CSR disclosure share the view
that there is a significant relationship, but have disagreement about the sign. Compa-
nies with extensive leverage might engage voluntary disclosures in order to lower
their cost of capital by lowering their agency costs. (Jensen & Meckling 1976.) Other
scholars argue that the additional pressure that is created by high leverage is confin-
ing managers’ hands and this way restricting CSR efforts. As the CSR disclosure
efforts are affecting profitability only indirectly (Brammer & Pavelin 2008). The

42
high leverage companies might also have closer relationships with their creditors,
which could dilute some need for extensive CSR disclosures (Purushothaman et al.
2000). Some argue that there is no significant relationship between CSR disclosure
overall ratings and leverage at all (Webb 2005).
H6: There is a significant relationship between leverage and CSR disclosure
rating.
3.7 Liquidity
Liquidity ratios are once again variables that have given uncertain results in recent
studies. Some studies argue that high liquidity companies are more likely to voluntar-
ily disclose because they want to separate themselves from the lower liquidity com-
panies. (Abd-Elsalam & Weetman 2003.) The level of internet CSR disclosures has
also been linked to high liquidity (Ezat & El-Masry 2008), while other scholars fail
to find any relationship between liquidity and CSR disclosure variables (Aly et al.
2010, Samaha & Dahawy 2011).
H7: There is a significant relationship between liquidity and CSR disclosure
rating.
3.8 Gender
In recent decades the percentage of women managers has gone up dramatically.
Studies suggest that having more female managers and board members adds to
higher levels of CSR. Companies that encourage female leadership have higher level
of philanthropy and engage in better quality initiatives. (Babcock 2012, Soares et al.
2011b.) In Soares et al. (2011b) study larger gender diversity was linked to many
profitability instruments and the affects were positive. Not just economic measures
were heightened, since gender diversity also had impact on CSR disclosure ratings.
The larger the percentage of women board members and executives is, the more CSR

43
actions were taken. The relationship can also be argued to be the other way around as
Grosser and Moon (2005) suggests that CSR efforts have a positive affect on organi-
sations equality. In their research they introduce many positive linkages between
CSR and presence of female leadership.
H8: There is a positive significant relationship between percentage of female
board members and CSR disclosure rating.
3.9 Age
Young people are more accepting and less suspicious of new ideas. The negative
relationship between age and environmental concern has been explained through
differences in socio-biological aging process and important historical events that
have affected different age groups worldviews. (Honnold 1984.) Although the first
claim seems intuitively valid, the relationship between age and environmental con-
cern divides researchers. Some state that the age does not have so significant affect
on the issue. More important factors are related to each individual’s income class and
culture. (Vlosky & Vlosky 1999.) Due to the somewhat undefined nature of the hy-
pothesis no sign is yet determined for the relationship.
H9: There is a significant relationship between average age of board members
and CSR disclosure rating.
3.10 Independence
One of the variables related to board composition is independence. Again, many
positive, neutral and negative results have been found. Positive results are repre-
sented in such studies as Webb (2004) and Ibrahim & Angelidis (1995).Webb (2004)
suggests that companies with higher percentage of outside board members perform
better than those with majority of insiders. Ibrahim & Angelidis (1995) argue that
outside board members are more concerned about the philanthropic component of

44
corporate responsibility than inside board members. Wang and Dewhist (1992) did
not find any differences amongst inside or outside director’s stakeholder orientation
and so the ratio of inside and outside board members would be irrelevant to CSR
activity. Due to the different results gained from prior studies, no sign is determined
for the hypothesis. There is though a belief that a significant relationship can be
found.
H10: There is a significant relationship between percentage of independent board
members and CSR disclosure rating.
3.11 Ancillary Corporate Governance Factor
Corporate Social Responsibility and Corporate Governance are linked in such way
that they are frequently confused with each other. Questions rise though that do CG
and CSR guide management decisions to same or different directions and is the CG
part of CSR or the other way around. (Nasrullah 2010.) The clear distinction is that
CSR is strongly based on voluntarism and CG is in Finland’s case highly regulated.
The strength of the linkage is undefined. The wide affects of CG towards CSR are
somewhat rarely discussed, but some work to examine the causality between the two
has been done. The CG actions have usually been divided into elements such as por-
tion of female board members and independence. (Babcock 2012, Ibrahim & Ange-
lidis 1995.) These variables are already included in this study. My attempt is to bring
a new variable into the table that connects CG recommendation deviances according
to FCGC and the CSR overall score composed by CSRHub. In this way my attempt
is to examine if the level of complying with the code explains some of the success in
conducting quality CSR disclosures. I hypothesise that the more a company deviates
from FCGC recommendations the weaker its overall CSR score is.
H11: There is a negative significant relationship between CG recommendation
deviations and CSR disclosure rating.

45
4 RESEARCH DESIGN AND METHOD
This section of the text covering research design and method contains a precise de-
scription of the collection and measuring process of the dependent variable and each
independent variable used in the study. It puts forward the techniques and reasons
behind the variables. After variable issues the section covers the sample companies
and some sample characteristics. The sample used in the study is presented and ex-
plained thoroughly. An empirical model is constructed and presented to give the
study its empirical backbone.
Lastly, the section explains similar issues related to the ancillary CG factor. This
forms the secondary research question for the study. A portion of the section is sepa-
rate due to the separate nature of the ancillary question. It is meant to support the
primary question, but it is not compulsory in understanding the primary research
question. This section includes information of secondary research questions design
and method.
4.1 Variables
4.1.1 Dependent variable
Thesis utilizes CSRHub overall rating as a dependent variable. The overall rating can
be found from the CSRHub website without the need to subscribe, which involves
certain fees. Subscribing gives access to more detailed information on how a specific
overall rating is constructed, but the information is not needed to conduct this re-
search. As previously presented, each company is given an overall rating from 0 to
100, 50 being a standard quality level of CSR disclosure. This overall rating was
taken without further treatment to act as a dependent variable. Based on the infor-
mation given to describe the rating process, it seems a highly credible measure. The
organizations behind the rating also support credibility.

46
4.1.2 Independent variables
Age
Board members’ average age was measured by calculating the arithmetic mean of all
company’s board members from each company’s website. The data in use was up to
date and presented at the 2013 board composition internet page of each company.
Gender
The level of gender diversity amongst a board of directors was measured by calculat-
ing the number of female board members and dividing it with the total number of
board members. The data was gathered from each company’s up to date 2013 board
composition internet pages.
Independence
Board member independence was measured basically the same way as the gender
variable. Each company’s board composition internet page had dependence infor-
mation that is required by Finnish law. If the information was hard to find from the
page, data was gathered from 2012 corporate governance statements. Only members
that were independent of both company and major shareholders were regarded as
independent.
Media exposure
Media exposure was measured following some aspects of Reverte’s (2009) study
examining CSR rating determinants. As he counted the number of articles a particu-
lar company was mentioned in two Spanish business newspapers ‘Expansión’ and
‘Actualidad Económica’, I also used this method and in similar fashion utilized two
Finnish business newspapers ‘Kauppalehti’ and ‘Talouselämä’.
47
Both magazines’ web research engines were used and the number of hits was exam-
ined for wrong results. The data was collected on January 30th
2013 and the time
frame selected for ‘Kauppalehti’ was from January 1st 2010 to January 1
st 2013. The
time frame for ‘Talouselämä’ articles was from January 2nd
2008 to January 30th
2013, which was the day the data was collected. The difference between time frames
was due to differences in research engines and presentation of results. It was more
convenient to use a shorter time frame for ‘Kauppalehti’. A natural logarithm was
then taken from the initial data to even out some large differences amongst the data
points.
Company size
Measurements of company size differ. For instance Rahman (2009) proxied the size
by total assets. Reverte (2009) referred to prior studies as he selected market capitali-
zation as the measure. To prevent large differences to negatively affect the results, a
natural logarithm was taken from the subsequent results. He claims that the results of
the measure are similar to proxied log of total assets, which was used by Rahman
(2009). This thesis uses market capitalization through natural logarithm as the meas-
ure for company’s size. The data for the size measurement was collected in
‘Kauppalehti’ magazine’s webpage which is a very comprehensive and reliable data-
base to gather financial data.
Industry sensitivity
Industry sensitivity was measured by composing a classification system based on
studies conducted by Jenkins & Yakovleva (2006), Line et al. (2002), Ness & Mirza
(1991), Bowen (2000) and Hoffman (1999). This means that for the thesis, compa-
nies were divided into sensitive and insensitive groups. In these studies industries
involved with mining, chemicals, oil, gas, electricity generation, paper, pulp and
metal were flagged having high environmental impact and so being environmental
sensitive. Sample companies that fitted the previously formed sensitive industry

48
group were given a dummy variable of 1. Other industries were given a value of 0.
To determine if a company belongs to the sensitive category, each sample company
was examined using 2012 annual reports.
Institutional ownership
A dummy variable was utilized to measure institutional ownership. General govern-
ment, financial and insurance institutions and non-profit organisations were included
as institutional owners. Companies with institutional ownership over 20 % were
given a value of 1, and 20 % or under were given a value of 0. The threshold of 20 %
was used because it was the average of the sample. There was no rule to adjust the
threshold, so the average made the most sense. The ownership structures were avail-
able at company websites and they illustrated the present 2013 situation.
Leverage
The raw data needed to calculate leverage was extracted from Thomson ONE Banker
financial database. Leverage ratio is designed to determine a company’s ability to
meet its financial obligations and to illustrate how it is financed. Leverage was calcu-
lated according to the following formula:
(1)
where, leverage is calculated by dividing a company’s total long-term debt with
common equity. Figures used in the calculations are from 2012.
Profitability
Profitability is measured through calculating ROA (Return on Assets). ROA indicates
how profitable a company is related to its total assets. In other words it gives an idea

49
if a company is able to keep its fixed costs low related to profits and how well it is
able to utilize its total amount of assets. Although other accounting or market meas-
ures could be used, ROA is well known and it is easy to understand measure. It is
very commonly used. ROA was calculated using the following formula:
(2)
where, ROA is calculated by dividing 2012 net income with average total assets us-
ing 2011 and 2012 figures. All the needed raw data is extracted from Thomson ONE
Banker financial database and the final calculations are made with spreadsheets.
Liquidity
A company’s liquidity was measures of through quick ratio. Quick ratio indicates
how a company is able to meet its short-term obligations with its set of most liquid
assets. Higher values indicate higher payment capability. Quick ratio was selected
over Current ratio, due to its more conservative nature. It excludes inventories be-
cause turning them into cast is uncertain. The following formula was utilized:
(3)
where, Quick ratio is calculated by subtracting total inventories from total current
assets and then dividing them by total current liabilities. The year 2012 figures were
extracted from Thomson ONE Banker financial database to make the calculations.
4.2 Sample
The sample of this thesis consists of 31 Finnish listed companies. The sample is geo-
graphically confined to Finland because of the familiarity of the companies and the

50
surrounding society. Although the strict confinement of the sample may create gen-
eralization issues in some situations, the decision enabled me to collect quality data.
Most of the data used in the thesis was gathered from 2012 annual reports and corpo-
rate governance statements. The rest was found from Thomson ONE Banker finan-
cial database.
Table 1. Sample's industry distribution and representation.
Industry Sample Exchange SR
Basic industry 6 10 0,60
Consumer commodity 3 14 0,21
Financing 1 15 0,07
Health care 1 5 0,20
IT services 1 2 0,50
Manufacturing and services 12 44 0,27
Oil and gas 1 1 1,00
Services 3 12 0,25
Technology 2 19 0,11
Utility services 1 1 1,00 Total 31 123 0,25
Notes: Helsinki Stock Exchange industry listing is used; SAMPLE: # of companies in sample; EXCHANGE: # of
companies in Helsinki Stock Exchange; SR: Sample representation.
The major determinant of selecting the specific sample was also access to CSRHub
ratings. This was the best source of finding one clear overall CSR disclosure rating.
Most but not all Finnish GRI reporting companies were rated according to this list-
ing. After further trimming the sample the 31 companies remained. To summarize
the present 31 company sample is composed of firms that were listed in the Helsinki
Stock Exchange, reported according to GRI 3 or 3.1 standards and had given a over-
all disclosure rating at CRSHub. This arrangement also allowed me to implement
some aspects of FCGC into the thesis since every sample company was obligated to
comply with it. It must also be mentioned that all of the CSRHub rated companies
were reporting following 3 or 3.1 standards. There is no other reason why such
standards are the only ones present in the sample.

51
Table 1 presents how the sample is divided between different industry classifications
provided by the Helsinki Stock Exchange (OMX 2013). As it is visible from the ta-
ble, the sample represents whole exchange quite well, even though the selection of
the companies was out of my hands. The SR stands for sample representation, which
is as high as 25 % in total. The sample of 31 items is statistically speaking quite low,
although the research design is highly scalable. The only industry that was left with
very little representation was financing, with SR of 7 % the average being 42 %.
4.3 Empirical Model
Statistical analysis conducted in this research uses of the linear regression model to
analyze the relationship between the score of CSRHub disclosure overall rating and
each selected effecting factors referred in the corresponding section of the study. As
mentioned there is only one dependent variable in use which is the CSRHub overall
rating. The method adopted in the empirical analysis is compacted by the following
general form of the models:
(4)
where, AGE: Average age of board members; WOM: % of female board members;
INDEP: % of independent board members; ME: Media exposure; SIZE: Company's
size; INDU: Industry sensitivity; OWN: Institutional ownership; LEV: Leverage
(Long-term Debt / Common Equity); ROA: Profitability (Return on Assets); LIQ:
Quick ratio.
4.4 Ancillary Corporate Governance Issue
Each company’s number of deviances from the FCGC was counted from the 2012
corporate governance statement. The announcement of these deviances is compulso-

52
ry. The number of deviances, the deviated recommendations and companies with
deviations were listed. The sample used in the secondary question is the same one
used in the primary question and is depicted earlier in the thesis. The number of de-
viances was surprisingly low and for that reason no regressions analysis could be
used to examine the relationship. The deviated group of companies was listed and
some aspects of the companies were examined.

53
RESULTS AND DISCUSSION
After designing the research and choosing the research method, actual results were
produced. In this section the statistical results are shown and discussed. The section
starts with descriptive statistics and correlation coefficients and then presents the
results of the linear regression with following discussion and some descriptive
graphs. Each factors affects on CSR disclosure ratings are assessed. The section con-
tinues to the secondary research question results, assessment of research limitations
and finally ideas for further study.
4.5 Descriptive Statistics and Correlation Coefficients
Table 2. Descriptive statistics for the dependent and independent variables.
Variable Mean Median SD Minimum Maximum
Dependent variable RATING 55.968 55.000 5.263 46.000 65.000
Independent variables AGE 57.329 58.000 2.961 52.200 63.625
WOM 0.286 0.286 0.117 0.125 0.500
INDEP 0.823 0.833 0.153 0.500 1.000
ME 6.103 6.217 0.905 4.605 8.699
SIZE 21.334 21.319 1.332 16.873 23.485
INDU 0.387 0.000 0.495 0.000 1.000
OWN 0.387 0.000 0.495 0.000 1.000
LEV 0.436 0.492 0.250 0.002 1.016
ROA 0.046 0.046 0.073 -0.099 0.259
LIQ 1.178 1.040 0.702 0.240 4.050
Notes: RATING: CSRHub company's overall score; AGE: Average age of board members; WOM: % of female
board members; INDEP: % of independent board members; ME: Media exposure; SIZE: Company's size; INDU:
Industry sensitivity; OWN: Institutional ownership; LEV: Long-term debt / common equity; ROA: Return on
assets; LIQ: Quick ratio. See variables’ measures in the text.
Descriptive statistics are presented in Table 2. As it can be seen, sample companies’
average is a bit higher than a standard of 50, but the ratings are spread very much
around it. No significantly poor or excellent ratings were present in the sample.

54
Companies are also very homogenous when comparing average age of board mem-
bers. Sample companies all support gender diversity at least moderately and mostly
excel in independence. There are big differences in media exposure and quite large in
size. The next two variables: industry sensitivity and institutional ownership are
dummy variables and identical due to same division of values. Financial variables:
profitability, leverage and liquidity all share quite extensive differences amongst
sample companies.
Table 3. Correlation coefficients among independent variables.
WOM INDEP ME SIZE INDU OWN LEV ROA LIQ
AGE 0.061 0.012 -0.010 0.062 0.258 0.164 0.140 0.014 -0.052
WOM
0.173 0.405* 0.260 0.350 0.101 0.482** -0.335 -0.456**
INDEP
0.008 0.199 0.394* -0.112 0.409* -0.037 -0.104
ME
0.562** 0.157 0.123 0.500** -0.454* -0.109
SIZE
0.175 0.281 0.156 0.085 0.067
INDU
0.048 0.420* -0.371* -0.149
OWN
0.035 0.105 0.084
LEV
-0.485** -0.404*
ROA
0.482**
Notes: AGE: Average age of board members; WOM: % of female board members; INDEP: % of independent
board members; ME: Media exposure; SIZE: Company's size; INDU: Industry sensitivity; OWN: Institutional
ownership; LEV: Long-term debt / common equity; ROA: Return on assets; LIQ: Quick ratio. See variables'
measures in the text. Significant at a 5 % levelSignificant at a 1 % level
Multicollinearity occurs in situations where two or more independent variables corre-
late with each other moderately or strongly. If this issue is unnoticed it leads to
wrong predictions. One way to avoid the problem is to select such variables that are
not in any case correlated. As this is usually not possible, the issue needs to be ad-
dressed before any predictions are made. Whether too much multicollinearity exists
between variables is testable with a help of variance inflation factor (VIF), which
qualifies how much variance is inflated. (Simon 2004.) The variables covered in the
thesis did not exceed the critical value of ten, so there are no multicollinearity related
problems.

55
Table 3 shows the correlation coefficient of the set of independent variables. The r-
values in the table indicate how strong the relationship between two variables is. The
bigger the correlation r is, the stronger the linkage between variables is. The other
important aspect is the significance level, which tells if there is any statistical signifi-
cance in the results regardless of the strength of the relationship. (Rodgers & Nice-
wander 1988.)
This significance is expressed in probability level p (for instance at p = 0.05 or p =
0.01). The level of significance explains how unlikely any given correlation coeffi-
cient, r, will have no relationship in the population. In other words it tells whether the
observations seem to follow a path rather than simple chance. The smaller the p-
level, the more significant the results are. (Rodgers & Nicewander 1988.) As the
freedom of degrees is 29 (n – 2), 1 % significance PPMC critical value for two-tailed
test to reject the null hypothesis is 0.456 and at 5 % significance critical value is
0.355 (PPMC 2013). In the case of 1 % significance, if the r-value is: –0.456 < r <
0.456, null hypothesis is not rejected and the results are not significant enough.
Likewise if at 5 % significance the r-value is between -0.355 and 0.355, the null hy-
pothesis is confirmed.
The output in Table 3 indicates that there are some significant results at both 5 % and
1 % levels. Significance at a level of 1 % seems to be found between % of female
board members and leverage (p = 0.482), media exposure and leverage (p = 0.500),
media exposure and company size (p = 0.562), return on assets and leverage (p = –
0.485), % of female board members and liquidity (p = –0.456) and finally between
return on assets and liquidity (p = 0.482). Significance at a level of 5 % is found be-
tween % of female board members and media exposure (p = 0.405), % of independ-
ent board members and industry sensitivity (p = 0.394), % of independent board
members and leverage (p = 0.409), industry sensitivity and leverage (p = 0.420), me-
dia exposure and return on assets (p = –0.454), industry sensitivity and return on in-
vestment (p = –0.371) and finally between leverage and liquidity (p = –0.404).
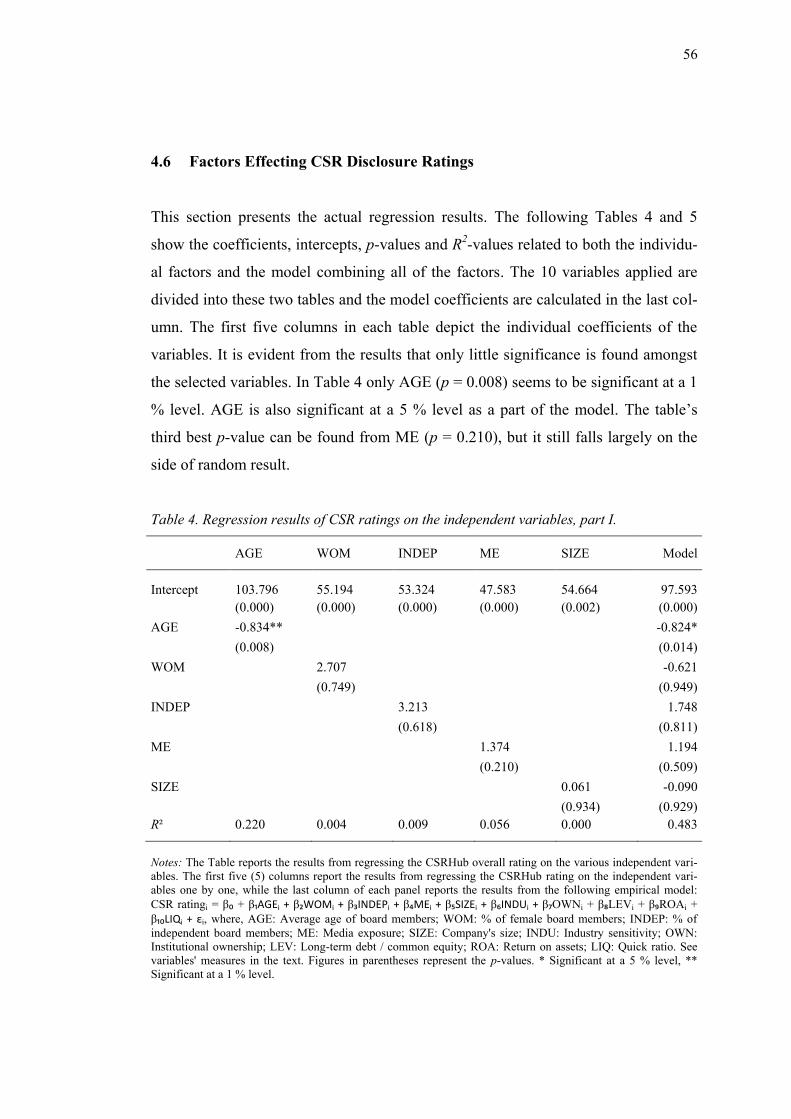
56
4.6 Factors Effecting CSR Disclosure Ratings
This section presents the actual regression results. The following Tables 4 and 5
show the coefficients, intercepts, p-values and R2-values related to both the individu-
al factors and the model combining all of the factors. The 10 variables applied are
divided into these two tables and the model coefficients are calculated in the last col-
umn. The first five columns in each table depict the individual coefficients of the
variables. It is evident from the results that only little significance is found amongst
the selected variables. In Table 4 only AGE (p = 0.008) seems to be significant at a 1
% level. AGE is also significant at a 5 % level as a part of the model. The table’s
third best p-value can be found from ME (p = 0.210), but it still falls largely on the
side of random result.
Table 4. Regression results of CSR ratings on the independent variables, part I.
AGE WOM INDEP ME SIZE Model
Intercept 103.796 55.194 53.324 47.583 54.664 97.593
(0.000) (0.000) (0.000) (0.000) (0.002) (0.000)
AGE -0.834**
-0.824*
(0.008)
(0.014)
WOM
2.707
-0.621
(0.749)
(0.949)
INDEP
3.213
1.748
(0.618)
(0.811)
ME
1.374
1.194
(0.210)
(0.509)
SIZE
0.061 -0.090
(0.934) (0.929)
R²
0.220
0.004
0.009
0.056
0.000
0.483
Notes: The Table reports the results from regressing the CSRHub overall rating on the various independent vari-
ables. The first five (5) columns report the results from regressing the CSRHub rating on the independent vari-
ables one by one, while the last column of each panel reports the results from the following empirical model:
CSR ratingi = β₀ + β₁AGEi + β₂WOMi + β₃INDEPi + β₄MEi + β₅SIZEi + β₆INDUi + β₇OWNi + β₈LEVi + β₉ROAi +
β₁₀LIQi + εi, where, AGE: Average age of board members; WOM: % of female board members; INDEP: % of
independent board members; ME: Media exposure; SIZE: Company's size; INDU: Industry sensitivity; OWN:
Institutional ownership; LEV: Long-term debt / common equity; ROA: Return on assets; LIQ: Quick ratio. See
variables' measures in the text. Figures in parentheses represent the p-values. * Significant at a 5 % level, **
Significant at a 1 % level.

57
Table 4 also contains information about the R2-values. Interestingly the AGE (R
2 =
0.220) again shows good results as it fits the curve quite well. The value is not per-
fect but as the relationship is not straightforward, it can be considered good. Continu-
ing to Table 5, it can be said that there is no significance at a 1 % level found
amongst the variables. The best result is at a 5 % significance level and it can be
found from the ROA (p = 0.050). The significance is lost in the model. The second
best result can be found from OWN (p = 0.115) but the significance is still not very
good due to the fact that is gives so much room for random chance. All R2-values are
quite low but ROA (R2 = 0.126) can be considered moderate in comparison.
Table 5. Regression results of CSR ratings on the independent variables, part II.
INDU OWN LEV ROA LIQ Model
Intercept 55.158 57.158 55.437 57.147 55.727 97.593
(0.000) (0.000) (0.000) (0.000) (0.000) (0.000)
INDU 2.092
2.890
(0.289)
(0.224)
OWN
-3.075
-2.276
(0.115)
(0.236)
LEV
1.216
-3.728
(0.758)
(0.496)
ROA
-25.698*
-21.210
(0.050)
(0.273)
LIQ
0.205 1.159
(0.884) (0.485)
R²
0.039
0.084
0.003
0.126
0.001
0.483
Notes: The Table reports the results from regressing the CSRHub overall rating on the various independent vari-
ables. The first five (5) columns report the results from regressing the CSRHub rating on the independent vari-
ables one by one, while the last column of each panel reports the results from the following empirical model:
CSR ratingi = β₀ + β₁AGEi + β₂WOMi + β₃INDEPi + β₄MEi + β₅SIZEi + β₆INDUi + β₇OWNi + β₈LEVi + β₉ROAi +
β₁₀LIQi + εi, where, AGE: Average age of board members; WOM: % of female board members; INDEP: % of
independent board members; ME: Media exposure; SIZE: Company's size; INDU: Industry sensitivity; OWN:
Institutional ownership; LEV: Long-term debt / common equity; ROA: Return on assets; LIQ: Quick ratio. See
variables' measures in the text. Figures in parentheses represent the p-values. * Significant at a 5 % level, **
Significant at a 1 % level.
The R2-value of the model can be found from both tables and it is 0.484, which is
quite high. This is a somewhat strange result as the individual significance’s are so
low. This particular result is inconclusive and some type of measurement error can

58
be argued to have occurred. The regression calculations were done again resulting no
chance. The previously discussed results are in some parts following the hypotheses,
but mostly they are not. AGE and ROA were successful in that way. There are many
reasons why it is so. It can be argued that even though the age differences are not
very huge, the older board generations are more reluctant to begin CSR actions than
the younger ones. It might also be that more conservative companies appoint older
board members. This claim involves an assumption that conservative attitudes do not
involve pro-environmentalism. It should also be questioned why ROA seems to go
down when RATING goes up. It could be that companies with high ROA do not
share the same kind of incentives to disclose as companies with low ROA, as they
need to woo the market to gain more sales.
Figure 9 illustrates scatter plot diagrams of the two significant independent variables
AGE and ROA, the first one measuring average age of board members and the se-
cond profitability of a company. Each of the 31 observations is plotted on the xy-
plane and paired with the dependent variable RATING. The illustration gives a
chance to interpret the results using different medium. If we first take a look at the
AGE variable, we are able to visually confirm the previous results shown in the Ta-
ble 1 that the average ages span from approximately 52 to 64. Correlation confirmed
in Table 4 is also evident as there seems to be moderate negative linkage between the
two variables. As the AGE grows higher the RATING goes down. We are also able
to confirm that there is some heteroscedasticity present in the sample, which means
that variance is not constant. Nevertheless the result seems to be good quality.
The ROA variable is not as significant, but it also represents some correlation. Com-
pared to AGE it has much more heteroscedasticity and the downward negative rela-
tionship is not as clear as in AGE. The regression line also seems so be guided by the
extreme observation, which is somewhat disconnected from the other group of other
observations. Without this observation the scatter would be much more sphere-like,
which would further affect the regression line’s direction. This would translate into
lower correlation.
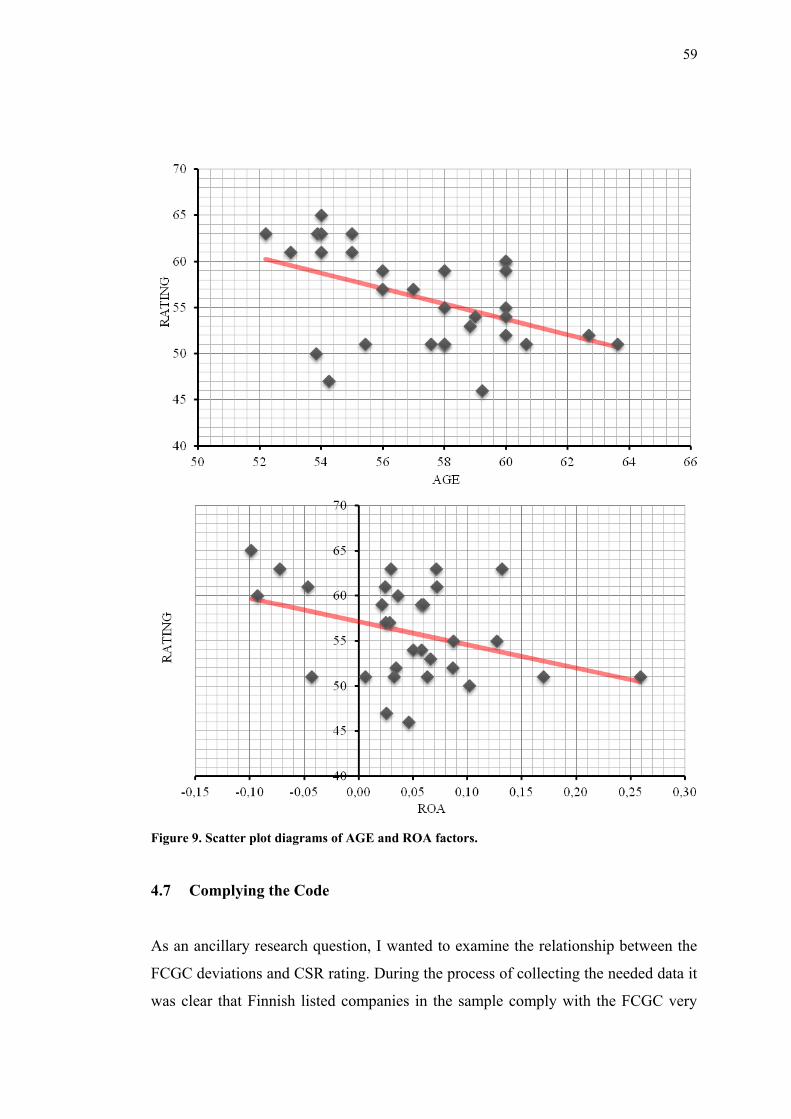
59
Figure 9. Scatter plot diagrams of AGE and ROA factors.
4.7 Complying the Code
As an ancillary research question, I wanted to examine the relationship between the
FCGC deviations and CSR rating. During the process of collecting the needed data it
was clear that Finnish listed companies in the sample comply with the FCGC very
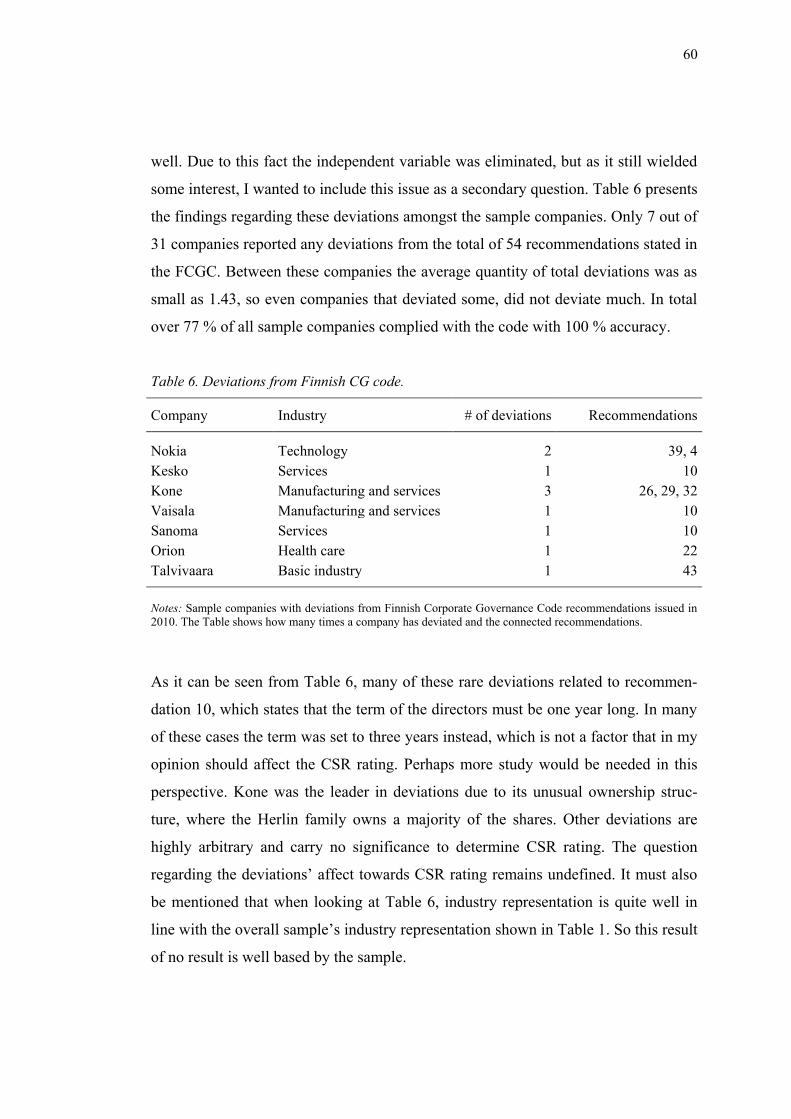
60
well. Due to this fact the independent variable was eliminated, but as it still wielded
some interest, I wanted to include this issue as a secondary question. Table 6 presents
the findings regarding these deviations amongst the sample companies. Only 7 out of
31 companies reported any deviations from the total of 54 recommendations stated in
the FCGC. Between these companies the average quantity of total deviations was as
small as 1.43, so even companies that deviated some, did not deviate much. In total
over 77 % of all sample companies complied with the code with 100 % accuracy.
Table 6. Deviations from Finnish CG code.
Company Industry # of deviations Recommendations
Nokia Technology 2 39, 4
Kesko Services 1 10
Kone Manufacturing and services 3 26, 29, 32
Vaisala Manufacturing and services 1 10
Sanoma Services 1 10
Orion Health care 1 22
Talvivaara Basic industry 1 43
Notes: Sample companies with deviations from Finnish Corporate Governance Code recommendations issued in
2010. The Table shows how many times a company has deviated and the connected recommendations.
As it can be seen from Table 6, many of these rare deviations related to recommen-
dation 10, which states that the term of the directors must be one year long. In many
of these cases the term was set to three years instead, which is not a factor that in my
opinion should affect the CSR rating. Perhaps more study would be needed in this
perspective. Kone was the leader in deviations due to its unusual ownership struc-
ture, where the Herlin family owns a majority of the shares. Other deviations are
highly arbitrary and carry no significance to determine CSR rating. The question
regarding the deviations’ affect towards CSR rating remains undefined. It must also
be mentioned that when looking at Table 6, industry representation is quite well in
line with the overall sample’s industry representation shown in Table 1. So this result
of no result is well based by the sample.

61
4.8 Limitations and Further Study
Thesis follows a quantitative research method and so it is subject to certain limita-
tions on how the results are generalizable. Simple numeric dataset may give a super-
ficial impression of complex phenomenon. To gain a better understanding of the sub-
ject some detailed narratives of human perception should be added to back numeric
data. One must also look at the dataset used in the study. As some of the data is pro-
vided by outside sources such as CSRHub and Thomson ONE Banker, validity of
this kind of data cannot be completely ensured.
The geographical constrains are also a factor in determining the generalizability of
the results. The Finnish results may only be applicable to Scandinavia due to cultural
similarities. It can be argued that only one overall score as a dependent variable is
enough to illustrate the quality of CSR disclosure. The size of the sample is also a
concern. Although a sample of 31 companies is statistically good, it is not excellent.
This concern is partially alleviated by perceived homogeneity of many aspects relat-
ed to Finnish listed companies. The companies are highly similar for instance when it
comes to board characteristics. Use of companies only utilizing GRI standards is not
a limitation, as practically the whole population is doing so, although constraining
the sample to listed companies is creating a limitation. This decision was made to
ensure easy access to a vast set of quality raw data. The perceived homogeneity of
the sample might be due to this decision though, since this group of companies is
subject to more rigorous public scrutiny.
To further delve into the issue, I suggest that cultural aspects are taken into account.
Comparison between Finnish results and other culturally different countries would
also be highly interesting. Perhaps some comparison would be fruitful to conduct
even between companies with perceivably similar cultural background to determine
if these cultural aspects play a significant role. Assuming that the results demonstrat-
ed in this thesis are not plagued by any significant errors, it would be interesting to

62
know why most of the factors pointed out by prior studies seem to be irrelevant in
Finland’s case.
Most mentioned limitations are applicable to the secondary question. To further
study the relationship of recommendation deviations and ratings, the sample should
be much larger. Perhaps including more Scandinavian countries would broaden the
view. The similarities in Scandinavian Corporate Governance practices are high,
which makes this comparison plausible.

63
5 CONCLUSIONS
It seems that the green movement will get larger in coming decades due to growth in
environmental awareness. Many endogenous and exogenous forces are encouraging
companies to be more transparent in their actions involving social and environmental
aspects. As disclosing becomes more common, standards are being formed to give
guidelines. Standardized reporting means that the results are more comparable. Or-
ganizations such as CSRHub and GRI have made it possible to use these standard-
ized rating results to identify factors affecting them. The purpose of this thesis was to
uncover some of these factors in the Finnish corporate environment. It also endeav-
ored to examine if Corporate Governance issues play a role in this setting.
The research was conducted by gathering significant factors from previous studies
and then examining their significance in a Finnish setting. A linear regression model
was then composed and the variables were tested. The findings concluded that most
of the factors did not show any significance, however two of them did. Average age
of board members was significant at a 1 % level and the coefficient was good. If the
average age of board members increased by one, the overall rating decreased almost
by one (-0.834). Profitability in the form of ROA also showed some significance at a
5 % level, although the scatter plot analysis demonstrated some inconclusive aspects.
In a way, many prior studies were challenged when testing results in a new setting
and although many selected variables did not show significance, this result carries
some significance on its own. It can be asked if there would be better factors to ex-
plain the ratings, and if so, what would they be. Personally I would like to give credit
to Finnish and Scandinavian culture in general. Perhaps individual company related
characteristics are not the way to approach the ratings. Answers to them should be
looked for from vast cultural atmosphere and country related characteristics. To an-
swer what would be the exact contribution of this thesis, I would say that in Finnish
listed companies’ cases, the rating is not determined by single company details, but
something more profound. The cultural environment has also driven Corporate Gov-

64
ernance practices to such a place, that differences in company practices are practical-
ly indistinctive. This does not give any space for examining the relationship between
these variances and the variances in CSR disclosure ratings. In other words, Finnish
regulations have such high standards in CG issues that no heterogeneity amongst
companies is left.
To conclude this thesis I would like to say that CSR has an important place in the
modern corporate world. It is an indispensable force in guiding corporations to a
more ethical and humane direction without destruction of its value. Whether the mo-
tivation to promote transparency is nowadays mainly an outcome of outside encour-
agement, the push is needed to ensure a better tomorrow for us, mankind.

65
REFERENCES
Abd-Elsalam OH & Weetman P (2003) Introducing international accounting stan-
dards to an emerging capital market: relative familiarity and language effect in
Egypt. Journal of International Accounting, Auditing and Taxation 12(1): 63-
84.
Adams CA, Hill W & Roberts CB (1998) Corporate social reporting practices in
Western Europe: legitimating corporate behaviour? The British Accounting
Review 30(1): 1-21.
Aly D, Simon J & Hussainey K (2010) Determinants of corporate internet reporting:
evidence from Egypt. Managerial Auditing Journal 25(2): 182-202.
Asongu J (2007) The History of Corporate Social Responsibility. Journal of Business
and Public Policy 1.
Babcock P (2012) The Crossroads of Gender and Corporate Social Responsibility.
URI: http://www.shrm.org/hrdisciplines/ethics/articles/pages/gendercsr.aspx.
Cited 24/3/2013.
Baker M (2004) Corporate Social Responsibility: What does it mean?
http://www.mallenbaker.net/csr/definition.php.
Bamberg S & Möser G (2007) Twenty years after Hines, Hungerford, and Tomera: A
new meta-analysis of psycho-social determinants of pro-environmental behav-
iour. J Environ Psychol 27(1): 14-25.
Bansal P & Clelland I (2004) TALKING TRASH: LEGITIMACY, IMPRESSION
MANAGEMENT, AND UNSYSTEMATIC RISK IN THE CONTEXT OF
THE NATURAL ENVIRONMENT. Academy of Management Journal 47(1):
93-103.
Bansal P & Roth K (2000) Why companies go green: a model of ecological respon-
siveness. Academy of management Journal : 717-736.
Belkaoui A & Karpik PG (1989) Determinants of the corporate decision to disclose
social information. Accounting, Auditing & Accountability Journal 2(1).
Bowen FE (2000) Environmental visibility: a trigger of green organizational re-
sponse? Business Strategy and the Environment 9(2): 92-107.
Bowen HR (1953) Social responsibilities of the businessman. , Harper.

66
Brammer S & Pavelin S (2008) Factors influencing the quality of corporate envi-
ronmental disclosure. Business Strategy and the Environment 17(2): 120-136.
Carroll AB (1999) Corporate social responsibility evolution of a definitional con-
struct. Bus Soc 38(3): 268-295.
Chandler D & Werther Jr WB (2010) Strategic corporate social responsibility:
Stakeholders in a global environment. , Sage Publications, Incorporated.
Chih H, Chih H & Chen T (2010) On the determinants of corporate social responsi-
bility: International evidence on the financial industry. J Bus Ethics 93(1):
115-135.
Clarke J & Gibson‐Sweet M (1999) The use of corporate social disclosures in the
management of reputation and legitimacy: a cross sectoral analysis of UK Top
100 Companies. Business Ethics: A European Review 8(1): 5-13.
Coffey BS & Fryxell GE (1991) Institutional ownership of stock and dimensions of
corporate social performance: An empirical examination. J Bus Ethics 10(6):
437-444.
Committee for Economic Development (1971) Social responsibilities of Business
Corporations. New York: Author.
Cowen SS, Ferreri LB & Parker LD (1987) The impact of corporate characteristics
on social responsibility disclosure: a typology and frequency-based analysis.
Accounting, Organizations and Society 12(2): 111-122.
Cox P, Brammer S & Millington A (2004) An empirical examination of institutional
investor preferences for corporate social performance. J Bus Ethics 52(1): 27-
43.
CSRHub CSRHub webpage. URI: www.csrhub.com. Cited 25/3/2013.
Cullen L & Christopher T (2002) Governance Disclosures and Firm Characteristics
of Listed Australian Mining cCompanies.
Davis K (1960) Can business afford to ignore social responsibilities? Calif Manage
Rev 2(3): 70-76.
EFPIA (2013) The pharmaceutical industry and corporate responsibility. URI:
http://www.efpia-annualreview.eu/index.php?page=the-pharmaceutical-
industry-and-corporate-responsibility-more-than-a-nice-to-have. Cited
07/03/2013.

67
Ellis JA, Fee CE & Thomas SE (2012) Proprietary Costs and the Disclosure of In-
formation About Customers. Journal of Accounting Research .
Ezat A & El-Masry A (2008) The impact of corporate governance on the timeliness
of corporate internet reporting by Egyptian listed companies. Managerial Fi-
nance 34(12): 848-867.
Fauzi H, Mahoney L & Abdul Rahman A (2007) Institutional Ownership and Corpo-
rate Social Performance: Empirical Evidence from Indonesian Companies. Is-
sues in Social and Environmental Accounting 1(2): 334-347.
Frederick W (1960) The growing concern over business responsibility. California
Management Review(2): 54-61.
Freeman R (2009) Stakeholder Theory: 25 Years Later. 8: 97-107.
Friedman M (1970) The Social Responsibility of Business is to Increase Its Profits.
The New York Times Magazine. September 13, 1970.
Gibson C (2004) IT-enabled business change: An approach to understanding and
managing risk. MIT Sloan Working Paper No.4520-04; CISR Working Paper
No.346 .
Gidwani B (2011) CSRHUB Scores: How Accurate Are Our Ratings? URI:
http://www.csrhub.com/blog/2011/09/csrhub-scores-how-accurate-are-our-
ratings.html. Cited 25/3/2013.
Graves SB & Waddock SA (1994a) INSTITUTIONAL OWNERS AND CORPO-
RATE SOCIAL PERFORMANCE. Academy of Management Journal 37(4):
1034-1046.
Graves SB & Waddock SA (1994b) INSTITUTIONAL OWNERS AND CORPO-
RATE SOCIAL PERFORMANCE. Academy of Management Journal 37(4):
1034-1046.
Gray R, Kouhy R & Lavers S (1995) Corporate social and environmental reporting: a
review of the literature and a longitudinal study of UK disclosure. Accounting,
Auditing & Accountability Journal 8(2): 47-77.
GRI (2013) Global Reporting Initiative Homepage. URI:
https://www.globalreporting.org. Cited 1/3/2013.
Grosser K & Moon J (2005) Gender mainstreaming and corporate social responsibil-
ity: Reporting workplace issues. J Bus Ethics 62(4): 327-340.
68
Grünberg J & Hägg I (2007) Nordic corporate governance codes-similarities and
differences. , Nordic Academy of Management Conference, Bergen.
Guidry RP & Patten DM (2012) Voluntary disclosure theory and financial control
variables: An assessment of recent environmental disclosure research. Ac-
counting Forum. , Elsevier.
Hackston D & Milne MJ (1996a) Some determinants of social and environmental
disclosures in New Zealand companies. Accounting, Auditing & Accountabil-
ity Journal 9(1): 77-108.
Hackston D & Milne MJ (1996b) Some determinants of social and environmental
disclosures in New Zealand companies. Accounting, Auditing & Accountabil-
ity Journal 9(1): 77-108.
Hines JM, Hungerford HR & Tomera AN (1986/87) Analysis and synthesis of re-
search on responsible environmental behaviour: A meta-analysis. Journal of
Environmental Education(18, 1–8).
Hoffman AJ (1999) Institutional evolution and change: Environmentalism and the
US chemical industry. Academy of Management Journal : 351-371.
Honnold JA (1984) Age and Environmental Concern some specification of effects.
The Journal of Environmental Education 16(1): 4-9.
House RJ (1996) Path-goal theory of leadership: Lessons, legacy, and a reformulated
theory. The Leadership Quarterly 7(3): 323-352.
Ibrahim NA & Angelidis JP (1995) The corporate social responsiveness orientation
of board members: Are there differences between inside and outside directors?
J Bus Ethics 14(5): 405-410.
Inchausti AG (1997) The influence of company characteristics and accounting regu-
lation on information disclosed by Spanish firms. European Accounting Re-
view 6(1): 45-68.
Ismail K & Chandler R (2005) Disclosure in the quarterly reports of Malaysian com-
panies. Financial Reporting, Regulation & Governance 4(1): 1-25.
Jamali D, Safieddine AM & Rabbath M (2008) Corporate governance and corporate
social responsibility synergies and interrelationships. Corporate Governance:
An International Review 16(5): 443-459.
Jenkins H & Yakovleva N (2006) Corporate social responsibility in the mining in-
dustry: Exploring trends in social and environmental disclosure. J Clean Prod
14(3): 271-284.
69
Jensen MC & Meckling WH (1976) Theory of the firm: Managerial behavior, agency
costs and ownership structure. J Financ Econ 3(4): 305-360.
Johnson H (1971) Business in contemporary science: Framework and issues. Bel-
mont. CA: Wadsworth.
Knudsen J, Ege M & Geisler K (2012) Corporate Social Responsibility in the Board
Room–When do Directors Pay Attention? Available at SSRN 2154590.
Kotter J (2007) Leading Change: why Transformati0n Efforts Fail. Harv Bus Rev:
92-107.
Line M, Hawley H & Krut R (2002) The development of global environmental and
social reporting. Corp Environ Strategy 9(1): 69-78.
Maslow A & Herzeberg A (1954) Hierarchy of needs. AH Maslow.ea., Motivation
and Persona/ity.Harper, New York.
McGuire J (1963) Business and Society. New York: McGraw-Hill.
Merlo A (2005) Whither political economy? theories, facts and issues.
Mitchell R, Agle B & Wood D (1997) Toward a Theory of Stakeholder Identification
and Salience: Defining the Principle of Who and What Really Counts
. 4(Academy of Management Review 22): 853-886.
Mitnick B (1973) Fiduciary rationality and public policy: The theory of agency and
some consequences. Available at SSRN 1020859 .
Moura-Leite RC & Padgett RC (2011) Historical background of corporate social
responsibility. Social Responsibility Journal 7(4): 528-539.
Nasrullah NM (2010) Relation between CSR and Corporate Governance.
Ness KE & Mirza A (1991) Corporate social disclosure: A note on a test of agency
theory. The British Accounting Review 23(3): 211-217.
Ng EJ & Koh HC (1994) An agency theory and probit analytic approach to corporate
non-mandatory disclosure compliance. Asia-Pacific Journal of Accounting
1(1): 29-44.
OMX Nasdaq OMX Nordic. URI: http://www.nasdaqomxnordic.com/osakkeet/.
Cited 17/03/2013.

70
Oskamp S, Harrington MJ, Edwards TC, Sherwood DL, Okuda SM & Swanson DC
(1991) Factors influencing household recycling behavior. Environ Behav
23(4): 494-519.
Patten DM (2002) Media exposure, public policy pressure, and environmental dis-
closure: an examination of the impact of tri data availability. Accounting Fo-
rum. , Wiley Online Library 26: 152-171.
Pedersen D (2013) Top Nine Drivers For Corporate Sustainability, Despite Washing-
ton. URI: http://www.triplepundit.com/2010/08/top-nine-drivers-for-
corporate-sustainability-despite-washington/. Cited 25/3/2013.
PPMC (2013) Pearson Product-Moment Correlation Coefficient Table of Critical
Values. URI: http://www.statisticshowto.com/tables/ppmc-critical-values/.
Cited 15/03/13.
Purushothaman M, Tower R, Hancock R & Taplin (2000) Determinants of Corporate
Social Reporting Practices of Listed Singapore Companies. (Pacific Account-
ing Review 12(2), 101–133.)
Rahman A & Widyasari KN (2009) The Analysis of Company Characteristic Influ-
ence Toward CSR Disclosure: Empirical Evidence of Manufacturing Compa-
nies Listed In JSX. Jurnal Akuntansi & Auditing Indonesia 12(1).
Reverte C (2009) Determinants of corporate social responsibility disclosure ratings
by Spanish listed firms. J Bus Ethics 88(2): 351-366.
Rodgers JL & Nicewander WA (1988) Thirteen ways to look at the correlation coef-
ficient. The American Statistician 42(1): 59-66.
Ross SA (1973) The economic theory of agency: The principal's problem. Am Econ
Rev 63(2): 134-139.
Saleh M, Zulkifli N & Muhamad R (2010) Corporate social responsibility disclosure
and its relation on institutional ownership: Evidence from public listed com-
panies in Malaysia. Managerial Auditing Journal 25(6): 591-613.
Samaha K & Dahawy K (2011) An empirical analysis of corporate governance struc-
tures and voluntary corporate disclosure in volatile capital markets: the Egyp-
tian experience. International Journal of Accounting, Auditing and Perform-
ance Evaluation 7(1): 61-93.
Schmitz CL, Matyók T, Sloan LM & James C (2012) The relationship between so-
cial work and environmental sustainability: Implications for interdisciplinary
practice. International Journal of Social Welfare .

71
Scott WR (2004) Institutional theory
. (Encyclopedia of Social Theory, George Ritzer, ed. Thousand Oaks, CA:
Sage.): 408-414.
Securities Market Association (2010) Finnish Corporate Governance Code.
Simon FL (1992) Marketing green products in the triad. Columbia J World Bus 27:
268-268.
Simon L Detecting multicollinearity using variance inflation factors. URI:
http://online.stat.psu.edu/online/development/stat501/12multicollinearity/05m
ultico_vif.html. Cited 17/03/2013.
SMA (2013) Securities Market Association Webpage. URI: http://cgfinland.fi. Cited
07/03/2012.
Soares R, Marquis C & Lee M (2011a) Gender and Corporate Social Responsibility:
It’s a Matter of Sustainability. (Harvard Business Review).
Soares R, Marquis C & Lee M (2011b) Gender and Corporate Social Responsibility:
It’s a Matter of Sustainability. (Harvard Business Review).
Spence M (1973) Job market signaling. The quarterly journal of Economics 87(3):
355-374.
The Economist (2008) Doing good. Business and the Sustainability Challenge. (The
Economist, January.).
Tilling MV (2004) Some thoughts on legitimacy theory in social and environmental
accounting. Social and Environmental Accountability Journal 24(2): 3-7.
Tuzzolino F & Armandi BR (1981) A need-hierarchy framework for assessing cor-
porate social responsibility. Academy of Management Review : 21-28.
Verrecchia RE (1983) Discretionary disclosure. J Account Econ 5: 179-194.
Visser W (2008) CSR Drivers: The Forces Shaping Corporate Sustainability and
Responsibility. (International Inspiration Series , No. 3).
Vlosky DA & Vlosky RP (1999) Exploring Age-Related Environmental Attitudes in
the Context of Wood Product Certification. Louisiana Forest Products Labora-
tory.Louisiana State University, Agricultural Center.Baton Rouge, Louisiana.
Wang J & Dewhirst HD (1992) Boards of directors and stakeholder orientation. J
Bus Ethics 11(2): 115-123.

72
Watts R & Zimmerman J (1986) Positive Accounting Theory. (Prentice-Hall,
Englewood Cliffs, NJ).
Webb E (2004) An examination of socially responsible firms' board structure. Jour-
nal of Management and Governance 8(3): 255-277.
Webb E (2005) Agency costs, leverage, and corporate social responsibility: A test of
causality. Financial Decisions 17(3).
Weiner B (2001) Intrapersonal and interpersonal theories of motivation from an at-
tribution perspective. Student Motivation : 17-30.
Wernerfelt B (2006) A resource‐based view of the firm. Strategic Manage J 5(2):
171-180.
YLE news (2011) Mehiläisen sisaryhtiötä syytetään kitsastelusta ja kehnosta
hoidosta. URI:
http://yle.fi/uutiset/mehilaisen_sisaryhtiota_syytetaan_kitsastelusta_ja_kehnos
ta_hoidosta/5451315. Cited 26/2/2013.
Zollo M, Minoja M, Casanova L, Hockerts K, Neergaard P, Schneider S & Tencati A
(2009) Towards an internal change management perspective of CSR: evidence
from project RESPONSE on the sources of cognitive alignment between man-
agers and their stakeholders, and their implications for social performance.
Corporate Governance 9(4): 355-372.