othree chemistry mm5 model diagnostic and sensitivity analysis results central california ozone...
TRANSCRIPT

OThree Chemistry
MM5 Model Diagnostic andMM5 Model Diagnostic andSensitivity Analysis ResultsSensitivity Analysis Results
Central California Ozone Study: Bi-Weekly Presentation 1
T. W. TescheDennis McNally
4 November 2003

OThree Chemistry ContentsContents
MM5 Performance Comparisons Between Run 1 (eta.mpp) Run 2 (eta.dry.mpp), Run 3 (eta.dry.rrtm.mpp)
Spatial Mean Temperature Time Series Plots Vector Mean Surface Wind Speed Time Series Plots Statistical Tables for Surface Mixing Ratio, 2 m Temps, and
Wind Speeds
HY-SPLIT 48-hr Back Trajectories from Peak Ozone Monitors on 17-20 Sept ’00
Current MM5 Diagnostic Questions

OThree Chemistry
Peak 1-hr Ozone Measurements for 16-21 Sept ‘00Peak 1-hr Ozone Measurements for 16-21 Sept ‘00
Daily Maximum Observed 1- hr Ozone
0
25
50
75
100
125
150
175
200
09/1
7/20
03
09/1
8/20
03
09/1
9/20
03
09/2
0/20
03
09/2
1/20
03
Max
O
zone
, pp
b
Date Day Station Peak O3 Hour Lat Long Gridx Gridy 02 DV17-Sep 261 Edison 125 1500 35.350 -118.863 131.7 29.4 14118-Sep 262 Parlier 165 1500 36.600 -119.508 116.7 63.2 15119-Sep 263 Arvin 145 1500 35.208 -118.784 133.2 25.7 14220-Sep 264 Clovis 135 1500 36.819 -119.716 13721-Sep 265
Table 1. Location of Maximum 1- hr Ozone for the 16- 21 Sept '00 Episode.

OThree Chemistry
Back Trajectory Plot on 17 Sept ‘00Back Trajectory Plot on 17 Sept ‘00
48-hr Back Trajectory from Edison Monitor where peak of 125 ppb ozone was measured at 1500 PST (2300 UTC)

OThree Chemistry
Back Trajectory Plot on 18 Sept ‘00Back Trajectory Plot on 18 Sept ‘00
48-hr Back Trajectory from Parlier Monitor where peak of 165 ppb ozone was measured at 1500 PST (2300 UTC)

OThree Chemistry
Back Trajectory Plot on 19 Sept ‘00Back Trajectory Plot on 19 Sept ‘00
48-hr Back Trajectory from Arvin Monitor where peak of 145 ppb ozone was measured at 1500 PST (2300 UTC)
OThree Chemistry
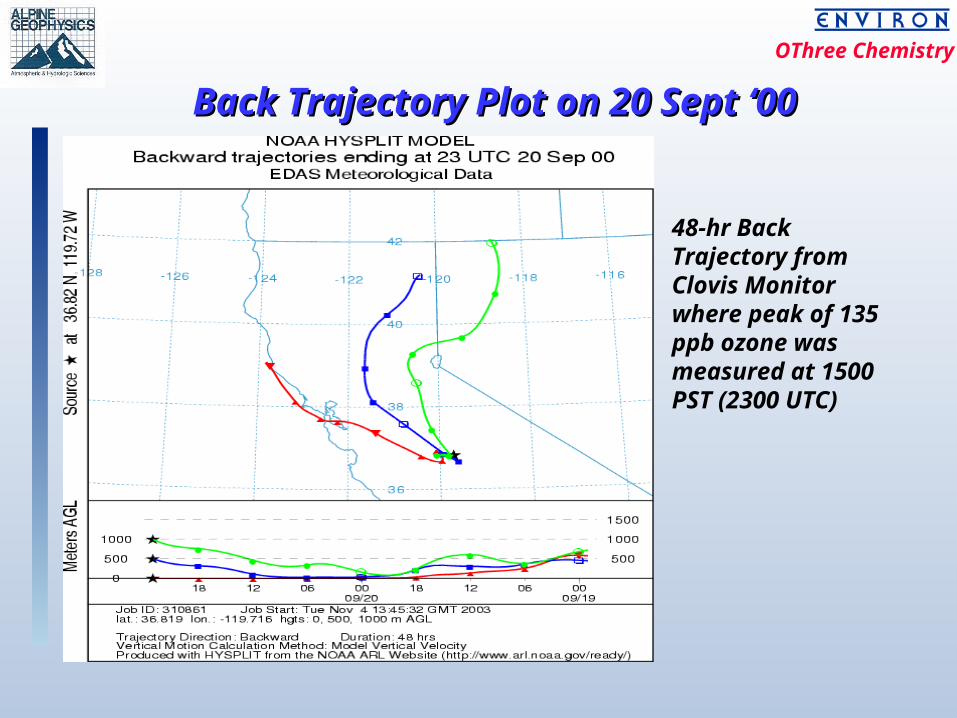
Back Trajectory Plot on 20 Sept ‘00Back Trajectory Plot on 20 Sept ‘00
48-hr Back Trajectory from Clovis Monitor where peak of 135 ppb ozone was measured at 1500 PST (2300 UTC)

OThree Chemistry
Spatial Mean 2m TempsSpatial Mean 2m Temps
MM5 Sensitivity Simulation: Eta.mpp

OThree Chemistry
Spatial Mean 2m TempsSpatial Mean 2m Temps
MM5 Sensitivity Simulation: Eta.dry.mpp
OThree Chemistry
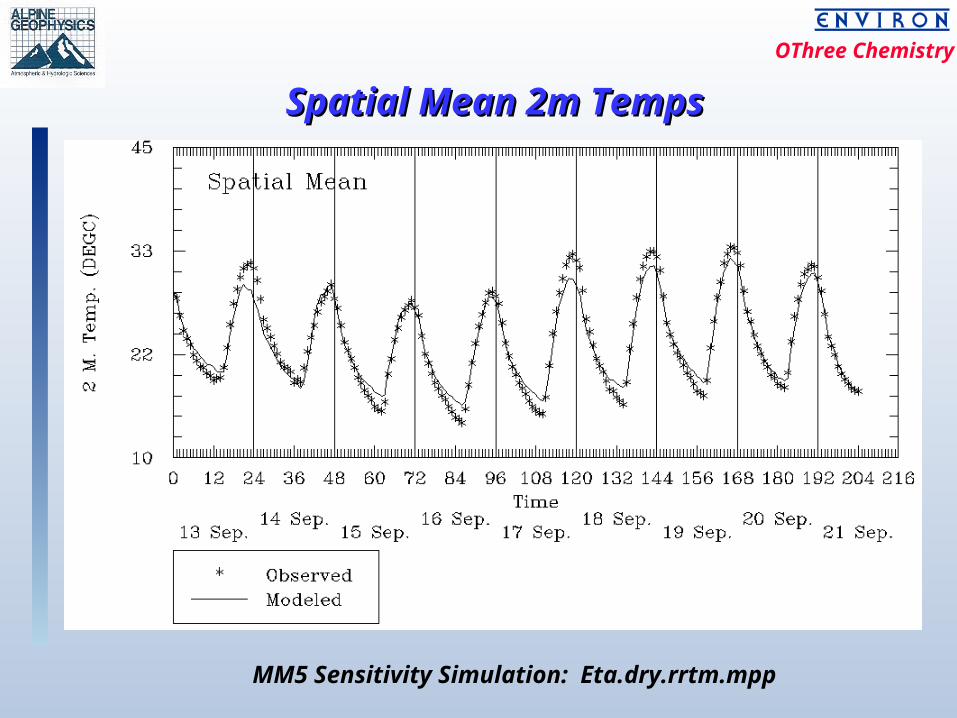
Spatial Mean 2m TempsSpatial Mean 2m Temps
MM5 Sensitivity Simulation: Eta.dry.rrtm.mpp

OThree Chemistry Predicted and Observed 2m Predicted and Observed 2m Temperatures Temperatures
MM5 Sensitivity Simulation: Eta.dry.rrtm.mpp

OThree Chemistry Predicted and Observed 2m Predicted and Observed 2m Temperatures Temperatures
MM5 Sensitivity Simulation: Eta.dry.rrtm.mpp

OThree Chemistry Predicted and Observed 2m Predicted and Observed 2m Temperatures Temperatures
MM5 Sensitivity Simulation: Eta.dry.rrtm.mpp

OThree Chemistry
Vector Mean Wind SpeedVector Mean Wind Speed
MM5 Sensitivity Simulation: Eta.mpp

OThree Chemistry
Vector Mean Wind SpeedVector Mean Wind Speed
MM5 Sensitivity Simulation: Eta.dry.mpp

OThree Chemistry
Vector Mean Wind SpeedVector Mean Wind Speed
MM5 Sensitivity Simulation: Eta.dry.rrtm.mpp

OThree Chemistry
MM5 Surface Winds on 17 Sept ‘00MM5 Surface Winds on 17 Sept ‘00
MM5 Sensitivity Simulation: Eta.dry.rrtm.mpp
Predicted and observed surface winds at 1500 PST on 18 Sept ’00 when a 1-hr peak ozone concentration of 165 ppb was measured at Parlier.

OThree Chemistry
MM5 Temperature Performance MM5 Temperature Performance Statistics for the 13-21 Sep ’00 Statistics for the 13-21 Sep ’00
EpisodeEpisode
Date Day ATS AS AT AU A-MEAN N. Bias Bias N. Error Error Var Max. O Max. P15-Sep 259 -12.49 -12.22 -8.98 -6.95 12.48 7.37 1.12 14.00 2.92 12.62 46.11 42.9016-Sep 260 -11.96 -10.06 -8.58 -6.75 10.92 9.52 1.27 16.18 3.10 13.28 45.00 41.9617-Sep 261 -15.08 -13.56 -11.95 -3.21 9.55 7.56 0.40 17.03 3.12 14.91 42.78 41.4118-Sep 262 -16.21 -15.00 -12.47 -4.22 10.37 7.00 0.30 16.95 3.19 15.85 42.22 40.4419-Sep 263 -17.12 -17.12 -8.13 -6.92 14.54 9.09 0.99 17.60 3.49 18.12 43.89 40.8520-Sep 264 -18.86 -17.12 -9.60 -7.38 14.18 9.25 1.39 18.24 3.81 19.72 43.89 40.6521-Sep 265 -22.99 -21.94 -19.77 -5.60 17.43 7.34 0.96 15.59 3.02 13.66 42.22 39.86Mean 999 -16.39 -15.29 -11.35 -5.86 12.78 8.16 0.92 16.51 3.24 15.45 43.73 41.15
12 Km Grid Domain
Table 1. Temperature MPE for the 15- 21 Sept '00 Episode (Run: eta.dry.mpp).
Date Day ATS AS AT AU A-MEAN N. Bias Bias N. Error Error Var Max. O Max. P13-Sep 257 -11.54 -11.08 -11.20 1.99 8.86 2.36 0.10 9.96 2.19 7.95 40.00 40.8014-Sep 258 -9.21 -7.94 -4.84 8.25 8.93 -0.19 -0.49 12.04 2.50 9.83 38.89 42.1015-Sep 259 -4.08 -4.08 -0.77 7.28 7.23 5.20 0.76 9.44 1.74 5.36 39.44 42.3116-Sep 260 -11.56 -10.92 -9.37 0.84 6.78 5.87 0.68 11.45 2.01 6.87 41.67 42.0217-Sep 261 -18.18 -14.93 -15.68 -1.61 8.41 6.09 0.01 15.03 2.42 9.32 42.22 41.5418-Sep 262 -7.09 -5.82 -6.85 2.45 8.18 2.86 -0.36 13.92 2.71 10.95 40.56 41.5619-Sep 263 -12.94 -12.94 -12.00 -1.16 10.49 4.92 0.17 13.46 2.64 11.17 41.67 41.1920-Sep 264 -13.12 -12.94 -12.12 -3.05 9.91 2.16 -0.18 12.72 2.76 11.58 41.67 40.4021-Sep 265 -13.29 -12.54 -12.24 -5.82 15.10 3.69 0.34 12.38 2.45 9.36 40.00 37.67Mean 999 -11.22 -10.35 -9.45 1.02 9.32 3.66 0.11 12.27 2.38 9.16 42.22 42.31
4 Km Grid Domain
Table 1. Temperature MPE for the 13- 21 Sept '00 Episode (Run: eta.dry.rrtm.mpp).

OThree Chemistry
MM5 Mixing Ratio Performance MM5 Mixing Ratio Performance Statistics for the 13-21 Sep ’00 Statistics for the 13-21 Sep ’00
EpisodeEpisode
Date Day ATS AS AT AU A-MEAN N. Bias Bias N. Error Error Var Max. O Max. P15-Sep 259 -26.69 -21.86 -15.17 -11.43 13.56 1.89 -0.27 18.66 1.51 4.02 17.42 15.4316-Sep 260 -56.33 -53.79 -43.64 -40.22 16.63 -0.73 -0.52 19.27 1.61 5.44 24.39 14.5817-Sep 261 -51.73 -47.14 -37.75 -31.32 19.31 0.54 -0.40 21.20 1.78 6.01 23.57 16.1918-Sep 262 -55.06 -48.91 -28.24 -5.86 19.17 -0.50 -0.70 22.89 2.00 8.10 19.96 18.7919-Sep 263 -49.31 -40.56 -27.81 -27.35 16.62 2.20 -0.31 20.04 1.68 5.67 20.06 14.5720-Sep 264 -49.07 -43.37 -28.93 -24.97 14.32 2.71 -0.13 18.10 1.66 5.62 20.00 15.0121-Sep 265 -36.52 -34.29 -24.31 -15.47 14.12 1.99 0.02 15.34 1.41 3.80 17.61 14.89Mean 999 -46.39 -41.42 -29.41 -22.37 16.25 1.16 -0.33 19.36 1.67 5.52 20.43 15.64
12 Km Grid Domain
Table 2. Mixing Ratio MPE for the 15- 21 Sept '00 Episode (Run: eta.dry.dpp).
Date Day ATS AS AT AU A-MEAN N. Bias Bias N. Error Error Var Max. O Max. P13-Sep 257 -27.94 -22.28 -21.33 1.16 14.81 12.48 0.47 23.33 1.52 3.49 13.11 13.2614-Sep 258 -40.35 -28.61 -24.42 -13.15 18.04 -1.21 -0.76 23.59 1.99 5.68 14.67 12.7415-Sep 259 -24.56 -22.55 -21.22 -10.69 10.69 2.57 -0.11 15.79 1.25 3.17 14.56 13.0016-Sep 260 -19.34 -14.80 -6.71 -2.54 9.48 8.17 0.31 17.25 1.13 2.51 13.10 12.7717-Sep 261 -29.26 -24.92 -17.81 1.94 13.97 8.74 0.47 18.10 1.30 2.51 13.52 13.7818-Sep 262 -18.50 -18.50 -15.91 -2.42 16.16 8.11 0.38 18.61 1.38 2.83 14.01 13.6719-Sep 263 -37.74 -35.99 -34.95 -5.14 12.26 5.34 0.15 16.63 1.23 2.54 14.56 13.8120-Sep 264 -29.35 -17.88 -21.04 -1.79 13.00 4.55 0.12 16.09 1.24 2.57 14.13 13.8821-Sep 265 -29.00 -22.56 -22.02 1.48 10.59 -1.83 -0.26 10.79 0.95 1.43 13.23 13.43Mean 999 -28.45 -23.12 -20.60 -3.46 13.22 5.21 0.09 17.80 1.33 2.97 14.67 13.88
4 Km Grid Domain
Table 2. Mixing Ratio MPE for the 13- 21 Sept '00 Episode (Run: eta.dry.rrtm.mpp)
OThree Chemistry
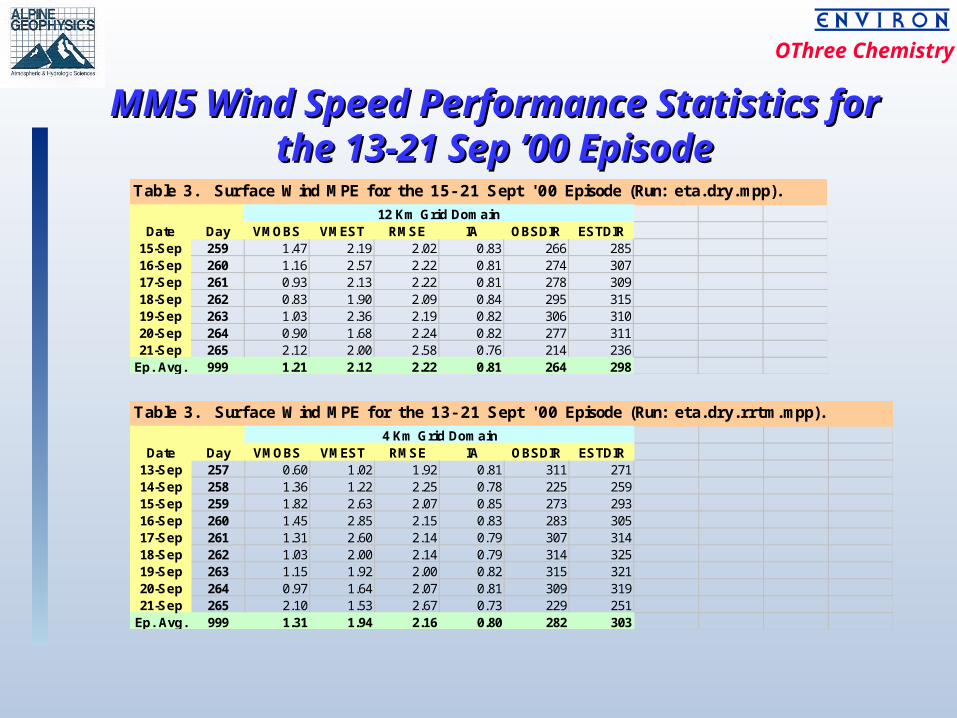
MM5 Wind Speed Performance MM5 Wind Speed Performance Statistics for the 13-21 Sep ’00 Statistics for the 13-21 Sep ’00
EpisodeEpisode
Date Day VMOBS VMEST RMSE IA OBSDIR ESTDIR13-Sep 257 0.60 1.02 1.92 0.81 311 27114-Sep 258 1.36 1.22 2.25 0.78 225 25915-Sep 259 1.82 2.63 2.07 0.85 273 29316-Sep 260 1.45 2.85 2.15 0.83 283 30517-Sep 261 1.31 2.60 2.14 0.79 307 31418-Sep 262 1.03 2.00 2.14 0.79 314 32519-Sep 263 1.15 1.92 2.00 0.82 315 32120-Sep 264 0.97 1.64 2.07 0.81 309 31921-Sep 265 2.10 1.53 2.67 0.73 229 251
Ep. Avg. 999 1.31 1.94 2.16 0.80 282 303
4 Km Grid Domain
Table 3. Surface Wind MPE for the 13- 21 Sept '00 Episode (Run: eta.dry.rrtm.mpp).
Date Day VMOBS VMEST RMSE IA OBSDIR ESTDIR15-Sep 259 1.47 2.19 2.02 0.83 266 28516-Sep 260 1.16 2.57 2.22 0.81 274 30717-Sep 261 0.93 2.13 2.22 0.81 278 30918-Sep 262 0.83 1.90 2.09 0.84 295 31519-Sep 263 1.03 2.36 2.19 0.82 306 31020-Sep 264 0.90 1.68 2.24 0.82 277 31121-Sep 265 2.12 2.00 2.58 0.76 214 236
Ep. Avg. 999 1.21 2.12 2.22 0.81 264 298
Table 3. Surface Wind MPE for the 15- 21 Sept '00 Episode (Run: eta.dry.mpp).12 Km Grid Domain
OThree Chemistry
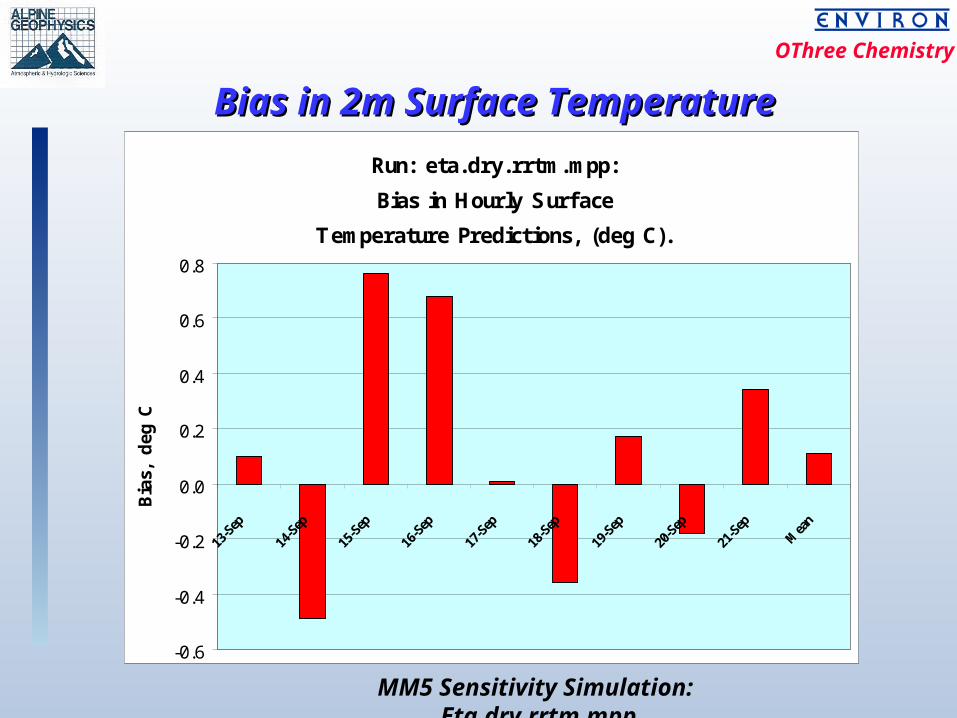
Bias in 2m Surface TemperatureBias in 2m Surface Temperature
MM5 Sensitivity Simulation: Eta.dry.rrtm.mpp
Run: eta.dry.rrtm.mpp:
Bias in Hourly Surface
Temperature Predictions, (deg C).
-0.6
-0.4
-0.2
0.0
0.2
0.4
0.6
0.8
13-S
ep
14-S
ep
15-S
ep
16-S
ep
17-S
ep
18-S
ep
19-S
ep
20-S
ep
21-S
ep
Mea
n
Bia
s, d
eg C

OThree Chemistry
Error in 2m Surface TemperaturesError in 2m Surface Temperatures
MM5 Sensitivity Simulation: Eta.dry.rrtm.mpp
Run: eta.dry.rrtm.mpp:
Gross Error in Hourly Surface
Temperature Predictions, (deg C).
0.0
1.0
2.0
3.0
13-S
ep
14-S
ep
15-S
ep
16-S
ep
17-S
ep
18-S
ep
19-S
ep
20-S
ep
21-S
epM
ean
Gro
ss E
rror
, de
g C

OThree Chemistry
Accuracy of Peak 2m TemperaturesAccuracy of Peak 2m Temperatures
MM5 Sensitivity Simulation: Eta.dry.rrtm.mpp
Run: eta.dry.rrtm.mpp:
Average Peak Temperature Prediction
Accuracy Over All Stations, (%).
0.0
5.0
10.0
15.0
20.0
13-S
ep
14-S
ep
15-S
ep
16-S
ep
17-S
ep
18-S
ep
19-S
ep
20-S
ep
21-S
ep
Mea
n
Ave
rage
Pea
k Pr
edic
tion
Acc
urac
y, %

OThree Chemistry
Bias in Surface Mixing RatioBias in Surface Mixing Ratio
MM5 Sensitivity Simulation: Eta.dry.rrtm.mpp
Run: eta.dry.rrtm.mpp:
Bias in Hourly Surface
Mixing Rato Predictions, (gm/Kg).
-0.8
-0.6
-0.4
-0.2
0.0
0.2
0.4
0.6
0.8
13-Sep
14-Sep
15-Sep
16-Sep
17-Sep
18-Sep
19-Sep
20-Sep
21-Sep
Mea
n
Bia
s, g
m/K
g

OThree Chemistry
Error in Surface Mixing RatioError in Surface Mixing Ratio
MM5 Sensitivity Simulation: Eta.dry.rrtm.mpp
Run: eta.dry.rrtm.mpp:
Gross Error in Hourly Surface
Mixing Ratio Predictions, (gm/Kg).
0.0
0.5
1.0
1.5
2.0
2.5
13-S
ep
14-S
ep
15-S
ep
16-S
ep
17-S
ep
18-S
ep
19-S
ep
20-S
ep
21-S
ep
Mea
n
Gro
ss E
rror
, gm
/Kg

OThree Chemistry
Mean Daily Observed and Predicted Mean Daily Observed and Predicted WindsWinds
MM5 Sensitivity Simulation: Eta.dry.rrtm.mpp
Run: eta.dry.rrtm.mpp:
Comparison Between Modeled and Observed
Daily Average Surface Winds, (m/s).
0.0
1.0
2.0
3.0
13-Sep
14-Sep
15-Sep
16-Sep
17-Sep
18-Sep
19-Sep
20-Sep
21-Sep
Ep. Avg
.
Dai
ly A
vera
ge W
ind
Spe
ed,
m/s
Vector Mean Observed Vector Mean Predicted

OThree Chemistry
Daily Average Wind Speed RMSE ErrorDaily Average Wind Speed RMSE Error
MM5 Sensitivity Simulation: Eta.dry.rrtm.mpp
Run: eta.dry.rrtm.mpp:
Daily Average Surface Wind Speed
Root Mean Square Error, (m/s)
0.0
0.5
1.0
1.5
2.0
2.5
3.0
13-S
ep
14-S
ep
15-S
ep
16-S
ep
17-S
ep
18-S
ep
19-S
ep
20-S
ep
21-S
ep
Ep. Avg
.
Roo
t M
ean
Squ
are
Err
or,
m/s

OThree Chemistry
Mean Daily Index of AgreementMean Daily Index of Agreement
MM5 Sensitivity Simulation: Eta.dry.rrtm.mpp
Run: eta.dry.rrtm.mpp:
Daily Average Surface Wind Speed
I ndex of Agreement
0.00
0.25
0.50
0.75
1.00
13-S
ep
14-S
ep
15-S
ep
16-S
ep
17-S
ep
18-S
ep
19-S
ep
20-S
ep
21-S
ep
Ep. Avg
.
Inde
x of
Agr
eem
net

OThree Chemistry
Observed and Predicted Wind Observed and Predicted Wind DirectionsDirections
MM5 Sensitivity Simulation: Eta.dry.rrtm.mpp
Run: eta.dry.rrtm.mpp:
Comparison Between Modeled and Observed Daily
Average Surface Wind Direction, (deg)
0
45
90
135
180
225
270
315
360
13-Sep
14-Sep
15-Sep
16-Sep
17-Sep
18-Sep
19-Sep
20-Sep
21-Sep
Ep. Avg
.
Dai
ly A
vera
ge W
ind D
irec
tion
, deg
Vector Mean Observed Vector Mean Predicted

OThree Chemistry
Ongoing Diagnostic AnalysesOngoing Diagnostic Analyses
What is MM5 model sensitivity to surface roughness?
What is MM5 model sensitivity to soil moisture parameters?