orientation and distribution of highly elongated and inertial fibres in turbulent flow: a comparison...
TRANSCRIPT

Orientation and distribution of highly elongated and inertial fibres in turbulent flow: a comparison of
experimental and numerical data
Stella Dearing, Cristian Marchioli, Alfredo Soldati
Dipartimento di Energetica e Macchine, Università di Udine, Italy
1
12th Workshop on two phase flow predictions, Halle-Wittenberg, Germany, 22-25 March 2010.
• Motivating factors for work
• “State of art” – DNS*
• Objectives
• Methodology
• Number density & mean orientations
• Summary
Motivation
Methodology
Results
Summary
Contents
DNS
Objectives
2
*Marchioli C., Fantoni M. & Soldati A., Orientation, distribution, and deposition of elongated, inertial fibres in turbulent channel flow, Phys. Fluids , 22,(2010).
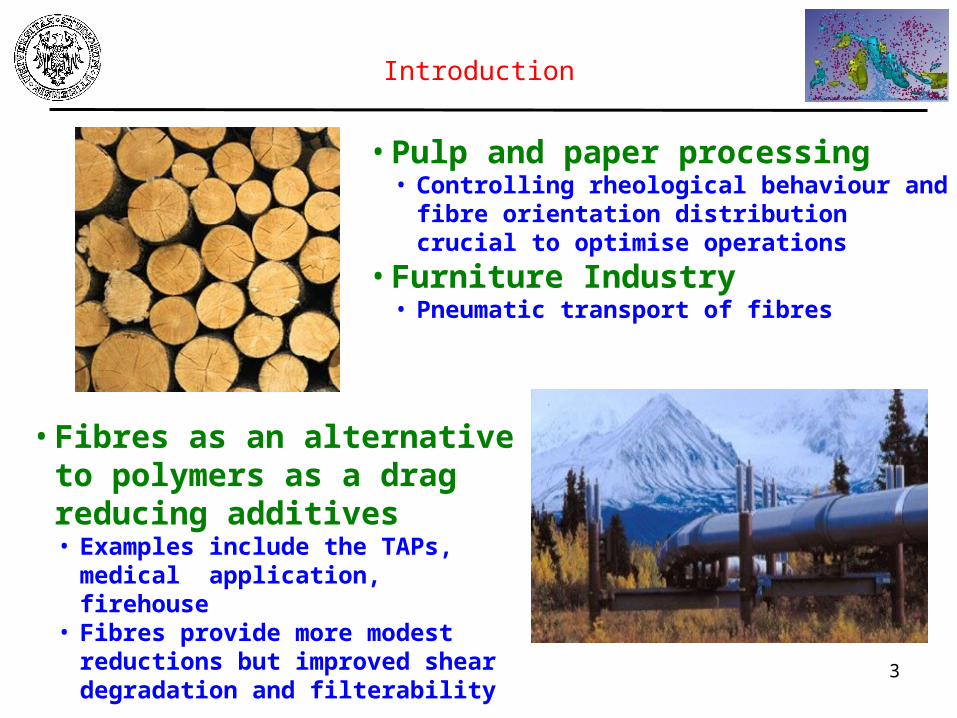
• Fibres as an alternative to polymers as a drag reducing additives • Examples include the TAPs,
medical application, firehouse• Fibres provide more modest
reductions but improved shear degradation and filterability
Introduction
• Pulp and paper processing• Controlling rheological behaviour and
fibre orientation distribution crucial to optimise operations
• Furniture Industry• Pneumatic transport of fibres
3
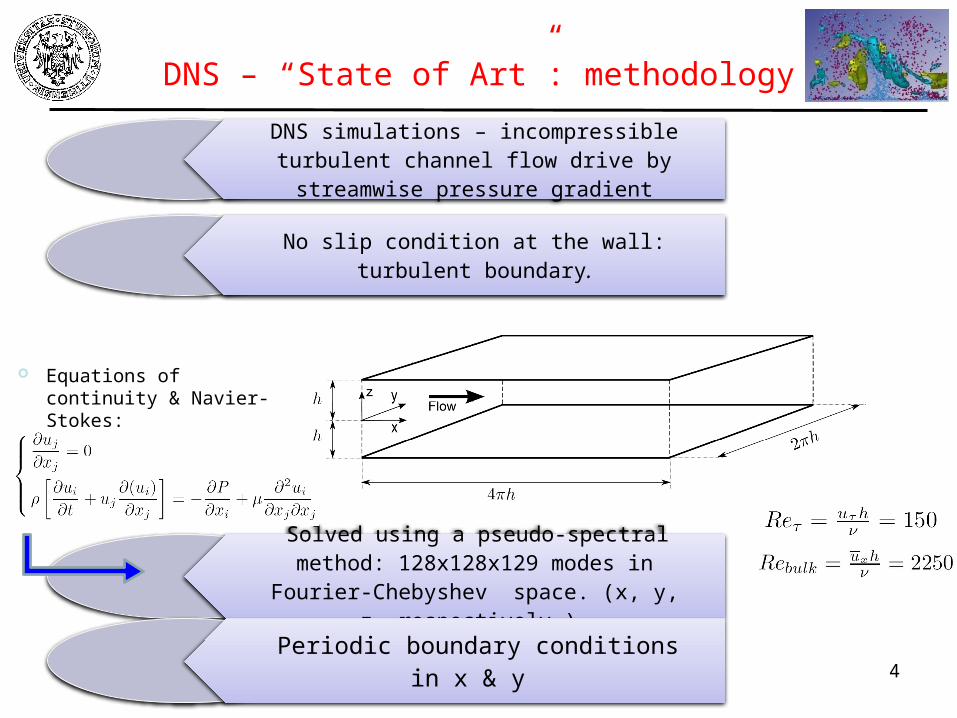
DNS simulations – incompressible turbulent channel flow drive by streamwise pressure gradient
Solved using a pseudo-spectral method: 128x128x129 modes in Fourier-
Chebyshev space. (x, y, z- respectively )
Periodic boundary conditions in x & y
No slip condition at the wall: turbulent boundary.
Equations of continuity & Navier-Stokes:
DNS – “State of Art”: methodology
4
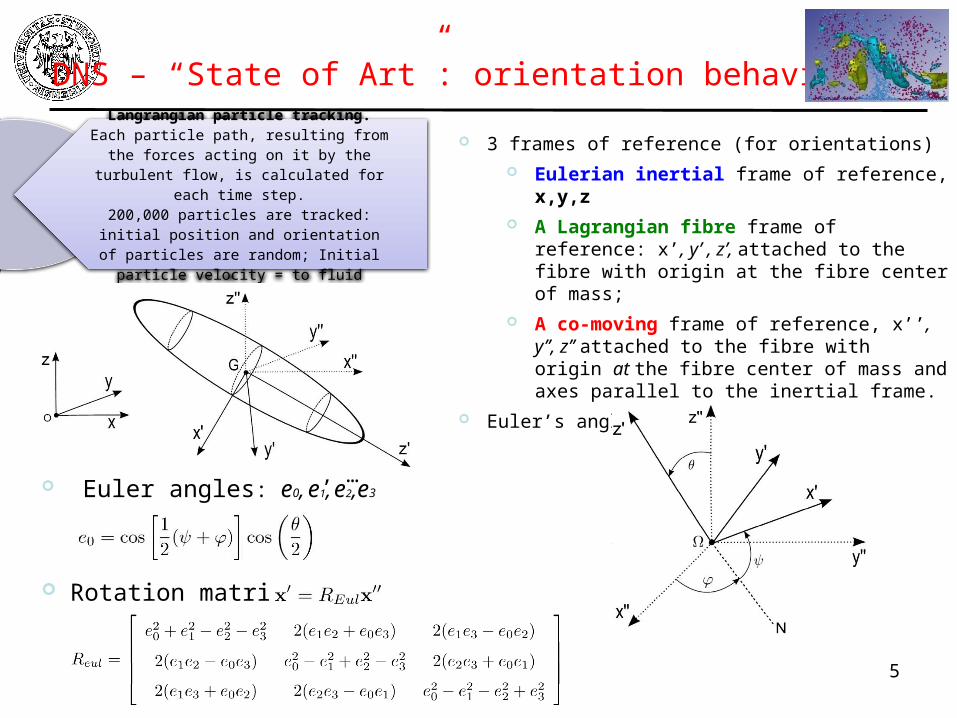
Langrangian particle tracking.Each particle path, resulting from the
forces acting on it by the turbulent flow, is calculated for each time step.
200,000 particles are tracked: initial position and orientation of particles are
random; Initial particle velocity = to fluid
3 frames of reference (for orientations) Eulerian inertial frame of reference, x,y,z A Lagrangian fibre frame of reference: x’,
y’ , z’, attached to the fibre with origin at the fibre center of mass;
A co-moving frame of reference, x’’, y’’, z’’ attached to the fibre with origin at the fibre center of mass and axes parallel to the inertial frame.
Euler’s angles: φ,ψ,θ
Euler angles: e0, e1, e2,e3
Rotation matrix:
, …
DNS – “State of Art”: orientation behaviour
5

Translational motion is strongly dependent on hydrodynamic drag
Newton’s law:
Hydrodynamic drag (Brenner)
(particle reference system)
In channel reference frame:
Resistance tensor
Coupling of translational motion and rotational motion
(particle trajectory)
(assume other forces are negligible)
DNS – “State of Art”
6
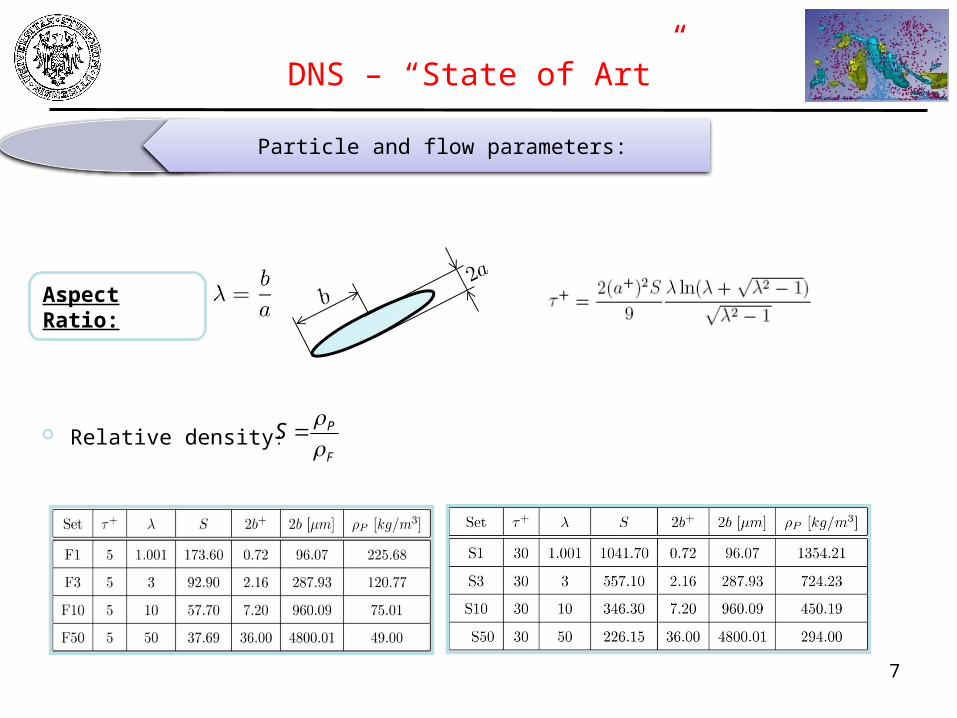
Relative density: F
PS
Particle and flow parameters:
DNS – “State of Art”
Aspect Ratio:
7
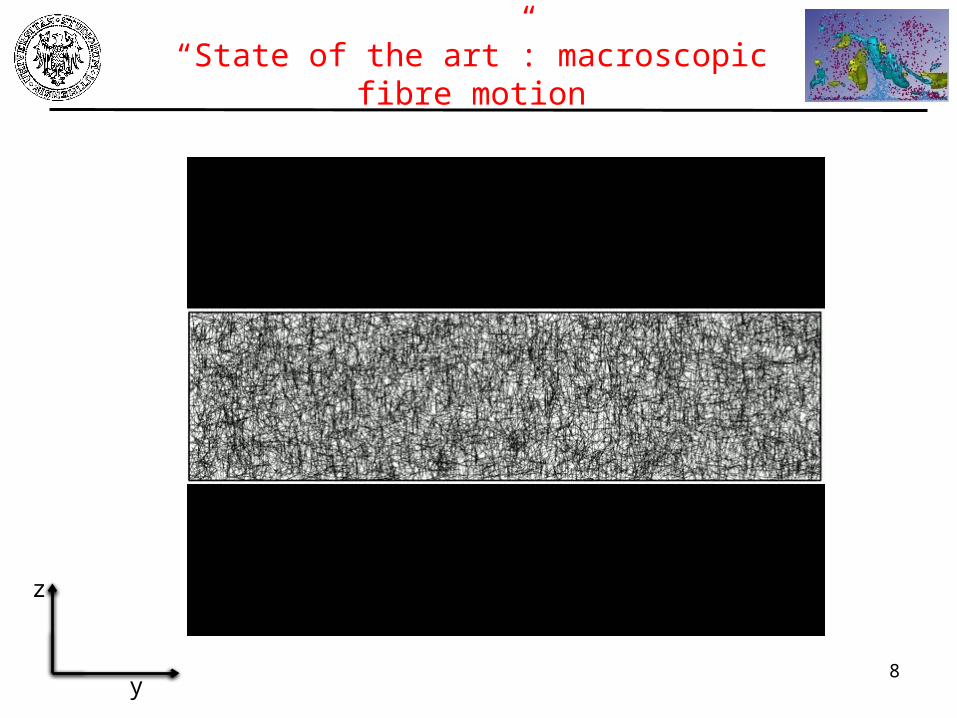
“State of the art”: macroscopic fibre motion
8y
z
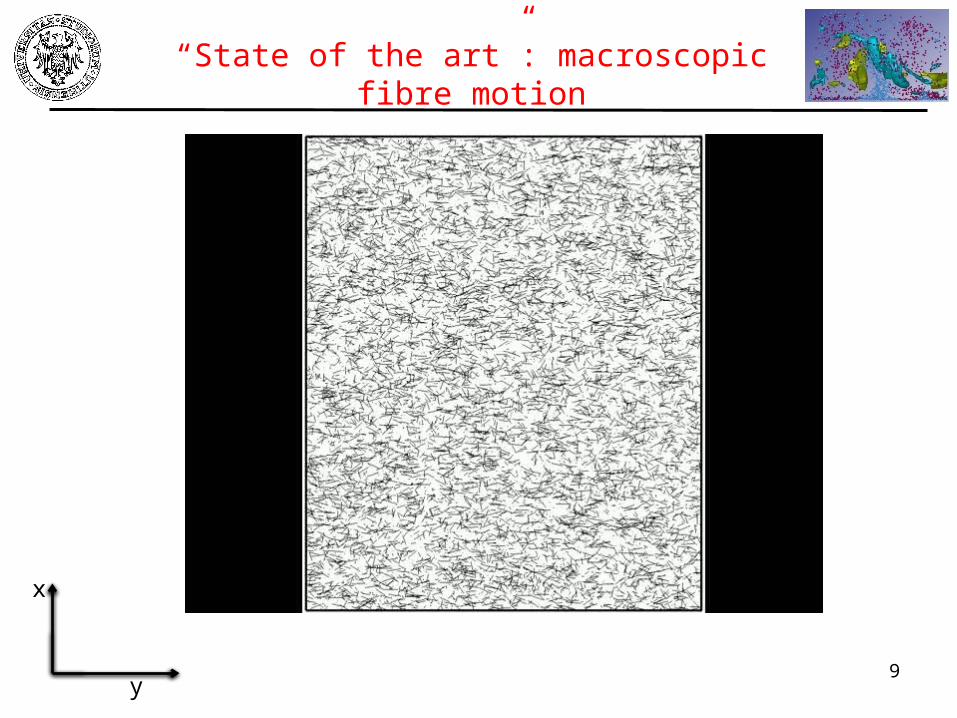
“State of the art”: macroscopic fibre motion
9y
x

“State of the art”: Concentration data
10
Instantaneous concentration profiles computed as volumetric fiber number density
Near wall peak - behaviour of fibre build up is complex and largely dependent on wall normal fibre translational velocity
Decrease of concentration at z+ approximately 1- after which point λ has little or no effect on concentration profiles
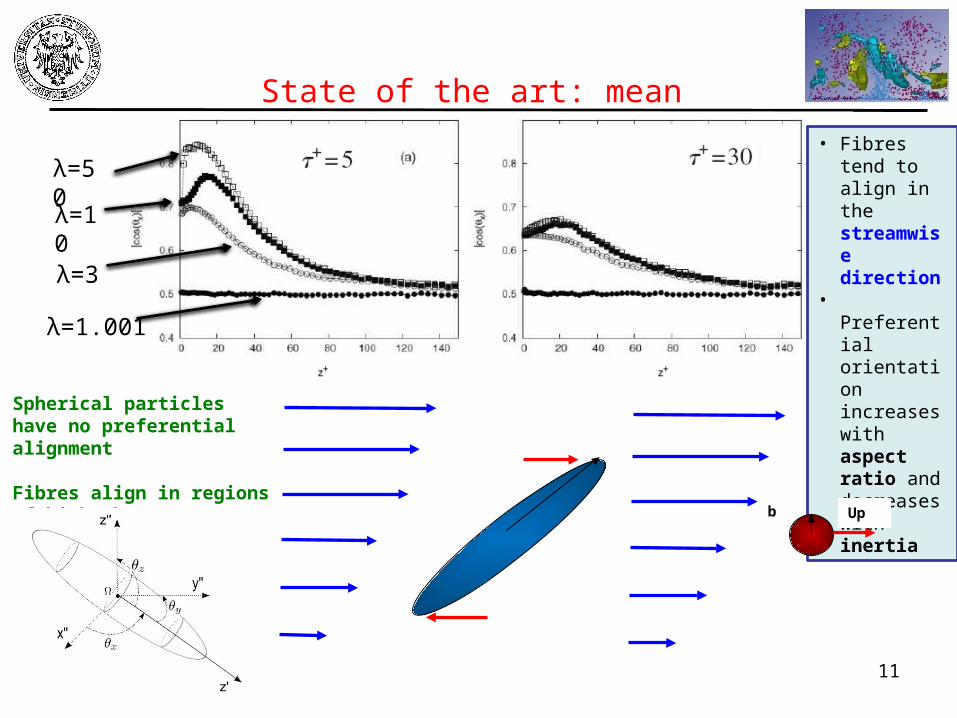
State of the art: mean orientations
Figure 16
λ=1.001
λ=3
λ=10
λ=50
11
• Fibres tend to align in the streamwise direction
• Preferential orientation increases with aspect ratio and decreases with inertia
b Up
Spherical particles have no preferential alignment
• Fibres align in regions of high shear
• In regions of small velocity gradients: random orientations

Objectives
• One way coupling• Inertia is concentrated in fibre centre of mass (CoM)• Rotation is computed according to shear in CoM • Dilute
Numerical models
• Macroscopic fibres• Fibres may affect flow• Fibres may interact (increased local concentration)• Very limited literature available*
Real world
12*Bernstein, O., Shapiro, M. Direct determination of the orientation distribution function of cylindrical particles immersed in laminar and turbulent shear flows. Journal of Aerosol Science,25, 113-136, (1994)
• Complete existing literature• Justify DNS assumptionsObjectives
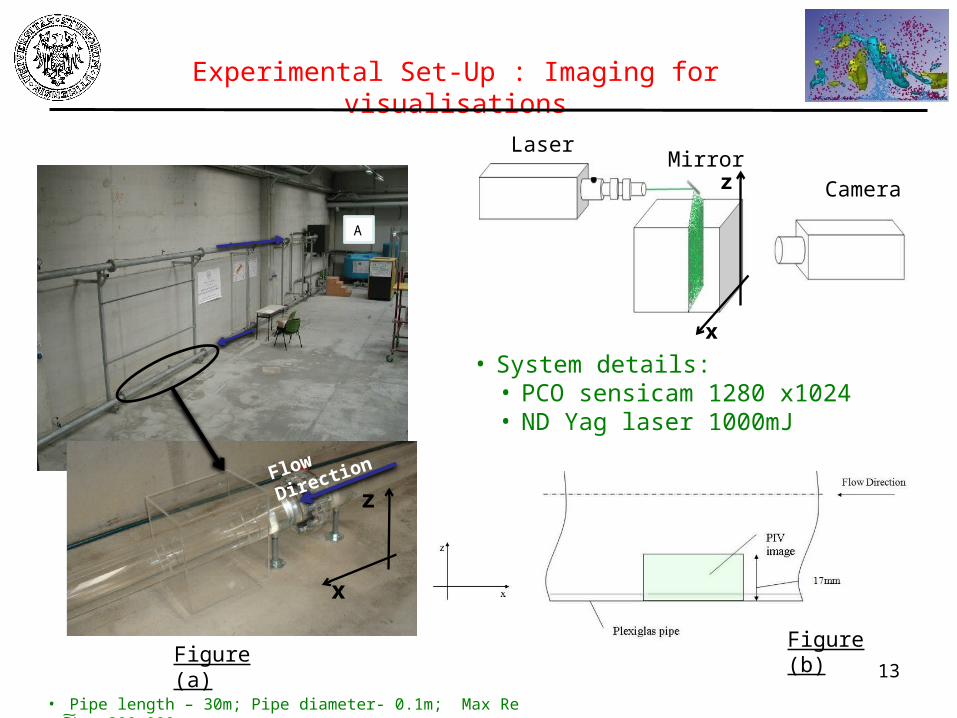
Experimental Set-Up : Imaging for visualisations
Figure (a)
Laser
Cameraz
x
Mirror
Flow Direction
x
z
• System details:• PCO sensicam 1280 x1024• ND Yag laser 1000mJ
Figure (b) 13
A
• Pipe length – 30m; Pipe diameter- 0.1m; Max Re ͠͠͠͠ 300,000

Experimental set-up: Fibres
• Uniform vs non uniform size distribution
• Synthetic plastic fibres (nylon) • Shredded wood fibres

Experimental set-up: Fibres
Cum
ula
tive
frequency
%
Frequenc
y %
Most probable length
Spurious
Fibre diameter

Experimental set-up :Fibre and flow parameters
[2]
Flow Velocity, m/s Re τ+ Reτ
0.71 71 938 0.108 1737
1.08 111 568 0.46 2507
1.25 145 804 0.5 3131
1.60 178 218 0.9 3513
2.13 226 531 1.1 4514
Fibre type
Specific Gravity
Fibre length, microns
Fibre diameter, (microns)
Aspect ratio (λ)
Mass fraction, %
wppm Concentration parameter nb3
Nylon 1.14 300 25 13 0.01 100 0.018
0.02 200 0.035
Dilute suspensions: based on concentration parameter nb3 << 1
16
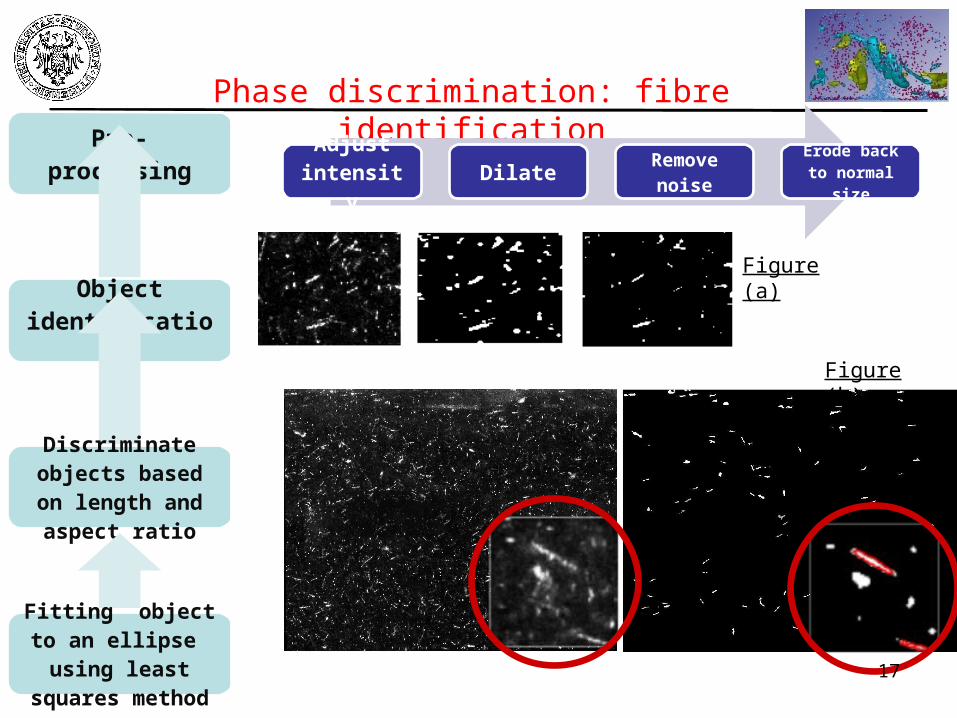
Phase discrimination: fibre identificationPre-
processing
Object identification
Discriminate objects based on length and aspect ratio
Fitting object to an ellipse using least
squares method
Adjust intensity Dilate Remove
noise
Erode back to normal
size
Figure (b)
Figure 6
Figure (a)
17

Phase discrimination: orientation calculations
Special formulation of a general conic
Least square fit to data point (centre locations of pixels that make up object):
• Fit an ellipse to fibre using least square fitting algorithm
18

Phase discrimination: statistics
• Mean orientations
• Normalised number densityi
19

Results: Normalised mean number density
Lower fibre mass fraction
20
Higher fibre mass fraction

Results: Normalised mean number density
(a)
(b)
(c)
(d)
Re 71 000 Re 145 804
21Re 178 000 Re 226
531

Results: Mean orientations
22
Lower fibre mass fraction Higher fibre mass fraction

Results: Mean orientations
(a)
(b)
(c)
(d)
23
Re 71 000 Re 145 804
Re 178 000 Re 226 531
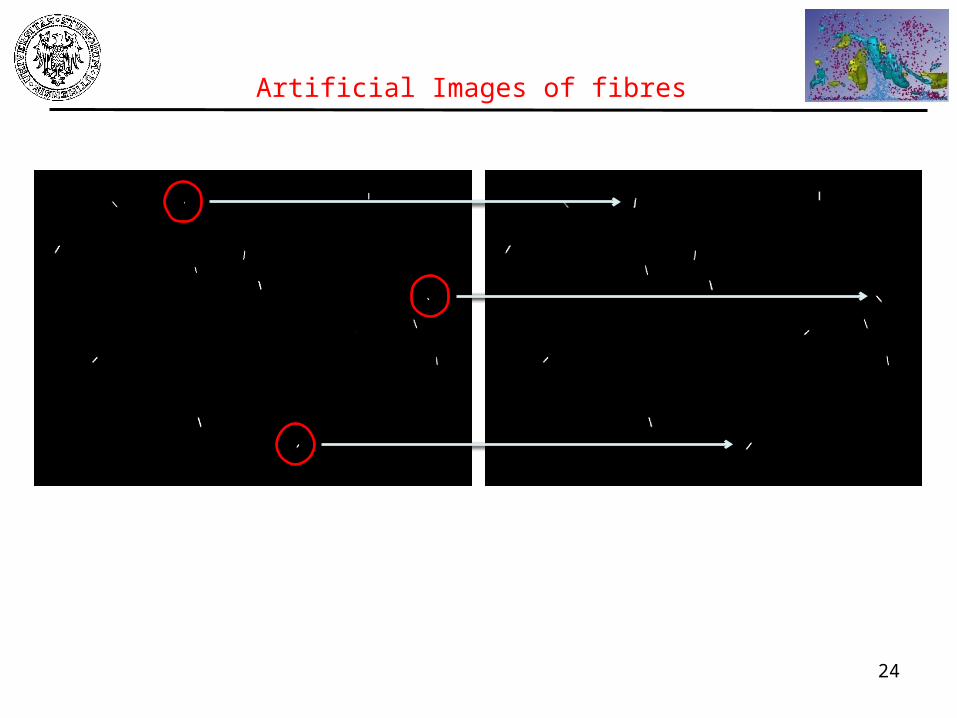
Artificial Images of fibres
Figure (b) 24

Discussion, Conclusions, Future Work
• Good agreement with mean statistics from DNS data
• Differences can be accounted for due to projection of a 3D body onto a 2D plane:
• We plan to calculate mean statistics using “phase discrimination” DNS slices
• Validate using 3D model
• Fibre velocities using PTV
• Validation in process of calculation of phase velocity
• Measurements of suspension viscosity
25

Thank you for your attention.
Comments, suggestions and questions welcome!
26