organisation and computer design
TRANSCRIPT

Organisation and Computer Design
Performance Evaluation « Performance Evaluation as Criteria to Best Computer Systems »
Carlos Jaime BARRIOS HERNÁNDEZ, PhD. @carlosjaimebh

PERFORMANCEEVALUATION• Often in Computer Science you need to:
• demonstrate that a new concept, technique, or algorithm is feasible
• demonstrate that a new method is better than an existing method
• understand the impact of various factors and parameters on the performance, scalability, or robustness of a system

Thinking in Computers…
• Classes • Program Performance • Programer Point of View
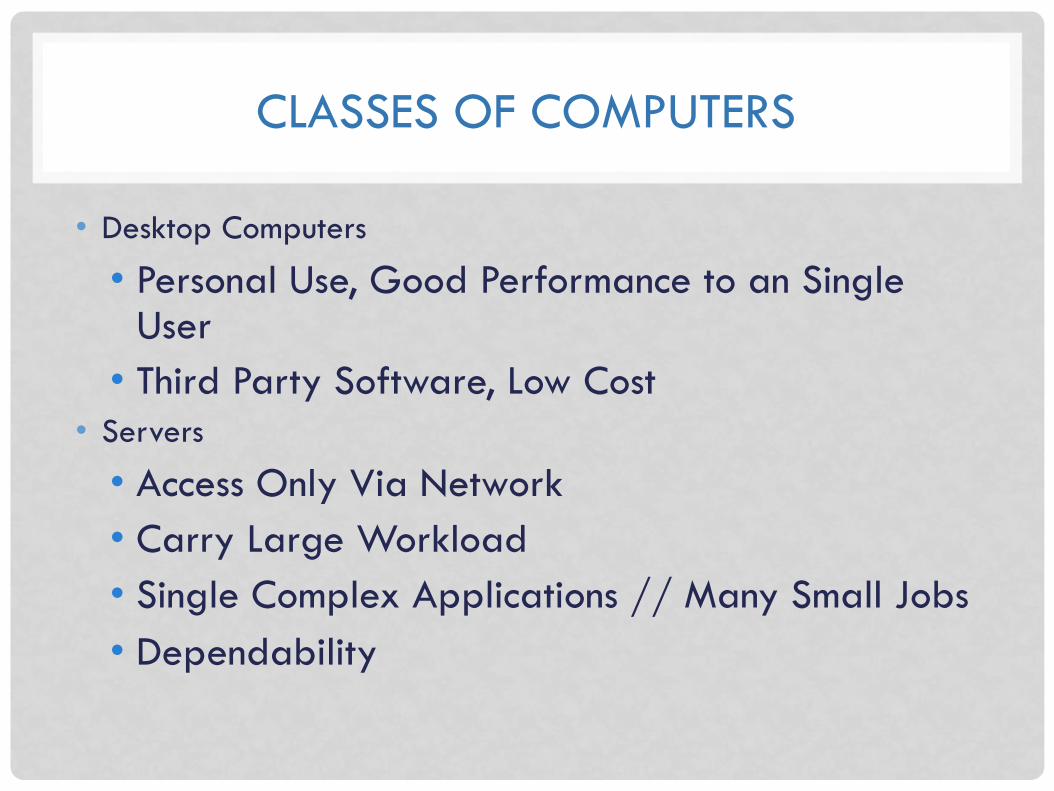
CLASSES OF COMPUTERS
• Desktop Computers
• Personal Use, Good Performance to an Single User
• Third Party Software, Low Cost • Servers
• Access Only Via Network • Carry Large Workload • Single Complex Applications // Many Small Jobs • Dependability

CLASSES OF… (II)
• Supercomputers • Large Processing / Memory / Storage • High End-Scientific Calculations • Peak of Computing Capability
• Data Centers • Large Processing / Memory / Storage with Emphasis in Storage
• Embedded Computers • Designed to run one application or one set of related application • Single System • Widest Range of Applications • Large Scale Development • Minimum Performance • Low Fault Tolerance • Simplicity • Dependability • Redundancy

UNDERSTANDING PERFORMANCE PROGRAM POINT OF VIEW
• Depends on a combination of the efectiveness of the algorithms used in the program, the software systems used to create and traslate the program into machine instructions, and the efectiveness of the computer hardware elements.

CONCEPTION, DEVELOPMENT AND USE OF COMPUTER SYSTEMS
7
$ €

SW AND HW PERFORMANCE
• Algorithm • # of Source-Level statements and # of I/O operations
executed
• Programming Language, Compiler and Architecture • # of Computer Instructions foe each source-level
statements
• I/O System (HW and O.S) • How fast I/O operations may be executed.

Applications
PROGRAMMER POINT OF VIEW
System Software
Hardware
System Software
O.S. Compilers

SOME CONCEPTS
• Letter: Binary Digit : bit • Instruction: Command that Computer
hardware understand and obeys (Collection of bits)
• Assembler: A program that TRANSLATE symbolic version of instructions INTO the binary version.
• Assembly Language: A symbolic representation of machine instructions
• Machine Language: A Binary representation of machine instructions.

SO?
• In all steps of a development process, performance evaluation is mandatory. • Monitoring • Benchmarking • Tests (Non-intrusive / Intrusive)
• Performance Evaluation in any Enginnering Systems project allows to take factible and good decisions

THE COMPUTER SCIENCE PROBLEM
12
Is Science!
Is Engineering!
Is Art

SO.. IN PERFORMANCE EVALUATION CONTEXT?
• Science is formal and based in scientific method (Mathematical description of phenomena), then computer science/informatics is science. • Observations and experimentations in controlled or non-
controlled environments • Engineering is based on science (Applied Science,
Mathematic tools to implement models), then systems engineering is an applied science. • Tests and benchkmarking
• Informatics requires creativity, passion, inspiration and intuition… • Contemplation, esthetical views?

THE PARADIGM...
p What process are part of a scientific approach?
p What process are a technological or engineering approach?
p What process are made with intuition, experience or inspiration?
14

THE FOCUS PROBLEM
p Theoretical: n I know everything... but nothing works.
p Practical: n Everything works... but I don't know why.
p Theoretical-Practical (Hybrid): n Nothing works... and nobody knows why.
15
In any case, we need predict the behavior of our system

THE IMPORTANCE OF PERFORMANCE IN
COMPUTER SYSTEMS
• Mission-critical applications • Life support applications • Homeland security • Battlefield situations • Personal communication systems
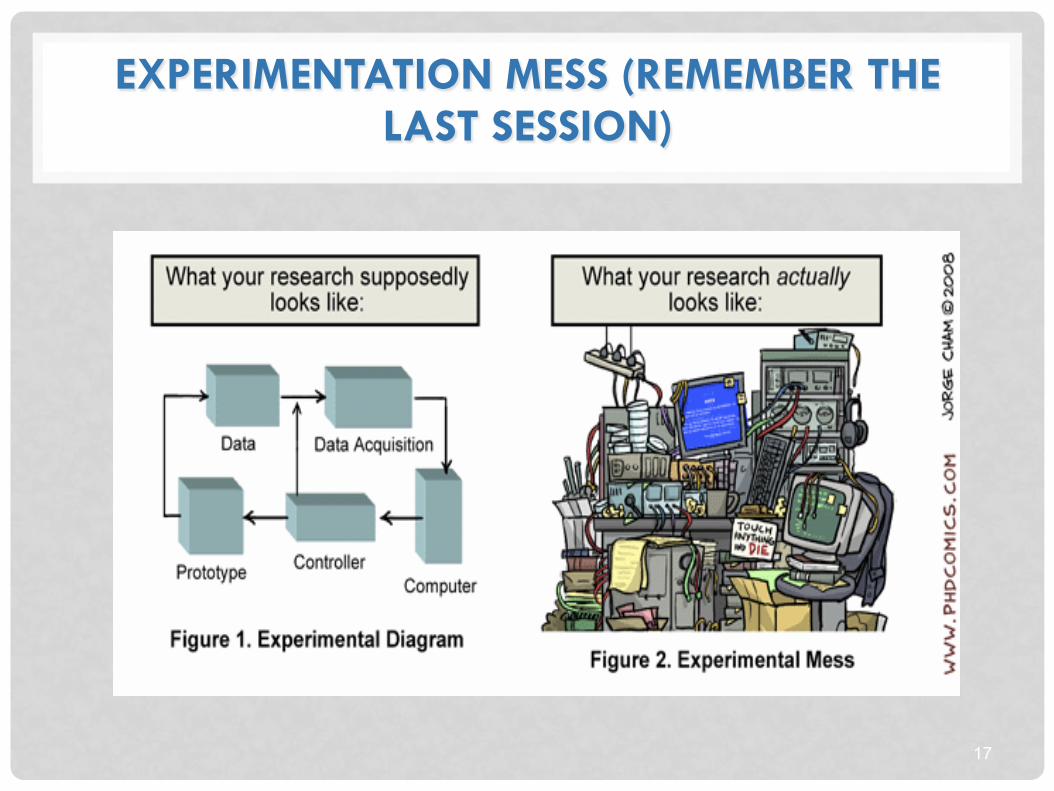
EXPERIMENTATION MESS (REMEMBER THE LAST SESSION)
17
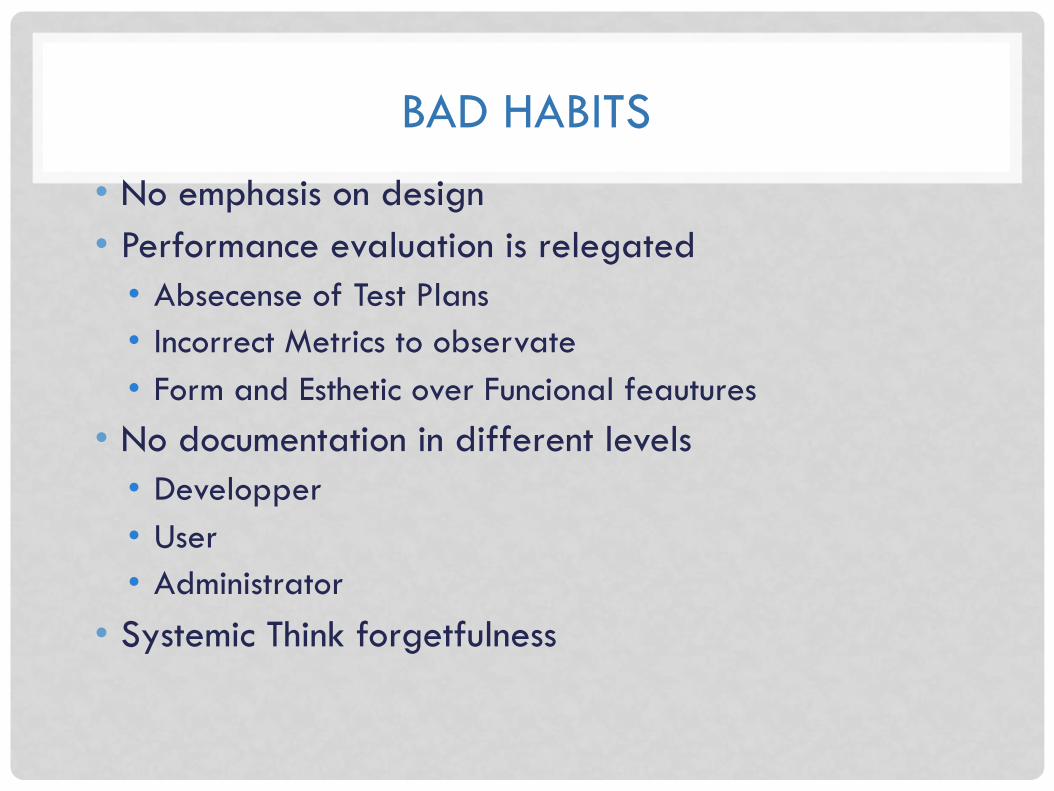
BAD HABITS
• No emphasis on design • Performance evaluation is relegated
• Absecense of Test Plans • Incorrect Metrics to observate • Form and Esthetic over Funcional feautures
• No documentation in different levels • Developper • User • Administrator
• Systemic Think forgetfulness

CONCEPTION OF SYSTEMS
19

THEORY AND PRACTICE (POINT OF VIEW OF SYSTEMS CONCEPTION)
p Theory p Abstraction
§ Models § Paradigms § Methods § Algorithms
Practice Implementation
Programs Applications Methodologies Protocols
20

SCIENCE OF THE COMPUTER SCIENCE
p Experimentation (tests) could be confirm or refute the accuracy (efficiency) of a software (system) design.
p Questions and theoric motivations with experiences (tests) produce « good » algorithms and programs.
p Development Cycle of software (systems) include: modeling (design), experimentation (tests – performance evaluation), build (programming)... (It's not a linear cycle).
21

OBSERVING THE BEHAVIOR OF A SYSTEM
p Observation p Measures
p Metrics
p Replication p Validation p Confrontation
Monitoring Measures
Metrics
Implantation in different environments
Validation Comparison
Benchmarking
22

EXPERIMENTAL COMPUTER SCIENCE
p Experimental Computer Science includes: n Observation n Confrontation of hypothesis n Reproduction of tests
23
Performance Evaluation
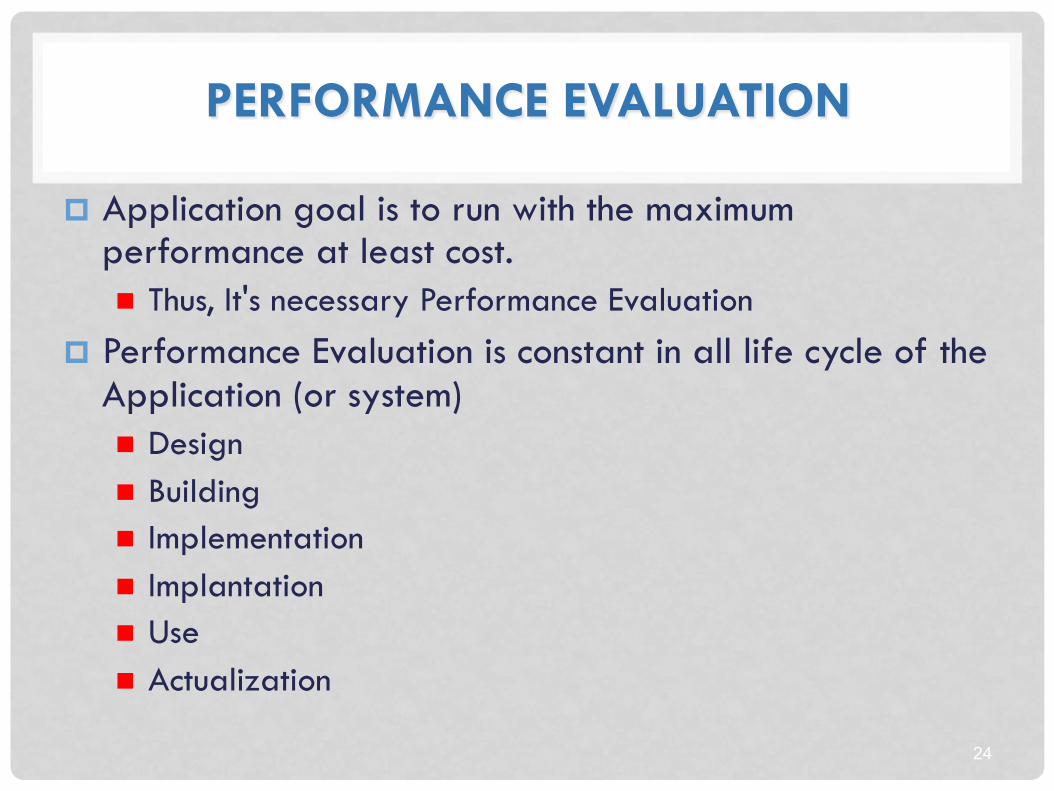
PERFORMANCE EVALUATION
p Application goal is to run with the maximum performance at least cost. n Thus, It's necessary Performance Evaluation
p Performance Evaluation is constant in all life cycle of the Application (or system) n Design n Building n Implementation n Implantation n Use n Actualization
24

QOS METRICS
• Response time • Throughput • Availability • Reliability • Security • Scalability • Extensibility

PERFORMANCE EVALUATION (FROM THE COMPUTER SCIENCE PROBLEM HERITAGE)
p Performance Evaluation is a technique: n Processes n Methodology n Tools
p Performance Evaluation is a science: n Theoric Basis n Experimentation n Replication and Validation
p Performance Evaluation is Art: n Intuition (Deep Knowledge) n Abstraction Capacity n Creativity n Activity non repetitive n Tools
26
Performance Evaluation allows to know the capacities and limitations of a system.

MODELING, MEASURING AND SIMULATING
p Modeling: It allows to build formal abstractions n Mathematical Models n Analytical Models n Causal Models
p Measurement: It allows to characterize n Tests, Experiences in environments controlled known.
p Simulating: It allows to observe defined scenarios n In according with the modeling.
27

ANALYTICAL EXAMPLE: QUEUEING THEORY
• Queuing theory is a mathematical technique that specializes in the analysis of queues (e.g., customer arrivals at a bank, jobs arriving at CPU, I/O requests arriving at a disk subsystem, lineup at Tim Hortons)
• General diagram:
28
Customer Arrivals Departures
Buffer Server

QUEUEING THEORY (CONT’D)
• The queueing system is characterized by: • Arrival process (M, G) • Service time process (M, D, G) • Number of servers (1 to infinity) • Number of buffers (infinite or finite)
• Example notation: M/M/1, M/D/1 • Example notation: M/M/ , M/G/1/k
29
8
QUEUEING THEORY (CONT’D)
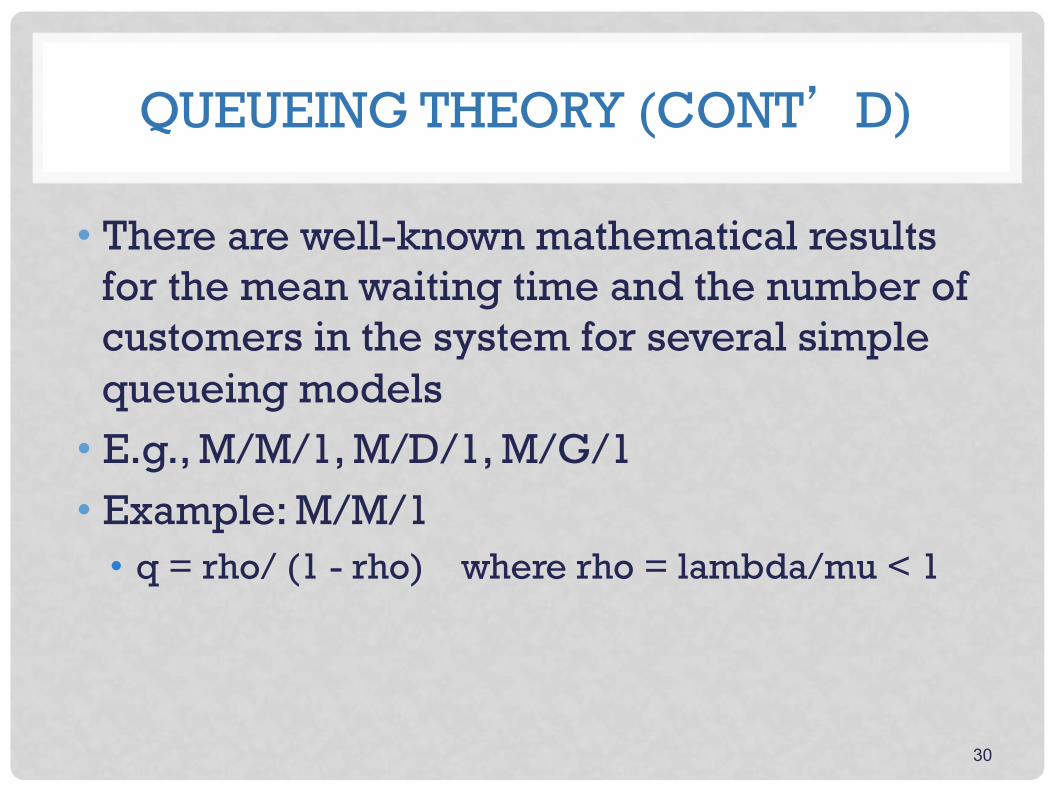
• There are well-known mathematical results for the mean waiting time and the number of customers in the system for several simple queueing models
• E.g., M/M/1, M/D/1, M/G/1 • Example: M/M/1
• q = rho/ (1 - rho) where rho = lambda/mu < 1
30

QUEUEING THEORY (CONT’D)
• These simple models can be cascaded in series and in parallel to create arbitrarily large complicated queueing network models
• Two main types: • closed queueing network model (finite pop.) • open queueing network model (infinite pop.)
• Software packages exist for solving these types of models to determine steady-state performance (e.g., delay, throughput, util.)
31

QUEUEING THEORY (CONT’D)
• These simple models can be cascaded in series and in parallel to create arbitrarily large complicated queueing network models
• Two main types: • closed queueing network model (finite pop.) • open queueing network model (infinite pop.)
• Software packages exist for solving these types of models to determine steady-state performance (e.g., delay, throughput, util.)
32

SIMULATION EXAMPLE: TCP THROUGHPUT
• Can use an existing simulation tool, or design and build your own custom simulator
• Example: ns-2 network simulator • A discrete-event simulator with detailed TCP
protocol models • Configure network topology and workload • Run simulation using pseudo-random
numbers and produce statistical output
33

OTHER ISSUES
• Simulation run length • choosing a long enough run time to get
statistically meaningful results (equilibrium)
• Simulation start-up effects and end effects • deciding how much to “chop off” at the start
and end of simulations to get proper results
• Replications • ensure repeatability of results, and gain
greater statistical confidence in the results given
34

EXPERIMENTAL EXAMPLE: BENCHMARKING
• The design of a performance study requires great care in experimental design and methodology
• Need to identify • experimental factors to be tested • levels (settings) for these factors • performance metrics to be used • experimental design to be used
35

FACTORS
• Factors are the main “components” that are varied in an experiment, in order to understand their impact on performance
• Examples: request rate, request size, read/write ratio, num concurrent clients
• Need to choose factors properly, since the number of factors affects size of study 36

LEVELS
• Levels are the precise settings of the factors that are to be used in an experiment
• Examples: • req size S = 1 KB, 10 KB, 1 MB
• Example: • num clients C = 10, 20, 30, 40, 50
• Need to choose levels realistically • Need to cover useful portion of the design
space 37

TECHNIQUES
p MODELING (Analytical Model) p SIMULATION p EXPERIMENTATION (TESTS –
MEASUREMENT) n Tests in controlled systems n Tests « On Live » (also controlled)
p Benchmarking p Tracing and Profiling
38 ANYONE COULD BE VALIDATE FOR ALMOST ANOTHER ONE!!!
SOLUTION TECHNIQUES
39
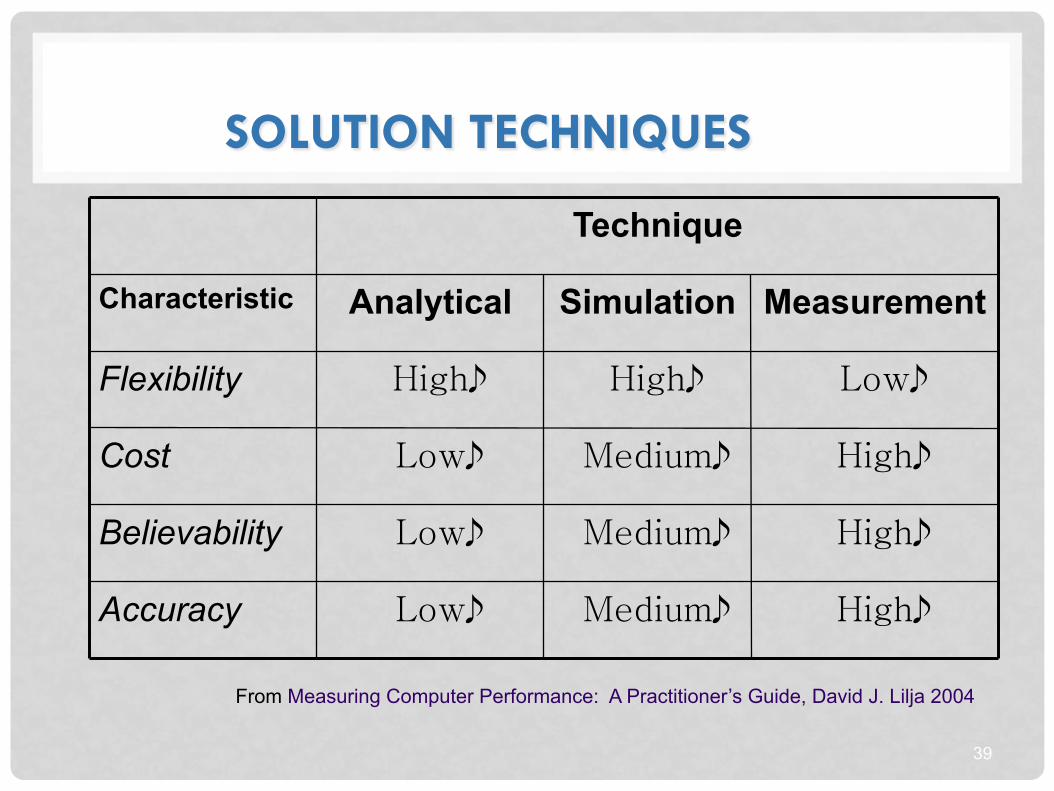
High Medium Low Accuracy
High Medium Low Believability
High Medium Low Cost
Low High High Flexibility
Measurement Simulation Analytical Characteristic
Technique
From Measuring Computer Performance: A Practitioner’s Guide, David J. Lilja 2004

PERFORMANCE EVALUATION STEPS
1. Stablish the goals of the study and define the system boundaries.
2. List system services and possible outcomes 3. Select performance metrics 4. List system and workload parameters. 5. Select factors and their values. 6. Select evaluation techniques. 7. Select the workload. 8. Design the experiments. 9. Analyze and interpret the data. 10. Present the results. Start over, if necessary.
40
n From The Art of Computer Systems Performance Analysis Techniques For Experimental Design Measurements Simulation And Modeling de Raj Jain .Wiley Computer Publishing, John Wiley & Sons, Inc.

THROUGHPUT AND REPONSE TIME
• Throughput: Bandwidth: Number of tasks completed per unit time.
• Reponse Time: Execution Time: The total time required for a computer to complete a task. • Disk Accesses • I/O Activities • Memory Accesses • Operating System Overhead • CPU execution time
OPEN QUESTION
• Do the following changes to a computer system increase throughtput, decrease response time, or both? 1. Replacing the processor in a computer with a
faster version 2. Adding additional processors to a system that
uses multiple processors for separate tasks?

OPEN ANSWERS
1. Response time and throughput are improved
• Decreasing response time almost always improves throughput.
2. Thoughtput Increases • No ones task gets work done faster.

ABOUT THE METRICS
44
p Performance metrics are n Count
p Of how many times an event occurs n Duration
p Of a time interval n Size
p Of some parameter n Derivated values from these measurements

PERFORMANCE METRICS
• Performance metrics specify what you want to measure in your performance study
• Examples: response time, throughput, pkt loss
• Must choose your metrics properly and instrument your experiment accordingly
45

TIME-NORMALIZED METRICS p « Rate » metrics
n Normalize metric to common time basis p Transactions per second
p Bytes per second
n (Number of events) ÷ (time interval over which events occurred)
p « Throughput » n Average rate of successful message delivery over a communication
channel
p Useful for comparing measurements over different time intervals
46

GOOD METRICS CHARACTERISTICS
p Allows accurate and detailed comparisons
p Leads to correct conclusions
p Is well understood by everyone
p Has a quantitative basis p A good metric helps
avoid erroneous conclusions
Good metrics is Linear If metric increases 2x, performance should increase 2x
Reliable If metric A > metric B
Then, Perf. A > Perf.B
Repeatable
Easy to use
Consistent Units and definition are constant across systems
Independent Indepentent to pressure on manufacturers to optimize for
a particular metric
47

PERFORMANCE METRICS SUMMARY
48
TIME QUIPS SPEC MFLOPS MIPS Clock
☺ ☺ ☺ ☺
☺
☺ ☺
☺ ☺
☺ ½☺ ☺
☺ ☺ ☺ ☺
≈☺
☺ Independent
☺ Consistent
☺ Easy to measure
☺ Repeatable
≈☺ Reliable
☺ Linear
From Measuring Computer Performance: A Practitioner’s Guide, David J. Lilja 2004

OTHER METRICS
p Response time n Elapsed time from request to response
p Throughput n Jobs, operations completed per unit time
p E.g. video frames per second
p Bandwidth n Bits per second
p Ad hoc metrics n Defined for a specific need
p Requests per transaction
49
ABOUT THE MEANS...
p Performance in systems is multidimensional n CPU time n I/O time n Network time n Read/Write speedup n Disk Access n Storage Capacity n Interactions of various components n ...

ABOUT MEASUREMENT TOOLS AND METHODOLOGIES...
p Actually, measurement tools are based in events: n Some predefined change to system state
p Event definition depends on metric being measured n Memory reference n Disk access n Change in a register’s state n Network message n Processor interrupt
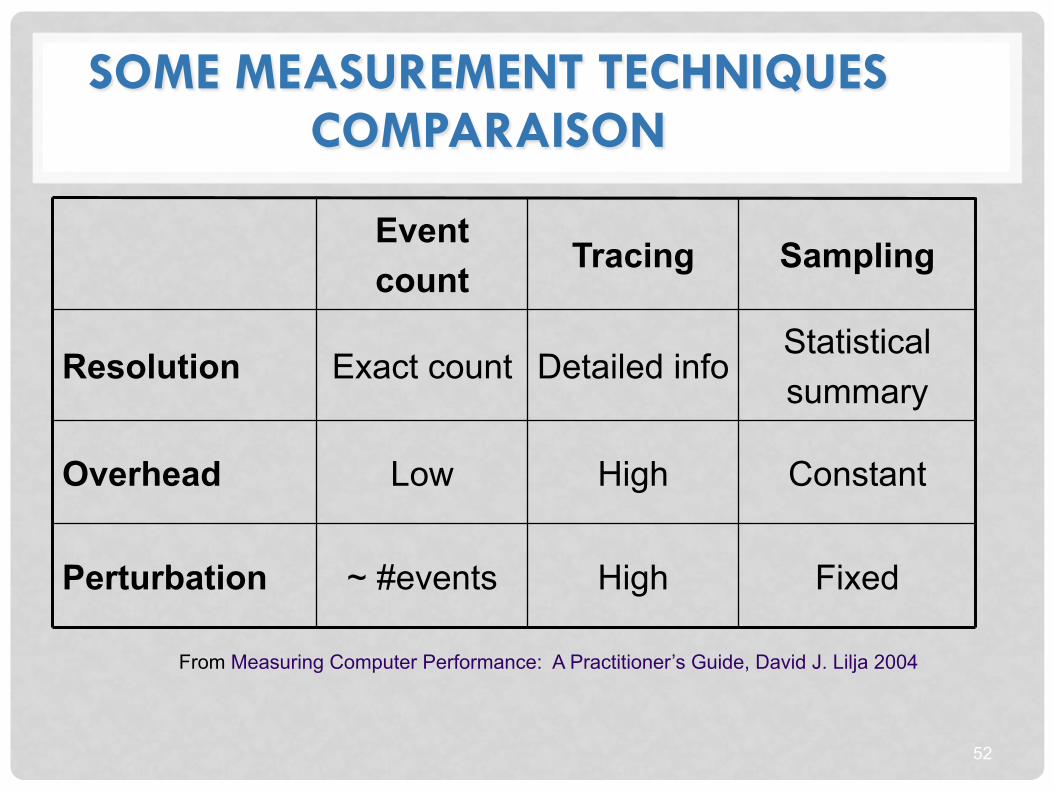
SOME MEASUREMENT TECHNIQUES COMPARAISON
52
Fixed High ~ #events Perturbation
Constant High Low Overhead
Statistical summary
Detailed info Exact count Resolution
Sampling Tracing Event count
From Measuring Computer Performance: A Practitioner’s Guide, David J. Lilja 2004

WHAT EVALUATE?
p Infrastructure n Monitoring n Benchmarking n Emulating
p Applications n Monitoring n Benchmarking n Tracing and Profiling
p Users n Monitoring n Organization Techniques
53
POSTERS
p Accuracy n In accord with your
needs) p Efficiency n In accord with the
available resources p Fault tolerance p Security and Safety

BENCHMARK AND WORKLOAD
p Benchmark: n Result of running a computer program, or a set of
programs, in order to assess the relative performance of an object by running a number of standard tests and trials against it (wikipedia)
p Workload: n Quantified effort
p Adition Instructions p Hybrid Instructions p Syntetics Programs p Kernels p Benchmark Applications
54

THE CRITICAL BEHAVIORS TO EVALUATE
p Data Transfer n High Bandwidth Data Transfer implies heterogenity, dynamicity, concurrence
and so on.
p File System Sensibility n I/O Sensibility
p Adaptation and Effectiveness p Scalability p Fault Tolerance p Security p Energy Consumption p ... and the « Human invervention »
p Processing is critical but...
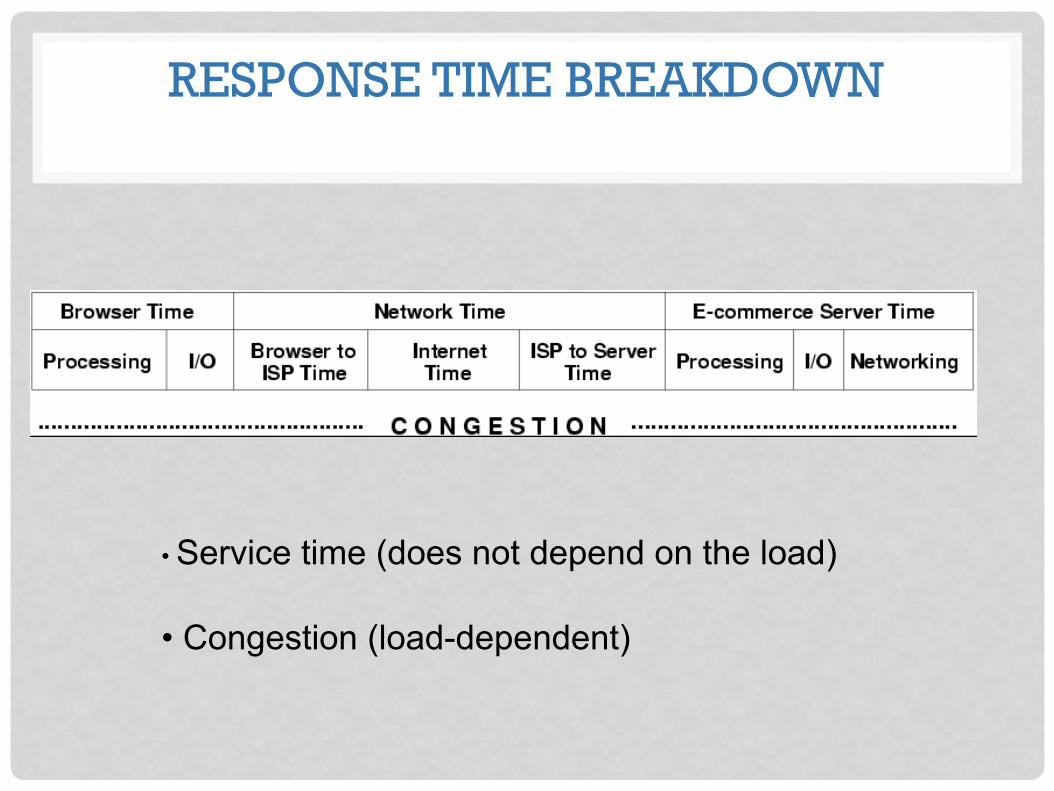
RESPONSE TIME BREAKDOWN
• Service time (does not depend on the load)
• Congestion (load-dependent)

THROUGHPUT
• Measured in units of work completed over time. It’s a rate. • I/O’s/sec • Page downloads/sec • HTTP requests/sec • Jobs/sec • Transactions per second (tps)

THROUGHPUT EXAMPLE
• An I/O operation at a disk of an OLTP system takes 10 msec on average. • What is the maximum throughput of the disk?
• What is the throughput of the disk if it receives I/O requests at a rate of 80 requests/sec?

THROUGHPUT EXAMPLE

AVAILABILITY
• Fraction of time a system is available (i.e.,operational). • Service interruptions can damage the reputation
of a company, may endanger lives, and may cause financial disasters.
• A system with 99.99% availability over 30 days is unavailable (1-0.9999) x 30 x 24 x 60 = 4.32 minutes.

AVAILABILITY PROBLEMS
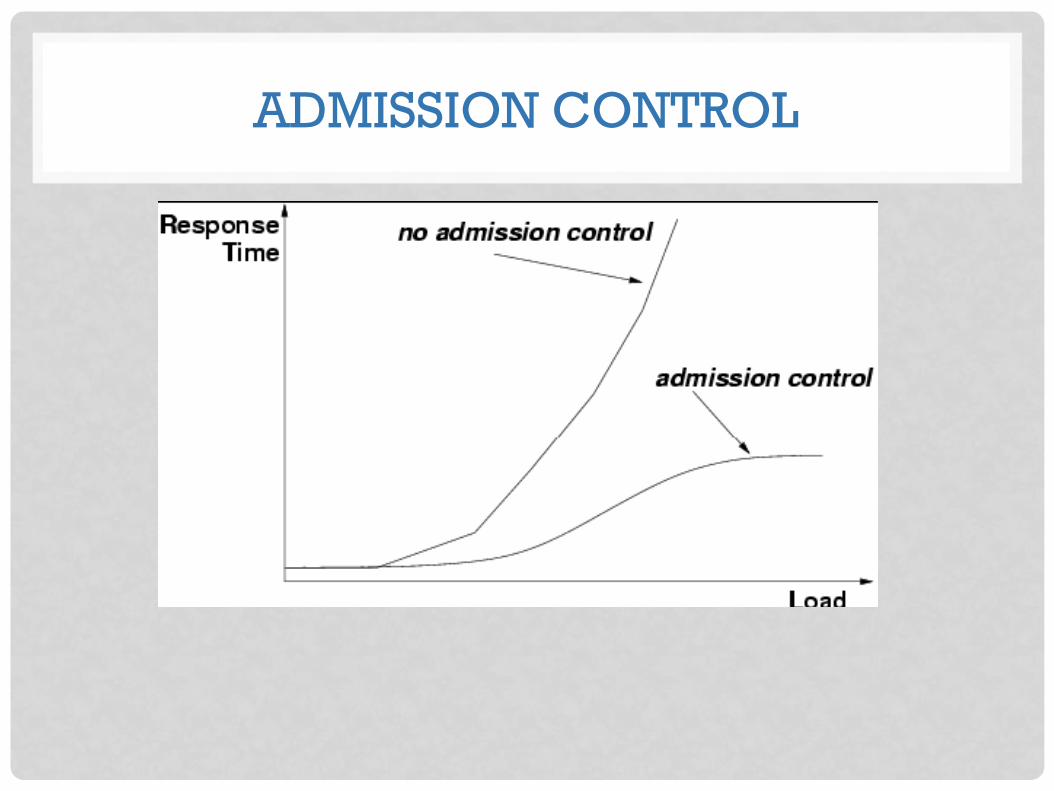
ADMISSION CONTROL

ADMISSION CONTROL
•Improved response time •Decreased availability
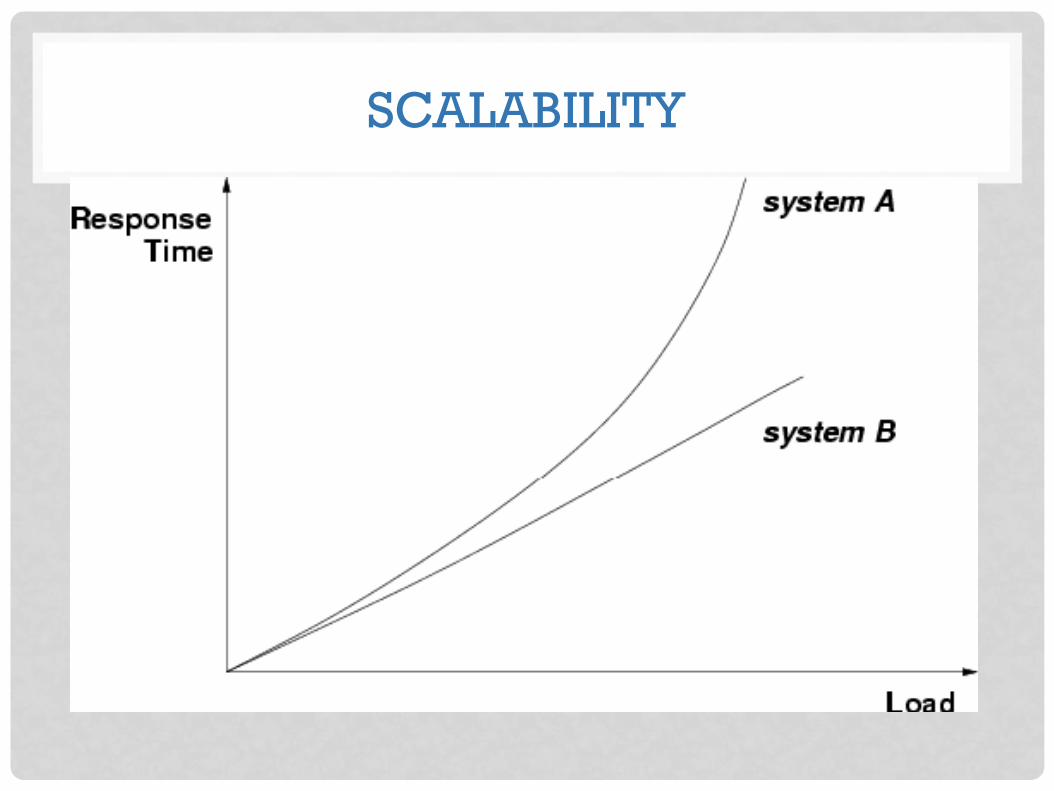
SCALABILITY
System A is not scalable
EXTENSIBILITY
• Property of a system to constantly evolve to meet functional and performance requirements. • Autonomic computing, self-managing systems, self-healing systems.
COMPUTER SYSTEM LIFECYCLE
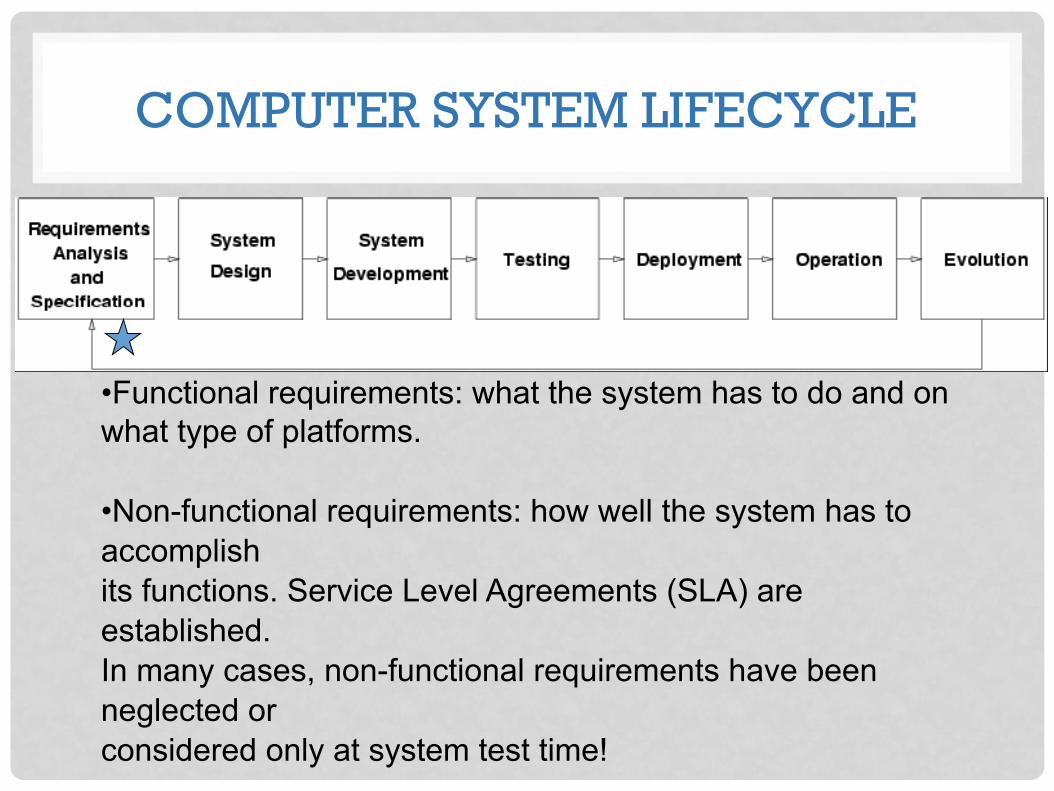
• Functional requirements: what the system has to do and on what type of platforms.
• Non-functional requirements: how well the system has to accomplish its functions. Service Level Agreements (SLA) are established. In many cases, non-functional requirements have been neglected or considered only at system test time!

COMPUTER SYSTEM LIFECYCLE
How will the requirements be met? - System architecture - System broken down into components - Major data structures, files, and databases are designed. - Interfaces between components are specified

COMPUTER SYSTEM LIFECYCLE
Components are implemented. - some are new - some are re-used - some are adapted Components are interconnected to form a system Components should be instrumented as they are built

COMPUTER SYSTEM LIFECYCLE
Concurrent with system development, as components become available (unit testing) Integrated tests are carried out when the entire system is ready. Often, more time is spent in testing functional requirements than in testing non-functional requirements.

COMPUTER SYSTEM LIFECYCLE
• Configuration parameters have to be set in order to meet the SLAs.
• e.g., TCP parameters, database poolsize, maximum number of threads, etc.

COMPUTER SYSTEM LIFECYCLE
Constant monitoring to check if the system is meeting demands: • workload (peak periods, unusual patterns) • external metrics (user-perceived) • internal metrics (help to detect bottlenecks and to fine tune the system) • availability (external and internal)
May need to dynamically adjust configuration parameters

COMPUTER SYSTEM LIFECYCLE
• Systems may need to evolve to cope with new laws and Regulations (e.g., HIPPA)
• Systems may need to evolve to provide new functions (e.g., sale of downloadable MP3 music in addition to CDs)
• How are the IT resources going to cope with evolution in terms of SLAs?

REFERENCE MODEL FOR IT
Business Model: - number of branches - number and location of ATMs - number of accounts of each type - business evolution plans (e.g., mergers)
Social Model - privacy policy - accessibility policy

USER MODEL: CUSTOMER BEHAVIOR MODEL
GRAPH
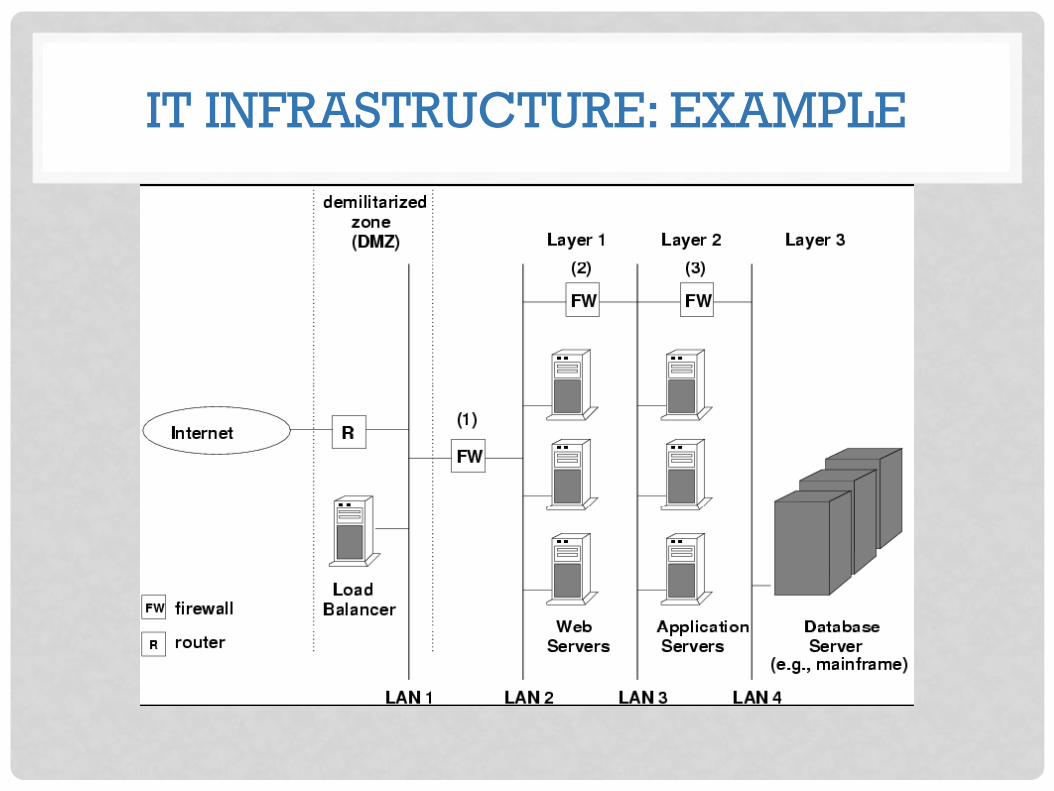
IT INFRASTRUCTURE: EXAMPLE

EXPERIMENTAL DESIGN
• Experimental design refers to the organizational structure of your experiment
• Need to methodically go through factors and levels to get the full range of experimental results desired
• There are several “classical” approaches to experimental design
76

EXAMPLES
• One factor at a time • vary only one factor through its levels to see
what the impact is on performance
• Two factors at a time • vary two factors to see not only their individual
effects, but also their interaction effects, if any
• Full factorial • try every possible combination of factors and
levels to see full range of performance results
77
OPEN QUESTIONS
p Performance Evaluation of Systems is REALLY important... then, n How to increase the level of accuracy of performance
models? p Of course, it's necessary the definition of metrics and build
tools.
n How to implementate realistic models to performance evaluation? p On live process
n How to integrate the needs of scientifics and enginner/computer science scientist in performance evaluation?
RECOMMENDED LECTURES
• The Art of Computer Systems Performance Analysis Techniques For Experimental Design Measurements Simulation And Modeling de Raj Jain .Wiley Computer Publishing, John Wiley & Sons, Inc.
• Measuring Computer Performance: A Practitioner’s Guide, David J. Lilja 2004
MIPS REFERENCE CARDS
• inst.cs.berkeley.edu/~cs61c/resources/MIPS_Green_Sheet.pdf
• refcards.com/docs/waetzigj/mips/mipsref.pdf • www2.engr.arizona.edu/~ece369/.../spim/MIPSReference.pdf

"HOUSTON, WE'VE HAD A PROBLEM"
JAMES A. LOVELL (NASA APOLLO XIII MISSION)