organ donation - anzdata1 4 overview of organ dona on figure 1.5 donors per 10,000 deaths aged <...
TRANSCRIPT
Chapter 1
Organ Donation
in Australia and New Zealand

1�2�
�Overview�of�Organ�Dona�on�
Figure 1.1
Number of Donors** by Retrieval State / Country (X) 2008 - 2012
( ) Donors Per Million Population
2008 2009 2010 2011 2012
Queensland 48 (11) 47 (11) 49 (11) 67 (15) 78 (17)
New South Wales + * 57 (8+) (8*) 68 (10+) (10*) 87 (12+) (13*) 77 (11+) 88 (12+) (12*)
ACT + * 5 (9+) (14*) 8 (14+) (23*) 10 (17+) (28*) 8 (14+) (22*) 12 (20+) (32*)
Victoria 67 (13) 65 (12) 98 (18) 107 (19) 92 (16)
Tasmania 8 (16) 5 (10) 10 (20) 6 (12) 15 (29)
South Australia 43 (27) 33 (20) 31 (19) 35 (21) 29 (18)
Northern Territory 3 (14) 2 (9) 2 (9) 4 (17) 8 (34)
Western Australia 28 (13) 19 (8) 22 (10) 33 (14) 32 (13)
Australia 259 (12.1) 247 (11.3) 309 (14) 337 (15.1) 354 (15.6)
New Zealand 31 (7.3) 43 (10) 41 (9.4) 38 (8.6) 38 (8.6)
(x) refers to donors retrieved by retrieval State (ie, Albury-NSW donors retrieved by Victoria) + NSW population excludes residents of the NSW Southern Area Health Service (included in ACT population)
* NSW population includes residents of the NSW Southern Area Health Service (excluded from ACT population) Medical services from the ACT service the NSW Southern Area Health Region. Population data - June ABS 3101.0
** This figure relates to the number of donors for whom the retrieval operation commenced for the purpose of transplantation. It includes donors who may have been deemed medically unsuitable at the time of the surgery or after removal of organs.
surgery; three donors were discovered to have malig-nancies previously undiagnosed; two donors had un-derlying infection in their organs and one donor had organs not anatomically suitable for transplantation.
In New Zealand, four donors (of the 38 for 2012) did not have organs transplanted; three due to disease in organs and one donor with no suitable recipient. Cor-neas were donated from two of these donors.
In Australia, there remains considerable variation in organ donor rates between jurisdictions. In 2012, rates varied from 12 dpmp in New South Wales to 34 dpmp in the Northern Territory. The rate in the ACT was 32 dpmp when the NSW Southern Area Health Service population was excluded, but 20 dpmp when this area was included.
The deceased organ donor per million population (hereinafter “dpmp”) figures in Australia rose to 15.6 (dpmp) in 2012, from 15.1 (dpmp) in 2011 and 14 (dpmp) in 2010. In New Zealand, the rate remained stable at 8.6 dpmp.
Australian and New Zealand donor figures include all donors consented for organ and tissue donation who went to the operating theatre for the purpose of organ or tissue retrieval for transplantation. Of the 354 do-nors for 2012 for Australia, there were twelve who did not donate any organs although five of these donors still proceeded to donate tissue or eyes. In Australia, 342 actual donors in 2012 had at least one of their organs successfully transplanted (“utilised donors”). Of the twelve donors where no organs were transplanted, in six this reflects disease in organ found at the time of

1
1�3�
0
10
20
30
40
0
10
20
30
40
2008 2009 2010 2011 2012
Year
QLD NSW* ACT* VICTAS SA NT WA
* NSW population excludes residents of the NSW Southern Area Health Service.* ACT population includes residents of the NSW Southern Area Health Service.
Number of Donors Per Million Population Australian States 2008 - 2012
Overview�of�Organ�Dona�on�
Figure 3
Number of Donors Per Million Population
Australian States 2008 - 2012
0
25
50
75
100
Num
ber
1998
1999
2000
2001
2002
2003
2004
2005
2006
2007
2008
2009
2010
2011
2012
NSWVICQLDSAWATASNTACT
Actual Donors by State 1998-2012Number of Donors Australian States 1998-2012
Figure 1.2
Figure 1.3
1�4�
Overview�of�Organ�Dona�on�
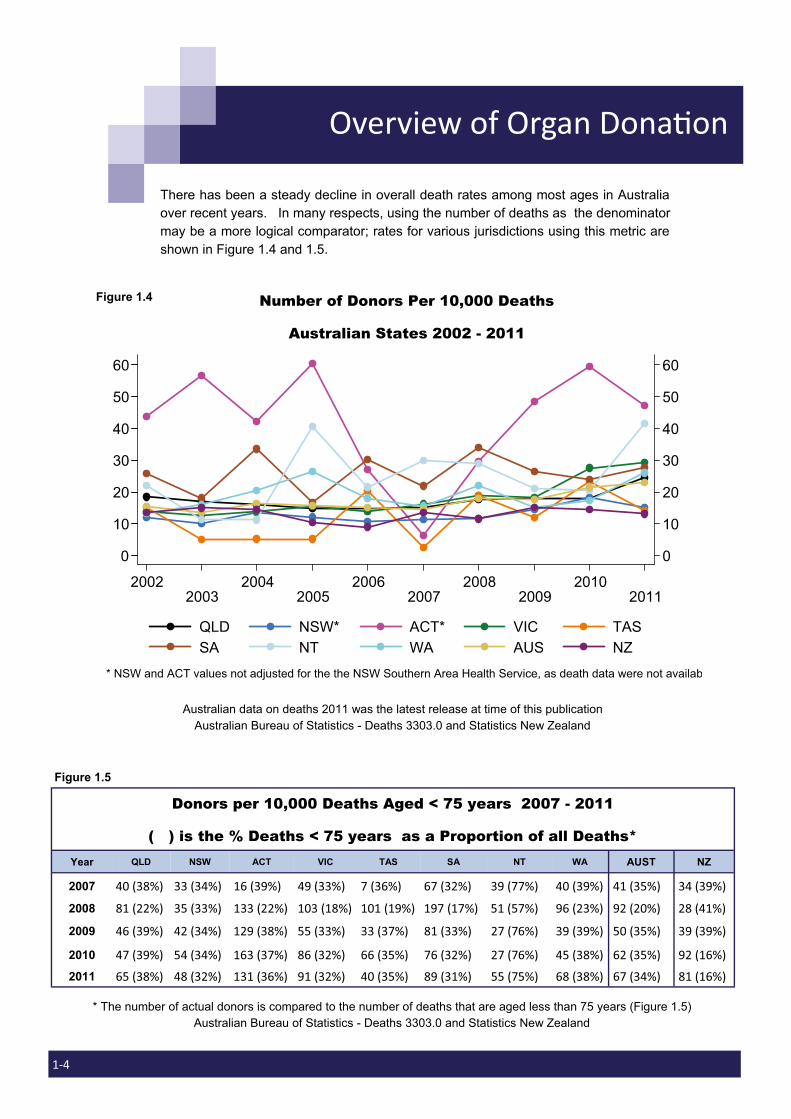
Figure 1.5
Donors per 10,000 Deaths Aged < 75 years 2007 - 2011
( ) is the % Deaths < 75 years as a Proportion of all Deaths* Year QLD NSW ACT VIC TAS SA NT WA AUST NZ
2007 40�(38%)� 33�(34%)� 16�(39%)� 49�(33%)� 7�(36%)� 67�(32%)� 39�(77%)� 40�(39%)� 41�(35%)� 34�(39%)�
2008 81�(22%)� 35�(33%)� 133�(22%)� 103�(18%)� 101�(19%)� 197�(17%)� 51�(57%)� 96�(23%)� 92�(20%)� 28�(41%)�
2009 46�(39%)� 42�(34%)� 129�(38%)� 55�(33%)� 33�(37%)� 81�(33%)� 27�(76%)� 39�(39%)� 50�(35%)� 39�(39%)�
2010 47�(39%)� 54�(34%)� 163�(37%)� 86�(32%)� 66�(35%)� 76�(32%)� 27�(76%)� 45�(38%)� 62�(35%)� 92�(16%)�
2011 65�(38%)� 48�(32%)� 131�(36%)� 91�(32%)� 40�(35%)� 89�(31%)� 55�(75%)� 68�(38%)� 67�(34%)� 81�(16%)�
0
10
20
30
40
50
60
0
10
20
30
40
50
60
20022003
20042005
20062007
20082009
20102011
QLD NSW* ACT* VIC TASSA NT WA AUS NZ
* NSW and ACT values not adjusted for the the NSW Southern Area Health Service, as death data were not availab
Number of Donors Per 10,000 Deaths2002 - 2012
Number of Donors Per 10,000 Deaths
Australian States 2002 - 2011
Figure 1.4
There has been a steady decline in overall death rates among most ages in Australia over recent years. In many respects, using the number of deaths as the denominator may be a more logical comparator; rates for various jurisdictions using this metric are shown in Figure 1.4 and 1.5.
* The number of actual donors is compared to the number of deaths that are aged less than 75 years (Figure 1.5) Australian Bureau of Statistics - Deaths 3303.0 and Statistics New Zealand
Australian data on deaths 2011 was the latest release at time of this publication Australian Bureau of Statistics - Deaths 3303.0 and Statistics New Zealand

1
1�5�
194
2
163
1
195
1
183
2
204
2
178
1
215
3
195
9
194
8
179
19
236
23
205
42
240
69
251
86
277
77
0
100
200
300
Num
ber
19981999
20002001
20022003
20042005
20062007
20082009
20102011
2012
Type of Organ Donor Australia, 1998 - 2012
DBD DCD
Overview�of�Organ�Dona�on�The change of organ donor rates over time is shown in Figure 1.6. Much of the in-crease in donor numbers has arisen from changes in rates of donors after circulatory death (DCD), demonstrated in Figure 1.7.
0
10
20
30
40
50
Per
Mill
ion
Pop
ulat
ion
19981999
20002001
20022003
20042005
20062007
20082009
20102011
2012
Year
Actual Donors
Total Recipients
Total Organs
Total Number of Organs, Recipients and DonorsPer Million Population, Australia
Figure 1.6 Total Number of Donors, Organs and Recipients
Per Million Population, Australia
Figure 1.7 Type of Organ Donor Australia, 1998 - 2012
1�6�
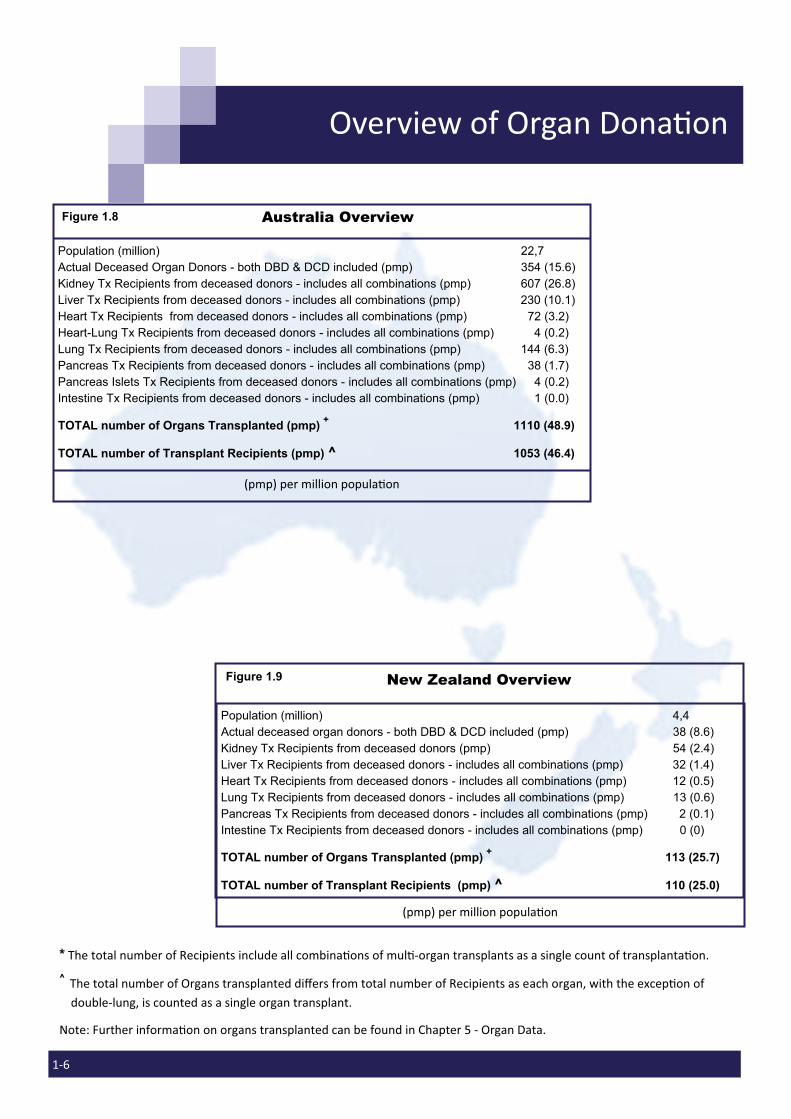
Australia Overview
Overview�of�Organ�Dona�on�
Figure 1.9 New Zealand Overview
Population (million) 4,4 Actual deceased organ donors - both DBD & DCD included (pmp) 38 (8.6) Kidney Tx Recipients from deceased donors (pmp) 54 (2.4) Liver Tx Recipients from deceased donors - includes all combinations (pmp) 32 (1.4) Heart Tx Recipients from deceased donors - includes all combinations (pmp) 12 (0.5) Lung Tx Recipients from deceased donors - includes all combinations (pmp) 13 (0.6) Pancreas Tx Recipients from deceased donors - includes all combinations (pmp) 2 (0.1) Intestine Tx Recipients from deceased donors - includes all combinations (pmp) 0 (0)
TOTAL number of Organs Transplanted (pmp) + 113 (25.7)
TOTAL number of Transplant Recipients (pmp) ^ 110 (25.0)
(pmp)�per�million�popula�on�
Figure 1.8
Population (million) 22,7 Actual Deceased Organ Donors - both DBD & DCD included (pmp) 354 (15.6) Kidney Tx Recipients from deceased donors - includes all combinations (pmp) 607 (26.8) Liver Tx Recipients from deceased donors - includes all combinations (pmp) 230 (10.1) Heart Tx Recipients from deceased donors - includes all combinations (pmp) 72 (3.2) Heart-Lung Tx Recipients from deceased donors - includes all combinations (pmp) 4 (0.2) Lung Tx Recipients from deceased donors - includes all combinations (pmp) 144 (6.3) Pancreas Tx Recipients from deceased donors - includes all combinations (pmp) 38 (1.7) Pancreas Islets Tx Recipients from deceased donors - includes all combinations (pmp) 4 (0.2) Intestine Tx Recipients from deceased donors - includes all combinations (pmp) 1 (0.0)
TOTAL number of Organs Transplanted (pmp) + 1110 (48.9)
TOTAL number of Transplant Recipients (pmp) ^ 1053 (46.4)
(pmp)�per�million�popula�on�
*�The�total�number�of�Recipients�include�all�combina�ons�of�mul��organ�transplants�as�a�single�count�of�transplanta�on.��
^ The�total�number�of�Organs�transplanted�di�ers�from�total�number�of�Recipients�as�each�organ,�with�the�excep�on�of�double�lung,�is�counted�as�a�single�organ�transplant.��
Note:�Further�informa�on�on�organs�transplanted�can�be�found�in�Chapter�5���Organ�Data.�
1
1�7�
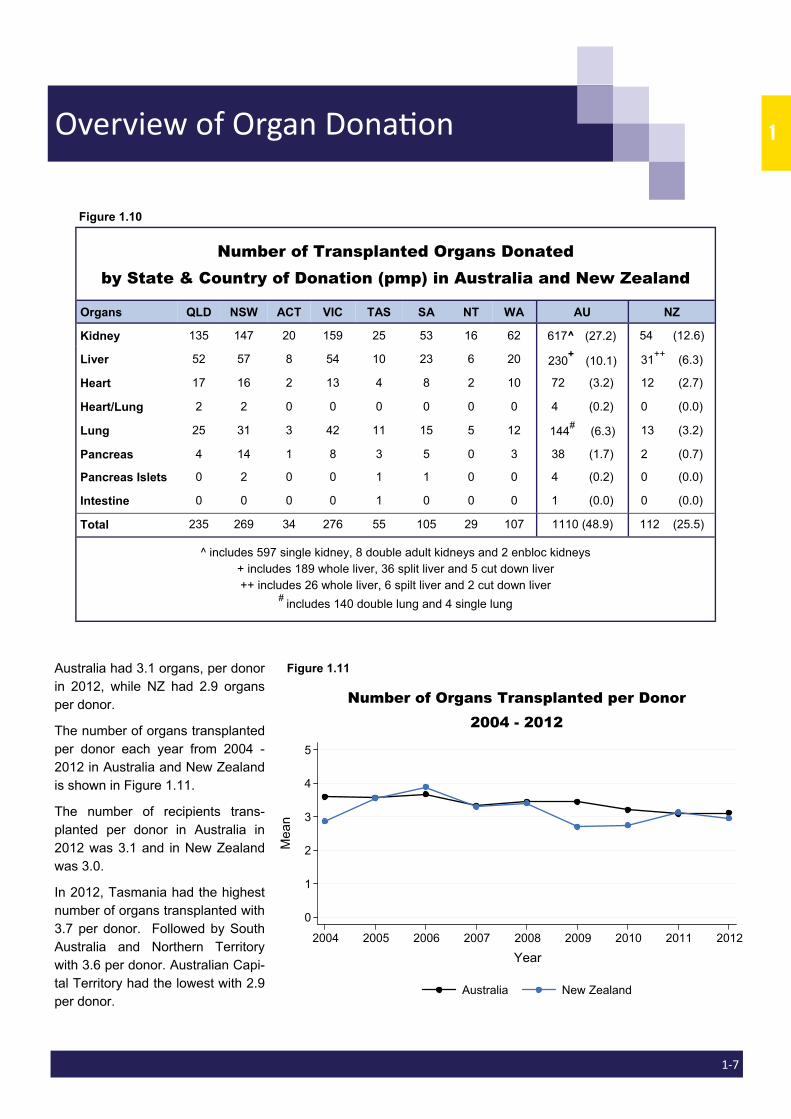
Figure 1.10
Number of Transplanted Organs Donated by State & Country of Donation (pmp) in Australia and New Zealand
Organs QLD NSW ACT VIC TAS SA NT WA AU NZ
Kidney 135 147 20 159 25 53 16 62 617^ (27.2) 54 (12.6)
Liver 52 57 8 54 10 23 6 20 230+ (10.1) 31++ (6.3)
Heart 17 16 2 13 4 8 2 10 72 (3.2) 12 (2.7)
Heart/Lung 2 2 0 0 0 0 0 0 4 (0.2) 0 (0.0)
Lung 25 31 3 42 11 15 5 12 144# (6.3) 13 (3.2)
Pancreas 4 14 1 8 3 5 0 3 38 (1.7) 2 (0.7)
Pancreas Islets 0 2 0 0 1 1 0 0 4 (0.2) 0 (0.0)
Intestine 0 0 0 0 1 0 0 0 1 (0.0) 0 (0.0)
Total 235 269 34 276 55 105 29 107 1110 (48.9) 112 (25.5)
^ includes 597 single kidney, 8 double adult kidneys and 2 enbloc kidneys + includes 189 whole liver, 36 split liver and 5 cut down liver ++ includes 26 whole liver, 6 spilt liver and 2 cut down liver
# includes 140 double lung and 4 single lung
0
1
2
3
4
5
Mea
n
2004 2005 2006 2007 2008 2009 2010 2011 2012
Year
Australia New Zealand
2004 - 2012
Australia had 3.1 organs, per donor in 2012, while NZ had 2.9 organs per donor.
The number of organs transplanted per donor each year from 2004 - 2012 in Australia and New Zealand is shown in Figure 1.11.
The number of recipients trans-planted per donor in Australia in 2012 was 3.1 and in New Zealand was 3.0.
In 2012, Tasmania had the highest number of organs transplanted with 3.7 per donor. Followed by South Australia and Northern Territory with 3.6 per donor. Australian Capi-tal Territory had the lowest with 2.9 per donor.
Figure 1.11
Number of Organs Transplanted per Donor 2004 - 2012
Overview�of�Organ�Dona�on�

1�8�
0
5
10
15
20
25
30
Per
Mill
ion
Pop
ulat
ion
1998
1999
2000
2001
2002
2003
2004
2005
2006
2007
2008
2009
2010
2011
2012
Year
Kidney Liver Heart
Heart-Lung Lung Pancreas
Pancreas Islets Intestine
Organs TransplantedPer Million Population, Australia
0
1
2
3
4
5
6
7
Per
Mill
ion
Pop
ulat
ion
1998
1999
2000
2001
2002
2003
2004
2005
2006
2007
2008
2009
2010
2011
2012
Year
Kidney Liver
Lung Pancreas
Organs Transplanted from Deceased DonorsPer Million Population, Australia
Figure 1.12 shows the organ-specific donor rates for Australia over the period 1998 - 2012. Figure 1.13 shows the corresponding rates for donors after circulatory death. The dominant outcome of these donors is on rates of kidney donation. Effects on liver and lung numbers are lesser.
Figure 1.12
Figure 1.13 Organs Transplanted from DCD Donors Per Million Population, Australia
Organs Transplanted Per Million Population, Australia
Overview�of�Organ�Dona�on�

1
1�9�
Figure 1.14
Location of Postcodes of Deceased Donors 2008 - 2012
Postcode QLD NSW ACT VIC TAS SA NT WA AUST
Metropolitan 132 (46%) 267 (70%) 30 (70%) 298 (70%) 1 (2%) 116 (68%) 1 (5%) 88 (62%) 943 (62%)
Overseas 6 (2%) 4 (1%) 1 (2%) 5 (1%) 1 (2%) 2 (1%) 1 (5%) 0 (0%) 20 (1%)
Total 289 380 43 426 44 171 19 134 1506
Inner Regional 88 (30%) 85 (22%) 9 (21%) 105 (25%) 23 (52%) 27 (16%) 1 (5%) 29 (22%) 367 (24%)
Rural 12 (4%) 1 (<1%) 0 (0%) 0 (0%) 1 (2%) 3 (2%) 7 (37%) 8 (6%) 32 (2%)
Outer Regional 51 (18%) 23 (6%) 3 (7%) 18 (4%) 18 (41%) 23 (13%) 9 (47%) 9 (7%) 154 (10%)
Whilst the number of deceased donors are previously shown based on the state /territory and country location in which they died, Figure 1.14 shows a more detailed breakdown by number and the proportion of donors by re-moteness category within the state/territory. “Overseas” refers to donors who usually reside outside of Australia and New Zealand. The Australian Bureau of Statistics has a standardised remoteness structure known as the Ac-cessibility/Remoteness Index of Australia (ARIA). Details are at http://www.abs.gov.au/websitedbs/D3310114.nsf/home/remoteness+structure#Anchor2b.
Appendix 1 shows a more detailed breakdown of the number of donors from the donating hospitals.
In the last five years (2008-2012) there have been 20 deceased donors who were visitors to Australia. In 2012, there were six donors from overseas in Australia, three donated from Victo-ria, two from Queensland and one in New South Wales.
There were no overseas donors in New Zealand in 2012.
The Registry does not consider organs donated in Australia and transplanted in New Zealand as an overseas donor for New Zealand, nor organs donated in New Zealand and transplanted in Australia as an overseas donor for Australia.
Overview�of�Organ�Dona�on�

1�10�
This�page�is�inten�onally�blank�