orchestra facts: 2006-2014 - nea · orchestra facts: 2006-2014 a study of orchestra finances and...
TRANSCRIPT

Orchestra Facts: 2006-2014 A Study of Orchestra Finances and Operations, Commissioned by the League of American Orchestras
By Dr. Zannie Giraud Voss, Director, SMU National Center for Arts Research
Dr. Glenn B. Voss, Research Director, SMU National Center for Arts Research
Dr. Karen Yair, Vice President, Knowledge Center, League of American Orchestras
With Kristen Lega, SMU MA/MBA Class of ’16
NOVEMBER 2016
This project was supported in part by an award from the Research: Art Works program at the National Endowment for the Arts: Grant #13-3800-7015.
Additional funding was provided by a generous grant from The Andrew W. Mellon Foundation, and by public funds from the New York City Department of Cultural Affairs in partnership with the City Council.
MAW F

Orchestra Facts l 2
1. Introduction . . . . . . . . . . . . . . . . . . . . . . . . . . . . . . . . . . . . . . . . . . . . . 3
2. Summary of Key Findings . . . . . . . . . . . . . . . . . . . . . . . . . . . . . . . . . . 4
3. Scope of Orchestra Activity . . . . . . . . . . . . . . . . . . . . . . . . . . . . . . . . 6
4. Orchestra Performance Activity and Participation . . . . . . . . . . . . . . 7
Spotlight on Education and Community Engagement (EdCE) Programs . . 8
5. Orchestra Finances . . . . . . . . . . . . . . . . . . . . . . . . . . . . . . . . . . . . . . 10
5.1. Income . . . . . . . . . . . . . . . . . . . . . . . . . . . . . . . . . . . . . . . . . . . . . . . 10
5.1.1. Earned Income . . . . . . . . . . . . . . . . . . . . . . . . . . . . . . . . . . . . . . . . 10
Spotlight on Income from Ticket Sales and Subscriptions. . . . . . . . 11
Spotlight on Other Earned Income . . . . . . . . . . . . . . . . . . . . . . . . . 11
5.1.2. Contributed Income . . . . . . . . . . . . . . . . . . . . . . . . . . . . . . . . . . . . . 12
5.1.3. Investment Income . . . . . . . . . . . . . . . . . . . . . . . . . . . . . . . . . . . . . 14
5.2. Expenses . . . . . . . . . . . . . . . . . . . . . . . . . . . . . . . . . . . . . . . . . . . . . 15
5.3. Change in Total and Unrestricted Net Assets . . . . . . . . . . . . . . . . . 17
5.4. Balance Sheet . . . . . . . . . . . . . . . . . . . . . . . . . . . . . . . . . . . . . . . . . 18
6. Conclusions . . . . . . . . . . . . . . . . . . . . . . . . . . . . . . . . . . . . . . . . . . . . 20
7. Appendix: Tables . . . . . . . . . . . . . . . . . . . . . . . . . . . . . . . . . . . . . . . . 21
8. Technical Notes . . . . . . . . . . . . . . . . . . . . . . . . . . . . . . . . . . . . . . . . . 25
9. Acknowledgments . . . . . . . . . . . . . . . . . . . . . . . . . . . . . . . . . . . . . . . 27
10. About the League of American Orchestras . . . . . . . . . . . . . . . . . 29
Table of Contents
© Copyright 2016 League of American Orchestras
The opinions expressed in this paper are those of the author(s) and do not represent the views of the Office of Research & Analysis or the National Endowment for the Arts. The NEA does not guarantee the accuracy or completeness of the information included in this report and is not responsible for any consequence of its use.
Orchestra Facts l 3
Introduction
As orchestras navigate the rapid and profound changes coursing through American society, they are redoubling their efforts to serve their communities through the orchestral experience. In this changing context, orchestras are acquiring new knowledge and information to better illuminate the past and inform action for the future. While each orchestra has its own unique story to tell, and is subject to the influence of local conditions, the type of field-wide data this report provides is essential to any serious attempt at analysis, understanding, debate, and action.
Orchestra Facts: 2006-2014 is the first in what will become a regularly published and publicly available series of longitudinal reports commissioned by the League of American Orchestras. Drawing on multiple data sources, it looks back over a nine-year period from 2006 to 2014 to tell the story of orchestra finances and operations through the recession years and beyond. The robust analysis it presents will help to shape public dialogue around the role of orchestras, as well as inform the work of orchestras themselves.
The report provides a new breadth of data and a statistically sound approach to analysis, incorporating current year and trend panel analyses that draw on the following data sets:
• The NCAR dataset, which incorporates Internal Revenue Service (IRS) Form 990 and DataArts (formerly Cultural Data Project) data. This dataset, along with data from the League’s Orchestra Statistical Report, provides topline operating and financial information for the 1,224 orchestras supplying data for the financial year 2013-2014, as well as for a trend panel of 547 orchestras supplying data every year from 2006 to 2014.
• The League’s own annual Orchestra Statistical Report (OSR), which provides more detailed operating and financial information for the 107 orchestras supplying data for the financial year 2013-2014, as well as for a trend panel of 65 orchestras supplying data every year from 2010 to 2014.
• A supplemental League education and community engagement (EdCE) data set, which provides detailed information about the EdCE work undertaken during the financial year 2013-14, as reported on by 98 League member orchestras participating in a dedicated EdCE survey.
Please refer to the Technical Notes on page 25, which provides more detail about these datasets.
Orchestra Facts: 2006-2014 was commissioned by the League of American Orchestras from Dr. Zannie Voss and colleagues from the National Center for Arts Research (NCAR) at Southern Methodist University. With the permission of Theatre Communications Group, Dr. Zannie Voss’s work is modelled after Theatre Communications Group’s Theatre Facts, a report on the state of the U.S. nonprofit professional theatre field that has been published by TCG and made public for over three decades. The authors are grateful to Theatre Communications Group for sharing its report template with the orchestra field.

2. Summary of Key Findings
Orchestra Facts l 4
Here are the key findings of the report. Below, we indicate the data source associated with each finding in brackets. Please refer to the Technical Notes on page 25 for details. Throughout the report, we report on changes in figures over time after having adjusted them for inflation.
Scope of the Orchestra Field
• In 2014, there were 1,224 U.S. orchestras, distributed widely across all 50 states (NCAR and OSR).
• In the same year, the orchestra field contributed $1.8 billion to the U.S. economy in direct payments for goods and services (NCAR and OSR).
• Two out of every three orchestras operated with annual expenses budgets of under $300,000, in 2014 (NCAR and OSR).
• Larger-budget orchestras produced the highest output: the 2% of orchestras with budgets exceeding $20 million accounted for 20% of all performances, events, and other activities in 2014 (NCAR and OSR).
Orchestra Performance Activity and Participation
• Orchestras across the U.S. produced 28,000 performances, activities, and other events in 2014, attracting a total audience of nearly 25 million (NCAR and OSR).
• Overall, audiences declined by 10.5% between 2010 and 2014 (OSR), broadly in line with other performing arts sectors (NCAR). This decline was sharpest within tour audiences, which decreased by almost 50% over the five-year period. In contrast, audiences for classical series concerts declined by 5.5%, corresponding roughly to a 3% decline in the number of classical series performances offered.
• In 2014, free attendance at orchestra performances, activities, and other musical events was at its highest point in the previous five-year period, and the lowest ticket prices offered were at their cheapest and most affordable level (OSR).
• In 2014, the 98 orchestras in our sample delivered almost 19,000 Education and Community Engagement performances, musical activities, and other events, deepening the experience of orchestral music for communities who would typically not otherwise engage with the symphony. Eighty-five percent of these events took place outside of the concert hall, including the 60% of the total that took place in schools (EdCE survey).
• In 2014, 2.1 million people participated in the 19,000 Education and Community Engagement performances, musical activities, and events delivered by the 98 orchestras in our sample. Thirty-eight percent of these participants were identified as African American, Hispanic / Latino, Asian American / Pacific Islander, or American Indian / Alaskan Native, while 62% were identified as white. Almost two thirds (62%) participated free of charge (EdCE survey).
Orchestra Finances
• Across League member orchestras, 40% of total income in 2014 was classified as earned income, 43% as con-tributed income, and 17% as investment income (OSR).
• Earned income:
• Three quarters of all earned income in 2014 was generated from performance and performance-related activities (OSR).
• 2013 was a moment of transition in ticket buying, as single ticket revenues and group sales exceeded subscription revenues for the first time. However, the reported 6% growth in single ticket revenue and income from group sales did not fully compensate for the reported 13% drop in subscription revenues (OSR).
Orchestra Facts l 5
• The subscription model remained important to audiences as well as to orchestras themselves: nearly 1.4 million people subscribed in 2014 (NCAR and OSR). And importantly, we actually see an 18% growth increase in the number of households subscribing over time, even though spend per subscriber decreased (OSR).
• Contributed Income:
• Contributed income remained relatively stable over time, across the field as a whole and through the recession years (NCAR and OSR).
• Individual (trustee and non-trustee) donors were found to be the cornerstone of orchestras’ contributed income, giving almost half of the field’s contributed funds in 2014. The broad base of community support for — and appreciation of — the orchestra’s work is demonstrated by the large number of small gifts made by individuals: in 2014, around 75% of the gifts made by non-trustee individuals were under $250 (OSR).
• Investment Income:
• Investment income fluctuated in line with macro-economic trends, dipping significantly during the recession’s trough in 2009 and again during the 2012 downturn, but recovering by 2014 (NCAR and OSR).
• In 2014, larger-budget orchestras met a greater percentage of their annual operating expenses from endowment earnings than did smaller-budget orchestras (OSR).
• Expenses:
• Artistic pay and benefits1 were by far the greatest expenses incurred by orchestras in 2014, accounting for more than 46% — nearly half — of the average budget (OSR), a higher proportion than any other arts and cultural sector (NCAR).
• Eleven percent of expenses were dedicated to orchestra administrators’ pay and benefits2
in the same year (OSR).
• Cutting the data another way, orchestras’ concert production expenses3 accounted for over two thirds — 69% — of all orchestra expenditure in 2014 (OSR).
• Change in Total and Unrestricted Net Assets:
• Change in Total Net Assets:
• The orchestra field’s Change in Total Net Assets — or “bottom line” (defined as the difference between total income4 and total expenses) — fluctuated over time, following changes in investment income caused by the 2009-2012 recession (NCAR and OSR).
• Despite these fluctuations, the overall Change in Total Net Assets improved by 46% between 2006 and 2014 (NCAR and OSR).
• Change in Unrestricted Net Assets (CUNA):
• When we narrow our focus to examine CUNA (defined as the difference between unrestricted income and total expenses), we see a welcome drop in the proportion of orchestras reporting deficits (from 40% in 2010 to 18% in 2014). (OSR).
• Within the same time period, average CUNA across the field increased thirteen fold, driven by those few orchestras reporting exceptional income from interest and dividends, endowment earnings, and capital gains / losses. At the same time, three out of four orchestras reported at least one year of negative CUNA (OSR).
• Our analysis shows that investments play a critical role in keeping orchestras in the black (OSR).
• Balance Sheet:
• Total asset value rose by 4% between 2006 and 2014, indicating overall stability, and liabilities decreased by 7.5%, having peaked at the recession’s height. Consequently, net assets grew at a rate exceeding inflation by 6.6% (NCAR and OSR).
• Restricted net assets were concentrated among the larger-budget orchestras (OSR).
• Working capital was found to be strongest among the smaller-budget orchestras (OSR).
1 The artistic costs noted here include all payments made to all musicians, conductors, teaching artists and guest artists, regardless of the contractual basis for their work, and including those engaged in developing or delivering EdCE programs.
2 The administrator costs here include only those payments made to administrative staff on payroll. They do not include pay and / or benefits allocated to contracted staff.
3 The orchestra production costs reported here include artistic and production pay and benefits, general concert production expenses, and hall expenses.4 The total income figures here include both restricted and unrestricted income.

Orchestra Facts l 6
Our data tells the story of a field with enormous breadth and impact within American communities.
Figure 1 shows the locations of the 1,224 orchestras identified by our analysis of combined IRS, DataArts, and OSR data. Distributed widely across all 50 states, these orchestras participate in and help to shape the cultural life of each community they serve.
Orchestras across the U.S. produced an estimated 28,000 performances, activities, and other events in 2014, attracting a total audience of 25 million people.5
Together, the 1,200+ orchestras contributed $1.8 billion to the U.S. economy in direct payments for goods and services in 2014, as well as indirectly fueling the economy through related expenditures by audiences, in communities of all sizes.
The majority — two out of every three orchestras — operated with annual expenses under $300,000, in 2014. Those with budgets exceeding $20 million — representing 2% of all orchestras — accounted for 58% of all expenses, and produced 20% of the field’s performances, events, and other activities.
Regardless of size, each orchestra reflects the unique characteristics and capacities of the community it serves, with artistic offerings scaled to local needs.
FIGURE 1
Cluster Map of U.S. Symphony Orchestra Locations (2014)
3. Scope of Orchestra Activity
5 The performance and attendance statistics found here are based on extrapolations from OSR and CDP data to the total number of U.S. orchestras with annual expenses of $50,000 or more reporting to the IRS.
DENVER
LOS ANGELES
SAN DIEGO
SAN JOSE
LAS VEGAS
PHOENIX
TUSCON
EL PASO
OKLAHOMA CITY
DALLAS
AUSTIN
SAN ANTONIO
HOUSTON
MEMPHIS
NASHVILLE
INDIANAPOLIS
COLUMBUSWASHINGTON
BALTIMORE
PHILADELPHIA
NEW YORK
BOSTON
DETRIOTMILWAUKEE
CHICAGO
CHARLOTTE
JACKSONVILLE
FORT WORTH
ALBUQUERQUE
SAN FRANCISCO
SEATTLE
PORTLAND
Orchestras in the U.S.
5 3 1 (count)
DATA SOURCE: NCAR

Orchestra Facts l 7
The widely reported decline in performing arts audiences in recent years has affected orchestras, but the factors influencing this decline are complex, and go beyond simple measures of demand. Over the same time period, the symphony has become more accessible to a wider range of people, with the average ticket prices dropping, free attendance rising, and orchestras engaging large and diverse audiences through a range of education and community engagement programming.
Performance Activity and Participation Snapshot
Collectively, orchestras across the U.S. produced an estimated 28,000 performances, events, and other activities in 2014, attracting a total audience of 25 million in 2014.6 For League member orchestras that participated in the OSR, almost half of all offerings — an estimated 42% — took the form of education and community engagement (EdCE) activities,7 clearly demonstrating the field’s commitment to connecting with the communities it serves.
Performance Activity and Participation Trends
Approximately one in four performances, musical activities, and events offered by League member orchestras was delivered free of charge to audiences and participants, each year from 2010 to 2014.8 Opportunities for audiences to attend both EdCE events and symphony performances for free increased over the five-year period. Indeed, by 2014, 15% of all audience
members for “core performances” (a term used to refer to all performances excluding those given on tour or within the orchestra’s EdCE programs) were attending without charge.
Over the same time period, the cost of attending paid-for orchestra performances became more accessible to a wider public. Specifically, League member orchestras dropped the price of their most expensive tickets9 by 30% between 2010 and 2014, and that of their least expensive tickets by 12%, on average.
Despite this drop in ticket prices — but broadly in line with other performing arts sectors10 — 60% of the 65 League member orchestras reporting data to the OSR reported a drop in overall attendance, between 2010 and 2014 (see Figure 2).
This decline in attendance between 2010 and 2014 — which amounted to 10.5% overall — was sharpest within tour performance audiences, which fell by almost 50% during the five-year period. In contrast, attendance at
4. Orchestra Performance Activity and Participation
6 The performance and attendance statistics given here are based on extrapolations from OSR and CDP data to the total number of U.S. orchestras with annual expenses of $50,000 or more reporting to the IRS.
7 Education and community engagement (EdCE) activities range from workshops and community ensembles to family concerts and talks, with a focus on deepening the experience of orchestra music and engaging communities – especially young people – who would not otherwise engage with the symphony. The percentage reported here may under-represent the proportion of EdCE performances, activities and events relative to orchestras’ other programming (which consists of series and non-series performances, tours and presentation / impresario activities), due to data anomalies in the pre-2015 Orchestra Statistical Report, which categorizes family series concerts and affiliated youth orchestra programs separately from EdCE work, and does not include the work of independent youth orchestras.
8 The percentage reported here includes all EdCE programming. 9 The average ticket prices referred to here represent all tickets excluding EdCE and tour performances. 10 National Center for Arts Research, Edition 3, smu.edu/artsresearch (http://mcs.smu.edu/artsresearch2014/reports/marketing-impact/how-much-total-
marketing-investment-does-it-take-bring-one-person-first#/averages/arts-sector)
Orchestra Facts l 8
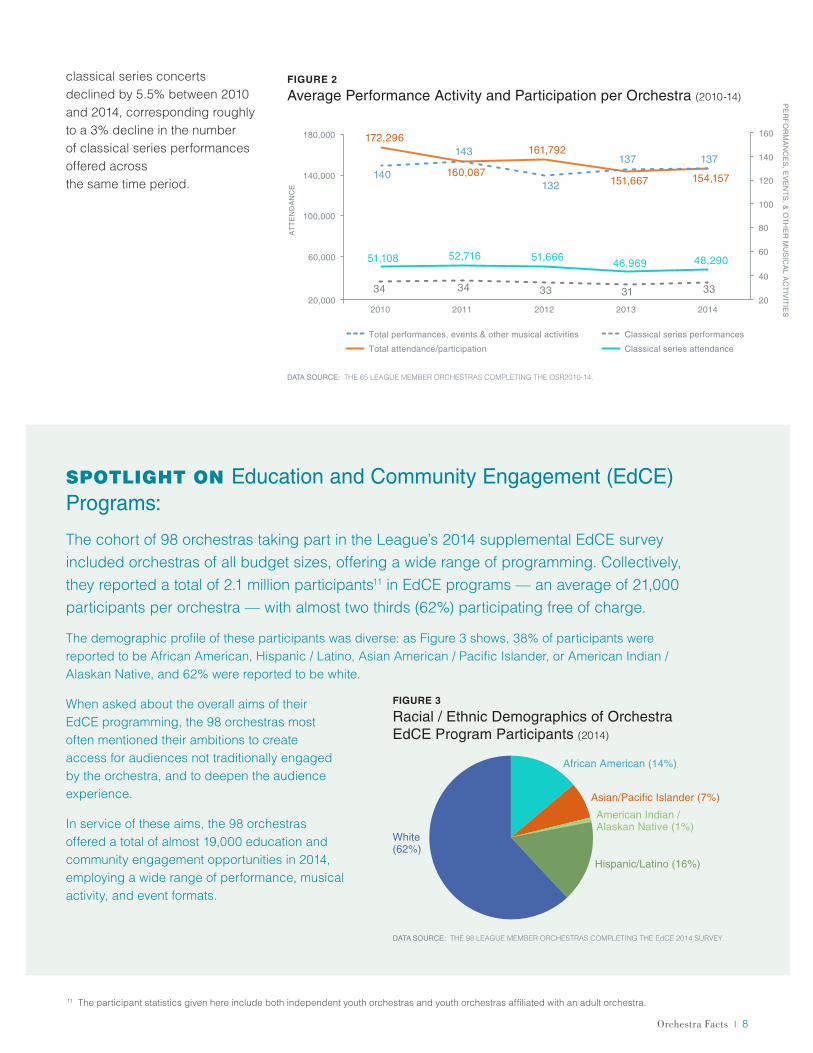
classical series concerts declined by 5.5% between 2010 and 2014, corresponding roughly to a 3% decline in the number of classical series performances offered across the same time period.
SPOTLIGHT ON Education and Community Engagement (EdCE) Programs:
The cohort of 98 orchestras taking part in the League’s 2014 supplemental EdCE survey included orchestras of all budget sizes, offering a wide range of programming. Collectively, they reported a total of 2.1 million participants11 in EdCE programs — an average of 21,000 participants per orchestra — with almost two thirds (62%) participating free of charge.
The demographic profile of these participants was diverse: as Figure 3 shows, 38% of participants were reported to be African American, Hispanic / Latino, Asian American / Pacific Islander, or American Indian / Alaskan Native, and 62% were reported to be white.
When asked about the overall aims of their EdCE programming, the 98 orchestras most often mentioned their ambitions to create access for audiences not traditionally engaged by the orchestra, and to deepen the audience experience.
In service of these aims, the 98 orchestras offered a total of almost 19,000 education and community engagement opportunities in 2014, employing a wide range of performance, musical activity, and event formats.
20,000
60,000
100,000
140,000
180,000
20
40
60
80
100
120
140
160
2010
AT
TE
ND
AN
CE
2011 20142012
PE
RF
OR
MA
NC
ES
, EV
EN
TS
, & O
TH
ER
MU
SIC
AL A
CT
IVIT
IES2013
Total attendance/participation
Classical series performances
Classical series attendance
Total performances, events & other musical activities
154,157151,667
161,792
160,087
172,296
48,29046,96951,66652,71651,108
137137
132
143
140
33333434 31
DATA SOURCE: THE 65 LEAGUE MEMBER ORCHESTRAS COMPLETING THE OSR2010-14.
FIGURE 2
Average Performance Activity and Participation per Orchestra (2010-14)
11 The participant statistics given here include both independent youth orchestras and youth orchestras affiliated with an adult orchestra.
African American (14%)
Asian/Pacific Islander (7%)
American Indian / Alaskan Native (1%)
Hispanic/Latino (16%)
White(62%)
FIGURE 3
Racial / Ethnic Demographics of Orchestra EdCE Program Participants (2014)
DATA SOURCE: THE 98 LEAGUE MEMBER ORCHESTRAS COMPLETING THE EdCE 2014 SURVEY.

Orchestra Facts l 9
Roughly one third of these opportunities took the form of performances, with the remaining two thirds ranging from audience enhancement activities such as opportunities to meet musicians or explore instruments (offered by 83% of all respondents), to talks and lectures (offered by 73%) and online learning opportunities (offered by 10%): see Figure 4.
Opportunities for community members to advance their own musical learning also featured strongly, with around half of the 98 orchestras profiled offering either instrumental instruction, “side by side” performance opportunities or awards for young artists, as well as opportunities to take part in youth orchestras and ensembles.
EdCE programs also supported the creation of new orchestral repertoire, embedded in the communities served by orchestras: in 2014, 21% of EdCE survey respondents reported offering composition workshops, while 14% ran a composer-in-residence program of one week or longer.
Orchestras were working in meaningful partnerships with schools and community organizations, with the significant majority taking their work to venues located within the communities they serve. Indeed, in 2014, 85% of all EdCE sessions took place outside of the concert hall, with 73% taking place in schools and 27% in other community settings. In many cases, these sessions were enhanced by professional development activities that helped to build music capacity in schools by engaging school staff as well as musicians and teaching artists (see Figure 5).
The scale and range of orchestras’ EdCE programming varied greatly and was influenced by budget size. Taking an average of the 98 orchestras in our cohort, artistic costs12 accounted for 45% of all EdCE expenses, with the remainder allocated to EdCE administrative personnel costs (20%) and non-personnel expenses (35%).
Average total income (per orchestra) associated with the EdCE programs was roughly $614,000, for each of the 98 orchestras in our cohort. Of this, on average 19.5% was earned program income (including EdCE program contract fees), 61% was contributed, and 19.5% was income generated by endowments restricted for education activity and other sources.
12 The artistic costs here include all payments made to all musicians, conductors, teaching artists, and guest artists engaged in developing or delivering EdCE programs, regardless of the contractual basis for their work.
Performance (31%)
Other musical activities and events (69%)
FIGURE 4
EdCE Activity Types (2014)
DATA SOURCE: THE 98 LEAGUE MEMBER ORCHESTRAS COMPLETING THE EdCE 2014 SURVEY
FIGURE 5
Breakout of EdCE Venues (2014)
Sessions held in venues other than concert halls (85%)
Sessions held in home concert halls (15%)
School (K-12) (73% of all venues)
Other community venues (27% of all venues)
DATA SOURCE: THE 98 LEAGUE MEMBER ORCHESTRAS COMPLETING THE EdCE 2013-14 SURVEY
Orchestra Facts l 10
5.1. Income
Like most nonprofits, orchestras derive their income from three major sources: earned income, contributed income, and investment income.
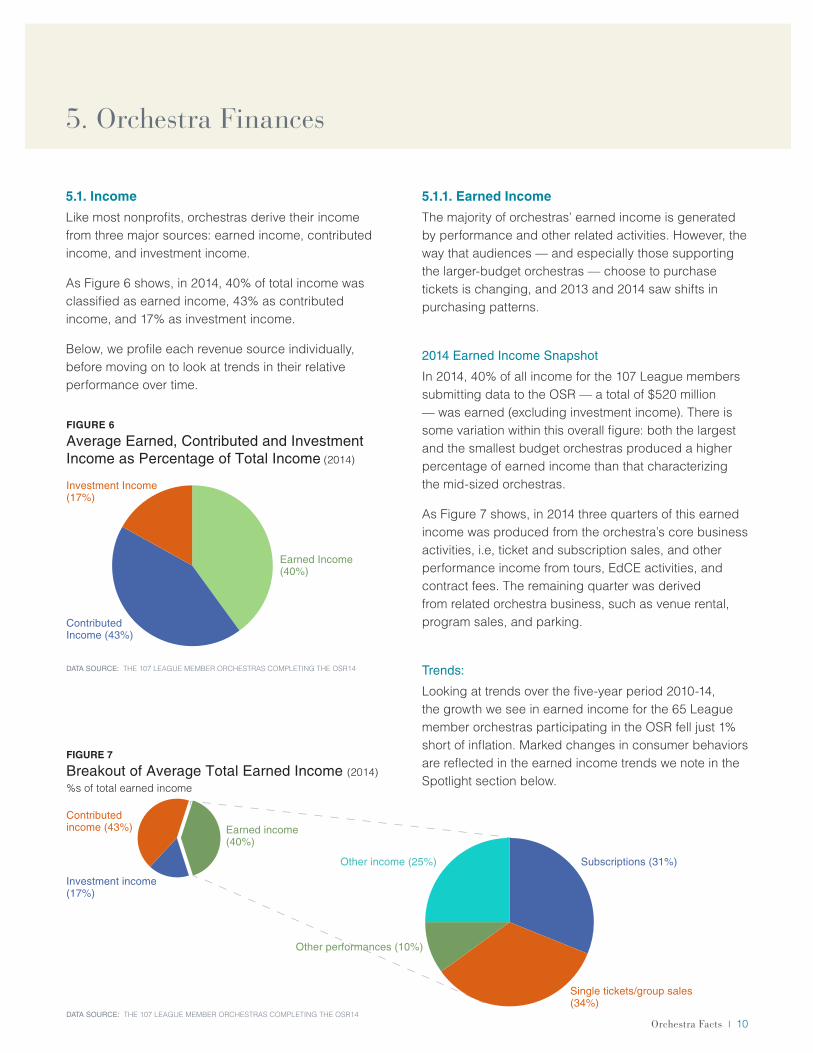
As Figure 6 shows, in 2014, 40% of total income was classified as earned income, 43% as contributed income, and 17% as investment income.
Below, we profile each revenue source individually, before moving on to look at trends in their relative performance over time.
5.1.1. Earned Income
The majority of orchestras’ earned income is generated by performance and other related activities. However, the way that audiences — and especially those supporting the larger-budget orchestras — choose to purchase tickets is changing, and 2013 and 2014 saw shifts in purchasing patterns.
2014 Earned Income Snapshot
In 2014, 40% of all income for the 107 League members submitting data to the OSR — a total of $520 million — was earned (excluding investment income). There is some variation within this overall figure: both the largest and the smallest budget orchestras produced a higher percentage of earned income than that characterizing the mid-sized orchestras.
As Figure 7 shows, in 2014 three quarters of this earned income was produced from the orchestra’s core business activities, i.e, ticket and subscription sales, and other performance income from tours, EdCE activities, and contract fees. The remaining quarter was derived from related orchestra business, such as venue rental, program sales, and parking.
Trends:
Looking at trends over the five-year period 2010-14, the growth we see in earned income for the 65 League member orchestras participating in the OSR fell just 1% short of inflation. Marked changes in consumer behaviors are reflected in the earned income trends we note in the Spotlight section below.
5. Orchestra Finances
FIGURE 6
Average Earned, Contributed and Investment Income as Percentage of Total Income (2014)
DATA SOURCE: THE 107 LEAGUE MEMBER ORCHESTRAS COMPLETING THE OSR14
Earned Income (40%)
Investment Income (17%)
ContributedIncome (43%)
FIGURE 7
Breakout of Average Total Earned Income (2014)%s of total earned income
Other income (25%)
Other performances (10%)
Earned income(40%)
Investment income (17%)
Contributedincome (43%)
Single tickets/group sales (34%)
Subscriptions (31%)
DATA SOURCE: THE 107 LEAGUE MEMBER ORCHESTRAS COMPLETING THE OSR14

Orchestra Facts l 11
SPOTLIGHT ON Income from Ticket Sales and Subscriptions:
The year 2013 saw a transition in ticket buying, as average income from single ticket and group sales surpassed average subscription income for the first time, for the 65 League member orchestras completing the OSR each year between 2010 and 2014. This new reality became yet more pronounced in 2014, with an even larger spread between average subscription income and average single ticket / group sales income. Most notably, the percentage of group sales increased — on average — by almost 21% between 2010 and 2014.
The growth in income from single tickets and group sales exceeded inflation by just over 6% between 2010 and 2014, but did not fully compensate for a 13% drop in subscription revenue reported by the 65 League member orchestras reporting to the OSR over this five-year period.
This decline in subscription revenues is concerning, but at the same time, growth in the number of subscriber households remains strong: in effect, more households are collectively purchasing fewer subscription concerts. Specifically, the number of households subscribing to League member orchestras increased by 18% between 2010 and 2014, while in 2014 the percentage of new subscribers stood at 23%, and the subscriber renewal rate held steady over time at 77%. As a result, across the orchestra field as a whole,13 we estimate that almost 1.4 million people subscribed to orchestra season tickets in 2014.
The decline in subscription spend per person indicates a shift in audience appetites, which extends also to an emerging preference for flexible subscription packages over the traditional, fixed subscription. Choose-your-own subscriptions produced income growth of 13% above inflation between 2010 and 2014 for League member orchestras, as income from fixed subscriptions fell by almost 15% below inflation.
These trends — towards decreased spending by a higher number of subscribers, and also towards a preference for flexible subscription packages — are concentrated within the larger-budget orchestras: those League member orchestras with annual expenses of under $2 million continued to derive more revenue from subscriptions than from single tickets and group sales in 2014. Other research14 commissioned by the League of American Orchestras explores the complexities of these shifts in audience preference —as well as strategies for engaging with them — in depth.
SPOTLIGHT ON Other Earned Income:To close our analysis of earned income, we note the significance of non-performance revenues produced by activities including rentals, parking, music school and youth orchestra registration and participation fees, presentation / impresario activities, and printed program sales. These activities collectively represented almost one quarter (24%) of orchestras’ earned income in 2014, with evidence of growth across the period 2010-2014.
The income generated by presentation / impresario activities, where the orchestra contracts a third party to produce a performance, showed robust growth for League member orchestras, outpacing inflation by more than 25% during the five-year period 2010-2014. This kind of entrepreneurial revenue diversification within orchestras’ core business is a strength of the field, and an area of potential future growth.
13 The subscriber estimates given here employ NCAR and OSR data.14 “Reimagining the Orchestra Subscription Model” (2015), a study by Oliver Wyman, commissioned by the League of American Orchestras:
http://www.americanorchestras.org

Orchestra Facts l 12
5.1.2. Contributed Income
Contributed income weathered the recession robustly, with orchestras retaining a broad base of financial support from the communities they served in the period 2006-2014.15 Orchestra trustees provide substantial and growing support, balanced by the large volume of donations made by other (non-trustee) individuals, while special events proved an area of particular income growth.
2014 Contributed Income Snapshot:
In 2014, 43% of all League member orchestra income was provided by contributed revenue16 sources, a total of $569 million. As Figure 8 shows, this total was made up of a variety of contributed streams. In 2014, foundations provided 13% of the field’s contributed income to League member orchestras, and corporations provided 10%. Government sources provided a further 7% of League member orchestras’ total contributed income, covering 3% of their annual expenses.
Looking in more detail at government funding, we see that local government made a more substantial overall contribution to the contributed revenue of League member orchestras in 2014 than either Federal or State Government, albeit supporting a smaller number of orchestras.17 Specifically, local government sources provided 3% of all League member orchestras’ total contributed revenue (covering 1.5% of their total expenses); state sources provided just under 3% (covering 1% of total expenses) and federal sources provided 1% (covering 0.5% of total expenses). Local government support — which was split almost equally between city governments and county governments or local boards of education, with a slight bias towards the former — was extended to 75% of all orchestras; whereas 94% of all orchestras received state funding.
15 Following IRS 990 data conventions, this longer-term view includes contributions that were unrestricted (and therefore available for immediate use), temporarily restricted (and therefore unavailable until a point in time specified by the donor or grantmaker), or permanently restricted (e.g., endowment gifts), whereas the findings broken out by giving source reflect unrestricted contributions only.
16 The contributed revenue figure given here includes the release of contributions and grants raised earlier for current year activities (known as Net Assets Released from Restriction).
17 The OSR data includes two Canadian orchestras and one significant U.S. outlier.
FIGURE 8
Breakout of Average Contributed Income (2014)
%s of total contributed income
DATA SOURCE: THE 107 LEAGUE MEMBER ORCHESTRAS COMPLETING THE OSR14
United arts funds (2%)
Volunteer associations (2%)
Trustees (11%)
Corporations (10%)
Individuals (35%)
Foundations (13%)
Special events and projects (10%)
In-kind contributions (5%)
Other contributions (4%)
Government (7%)
Earnedincome (40%)
Contributed income (43%)
Investmentincome (17%)
Orchestra Facts l 13
Trends:
Contributed income remained relatively stable over time, across the field as a whole, regardless of orchestra budget size and whether or not restricted gifts — which were made previously, and are not available to the orchestra in the current year — are included in our analysis.
Examining trends for the entire orchestra field over the nine-year period 2006-14, using NCAR and OSR data, we see that the recession affected contributed income far less than other income streams. Indeed, although contributed income dipped overall during the period 2008-2011, by 2014 it had recovered and exceeded its 2006 levels by almost 13%.18
Narrowing our focus to the more detailed data provided by our cohort of 65 League member orchestras — over the five-year period 2010-14 — allows us to pinpoint where this growth in contributed income has occurred.
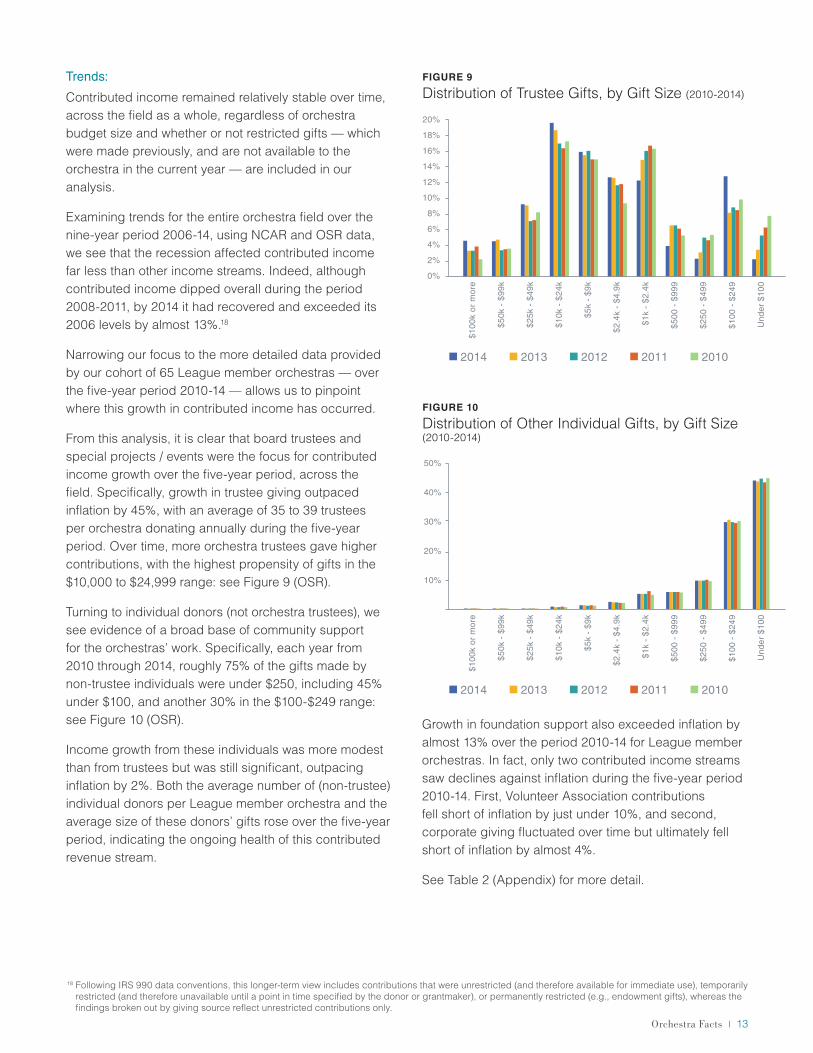
From this analysis, it is clear that board trustees and special projects / events were the focus for contributed income growth over the five-year period, across the field. Specifically, growth in trustee giving outpaced inflation by 45%, with an average of 35 to 39 trustees per orchestra donating annually during the five-year period. Over time, more orchestra trustees gave higher contributions, with the highest propensity of gifts in the $10,000 to $24,999 range: see Figure 9 (OSR).
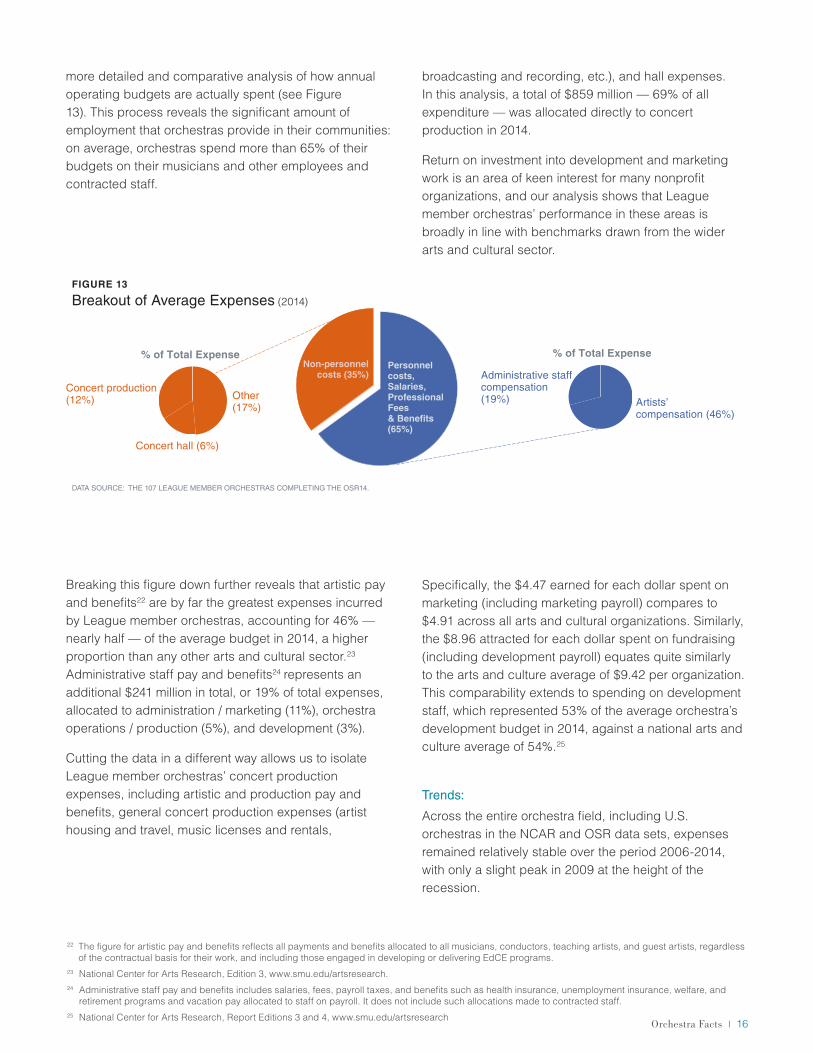
Turning to individual donors (not orchestra trustees), we see evidence of a broad base of community support for the orchestras’ work. Specifically, each year from 2010 through 2014, roughly 75% of the gifts made by non-trustee individuals were under $250, including 45% under $100, and another 30% in the $100-$249 range: see Figure 10 (OSR).
Income growth from these individuals was more modest than from trustees but was still significant, outpacing inflation by 2%. Both the average number of (non-trustee) individual donors per League member orchestra and the average size of these donors’ gifts rose over the five-year period, indicating the ongoing health of this contributed revenue stream.
Growth in foundation support also exceeded inflation by almost 13% over the period 2010-14 for League member orchestras. In fact, only two contributed income streams saw declines against inflation during the five-year period 2010-14. First, Volunteer Association contributions fell short of inflation by just under 10%, and second, corporate giving fluctuated over time but ultimately fell short of inflation by almost 4%.
See Table 2 (Appendix) for more detail.
18 Following IRS 990 data conventions, this longer-term view includes contributions that were unrestricted (and therefore available for immediate use), temporarily restricted (and therefore unavailable until a point in time specified by the donor or grantmaker), or permanently restricted (e.g., endowment gifts), whereas the findings broken out by giving source reflect unrestricted contributions only.
$100
k or
mor
e
$50k
- $
99k
$25k
- $
49k
$10k
- $
24k
$5k
- $9
k
$2.4
k -
$4.9
k
$1k
- $2
.4k
$500
- $
999
$250
- $
499
$100
- $
249
Und
er $
100
20%
18%
16%
14%
12%
10%
8%
6%
4%
2%
0%
DATA SOURCE: ?
FIGURE 9
Distribution of Trustee Gifts, by Gift Size (2010-2014)
2014 2013 2012 2011 2010
$100
k or
mor
e
$50k
- $
99k
$25k
- $
49k
$10k
- $
24k
$5k
- $9
k
$2.4
k -
$4.9
k
$1k
- $2
.4k
$500
- $
999
$250
- $
499
$100
- $
249
Und
er $
100
50%
40%
30%
20%
10%
DATA SOURCE: ?
FIGURE 10
Distribution of Other Individual Gifts, by Gift Size (2010-2014)
2014 2013 2012 2011 2010

Orchestra Facts l 14
5.1.3. Investment Income
Investment income supported a smaller percentage of operating expenses than either contributed or earned income. However, its volatility — and specifically its vulnerability to economic cycles beyond the orchestras’ control — is a concern for orchestras across the field, and particularly for those whose ability to cover operating expenses is dependent upon it.
2014 Investment Income Snapshot:
In 2014, 17% of all League member orchestra income was provided by investment income, a total of $229 million. This investment income was made up of three distinct investment income sources (see Figure 11):
• Endowment earnings (the income earned from donations made to restricted investment funds) provided roughly half of all League member orchestras’ investment income in 2014.
• Capital gains / losses (the difference between the present market value and the purchase price of investment portfolios, plus any profit or loss made on asset sales) provided a further 44%.
• Interest and dividends (earnings derived from funds deposited with a financial institution or distributed to investment shareholders) made up the final 6% of investment income for League member orchestras.
While investment income varies considerably from one orchestra to the next, orchestras with annual expenses of greater than $20 million tend to meet a greater percentage of their total expenses (20% or more) from investment income overall, than those orchestras with lower annual expenses.
FIGURE 11
Breakout of Average Investment Income (2014)
%s of total investment income
DATA SOURCE: THE 107 LEAGUE MEMBER ORCHESTRAS COMPLETING THE OSR14
Endowment earnings (50%)
Capital gains/(losses) (44%)
Interest and dividends (6%)
Contributed income (43%)
Earned income (40%)
Investment income (17%)

Orchestra Facts l 15
Investment Income Trends:
Because detailed investment income trend data is only available for the five-year period beginning in 2010, our longitudinal analysis begins in 2010 after the recession’s most significant trough, in 2009. Nonetheless, the impact of macro-economic conditions on League member orchestras’ investment income is clear (see Figure 12). Specifically, overall investment income increased somewhat in 2011 as recovery from the recession began, but almost halved between 2011 and 2012 as the economy dipped again. As Figure 12 shows, recovery then continued over the next two years, with investment income restored to 2011 levels by 2014.
To get a very general sense of the longer-term outlook, reaching back further in time and into the deepest recession years of 2008-2009 (and referring to a larger set of orchestras than those whose data is reflected in Figure 12), we can consult NCAR’s dataset.19 This topline analysis contextualizes the 2012 downturn shown in Figure 12 by allowing us to see an even more significant drop in investment income in 2009 (see Figure 14). It also confirms that the dip in investment income we see in the League data was experienced by the wider field.
Investment Income Breakdown:
Each one of the three investment income streams — interest and dividends, endowment earnings, and capital gains (losses) — attained a five-year high for League member orchestras in 2014, showing an overall increase in investment income of almost 10% above inflation. However, a closer look at the data reveals a more complex picture.
Specifically, average capital gains (losses) fell short of inflation by almost 14%, when one outlier orchestra’s exceptional capital gains are excluded. Mirroring similar findings in the theatre field,20 60% of the 56 orchestras reporting capital gains in both 2010 and 2014 produced higher levels over time.
Average income from interest and dividends decreased by 47% for League member orchestras over the five-year period 2010-2014, again once one orchestra’s exceptional interest and dividend income is excluded.
Average endowment earnings rose steadily from a five-year low in 2011 to a five-year high in 2014, mirroring overall investment income trends. Overall, across the 65 League member orchestras completing the OSR for all five years, endowment earnings growth outpaced inflation by 0.7%, over the five-year period 2010-2014.
See Table 3 (Appendix) for more details.
5.2. Expenses
The proportion of orchestra expenditure invested in artistic pay and benefits is exceptional in the arts and culture field. In other respects, such as development and marketing pay and return on investment, orchestras are broadly in line with their peer performing arts organizations.21
Expenditures Snapshot:
Orchestra expenditures totaled $1.8 billion in 2014, for all 1,224 U.S. orchestras in the NCAR and OSR data sets.
Focusing in on our cohort of 107 League member orchestras in 2014 skews the data somewhat towards larger-budget orchestras, but allows us to make a
19 The National Center for Arts Research (NCAR) data is more representative of the entire orchestra field than the OSR data we consulted for our five-year trend analysis, but offers limited detail.
20 Voss, Z. G., G. B. Voss, with I. Rose and L. Baskin (2015), Theatre Facts 2014, New York: Theatre Communications Group.21 National Center for Arts Research, Report Editions 2 and 3, www.smu.edu/artsresearch
2010 2011 2012 2013 2014
$2,715,670
$3,064,350
$1,556,043
$2,542,812
$3,240,341
+63%
-49%
FIGURE 12
Average Investment Income Trends (2010-14)
DATA SOURCE: THE 65 LEAGUE MEMBER ORCHESTRAS COMPLETING THE OSR2010-14. FIGURES ARE INFLATION ADJUSTED
Orchestra Facts l 16
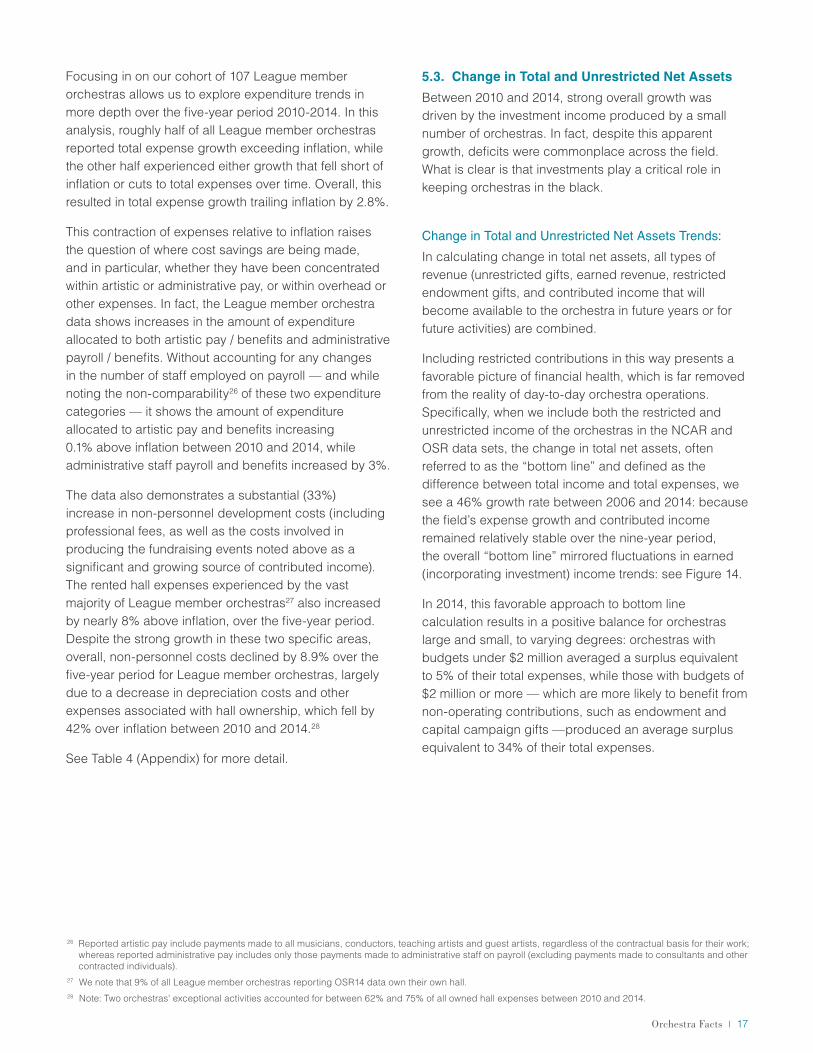
more detailed and comparative analysis of how annual operating budgets are actually spent (see Figure 13). This process reveals the significant amount of employment that orchestras provide in their communities: on average, orchestras spend more than 65% of their budgets on their musicians and other employees and contracted staff.
Breaking this figure down further reveals that artistic pay and benefits22 are by far the greatest expenses incurred by League member orchestras, accounting for 46% — nearly half — of the average budget in 2014, a higher proportion than any other arts and cultural sector.23 Administrative staff pay and benefits24 represents an additional $241 million in total, or 19% of total expenses, allocated to administration / marketing (11%), orchestra operations / production (5%), and development (3%).
Cutting the data in a different way allows us to isolate League member orchestras’ concert production expenses, including artistic and production pay and benefits, general concert production expenses (artist housing and travel, music licenses and rentals,
broadcasting and recording, etc.), and hall expenses. In this analysis, a total of $859 million — 69% of all expenditure — was allocated directly to concert production in 2014.
Return on investment into development and marketing work is an area of keen interest for many nonprofit organizations, and our analysis shows that League member orchestras’ performance in these areas is broadly in line with benchmarks drawn from the wider arts and cultural sector.
Specifically, the $4.47 earned for each dollar spent on marketing (including marketing payroll) compares to $4.91 across all arts and cultural organizations. Similarly, the $8.96 attracted for each dollar spent on fundraising (including development payroll) equates quite similarly to the arts and culture average of $9.42 per organization. This comparability extends to spending on development staff, which represented 53% of the average orchestra’s development budget in 2014, against a national arts and culture average of 54%.25
Trends:
Across the entire orchestra field, including U.S. orchestras in the NCAR and OSR data sets, expenses remained relatively stable over the period 2006-2014, with only a slight peak in 2009 at the height of the recession.
22 The figure for artistic pay and benefits reflects all payments and benefits allocated to all musicians, conductors, teaching artists, and guest artists, regardless of the contractual basis for their work, and including those engaged in developing or delivering EdCE programs.
23 National Center for Arts Research, Edition 3, www.smu.edu/artsresearch.24 Administrative staff pay and benefits includes salaries, fees, payroll taxes, and benefits such as health insurance, unemployment insurance, welfare, and
retirement programs and vacation pay allocated to staff on payroll. It does not include such allocations made to contracted staff.25 National Center for Arts Research, Report Editions 3 and 4, www.smu.edu/artsresearch
Non-personnelcosts (35%)
Concert hall (6%)
Concert production (12%)
Administrative staff compensation (19%) Artists’
compensation (46%)
Other (17%)
Personnel costs, Salaries, Professional Fees& Benefits (65%)
% of Total Expense% of Total Expense
FIGURE 13
Breakout of Average Expenses (2014)
DATA SOURCE: THE 107 LEAGUE MEMBER ORCHESTRAS COMPLETING THE OSR14.
Orchestra Facts l 17
Focusing in on our cohort of 107 League member orchestras allows us to explore expenditure trends in more depth over the five-year period 2010-2014. In this analysis, roughly half of all League member orchestras reported total expense growth exceeding inflation, while the other half experienced either growth that fell short of inflation or cuts to total expenses over time. Overall, this resulted in total expense growth trailing inflation by 2.8%.
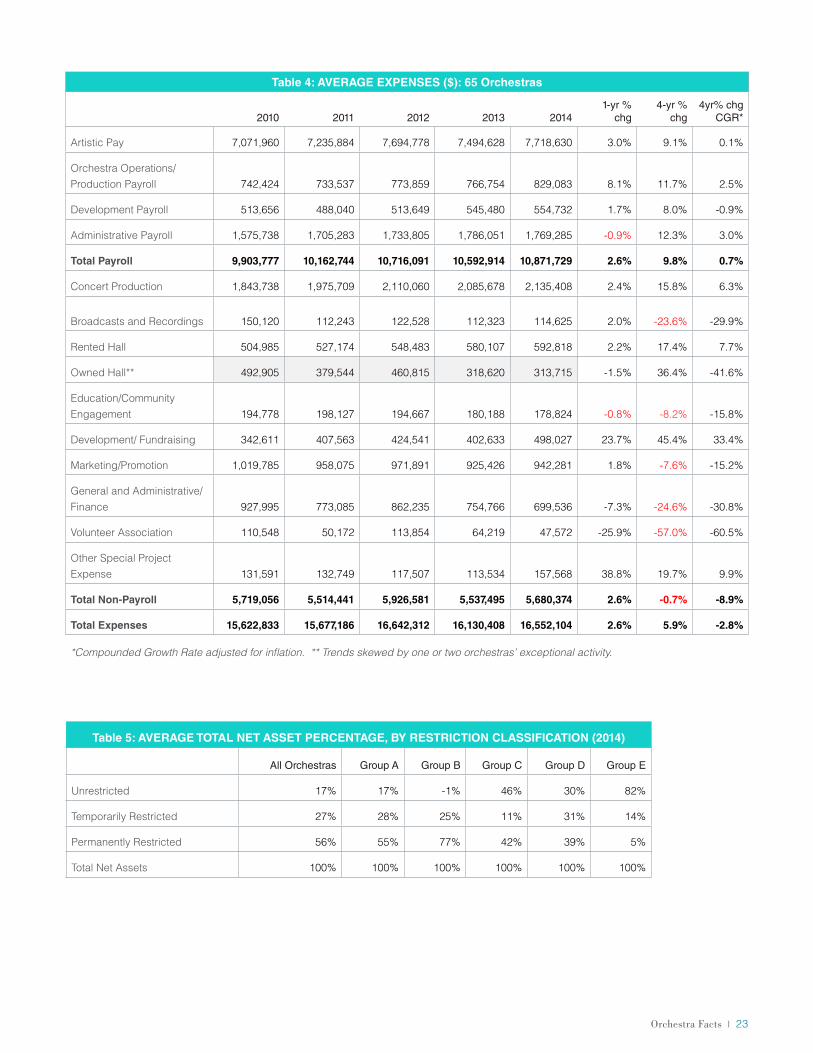
This contraction of expenses relative to inflation raises the question of where cost savings are being made, and in particular, whether they have been concentrated within artistic or administrative pay, or within overhead or other expenses. In fact, the League member orchestra data shows increases in the amount of expenditure allocated to both artistic pay / benefits and administrative payroll / benefits. Without accounting for any changes in the number of staff employed on payroll — and while noting the non-comparability26 of these two expenditure categories — it shows the amount of expenditure allocated to artistic pay and benefits increasing 0.1% above inflation between 2010 and 2014, while administrative staff payroll and benefits increased by 3%.
The data also demonstrates a substantial (33%) increase in non-personnel development costs (including professional fees, as well as the costs involved in producing the fundraising events noted above as a significant and growing source of contributed income). The rented hall expenses experienced by the vast majority of League member orchestras27 also increased by nearly 8% above inflation, over the five-year period. Despite the strong growth in these two specific areas, overall, non-personnel costs declined by 8.9% over the five-year period for League member orchestras, largely due to a decrease in depreciation costs and other expenses associated with hall ownership, which fell by 42% over inflation between 2010 and 2014.28
See Table 4 (Appendix) for more detail.
5.3. Change in Total and Unrestricted Net Assets
Between 2010 and 2014, strong overall growth was driven by the investment income produced by a small number of orchestras. In fact, despite this apparent growth, deficits were commonplace across the field. What is clear is that investments play a critical role in keeping orchestras in the black.
Change in Total and Unrestricted Net Assets Trends:
In calculating change in total net assets, all types of revenue (unrestricted gifts, earned revenue, restricted endowment gifts, and contributed income that will become available to the orchestra in future years or for future activities) are combined.
Including restricted contributions in this way presents a favorable picture of financial health, which is far removed from the reality of day-to-day orchestra operations. Specifically, when we include both the restricted and unrestricted income of the orchestras in the NCAR and OSR data sets, the change in total net assets, often referred to as the “bottom line” and defined as the difference between total income and total expenses, we see a 46% growth rate between 2006 and 2014: because the field’s expense growth and contributed income remained relatively stable over the nine-year period, the overall “bottom line” mirrored fluctuations in earned (incorporating investment) income trends: see Figure 14.
In 2014, this favorable approach to bottom line calculation results in a positive balance for orchestras large and small, to varying degrees: orchestras with budgets under $2 million averaged a surplus equivalent to 5% of their total expenses, while those with budgets of $2 million or more — which are more likely to benefit from non-operating contributions, such as endowment and capital campaign gifts —produced an average surplus equivalent to 34% of their total expenses.
26 Reported artistic pay include payments made to all musicians, conductors, teaching artists and guest artists, regardless of the contractual basis for their work; whereas reported administrative pay includes only those payments made to administrative staff on payroll (excluding payments made to consultants and other contracted individuals).
27 We note that 9% of all League member orchestras reporting OSR14 data own their own hall.28 Note: Two orchestras' exceptional activities accounted for between 62% and 75% of all owned hall expenses between 2010 and 2014.

Orchestra Facts l 18
We gain a more relatable perspective on the “bottom line” — one that is more indicative of the funds actually available to orchestras for use in the current year — by isolating the annual unrestricted funds reported by those League member orchestras completing the OSR between 2010 and 2014. The figure that we arrive at in this way is known as Change in Unrestricted Net Assets (CUNA). By ignoring income that is either permanently restricted or gifted for future use, and that is therefore unavailable to the orchestra in the current year, CUNA moves us as close as possible to a clean look at operating performance.29
Our analysis of CUNA reveals considerable variation across the field. While three out of four orchestras in our trend cohort reported at least one year of negative CUNA between 2010 and 2014, a small subset (those orchestras with exceptional earnings from endowments, interest, and dividends or capital gains) reported extraordinary CUNA growth. Overall, average CUNA increased thirteen fold between 2010 and 2014. However, the actual experience for many orchestras was one of a more modest – yet nonetheless quite positive – improvement in financial health, reflected in a decrease in reported deficits from 40% of all trend cohort members in 2010, to 18% in 2014.
In order to further explore the influence of investment income on the overall financial health of the orchestra field, we modeled an alternative scenario in which investment income was removed from our analysis of
CUNA. When we conduct this analysis, we see annual losses or deficits for the field that range from -$2.81 million in 2010 to -$1.96 million in 2014. In fact, in this world, the average League orchestra would have ended 2014 with a deficit of $1.4 million and shortfalls would have been the norm for all orchestras with annual expenses greater than $300,000. This calculation is a theoretical one, and in reality orchestras across all budget groups benefit from investment income. However, modeling this scenario clearly illustrates the field’s reliance on investment income, and its vulnerability to economic conditions beyond its control.
5.4. Balance sheet
Balance Sheet calculations provide an historical overview of an orchestra’s financial operation at the end of each fiscal year. Total current and long-term assets (including cash, investments, and endowments; pledges and accounts receivable; and fixed assets, such as property — including concert halls — and equipment) are considered relative to liabilities (including accounts payable, future years’ subscription and ticket income, etc.). The resulting difference between total assets and liabilities is known as net assets. While the bottom line tells the story of net financial activity for a given year only, the balance sheet reflects long-term stability and fiscal health.
29 We note that temporarily restricted income is reported in an organization’s CUNA in the year it is released from restriction.
FIGURE 14
Average Income, Expense, and Bottom Line Trends (2006-14)
$4,000,000
$5,000,000
$3,000,000
($1,000,000)
($2,000,000)
$0
$1,000,000
$2,000,000
Total Income
Contributed Income (restricted and unrestricted)
Earned and Investment Income Bottom Line
Total Expenses
2006 2007 2008 2009 2010 2011 2012 2013 2014
DATA SOURCE: THE 547 ORCHESTRAS SUBMITTING IRS 2006-14 DATA FIGURES ARE INFLATION ADJUSTED
Orchestra Facts l 19
Our balance sheet analysis again demonstrates the close relationship between orchestra finances and macro-economic conditions, as well as the difference between larger-budget orchestras (which hold a greater proportion of restricted net assets) and smaller-budget orchestras (which hold a greater proportion of working capital).
Assets and Liabilities Trends:
Between 2006 and 2014, the total assets of all U.S. orchestras in the combined NCAR and OSR data sets increased by 4% while liabilities decreased by 7.5%, having peaked at the recession’s height. In general terms, these measures indicate improved organizational stability over time, despite the impact of recession on the field.
Net Assets (Total Assets Minus Liabilities) Trends:
As liabilities decreased in the post-recession years, the net assets of all orchestra budget groups grew correspondingly: in the period 2006 to 2014, growth in the net asset value of all U.S. orchestras exceeded inflation by 6.6%. Total net assets returned to pre-recession levels in proportion to total assets.
Net Assets Profile:
There is considerable variation between orchestras in terms of the composition of net assets they hold. Even when orchestras have similar levels of total expenses, their net assets may vary in terms of both the restrictions on their use (i.e., the degree to which they are held for future use or restricted for endowment purposes) and their degree of liquidity (i.e., the degree to which they are held in buildings, land, and other inaccessible fixed assets). We explore these two points of differentiation below.
• Restriction:
• Some orchestras hold a relatively high proportion of restricted net assets, which are subject to restrictions placed on them by a donor or by the policy of a board of directors. Examples include foundation grants intended to finance multi-year programs, and endowment gifts. Our analysis shows that, in 2014, orchestras with annual expenses of over $5 million typically held more than half of their net assets in permanently restricted
funds (e.g., endowments). Conversely, smaller-budget orchestras (and especially those with the smallest budgets) tended to hold proportionally more unrestricted net assets, leaving them with more available cash but less leverage to generate investment income.
See Table 5 (Appendix) for more detail.
• Liquidity:
• The amount of working capital (current assets minus current liabilities) held by an orchestra, and the ratio of working capital to total expenses, are key financial health measures for all nonprofit organizations. When working capital is negative, it means that the organization is borrowing funds — either from a lender or from its own reserves or other sources — in order to meet day-to-day cash needs and current obligations. Low working capital may be indicative of poor financial health, but equally it may indicate a planned expansion or be reflective of a particular financial management strategy.
Two thirds of the 101 orchestras completing the balance sheet section of the OSR reported positive working capital for every year from 2010 to 2014. However, on average, smaller-budget orchestras reported higher levels of working capital than those with larger budgets. Indeed, over 40% of orchestras with annual expenses over $5 million reported negative working capital over the five-year period, compared to just one orchestra with annual expenses of $300,000 or less.
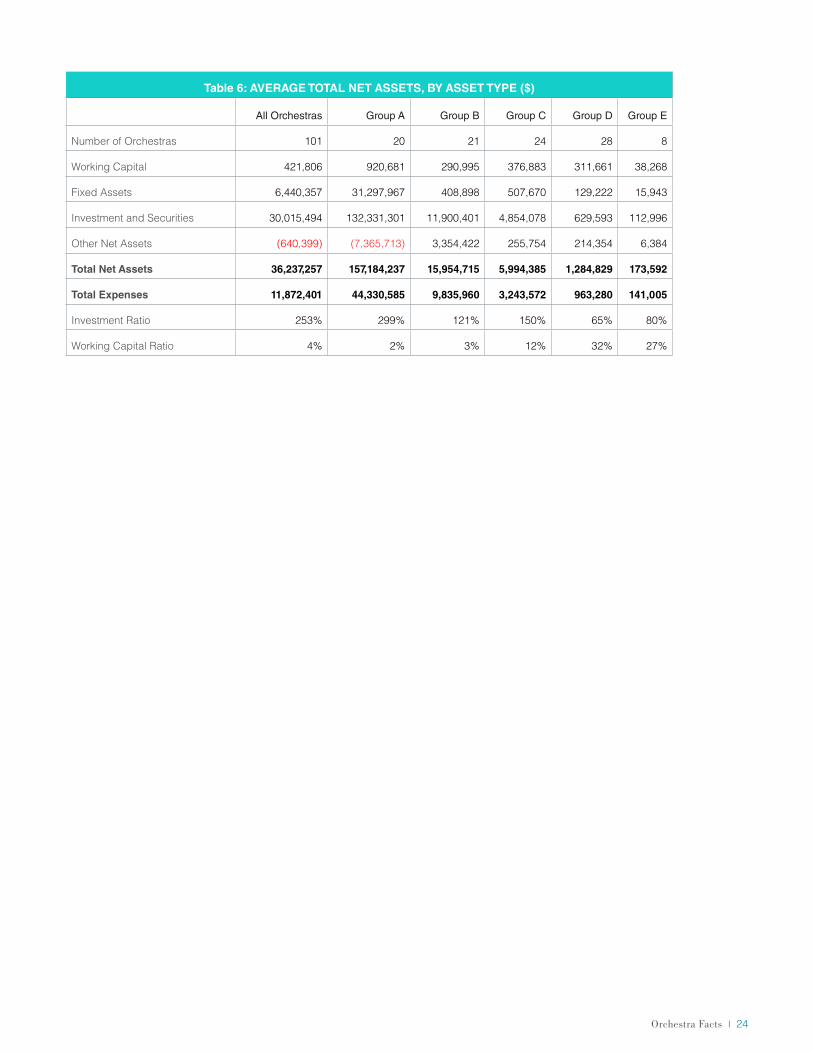
The net assets breakdown reported by the OSR orchestras by asset type are as follows:
• 82.8% investments and securities (endowments, interest and dividends, and capital gains / losses)
• 17.8% fixed assets (buildings, land and equipment at cost, minus depreciation)30
• 1.2% working capital (available cash)31
• -1.8% other net assets (debt)
Calculating the ratio of working capital to total expenses indicates the length of time that an orchestra could pay its short-term obligations if it had to survive on current resources. In 2014, 28% of the 101 League member orchestras reporting balance sheet data to the OSR could pay their short-term obligations for
30 We note that 9% of all League member orchestras reporting OSR14 data own their own hall.31 We acknowledge that working capital calculations sometimes focus only on current unrestricted assets and current unrestricted liabilities.
However, the OSR survey does not break down either assets or liabilities by restriction, so our calculation is based on all current assets and liabilities.

Orchestra Facts l 20
three months or more, while the remainder could not.
For the first time, this report publicly reveals a detailed picture of the scope and scale of the orchestra field in the United States of America. We find more than 1,200 orchestras distributed widely across all 50 states, each orchestra both participating in and supported by the communities it serves. We find an estimated total audience of 25 million experiencing the 28,000 performances and other musical activities and events created by orchestras each year. And we see orchestras making a direct contribution of $1.8 billion to the U.S. economy in 2014, in addition to indirectly fueling the economy through related audience expenditure.
Our field deploys the orchestral experience and repertoire as catalysts to meaningful engagement with the communities it serves. It is clear that while this work continues in the concert hall, it also drives a vast array of education and community engagement (EdCE) activities: orchestras not only perform, but also teach, lead, facilitate, and train. The scale of this work is as impressive as its scope: in 2014, the 98 orchestras in our sample delivered almost 19,000 EdCE performances, musical activities, and events — 85% of which took place in a school or other community venue. Of the 2.1 million people participating in these events, 38% were African American, Hispanic / Latino, Asian American / Pacific Islander, or American Indian / Alaskan Native, and two thirds participated without charge. At the same time, the cost barriers traditionally associated with attending orchestra performances are coming down: between 2010 and 2014, the number of free concerts and free tickets increased, while the cost of purchasing paid-for tickets fell.
Orchestras find themselves at a moment of transition: not only is their own work evolving, but so too are the needs and preferences of their audiences. 2013 saw a significant shift in the traditional orchestra business
model, as – for the first time —income produced by single ticket and group sales was higher than that earned from subscription revenues. The challenge to orchestras — which have traditionally relied on proportionally high revenues from a loyal base of subscriber / donors — is significant. Yet the subscription model remains important: the 18% growth in the number of households subscribing shows that demand for subscriptions is still growing, even if spend per subscriber is down. At the same time, both the stability of contributed income through the recession years and the large number of small gifts made to orchestras indicates a resilient, broad base of community support for — and appreciation of — the orchestra’s work.
Our financial analysis illustrates the complexity and resilience of the orchestra business model. Orchestras balance multiple forms of earned, contributed, and investment income, often managing a complex portfolio of asset types. They successfully maintained contributed income levels through the recession years, while containing growth in expenses and — in many cases — actively seeking new opportunities for earned income generation. Overall, the field produced a surplus in 2014 and the proportion of orchestras reporting deficits dropped considerably. Nonetheless, orchestras’ reliance on investment income — and, consequently, their financial vulnerability during leaner times — is an ongoing cause for concern.
Orchestras are complex organizations, which — like many nonprofit arts organizations — face new challenges in a changing world. Clearly, every orchestra has its own, unique story to tell. However, by analyzing the field’s evolution through the recession years and beyond, we hope to have illuminated the experiences of the recent past and informed action for the future.
6. Conclusions

Orchestra Facts l 21
Orchestra budget Groups A – E, referred to in these tables, are explained in the Technical Notes that follow.
Shaded cells represent those where the reported figures are heavily influenced by outliers.
Table 1: AVERAGE EARNED INCOME ($): 65 Orchestras
2010 2011 2012 2013 20141-yr %
chg4-yr %
chg
4yr% chg
CGR*
Subscriptions 2,293,336 2,236,680 2,218,948 2,113,759 2,177,110 3.0% -5.1% -12.9%
Single Tickets/Group Sales 2,056,125 2,074,077 2,193,767 2,158,778 2,379,809 10.2% 15.7% 6.2%
Contract Fees 176,079 174,566 185,552 180,225 173,380 -3.8% -1.5% -9.7%
Education and Community Engagement 152,881 134,780 146,781 140,888 150,655 6.9% -1.5% -9.6%
U.S. Tours 145,094 150,361 215,649 167,434 158,850 -5.1% 9.5% 0.4%
International Tours** 181,081 195,081 133,352 225,108 150,568 -33.1% -16.9% -23.7%
Other Concert Income 57,203 59,796 55,148 34,608 51,815 49.7% -9.4% -16.9%
Total Performance Income 5,061,800 5,025,340 5,149,193 5,020,800 5,242,187 4.4% 3.6% -5.0%
Broadcasts and Recordings 39,110 43,027 58,500 41,083 36,380 -11.4% -7.0% -14.7%
All Other Earned Income 1,381,071 1,692,449 1,796,237 1,765,785 1,742,063 -1.3% 26.1% 15.7%
Total Other Earned Income 1,420,181 1,735,478 1,854,738 1,806,868 1,778,444 -1.6% 25.2% 14.9%
Total Earned Income 6,481,980 6,760,818 7,003,931 6,827,668 7,020,631 2.8% 8.3% -0.6%
*Compounded Growth Rate adjusted for inflation. ** Trends skewed by one or two orchestras’ exceptional activity.
7. Appendix: Tables

Orchestra Facts l 22
Table 2: AVERAGE CONTRIBUTED INCOME AND TOTAL INCOME ($): 65 Orchestras
2010 2011 2012 2013 20141-yr %
chg4-yr %
chg
4yr% chg
CGR*
Trustees 524,926 694,031 714,798 770,190 830,867 7.9% 58.3% 45.2%
Other Individuals 2,435,059 2,299,297 2,449,247 2,590,553 2,710,578 4.6% 11.3% 2.1%
Corporations** 704,198 777,599 982,409 703,163 739,439 5.2% 5.0% -3.7%
Foundations 772,828 793,183 865,762 945,955 950,460 0.5% 23.0% 12.8%
Volunteer Associations 198,425 169,690 257,950 221,605 195,010 -12.0% -1.7% -9.8%
United Arts Funds 106,559 171,754 144,932 166,268 150,317 -9.6% 41.1% 29.4%
Special Events and Projects 438,869 618,823 717,893 621,217 753,770 21.3% 71.8% 57.6%
In-kind Contributions** 316,372 379,543 398,615 359,144 370,618 3.2% 17.1% 7.5%
Other Contributions 242,712 606,421 574,406 1,694,403 308,453 -81.8% 27.1% 16.6%
Total Private Support 5,739,948 6,510,340 7,106,012 8,072,497 7,009,512 -13.2% 22.1% 12.0%
Total Government Support 592,203 582,698 537,596 525,704 566,644 7.8% -4.3% -12.2%
Total Contributed Income 6,332,151 7,093,038 7,643,609 8,598,202 7,576,156 -11.9% 19.6% 9.8%
Total Income 15,529,801 16,918,205 16,203,583 17,968,682 17,837,128 -0.7% 14.9% 5.4%
*Compounded Growth Rate adjusted for inflation. ** Trends skewed by one or two orchestras’ exceptional activity.
Table 3: AVERAGE INVESTMENT INCOME ($): 65 Orchestras
2010 2011 2012 2013 2014 1-yr % chg 4-yr % chg4yr% chg
CGR*
Interest and Dividends** 74,025 37,518 58,956 42,755 159,079 272.1% 114.9% 97.2%
Endowment Earnings 1,515,265 1,430,336 1,461,133 1,494,928 1,662,669 11.2% 9.7% 0.7%
Capital Gains/(Losses) 1,126,380 1,596,496 35,954 1,005,129 1,418,593 41.1% 25.9% 15.5%
Total Investment Income 2,715,670 3,064,349 1,556,043 2,542,813 3,240,341 27.4% 19.3% 9.5%
*Compounded Growth Rate adjusted for inflation. ** Trends skewed by one or two orchestras’ exceptional activity.
Orchestra Facts l 23
Table 4: AVERAGE EXPENSES ($): 65 Orchestras
2010 2011 2012 2013 20141-yr %
chg4-yr %
chg4yr% chg
CGR*
Artistic Pay 7,071,960 7,235,884 7,694,778 7,494,628 7,718,630 3.0% 9.1% 0.1%
Orchestra Operations/ Production Payroll 742,424 733,537 773,859 766,754 829,083 8.1% 11.7% 2.5%
Development Payroll 513,656 488,040 513,649 545,480 554,732 1.7% 8.0% -0.9%
Administrative Payroll 1,575,738 1,705,283 1,733,805 1,786,051 1,769,285 -0.9% 12.3% 3.0%
Total Payroll 9,903,777 10,162,744 10,716,091 10,592,914 10,871,729 2.6% 9.8% 0.7%
Concert Production 1,843,738 1,975,709 2,110,060 2,085,678 2,135,408 2.4% 15.8% 6.3%
Broadcasts and Recordings 150,120 112,243 122,528 112,323 114,625 2.0% -23.6% -29.9%
Rented Hall 504,985 527,174 548,483 580,107 592,818 2.2% 17.4% 7.7%
Owned Hall** 492,905 379,544 460,815 318,620 313,715 -1.5% 36.4% -41.6%
Education/Community Engagement 194,778 198,127 194,667 180,188 178,824 -0.8% -8.2% -15.8%
Development/ Fundraising 342,611 407,563 424,541 402,633 498,027 23.7% 45.4% 33.4%
Marketing/Promotion 1,019,785 958,075 971,891 925,426 942,281 1.8% -7.6% -15.2%
General and Administrative/Finance 927,995 773,085 862,235 754,766 699,536 -7.3% -24.6% -30.8%
Volunteer Association 110,548 50,172 113,854 64,219 47,572 -25.9% -57.0% -60.5%
Other Special Project Expense 131,591 132,749 117,507 113,534 157,568 38.8% 19.7% 9.9%
Total Non-Payroll 5,719,056 5,514,441 5,926,581 5,537,495 5,680,374 2.6% -0.7% -8.9%
Total Expenses 15,622,833 15,677,186 16,642,312 16,130,408 16,552,104 2.6% 5.9% -2.8%
*Compounded Growth Rate adjusted for inflation. ** Trends skewed by one or two orchestras’ exceptional activity.
Table 5: AVERAGE TOTAL NET ASSET PERCENTAGE, BY RESTRICTION CLASSIFICATION (2014)
All Orchestras Group A Group B Group C Group D Group E
Unrestricted 17% 17% -1% 46% 30% 82%
Temporarily Restricted 27% 28% 25% 11% 31% 14%
Permanently Restricted 56% 55% 77% 42% 39% 5%
Total Net Assets 100% 100% 100% 100% 100% 100%
Orchestra Facts l 24
Table 6: AVERAGE TOTAL NET ASSETS, BY ASSET TYPE ($)
All Orchestras Group A Group B Group C Group D Group E
Number of Orchestras 101 20 21 24 28 8
Working Capital 421,806 920,681 290,995 376,883 311,661 38,268
Fixed Assets 6,440,357 31,297,967 408,898 507,670 129,222 15,943
Investment and Securities 30,015,494 132,331,301 11,900,401 4,854,078 629,593 112,996
Other Net Assets (640,399) (7,365,713) 3,354,422 255,754 214,354 6,384
Total Net Assets 36,237,257 157,184,237 15,954,715 5,994,385 1,284,829 173,592
Total Expenses 11,872,401 44,330,585 9,835,960 3,243,572 963,280 141,005
Investment Ratio 253% 299% 121% 150% 65% 80%
Working Capital Ratio 4% 2% 3% 12% 32% 27%

Orchestra Facts l 25
Data Sets
Our analysis incorporates the following three data sets:
1. SMU National Center for Arts Research (NCAR) data: This data set integrates data from two sources. The first is Internal Revenue Service (IRS) Form 990 Data, obtained by NCAR through the IRS and the National Center for Charitable Statistics. The IRS Form 990 data set contains only topline financial information, but its wide scope means it can be considered representative of the nation’s field of stand-alone orchestras with total expenses of $50,000 or more. Of note, investment income is reported as part of other earned income, and income figures include both unrestricted and restricted income — such as endowment gifts — combined. The second source of NCAR’s data is DataArts’ Cultural Data Profile (CDP).32 The CDP collects high-quality, in-depth financial and operating data from organizations that are not separately incorporated from a parent organization, as well as from the stand-alone organizations that would not typically file a Form 990 with the IRS.
2. Orchestra Statistical Report (OSR) data: The OSR data set, collected annually by the League of American Orchestras, includes far more detailed financial and operational data specific to orchestras than is available from the NCAR data set. It incorporates data from youth orchestras affiliated with a “parent” orchestra already participating in the OSR, but not from independent youth orchestras or from school or college orchestras. In contrast to the IRS data, the OSR data separates earned and investment income, and it reports restricted gifts — such as endowment gifts — in the year in which they are released from restriction. The OSR data can be analyzed over a maximum five-year timespan, due to the relatively small number of orchestras reporting.
The current year data can also be broken down by orchestra budget size, using the following five budget group categories:
Budget
Group
Number of orchestras
in the OSR14 data set
Operating budget
(2014)
A 21$20,000,001 or
more
B 21$5,000,001 —
$20 million
C 24$2,000,001 —
$5 million
D 31$300,001 —
$2 million
E 10 $300,000 or less
3. EdCE 2014 survey data: This data set represents 98 League member orchestras offering Education and Community Engagement programs, which participated in a one-off survey of EdCE activities undertaken in financial year 2013-14, conducted in 2015. It includes data submitted by both independent and affiliated youth orchestras.
We use the latest available data sets. The publication of 2014 data in the year 2016 is accounted for by variable financial year-end dates, and by the time involved in collecting, processing, analyzing, and reporting on data.
8. Technical Notes
32 DataArts is a nonprofit organization that empowers the arts and cultural sector with high-quality data and resources in order to strengthen its vitality, performance, and public impact. Any interpretation of the data is that of the authors, not of DataArts. For more information, visit www.culturaldata.org.

Orchestra Facts l 26
Analyses
Our analyses draw from the combined NCAR and OSR data sets in the following two ways:
Orchestra Field-wide 2014 Snapshot: The 1,224 orchestras in the NCAR and OSR data sets for financial year 2013-14.
Orchestra Field 2006-2014, 9-year Trends: The 547 orchestras with annual expenses of $50,000 or more that submitted data each of the five financial years from 2005-06 to 2013-14.
We also analyze the OSR data set exclusively in the following two ways:
OSR 2014 Snapshot: The 107 League member orchestras participating in the Orchestra Statistical Report for financial year 2013-2014, broken down into five budget groups based on annual expenses (see table above).
OSR 2010-14, 5-year Trends: The 65 League member orchestras participating in the Orchestra Statistical Report for each of the five financial years from 2009-10 to 2013-14. This data set is more skewed towards the larger-budget orchestras that are the most likely to have completed the OSR every year for a five-year period, a cohort that is too small to support a reliable breakdown by budget group.
Throughout the report, we report on changes in figures over time after having adjusted them for inflation. Slight discrepancies in the report’s table totals and percentages are due to rounding.
Definitions
For the purposes of this report, the orchestra field is defined by the data sets described above, which may include both professional and semi-professional orchestras, but do not include school, college, or military orchestras. Youth orchestras are partially represented in the data sets, and this representation is explained by footnotes throughout the report. The two Canadian orchestras participating in the OSR15 are included in that data set, but are not considered outliers in terms of the data points we report.
The terms that we use to categorize EdCE program participants by race and ethnicity reflect those employed within the available data sources.
Acknowledgments
Orchestra Facts l 27
The League of American Orchestras is grateful to all the orchestras that have participated in the Orchestra Statistical Report and its predecessor since its inception in 1946. The legacy of their work has benefitted our entire field.
National Center for Arts Research Staff
Dr. Zannie Giraud Voss, Director
Dr. Glenn Voss, Research Director
Jennifer Armstrong, Associate Director
Kristen Lega, former Research Assistant, MA/MBA Class of ‘16
Joshua Miller, Web Developer
Young Woong Park, Research Associate
Rob Stein, Senior Advisor
Urban Institute Staff
Thomas H. Pollak, former Senior Research Associate and former Program Director, National Center for Charitable Statistics
Nathan Dietz, Senior Research Associate
Jeremy Koulish, former Research Associate, Center on Nonprofits and Philanthropy
League of American Orchestras Staff
Jesse Rosen, President and CEO
Dr. Karen Yair, Vice President, Knowledge Center
Heather Noonan, Vice President, Advocacy
Celeste Wroblewski, Vice President, Marketing and Communications
David Bojanowski, Knowledge Center Assistant
Tse Wei Kok, former Interim Research and Data Manager
Chester Lane, Senior Editor, Symphony magazine
Laura Lebow, former Digital Associate
Najean Lee, Director, Government Affairs and Education Advocacy
Stephen Lisner, former Chief Operating Officer
Angela Lo, Director, Knowledge Center
Jennifer Melick, Managing Editor, Symphony magazine
Daniel Morris, former Manager, Research and Analysis
Michael Rush, Production Manager, Publications
Robert Sandla, Editor in Chief, Symphony magazine
Rachelle Schlosser, Director, Media Relations and Communications
Mi Ryung Song, Director, Strategic Initiatives
Orchestra Facts l 28
Orchestra Facts: 2006-2014 Data Advisory Group
Michael DeMartini, Vice President and Chief Financial Officer, Los Angeles Philharmonic
Mark Hunsberger, Director of Education and Youth Symphony Administrator, Harrisburg Symphony Orchestra
Dr. Hugh Long, Member of the Board of Trustees, Louisiana Philharmonic
Dr. Mary Saathoff, Chief Executive Officer, Lubbock Symphony
Lawrence Tamburri, Executive Director, Newark School of the Arts
Bill Thomas, Senior Vice-President/Chief Operations Officer, New York Philharmonic
Theodore Wiprud, Vice President, Education, New York Philharmonic
Simon Woods, President and CEO, Seattle Symphony
Orchestra Facts: 2006-2014 Communications Advisory Group
Eileen Andrews, Vice President of Public Relations, John F. Kennedy Center for the Performing Arts
James William Boyd, Chief Executive Officer, Louisiana Philharmonic Orchestra
Rosalie Contreras, Vice President of Communications, Seattle Symphony
Adam Crane, Vice President for External Affairs, St. Louis Symphony
Aaron Flagg, Board Member, Stamford Symphony; Chair, Julliard Jazz Studies
Rachel Ford, Executive Director, Knoxville Symphony Orchestra
Gary Ginstling, Chief Executive Officer, Indianapolis Symphony Orchestra
Nicki Inman, Senior Director of Patron Development and Engagement, Detroit Symphony Orchestra
Sophie Jefferies, Director of Public Relations, Los Angeles Philharmonic
Katherine E. Johnson, Director of Communications, New York Philharmonic
Alan Jordan, Executive Director, Delaware Symphony Orchestra
Robert Levine, Principal Violist, Milwaukee Symphony Orchestra
Thom Mayes, Chief Executive Officer, Northwest Sinfonietta
Steven C. Parrish, Vice President of the Board of Directors, Stamford Symphony
Suzanne Perrino, Senior Vice President of Education and Strategic Implementation, Pittsburgh Symphony Orchestra
Henry Peyrebrune, Double Bass/Major Gifts Officer, The Cleveland Orchestra
James Roe, President & Executive Director, Orchestra of St. Luke’s
Robert Wagner, Principal Bassoonist, New Jersey Symphony Orchestra
© League of American Orchestras 2016

Orchestra Facts l 29
About the League of American Orchestras The League of American Orchestras leads, supports, and champions America’s
orchestras and the vitality of the music they perform. Its diverse membership of more
than 2,000 organizations and individuals across North America runs the gamut from
world-renowned symphonies to community groups, from summer festivals to student
and youth ensembles, from conservatories to libraries, from businesses serving
orchestras to individuals who love symphonic music. The only national organization
dedicated solely to the orchestral experience, the League is a nexus of knowledge
and innovation, advocacy, and leadership advancement. Its conferences and events,
award-winning Symphony magazine, website, and other publications inform people
around the world about orchestral activity and developments. Founded in 1942 and
chartered by Congress in 1962, the League links a national network of thousands
of instrumentalists, conductors, managers and administrators, board members,
volunteers, and business partners. Visit americanorchestras.org.