oral health inequalities: time for action budapest oral … · · 2017-12-12oral health...
TRANSCRIPT

Oral health inequalities:
time for action
29th September 2016, EADPH, Budapest.
Professor Richard G Watt
Department of Epidemiology & Public Health, UCL

Outline of Presentation
Outline nature of oral health inequalities & gradients
Stress importance of social determinants framework
Highlight need for radical public health approach to
reduce inequalities
Outline importance of international collaborative action
and networks
www.ucl.ac.uk/dph
Nature of health inequalities
Dental Public Health
ucl.ac.uk/dph

HEALTH DIFFERENCES
INEVITABLE POTENTIALLY AVOIDABLE
ACCEPTABLE UNACCEPTABLE, UNFAIR
INEQUALITIES
Dahlgren & Whitehead (1991)

Life expectancy in countries in the WHO
European Region, 2010 (or latest available)
Source: WHO Health for all database, 2012

Life expectancy at birth (men)UK, Glasgow (Calton) 54
India 62
US, Washington D.C. (black) 63
Philippines 64
Lithuania 65
Poland 71
Mexico 72
Cuba 75
US 75
UK 77
Japan 79
US, Montgomery County (white) 80
UK, Glasgow (Lenzie N.) 82
Sources: WHO World Health Statistics 2007; Hanlon, Walsh & Whyte 2006; Murray et al. 2006
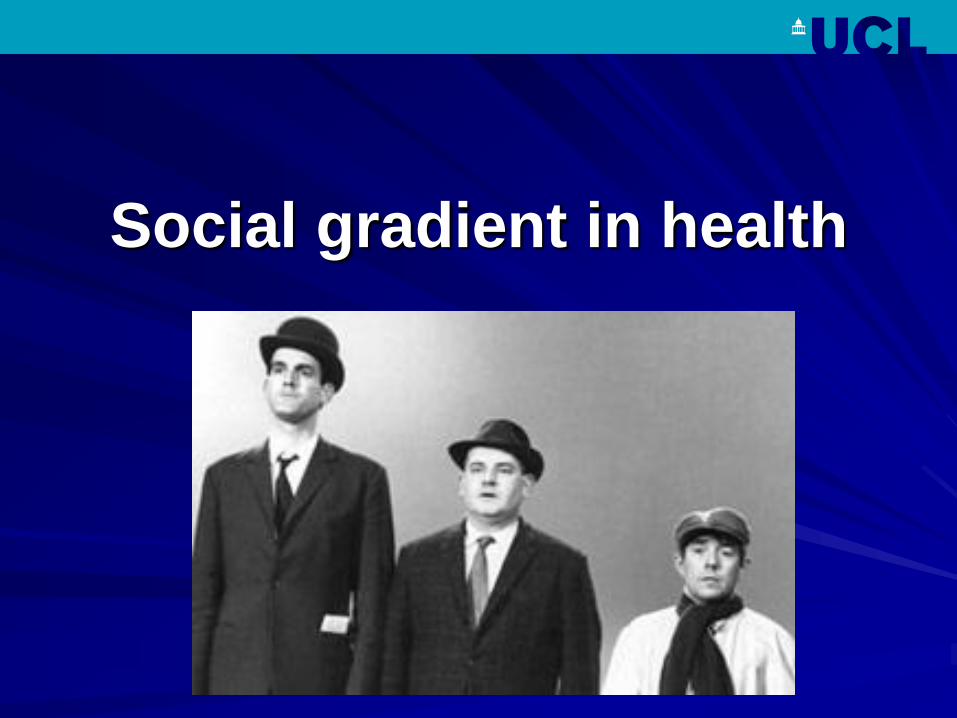
Social gradient in health

Life expectancy by social class
72
74
76
78
80
82
84
Social Class I Social Class II Social Class IIIN Social Class IIIM Social Class IV Social Class V
Lif
e ex
pec
tan
cy
Life expectancy by social class, England and Wales 1992-1996 (Marmot 2003)8

Health inequalities
Key public health challenge for
21st century

Oral health inequalities


SES and caries: systematic review
Low SEP is associated with a
higher risk of caries lesions
or experience
Association stronger in
developed countries.
Inequalities not due to
diagnostic and treatment
concepts
Schwendicke F, Dörfer CE, Schlattmann P, Page LF, Thomson WM, Paris S. J Dent Res. 2015; 94(1):10-8.

Examples
Local level
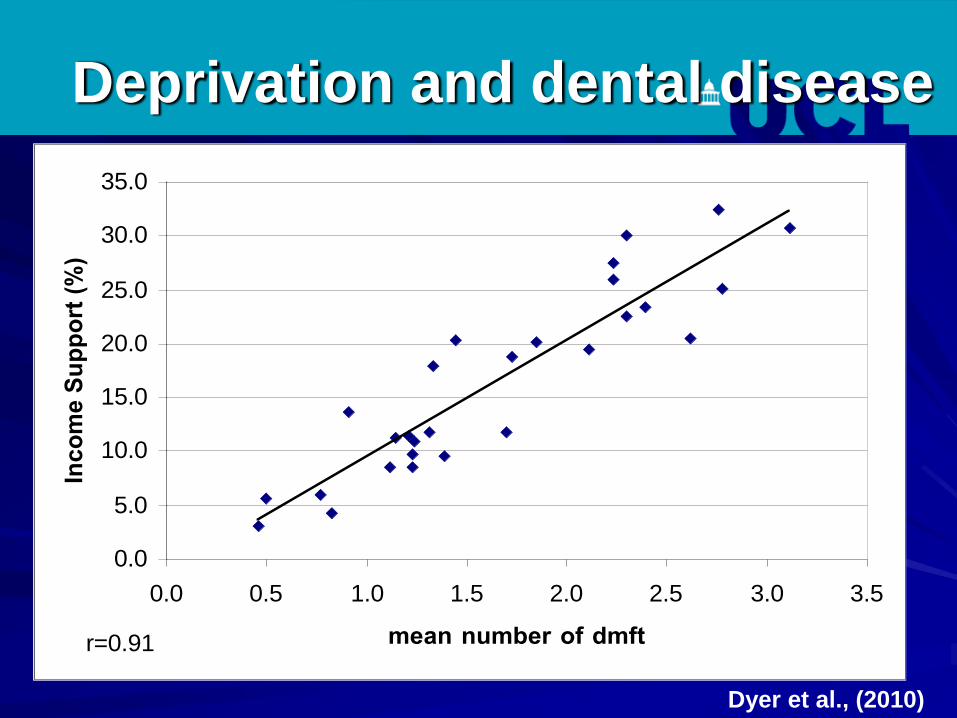
Deprivation and dental disease
0.0
5.0
10.0
15.0
20.0
25.0
30.0
35.0
0.0 0.5 1.0 1.5 2.0 2.5 3.0 3.5
mean number of dmft
Inco
me S
up
po
rt (
%)
r=0.91
Dyer et al., (2010)


Avg. number of decayed (dt), missing (mt), filled (ft), teeth for 5 year old children in Islington 2003/04 by
school. ( Source:BASCD 2004)
0
0.5
1
1.5
2
2.5
3
3.5
4
School
Av
g.d
mft
Average of dt Average of mt Average of ft

Examples
National level

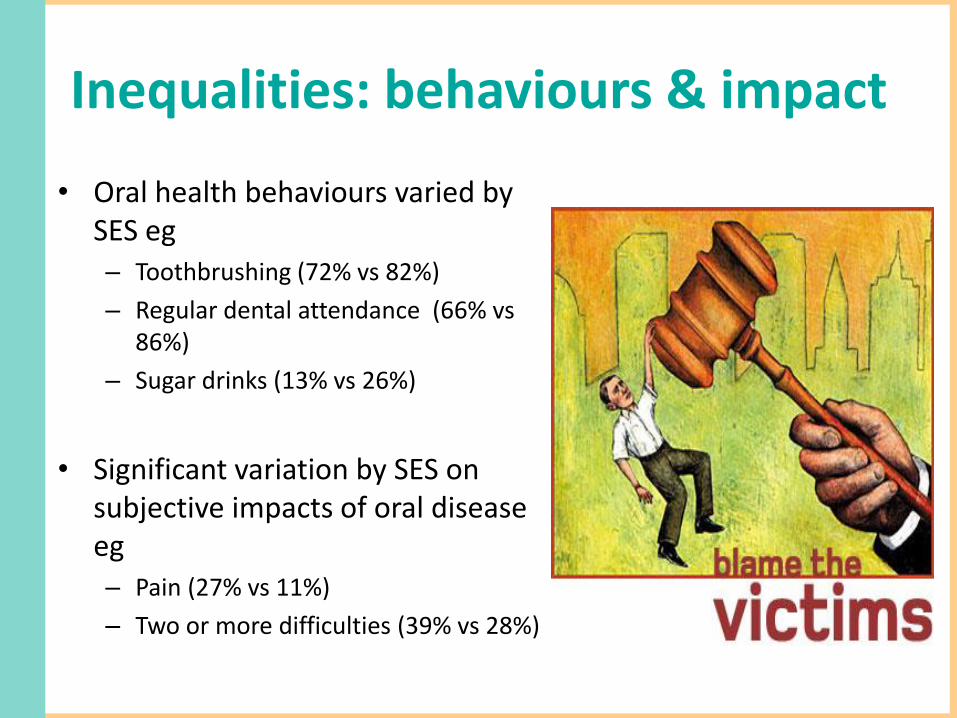
Inequalities: behaviours & impact
• Oral health behaviours varied by SES eg– Toothbrushing (72% vs 82%)
– Regular dental attendance (66% vs86%)
– Sugar drinks (13% vs 26%)
• Significant variation by SES on subjective impacts of oral disease eg– Pain (27% vs 11%)
– Two or more difficulties (39% vs 28%)

Probabilities of being edentate for adults by social class - ADHS.
Bernabé E and Sheiham A. (2014) Tooth loss in the United Kingdom-trends in social
inequalities: an age-period-and-cohort analysis. PLoS One, Aug 8;9(8).

Education gradients in self-rated oral and general
health, periodontal disease and heart disease
0
0.5
1
1.5
2
2.5
3
Perceived oral
health
Perceived
general health
Periodontitis Ischemic heart
disease
Od
ds
Ra
tio
Education>12 year
Education=12 years
Education<12years
(Sabbah et al, 2007; JDR)

Examples
International level

Source: IHME, Global Burden of Diseases (2013)
(age-standardized, both sexes, DALYs per 100,000)


Income-related inequalities in dental service
utilization, Europeans aged 50+ years
-20
0
20
40
60
80
Listl S. J Dent Res, 2011 * non-significant
*
*

Welfare state regimes in Europe: Anglo-Saxon, Bismarckian, Scandinavian, Southern(Ferrera’s typology) + Eastern
28

Results
Age-standardized prevalence of edentulousness by welfare state regime
0
5
10
15
20
25
30
Scandinavian Anglo-Saxon Bismarckian Southern Eastern29

Age-standardized prevalence of edentulousness by occupation and welfare state regime (Participants aged ≥45 years from 21 European countries)
0
5
10
15
20
25
30
Scandinavian Anglo-Saxon Bismarckian Southern Eastern
Managers and professionals Intermediate Manual workers
*
*
**
*
* P for trend ≤ 0.01
Guarnizo-Herreno et al, 2012

Results
Relative inequalities in no functional dentition by welfare state type
Welfare
State Regime
Socioeconomic position measure
Education Occupational class Subjective social status
RII 95% CI RII 95% CI RII 95% CI
Scandinavian 3.81 2.68 - 5.42 3.79 2.65 - 5.41 2.95 2.08 - 4.18
Anglo-Saxon 1.89 1.22 - 2.92 2.36 1.53 - 3.65 1.46 0.92 - 2.33
Bismarckian 2.22 1.74 - 2.84 1.59 1.27 - 2.00 1.46 1.14 - 1.85
Southern 1.79 1.21 - 2.65 1.91 1.24 - 2.94 2.15 1.58 - 2.92
Eastern 1.57 1.34 - 1.84 1.88 1.53 - 2.31 1.40 1.23 - 1.59
p-valuea <0.001 0.925 0.311
a p-value of the interaction between each SEP score and welfare state regime
31

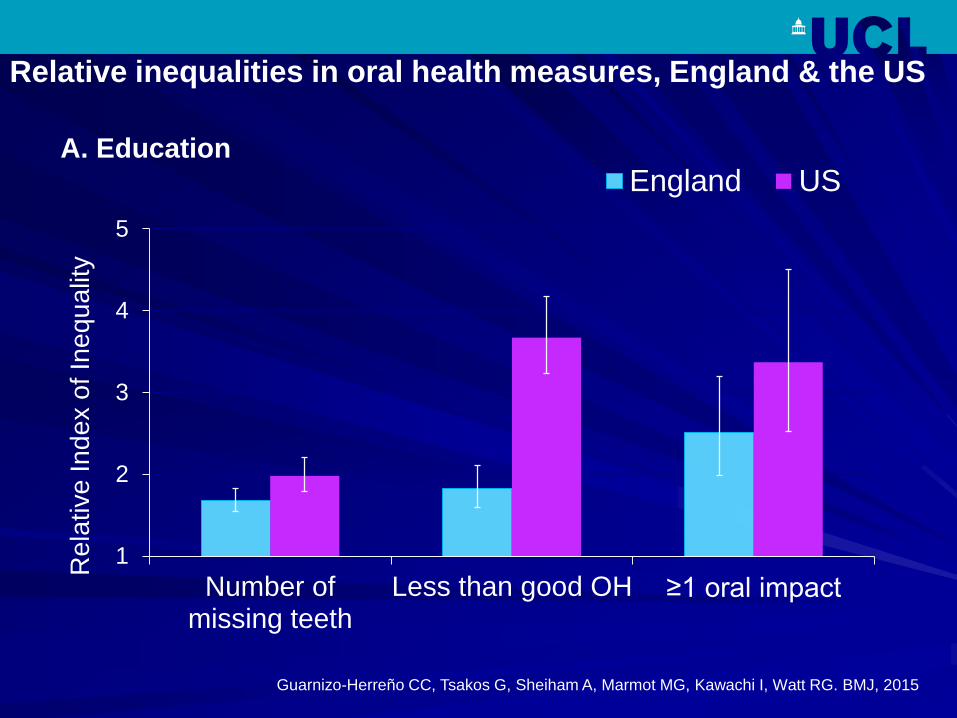
1
2
3
4
5
Number ofmissing teeth
Less than good OH ≥1 oral impact
Re
lative
In
de
x o
f In
eq
ua
lity
England US
Relative inequalities in oral health measures, England & the US
Guarnizo-Herreño CC, Tsakos G, Sheiham A, Marmot MG, Kawachi I, Watt RG. BMJ, 2015
A. Education


Summary
Significant association
between clinical & subjective
oral health outcomes and
various SEP markers
Universal social gradient
Pattern across the life course
Inequalities exist in different
populations and settings
(Watt and Sheiham, 1999; Locker 2001; Hobdell et al ., 2012)

www.ucl.ac.uk/dph
Determinants of health
inequalities
DENTAL PUBLIC HEALTH

Oral health determinants
Bio-medical perspective
– Oral hygiene
– Sugars consumption
– Smoking and alcohol
– Exposure to fluoride
– Use of dental services

Paradigm shifts in
aetiological perspectives
Biological - biomedical approach
“Lifestyle” - public health behaviourism
Social determinants agenda

Social determinants of
health

www.who.int/social_determinants

The Social Determinants of Health
The poor health of the poor, the social gradient in health
within countries and the marked inequities between
countries are caused by:
Commission on Social Determinants of Health, 2008
Structural determinants
The unequal distribution in power, money, goods and services,
globally, nationally and locally
Conditions of daily life
The consequent unfairness in the immediate, visible
circumstances in people’s lives - access to schools, education,
health care, conditions of work and leisure, their homes,
communities, towns or cities

Social determinants of health
CSDH (2008)

Complex influences on health
Healthindividuals & communities
Wider influences
Lifestyle factors

Socio economic & political context
Macro economic policies
Social & welfare policies
Political autonomy
Discrimination
Globalisation
Socioeconomic Position
Social Class
Gender
Ethnicity
Occupation
Income
Material & social circumstances
Living & working conditionsFood securitySocial capital
Behaviour & biological factorsAge, genetics
Inflammatory ProcessesInfections
Psychosocial FactorsStress
Perceived controlSocial support
Health ServicesQuality of care
Appropriate AccessEvidenced based preventive
orientation
Oral health inequalities
&
Social gradient
Structural Determinants(Political and economic drivers)
Intermediary Determinants(Circumstances & risk for oral disease)
Adapted CSDH Framework (WHO 2008)
Conceptual Framework for Social Determinants of Oral Health Inequalities


Prevailing preventive
paradigm

Does this approach work?

Effectiveness Reviews Brown (1994)
Schou and Locker (1994)
Kay and Locker (1996)
Sprod, Anderson and Treasure
(1996)
Kay and Locker (1998)
Department of Human
Services (1999)
Watt and Marinho (2005)
Yevlahova and Satur (2009)
PHE (2014)

Limitations with education &
clinical prevention
Ineffective in reducing inequalities - fails to tackle causes
Costly - high professional
input
Non sustainable
Duplication of effort
Public apathy and
resistance

Inverse prevention law
Even when interventions are successful at
improving health across the population,
they may increase health inequalities.
(Gordon et al., 1999; Lorenc et al., 2012)

Scottish dental health education intervention
(Schou L, Wight C: Does dental health education affect inequalities in dental health? Community Dent Health 1994, 11(2):97-100.)
0
5
10
15
20
25
30
35
40
45
Beforeintervention
1 monthafter
4 monthafter
Plaque index=0
Non-deprived Deprived
60
65
70
75
80
85
Beforeintervention
1 monthafter
4 monthafter
No bleeding
Non-deprived Deprived

Summary
Dominant preventive approach ineffective
in tackling inequalities
Too clinical, narrowly focused on high risk
groups
Urgent need to adopt a radically different
approach

www.ucl.ac.uk/dph
Time for change in approach
Dental Public Health
ucl.ac.uk/dph

Implications for health
improvement

What does the evidence
show?
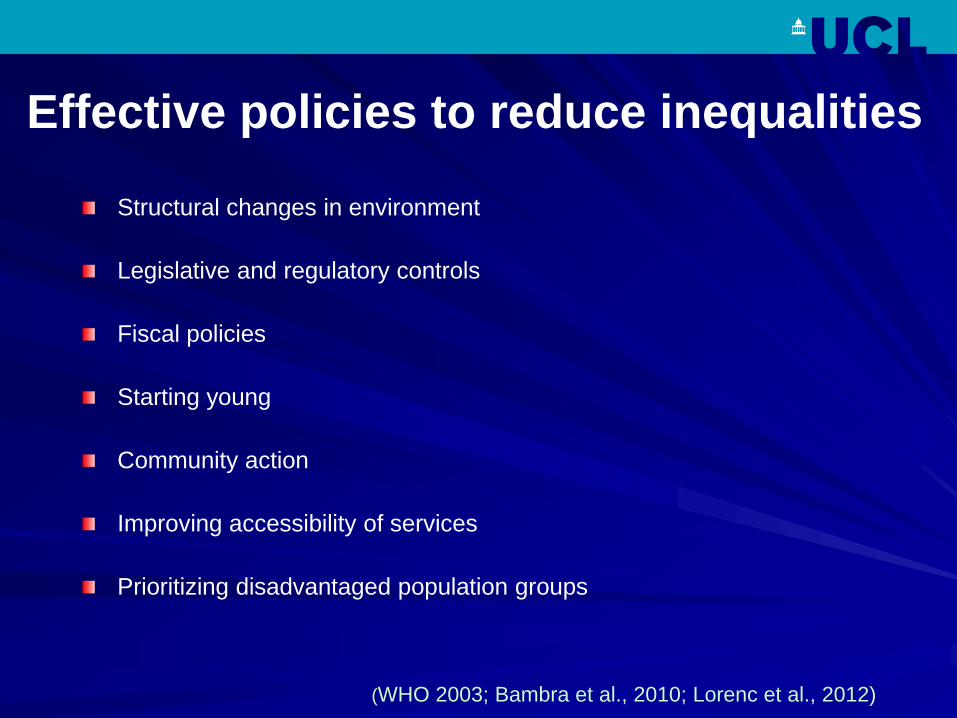
Effective policies to reduce inequalities
Structural changes in environment
Legislative and regulatory controls
Fiscal policies
Starting young
Community action
Improving accessibility of services
Prioritizing disadvantaged population groups
(WHO 2003; Bambra et al., 2010; Lorenc et al., 2012)

Ineffective interventions – increase inequalities
Information based campaigns (mass media
programmes)
Written materials (leaflets and posters)
Campaigns reliant on people taking the initiative
to opt in
Health education campaigns designed for the
whole population
(MacIntyre, 2007; Lorenc et al., 2012)
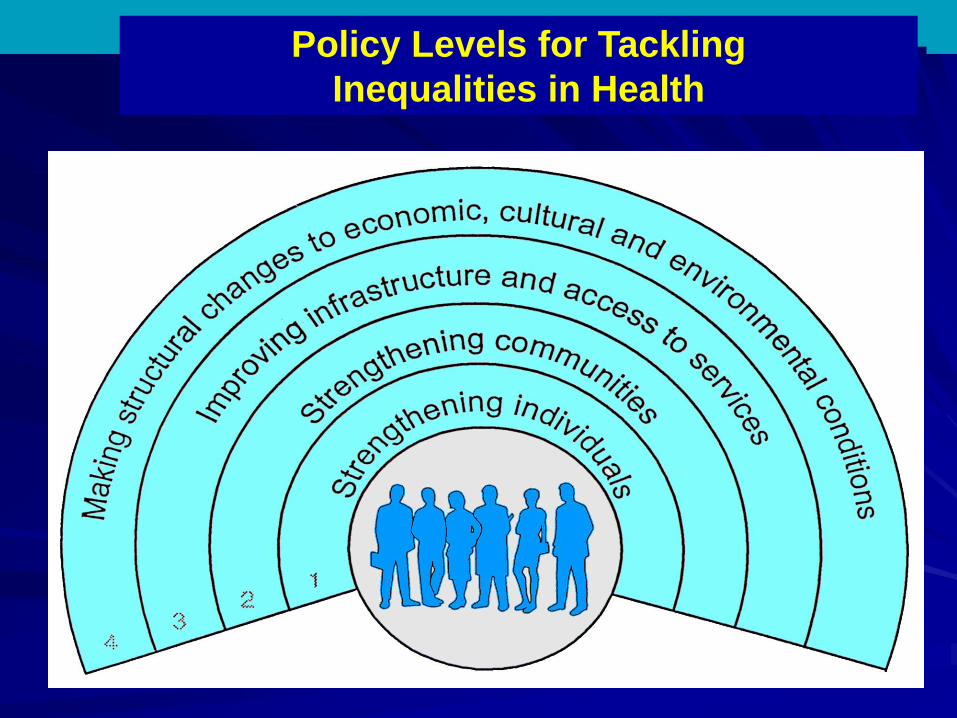
Policy Levels for Tackling
Inequalities in Health


www.ucl.ac.uk/dph
Role of clinical staff
Dental Public Health
ucl.ac.uk/dph

Role of clinical teams
Population focus
Delivery of evidence based
prevention
Organisational review of
practice policy – access,
equity
Partnership working
Local advocacy role

www.ucl.ac.uk/dph
Role of dental associations
Dental Public Health
ucl.ac.uk/dph

Role of national dental
associations
Recognition of the importance of
addressing inequalities & role of
profession
Training and capacity building across
profession
Advocacy and lobbying role – policy arena
Partnership working across professional
groups

www.ucl.ac.uk/dph
Public health approach
Dental Public Health
ucl.ac.uk/dph


Is sugar the new tobacco?

New Nutrition Guidance WHO (2015)


Theme 1
Produce
and
import
less
Theme 2
Use less
Theme 3
Sell less
Theme 4
Market
less
Theme 5
Advise to
eat less
Theme 6
Eat less
Upstream Downstream

Theme 1
Produce
and
import
less
Theme 2
Use less
Theme 3
Sell less
Theme 4
Market
less
Theme 5
Advise to
eat less
Theme 6
Eat less
Upstream Downstream
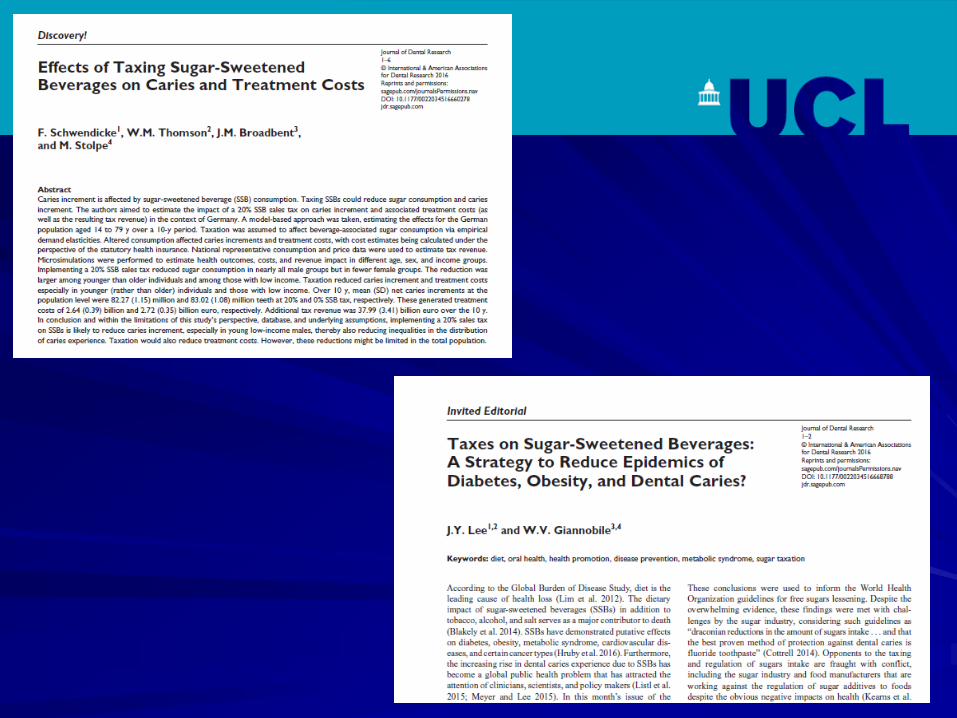
Taxes on sugary products
Retail restrictions on high sugar foods
Reduce portion sizes of sugary foods


Nature of evidence
At least 6 systematic and narrative reviews of international evidence
Published from 2010-2015
Evidence from economic modelling, lab experiments, ecological
analysis and limited number of experimental studies (very few
RCTs)
Range of diet and other outcomes assessed (very few health
outcomes)

Opportunities for action
Action possible in wide range of levels and settings
Role of EADPH at international level lobbying & evidence
Community and local level
– Local Authority settings eg leisure facilities
– Schools, nurseries etc – part of food policy
Inequalities agenda
Partnership working essential
Need for careful community engagement

www.ucl.ac.uk/dph
Collaborative international action
DENTAL PUBLIC HEALTH

Thursday 21st May 2015
Royal College of General Practitioners, London, UK
Launch ConferenceIn Partnership with Public Health England
www.icohirp.com


Conclusions
Global challenge of addressing oral health inequalities
Need to recognise limitations of biomedical preventive
model
Time to adopt a social determinants approach in oral
health policy at local, national & international levels
Importance of collaborative international action

Thank you
www.ucl.ac.uk/dph
www.icohirp.com