optimizing the management of the poor responder kaylen silverberg, m.d. texas fertility center...
TRANSCRIPT

Optimizing the Management of the
Poor ResponderKaylen Silverberg, M.D.
Texas Fertility Center
Austin, Texas
San Antonio, Texas
2 Choices
Donor OocytesBreak, eat, visit, enjoy weather
Listen to lectureArgue, get grumpy, be depressed...Until we conclude with Donor Oocytes

AgendaDefinitionsPathophysiologyOvarian Reserve TestingTreatment AlternativesNovel Approaches

Who Is the Poor Responder?
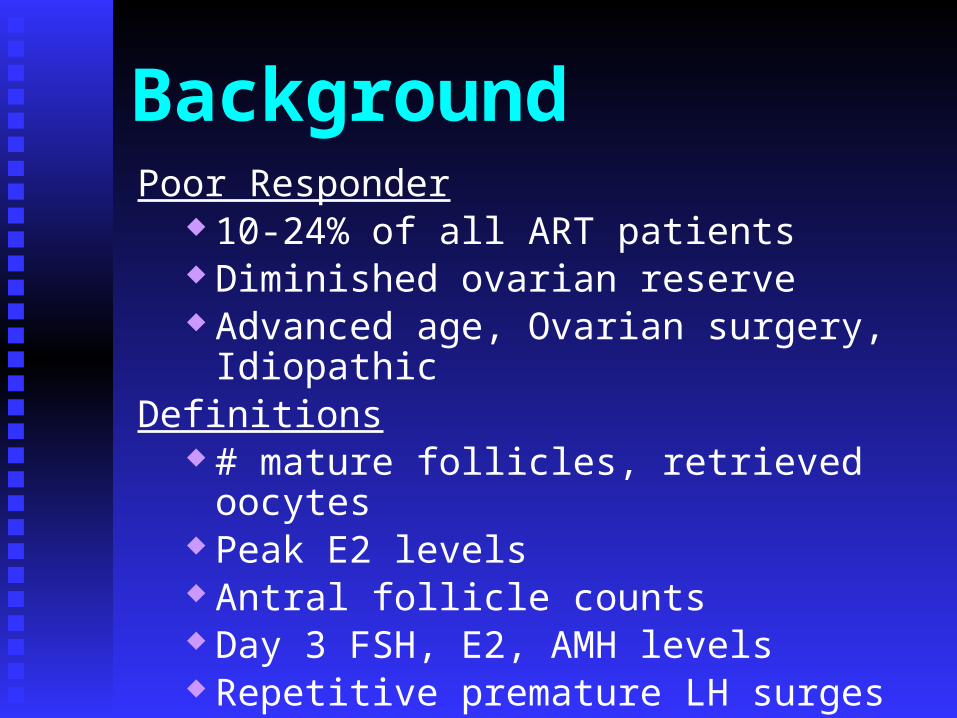
BackgroundPoor Responder
10-24% of all ART patients Diminished ovarian reserve Advanced age, Ovarian surgery, Idiopathic
Definitions # mature follicles, retrieved oocytes Peak E2 levels Antral follicle counts Day 3 FSH, E2, AMH levels Repetitive premature LH surges Over 20 published definitions (and climbing…)
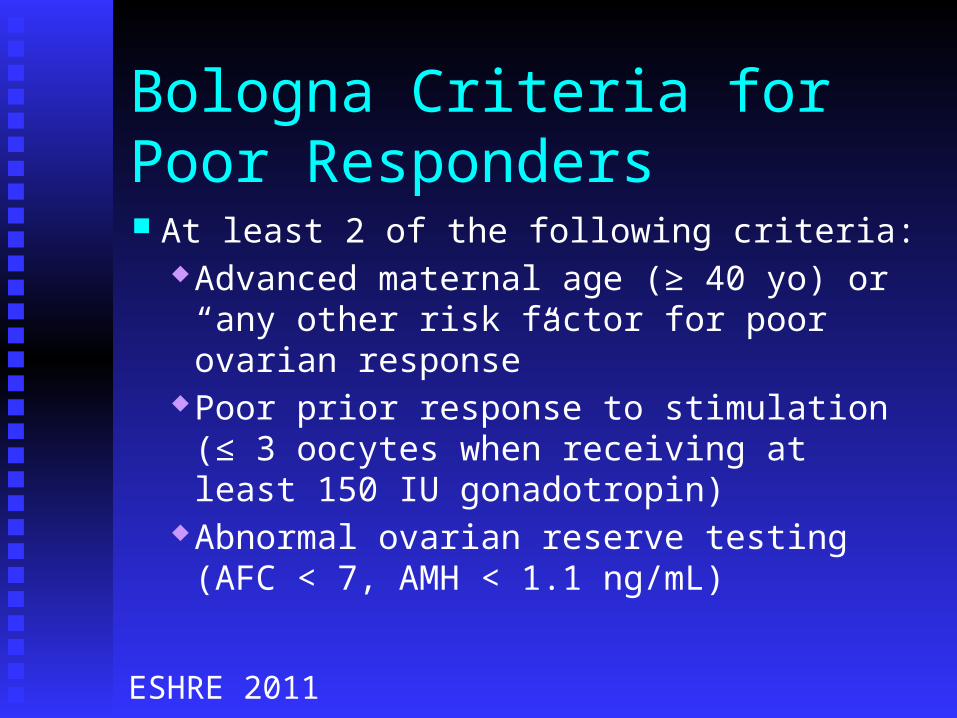
Bologna Criteria for Poor Responders At least 2 of the following criteria:
Advanced maternal age (≥ 40 yo) or “any other risk factor for poor ovarian response”
Poor prior response to stimulation (≤ 3 oocytes when receiving at least 150 IU gonadotropin)
Abnormal ovarian reserve testing (AFC < 7, AMH < 1.1 ng/mL)
ESHRE 2011
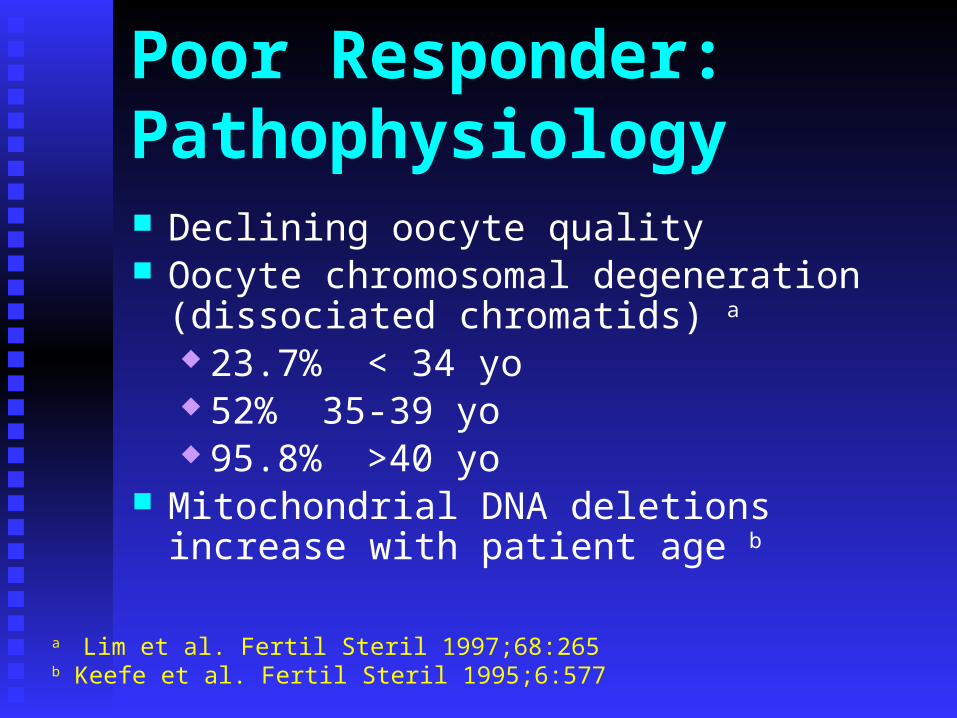
Poor Responder: Pathophysiology Declining oocyte quality Oocyte chromosomal degeneration (dissociated
chromatids) a
23.7% < 34 yo 52% 35-39 yo 95.8% >40 yo
Mitochondrial DNA deletions increase with patient age b
a Lim et al. Fertil Steril 1997;68:265b Keefe et al. Fertil Steril 1995;6:577

Hormonal Tests of Ovarian ReserveDay 3 FSH LevelsDay 3 Estradiol LevelsInhibin B LevelsAMHClomiphene Challenge Testing
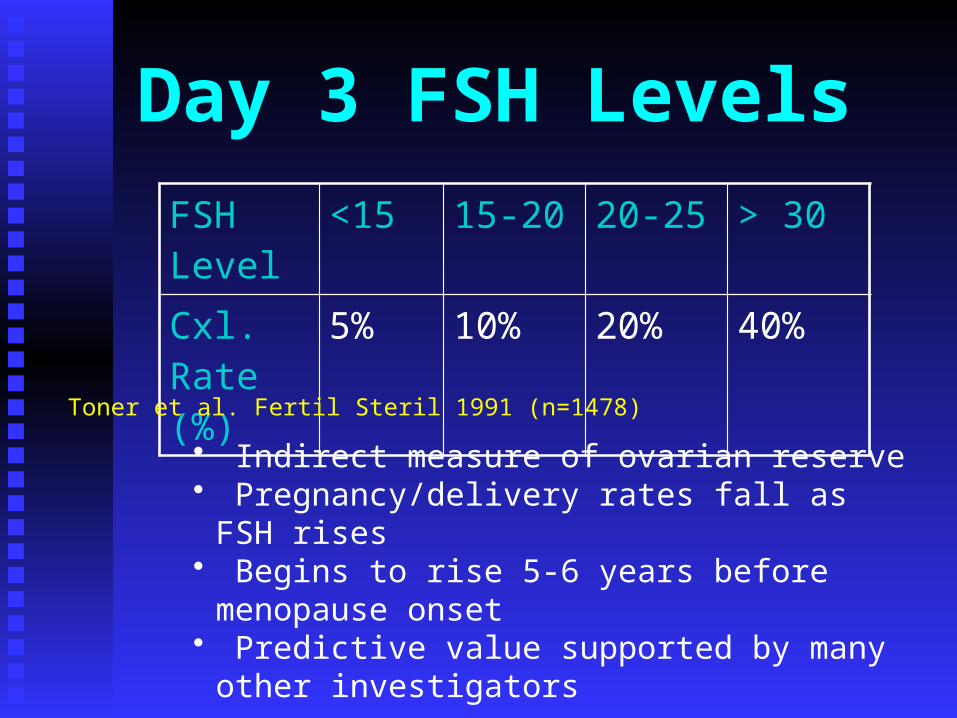
Day 3 FSH LevelsFSH Level
<15 15-20 20-25 > 30
Cxl. Rate (%)
5% 10% 20% 40%
Toner et al. Fertil Steril 1991 (n=1478)
• Indirect measure of ovarian reserve• Pregnancy/delivery rates fall as FSH rises• Begins to rise 5-6 years before menopause onset• Predictive value supported by many other
investigators
• Elevated D3 FSH portends poor response, but many poor responders have normal D3 FSH levels

Day 3 Estradiol Levels
Smotrich1995
292 < 80 pg/mL 0.4% 37%
> 80 18.5% 14.8%Licciardi 452 < 75 pg/mL 20
> 75 0
Author # Pts D3 E2 Cxl(%) Preg(%)
• Proposed mechanism involves negative hypothalamic feedback on FSH, leading to false negative FSH levels
• Most studies suggest no incremental value overDay 3 FSH alone (ASRM Practice Committee, 2015)

Basal FSH & E2 Variability
0
10
20
30
40
50
60
70
FSH Estradiol
CD 2CD 3CD 4CD 5
Hansen et al Hum Reprod 1996;11:486

Predictors of Ovarian ReserveNormal Responders
(n=84)
Poor Responders(n=36)
P
D3 FSH 6.6 12.9 <0.001
D3 E2 167 270 .58D3 Inhibin 118 70 <0.001
Antral Foll 11.6 4.2 <0.001# oocytes 9.5 2.1 <0.001Preg rate 31/77 3/30 .003
Laszlo et al. Fertil Steril 2002;77:328

AMH as a Predictor of Ovarian Reserve Retro analysis of 2 multicenter RCTs
comparing AMH to AFC n=519 and 686 Reviewed long GnRH-A and GnRH-ant
cycles AMH more strongly correlated with oocyte
yield (r=0.56 vs. 0.28; agonist), (r=0.55 vs. 0.33; antagonist)
Nelson SM, et al; Fertil Steril 2015;103:923
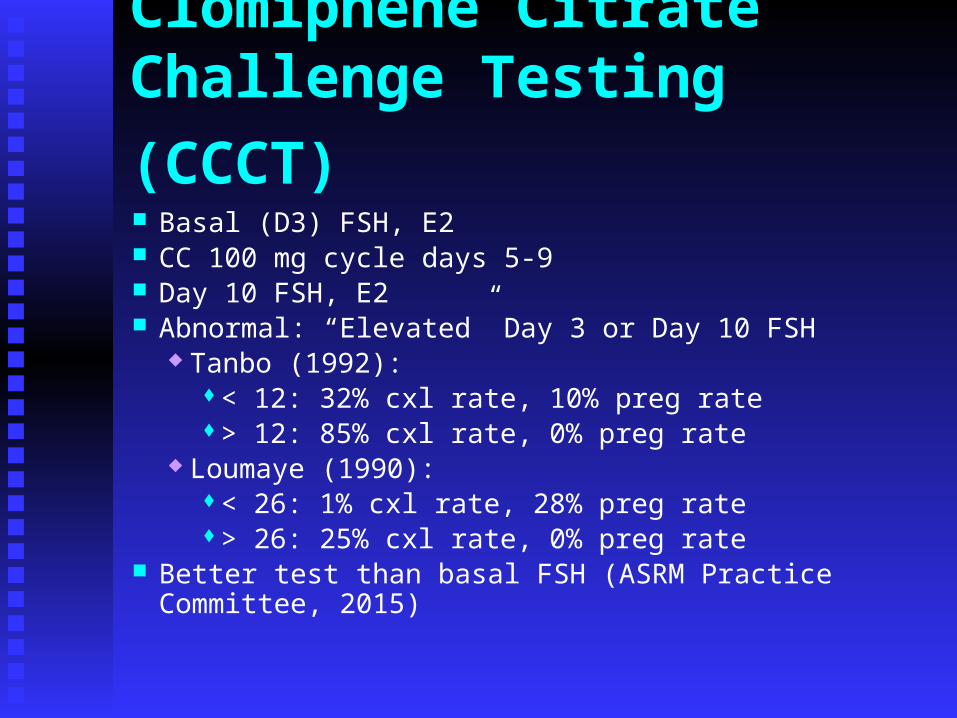
Clomiphene Citrate Challenge
Testing (CCCT) Basal (D3) FSH, E2 CC 100 mg cycle days 5-9 Day 10 FSH, E2 Abnormal: “Elevated” Day 3 or Day 10 FSH
Tanbo (1992): < 12: 32% cxl rate, 10% preg rate > 12: 85% cxl rate, 0% preg rate
Loumaye (1990): < 26: 1% cxl rate, 28% preg rate > 26: 25% cxl rate, 0% preg rate
Better test than basal FSH (ASRM Practice Committee, 2015)

Sonographic Evaluation of Ovarian Reserve
Antral follicle countsOvarian volume (not
recommended by ASRM, 2015)Doppler imaging techniques

Antral Follicle Counts 2-5 mm antral follicles Typically measured on Day 2 or 3 Correlates with Day 3 FSH, amount of
gonadotropin used, peak E2 level, # oocytes, and pregnancy rates a
Better predictor of ovarian response than patient age, D3 FSH level b, or inhibin B level c,d
Normal responders typically have > 10 antral follicles vs. < 5 for poor responders b,e
a Chang et al. Fertil Steril 1998;69:505b Beckers, et al. Hum Reprod 2000;15:43c Fauser Fertil Steril 2000;74:629 d Laszlo et al. Fertil Steril 2002;77:328e Beckers, et al. Fertil Steril 2002;78:291
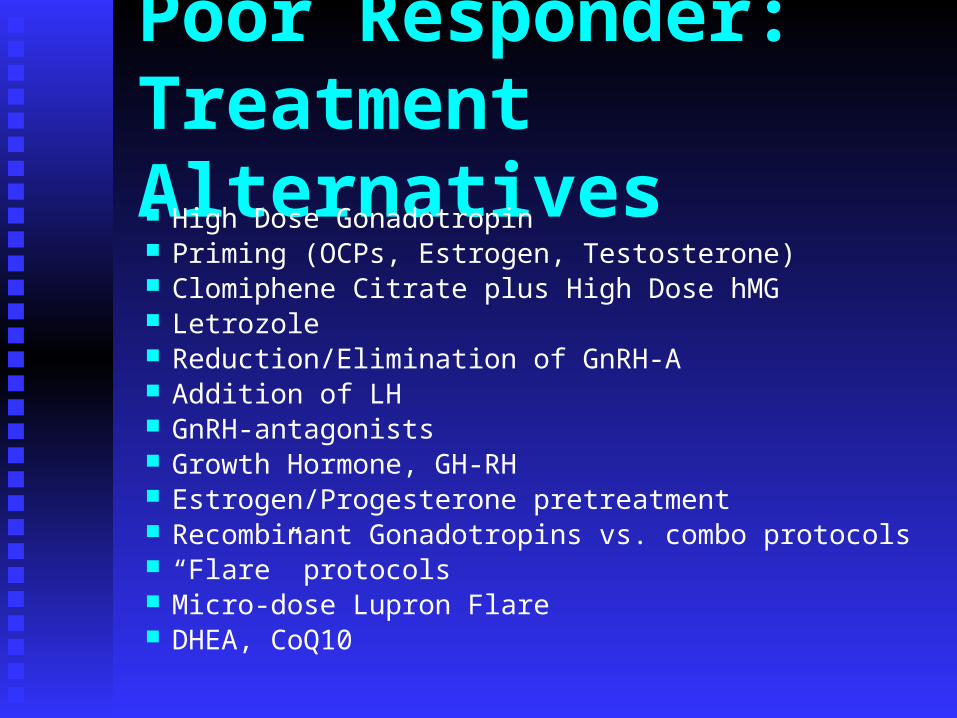
Poor Responder: Treatment Alternatives High Dose Gonadotropin Priming (OCPs, Estrogen, Testosterone) Clomiphene Citrate plus High Dose hMG Letrozole Reduction/Elimination of GnRH-A Addition of LH GnRH-antagonists Growth Hormone, GH-RH Estrogen/Progesterone pretreatment Recombinant Gonadotropins vs. combo protocols “Flare” protocols Micro-dose Lupron Flare DHEA, CoQ10

High Dose Gonadotropin Therapy
Laufer 1982
Land 1996
Karande 1990
Hershlag1996
Design R P R R
N 55 126 34 48
Old/New hMG dose
150/225 Doubled 300/450 225/300-600
Change in E2 peak?
YES NO
Increase in # oocytes
YES YES NO NO
Improved Outcome?
NO NO NO NO
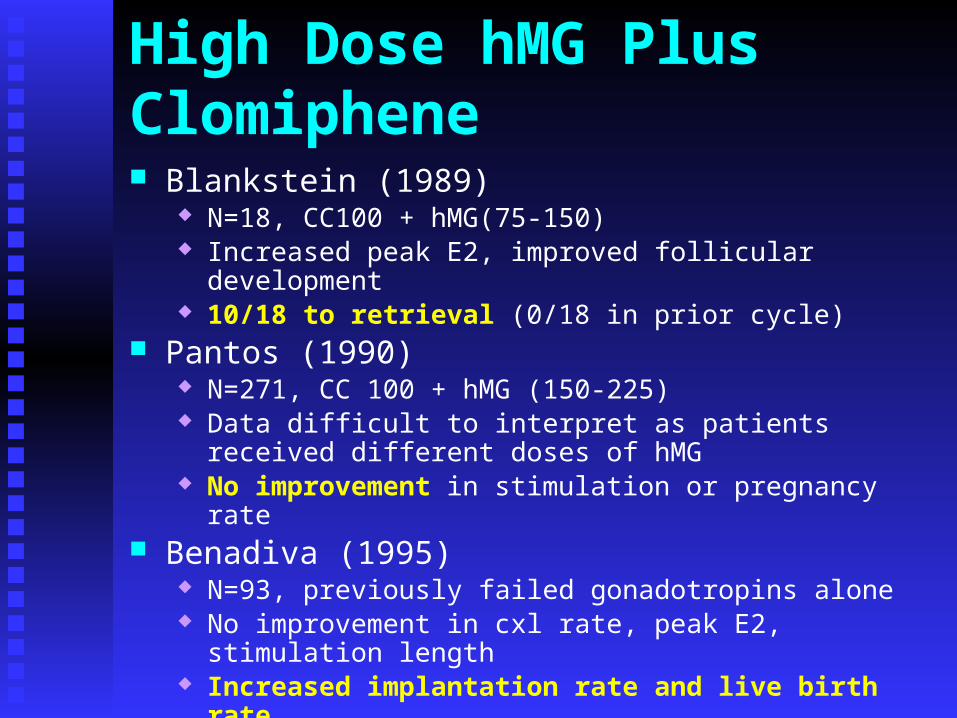
High Dose hMG Plus Clomiphene Blankstein (1989)
N=18, CC100 + hMG(75-150) Increased peak E2, improved follicular development 10/18 to retrieval (0/18 in prior cycle)
Pantos (1990) N=271, CC 100 + hMG (150-225) Data difficult to interpret as patients received different doses of
hMG No improvement in stimulation or pregnancy rate
Benadiva (1995) N=93, previously failed gonadotropins alone No improvement in cxl rate, peak E2, stimulation length Increased implantation rate and live birth rate
Cycle cxl rates of 25-30% due to LH surge

Poor Responders: Letrozole
N=147, OCP/hMG150/FSH225 Antagonist at 14mm
Letrozole (n=71)
Control (n=76)
P
Oocytes 6.1 4.3 0.03
Peak E2 384 485 NS
PR/cycle (%) 22 15 NS
Garcia-Velasco et al. Fertil Steril 2005;84:82

Poor Responders: Letrozole
P,R;N=70, OCP/rFSH 450 ± Letrozole 5mg Antagonist “flexible” dosing
Letrozole (n=35)
Control (n=35)
P
Total FSH 2980 3850 <0.05
Cycle Cxl 8.6 28.6 <0.05
PR/ET (%) 25.8 20 NS
Ozmen, et al RBM online. 2009;19:478-85

Adjunctive GnRH-agonistsAdvantages Lower cancellation rates Prevents LH surge Higher peak E2 levels Greater number of retrieved oocytes Higher pregnancy ratesDisadvantages Longer stimulations Direct ovarian suppression More exogenous gonadotropin required

“Stop” GnRH-a Protocol Administer luteal GnRH-a until onset of menses High dose gonadotropin therapyFaber:
12.5% cxl rate Over half of the patients produced > 10 oocytes, and had 3
embryos for transfer Clinical pregnancy rate 32.5% per transfer
Dirnfield: No benefit
Wang: 13.5% cxl rate Clinical pregnancy rate 20.5% per transfer
Faber, et al. Fertil Steril 1998;69:826 Dirnfield et al. Fertil Steril 1999;72:406Wang et al. J Asst Reprod Genet 2002;19:1
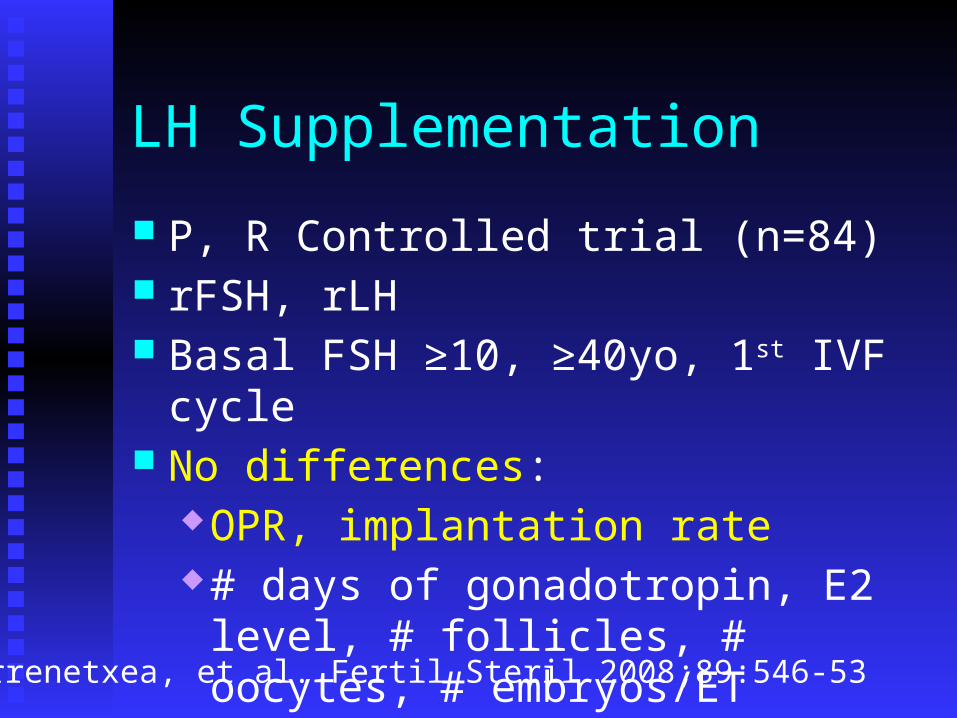
LH Supplementation
P, R Controlled trial (n=84) rFSH, rLH Basal FSH ≥10, ≥40yo, 1st IVF cycle No differences:
OPR, implantation rate# days of gonadotropin, E2 level, #
follicles, # oocytes, # embryos/ET
Barrenetxea, et al. Fertil Steril 2008;89:546-53
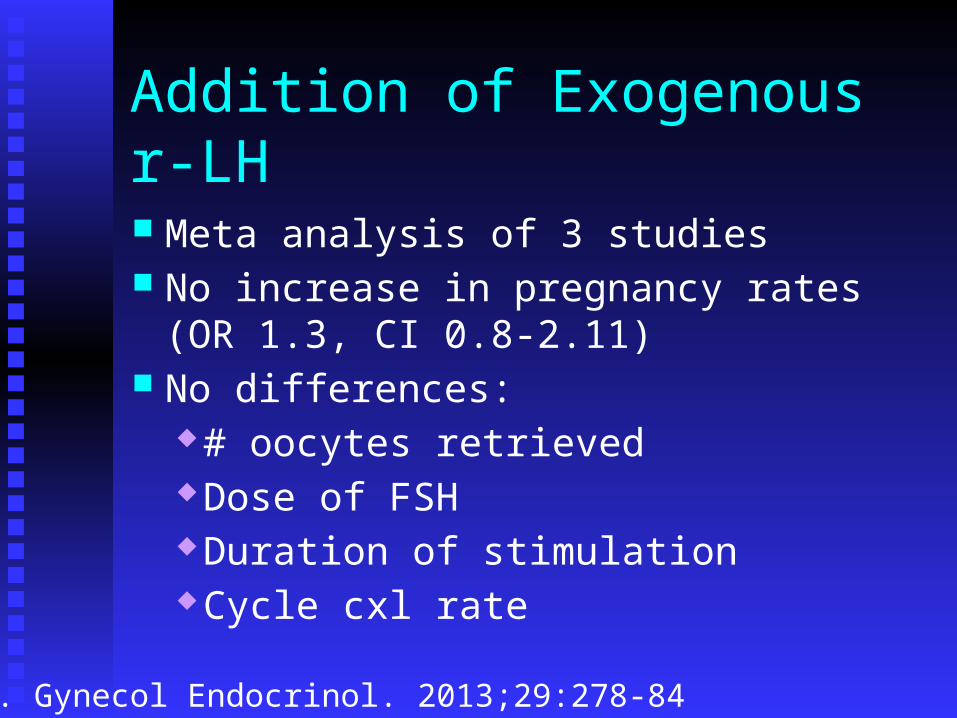
Addition of Exogenous r-LH
Meta analysis of 3 studies No increase in pregnancy rates (OR 1.3, CI
0.8-2.11) No differences:
# oocytes retrieved Dose of FSH Duration of stimulation Cycle cxl rate
Fan et al. Gynecol Endocrinol. 2013;29:278-84

GnRH Antagonists Directly, quickly suppress pituitary FSH, LH
production Lessen duration of direct ovarian suppressive
effect Daily dose (0.25mg) vs single dose (3 mg) –
equally effective a,b,c
Optimal size for antagonist initiation?? 12-13 mm 14-15 mm or larger??
a,b Olivennes et al Hum Reprod 1998;13:2411, RBM Online 6;4:432, 2003c Albano et al Fertil Steril 1997;67:917
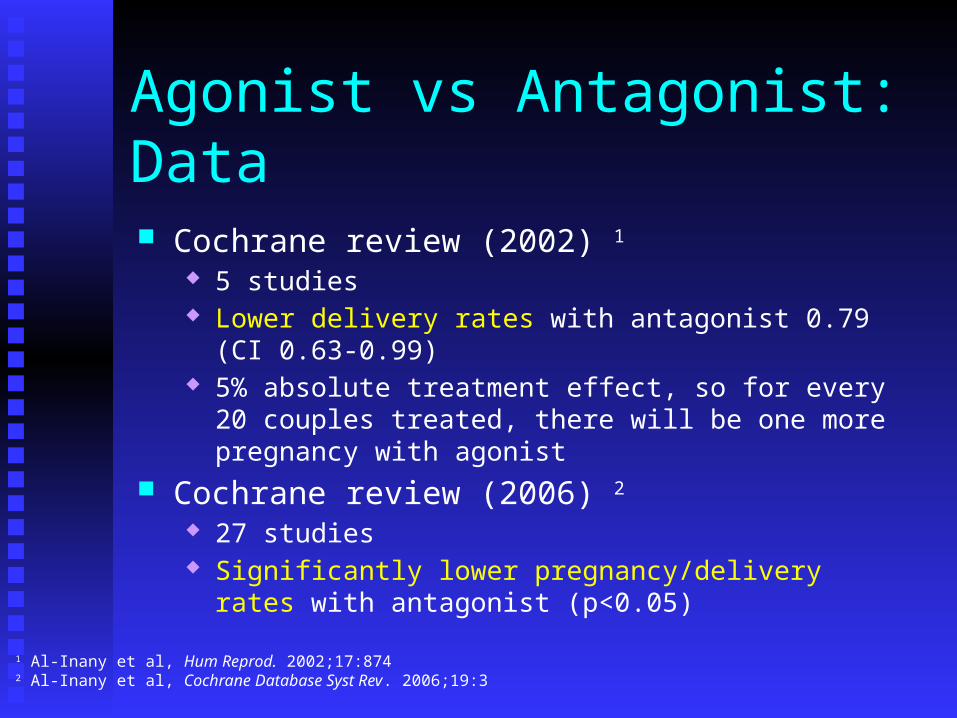
Agonist vs Antagonist: Data
Cochrane review (2002) 1
5 studies Lower delivery rates with antagonist 0.79 (CI 0.63-0.99) 5% absolute treatment effect, so for every 20 couples treated,
there will be one more pregnancy with agonist Cochrane review (2006) 2
27 studies Significantly lower pregnancy/delivery rates with antagonist
(p<0.05)
1 Al-Inany et al, Hum Reprod. 2002;17:8742 Al-Inany et al, Cochrane Database Syst Rev. 2006;19:3
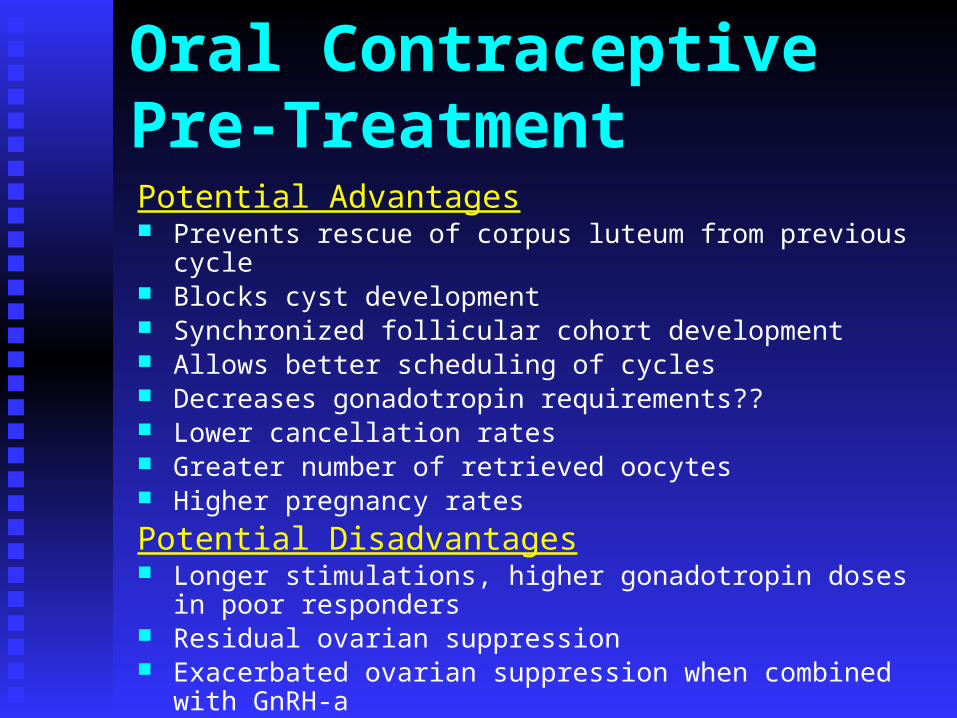
Oral Contraceptive Pre-TreatmentPotential Advantages Prevents rescue of corpus luteum from previous cycle Blocks cyst development Synchronized follicular cohort development Allows better scheduling of cycles Decreases gonadotropin requirements?? Lower cancellation rates Greater number of retrieved oocytes Higher pregnancy rates
Potential Disadvantages Longer stimulations, higher gonadotropin doses in poor responders Residual ovarian suppression Exacerbated ovarian suppression when combined with GnRH-a

Oral Contraceptive PretreatmentNo OCPs OCPs P
Baseline Cysts > 10 mm (%)
24 0 < 0.05
E2 < 50 pg/mL (%) 62 100 < 0.05
Peak E2 (pg/mL) 1688 (188) 2431 (501) < 0.05
# oocytes 9.9 (1.0) 11.8 (1.2) < 0.05
Fertilization (%) 55.7 69.1 < 0.05
Testosterone (ng/mL)
41.9 (9.8) 25.1 (3.4) < 0.05
Gelety, TJ: ASRM abstract 010, 1997
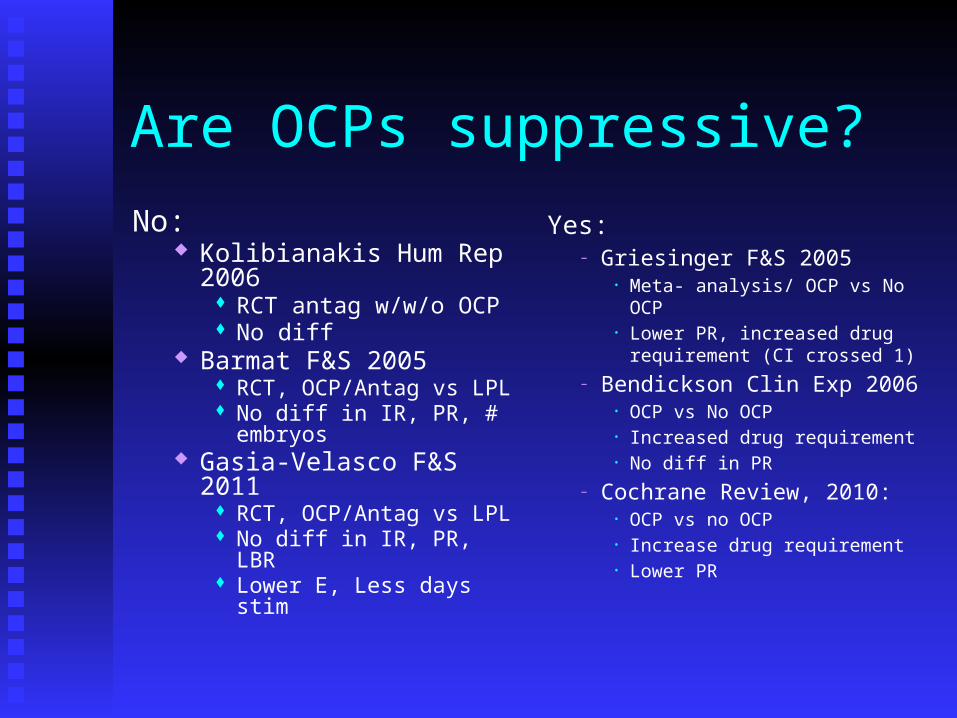
Are OCPs suppressive?
No: Kolibianakis Hum Rep
2006 RCT antag w/w/o OCP No diff
Barmat F&S 2005 RCT, OCP/Antag vs LPL No diff in IR, PR, #
embryos Gasia-Velasco F&S 2011
RCT, OCP/Antag vs LPL No diff in IR, PR, LBR Lower E, Less days stim
Yes:– Griesinger F&S 2005
• Meta- analysis/ OCP vs No OCP
• Lower PR, increased drug requirement (CI crossed 1)
– Bendickson Clin Exp 2006• OCP vs No OCP• Increased drug requirement• No diff in PR
– Cochrane Review, 2010:• OCP vs no OCP• Increase drug requirement• Lower PR
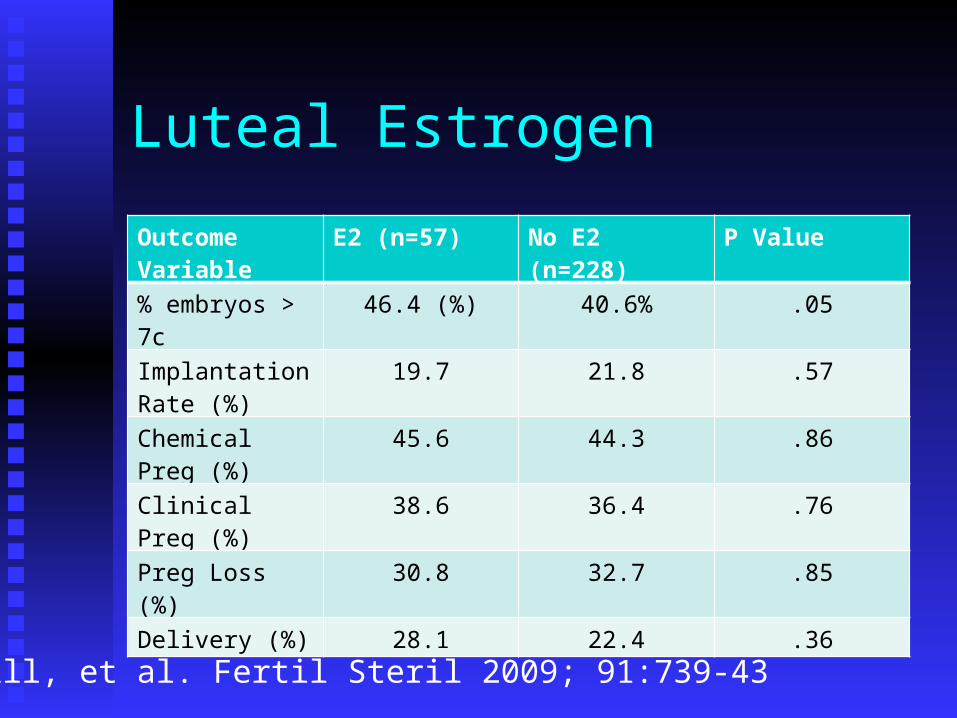
Luteal Estrogen
Hill, et al. Fertil Steril 2009; 91:739-43
Outcome Variable
E2 (n=57) No E2 (n=228) P Value
% embryos > 7c 46.4 (%) 40.6% .05
Implantation Rate (%)
19.7 21.8 .57
Chemical Preg (%)
45.6 44.3 .86
Clinical Preg (%) 38.6 36.4 .76
Preg Loss (%) 30.8 32.7 .85
Delivery (%) 28.1 22.4 .36
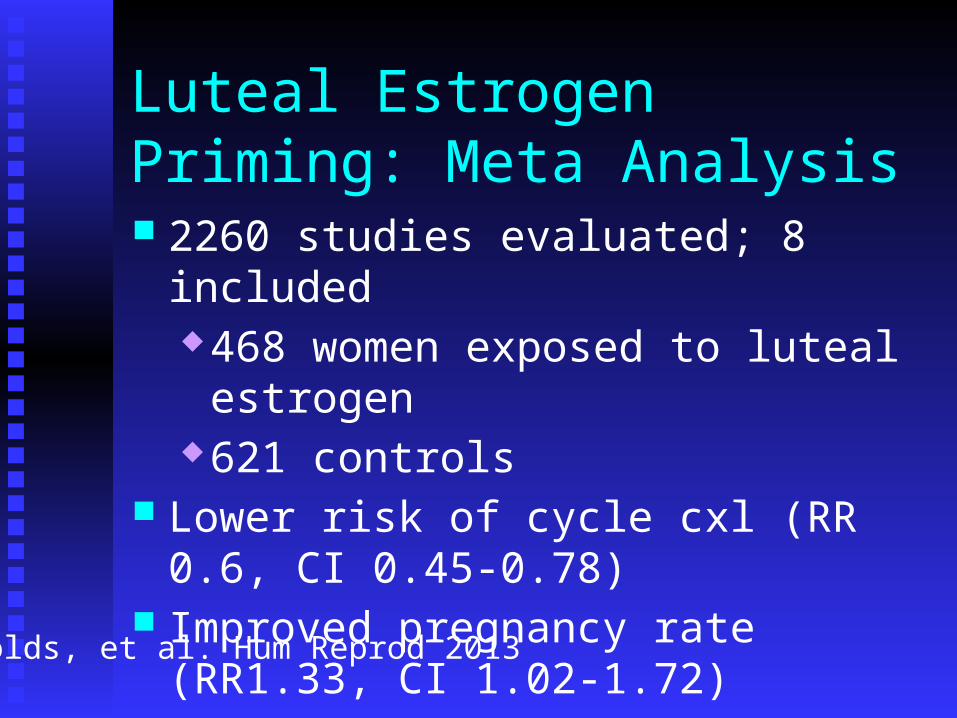
Luteal Estrogen Priming: Meta Analysis 2260 studies evaluated; 8 included
468 women exposed to luteal estrogen621 controls
Lower risk of cycle cxl (RR 0.6, CI 0.45-0.78)
Improved pregnancy rate (RR1.33, CI 1.02-1.72)
Reynolds, et al. Hum Reprod 2013
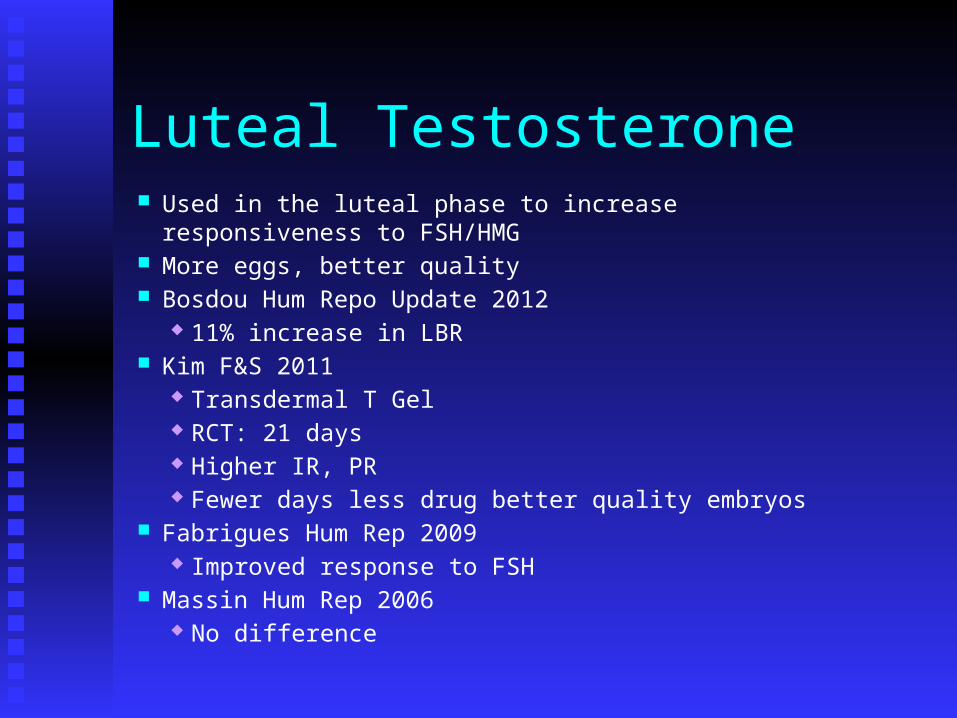
Luteal Testosterone Used in the luteal phase to increase responsiveness to FSH/HMG More eggs, better quality Bosdou Hum Repo Update 2012
11% increase in LBR Kim F&S 2011
Transdermal T Gel RCT: 21 days Higher IR, PR Fewer days less drug better quality embryos
Fabrigues Hum Rep 2009 Improved response to FSH
Massin Hum Rep 2006 No difference

Comparative Trials

Recombinant FSH vs. Urinary FSH: Clinical Efficacy In randomized prospective statistically powered clinical
studies, significantly more oocytes were retrieved and less medication required with r-FSH than with u-FSH. (Bergh 97; Frydman 98; Schats et al 2000)
Pregnancy rates significantly improved
FIVNAT 1999: data from 37,211 cycles
Clinical pregnancy rates achieved with r-FSH were statistically higher than those achieved with urinary FSH (Daya et al 1999)
Meta Analysis: 12 randomized controlled trials (2875 cases, Daya, 1999)
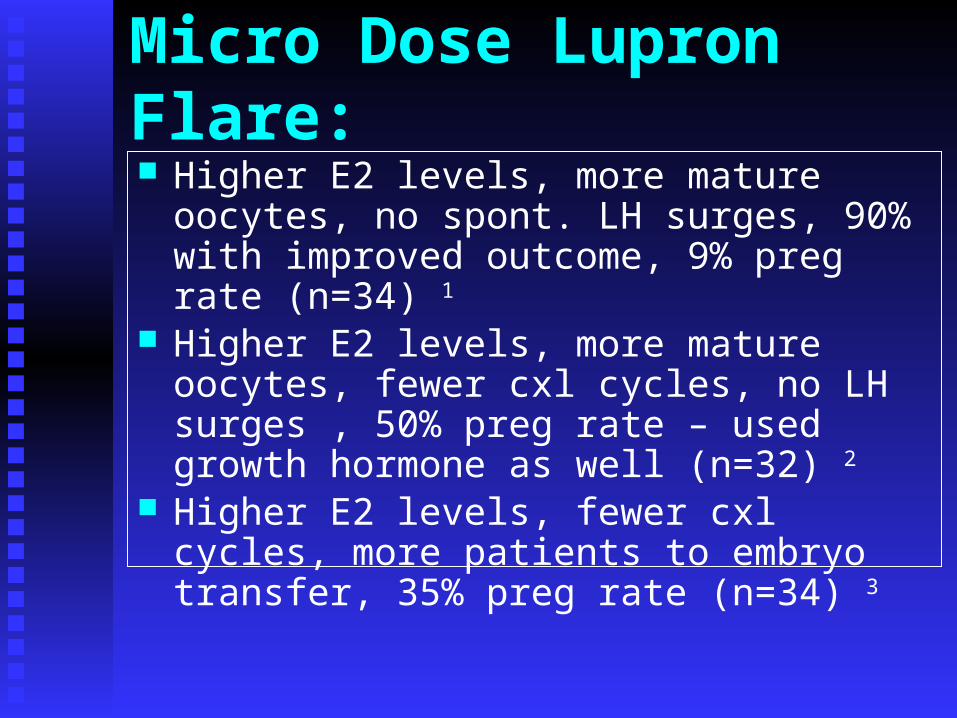
Micro Dose Lupron Flare: Higher E2 levels, more mature oocytes, no spont.
LH surges, 90% with improved outcome, 9% preg rate (n=34) 1
Higher E2 levels, more mature oocytes, fewer cxl cycles, no LH surges , 50% preg rate – used growth hormone as well (n=32) 2
Higher E2 levels, fewer cxl cycles, more patients to embryo transfer, 35% preg rate (n=34) 3
1 Scott RT, Navot D Fertil Steril 1994;61:8802 Schoolcraft W, Schlenker T, et al Fertil Steril 1997;67:933 Surrey E, et al. Fertil Steril 1998;69:419

Materials and Methods
Prospective, sequential trial of LLL and ULDLF protocols
n=53 (1997-1998) IVF LLL
LA 0.5 mg (OCP overlap or LH timing) 0.25 mg with FSH initiation hCG 10,000 IU; 2 follicles > 18 mm
Silverberg & Vaughn, ASRM, 1998
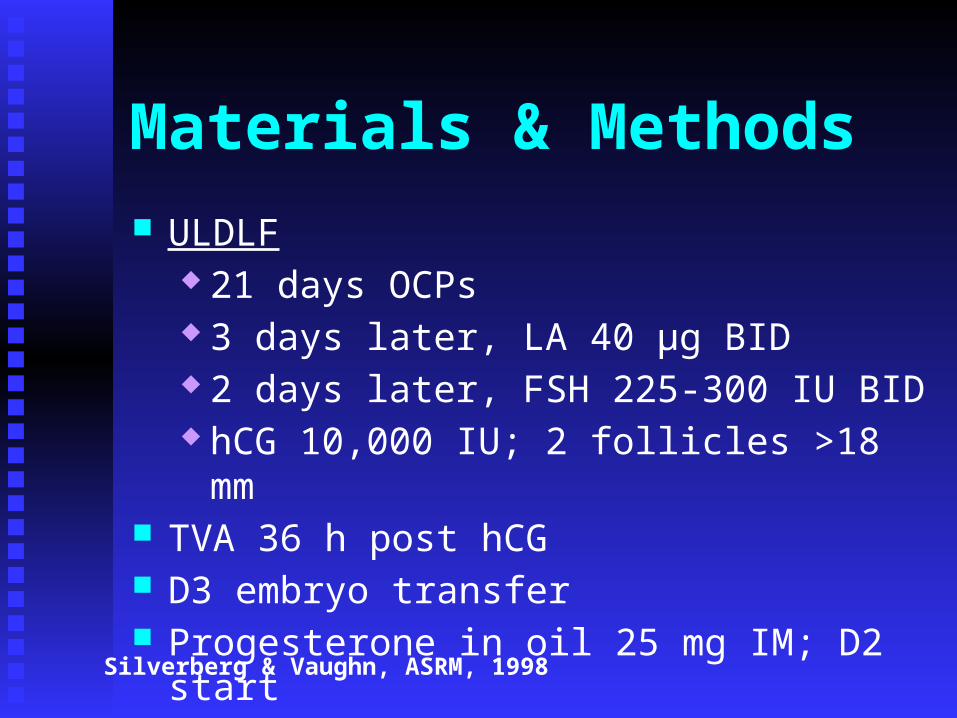
Materials & Methods
ULDLF 21 days OCPs 3 days later, LA 40 µg BID 2 days later, FSH 225-300 IU BID hCG 10,000 IU; 2 follicles >18 mm
TVA 36 h post hCG D3 embryo transfer Progesterone in oil 25 mg IM; D2 start
Silverberg & Vaughn, ASRM, 1998

Materials & Methods
4 analyses separate (n=112 cycles) completed both LLL & ULDLF (n=48) failed LLL/ completed ULDLF (n=35) failed ULDLF/ completed LLL (n=2)
Statistical Analysis t test paired t test
Silverberg & Vaughn, ASRM, 1998

Overall Results 53 poor responders 59 LLL cycles 53 ULDLF cycles Cycle Cancellation Rates
LLL 22/59 (37.3%)ULDLF 6/53 (11.3%) (p<0.05)
No spontaneous LH surges
Silverberg & Vaughn, ASRM, 1998
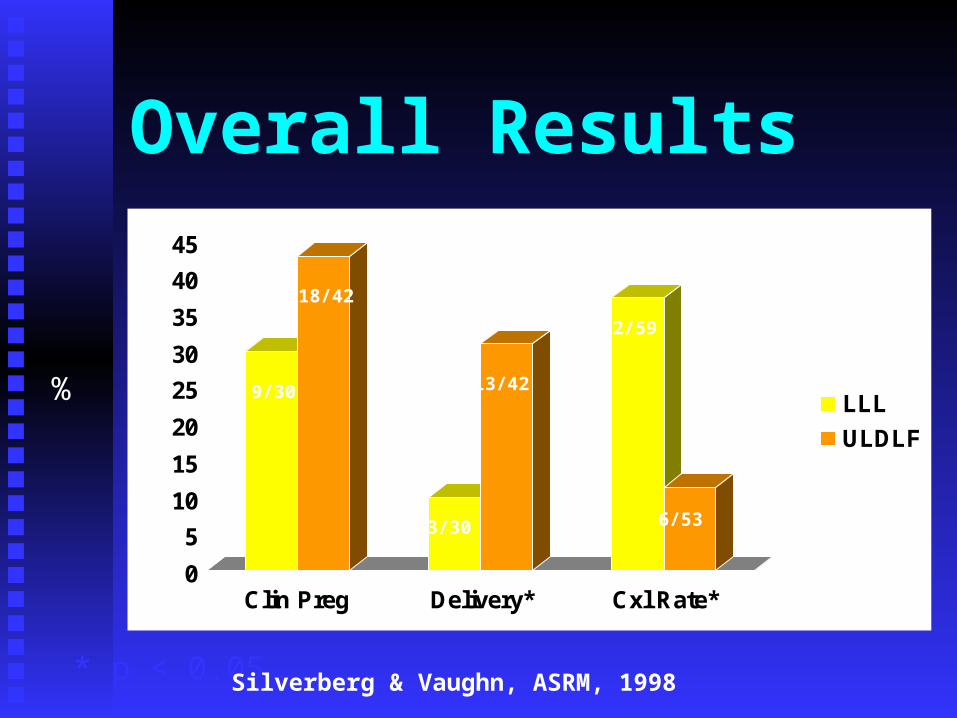
Overall Results
0
5
10
15
20
25
30
35
40
45
Clin Preg Delivery* Cxl Rate*
LLL
ULDLF
22/59
6/53
18/42
9/30 13/42
3/30
%
* p < 0.05 Silverberg & Vaughn, ASRM, 1998

Results: Direct Comparisons LLL ULDLF P
# cycles 24 24 # with ET 21 21Stim (days) 11.0 (1.5) 10.8 (2.2) 0.8Gonadotropin (IU) 4953 (1447) 6183 (1769) 0.01E2 peak (pg/mL) 1160 (507) 1390 (803) 0.2# oocytes retrieved 6.1 (2.5) 6.7 (3.7) 0.5# oocytes fertilized 4.0 (2.0) 4.6 (2.6) 0.4# embryos trans 3.5 (1.5) 3.6 (1.3) 0.8
Silverberg & Vaughn, ASRM, 1998

Results: Direct Comparisons
0
10
20
30
40
50
60
Clin Preg* Delivery* Losses*
LLL
ULDLF
11/21
9/21
2/21
%
* p < 0.001
3/5
2/115/21
Silverberg & Vaughn, ASRM, 1998

ULDLF Results: Previous LLL Failures
0
10
20
30
40
50
60
TVA (%) Clin Preg (%) Delivery (%)
%
21/35
12/35
8/35
Silverberg & Vaughn, ASRM, 1998

Summary Poor responders do poorly Comparing LLL and ULDLF:
No differences in stimulation parameters No differences in # embryos transferred Yet significantly higher Preg/Deliv rates
Evaluating LLL Failures 60% TVA, 23% Delivered
Poor responders who fail LLL have excellent outcome with ULDLF
Poor responders who complete LLL have higher delivery rate with ULDLF
ULDLF represents a better option for poor responders than does the LLL protocol

Modified Micro-Dose Flare vs. GnRH Antagonist
Flare (n=24)
Antagonist (n=24)
P
Day 3 FSH 9 10 NS
Cxl rate (%) 21 25 NS
# ampules 59 68 NS
Peak E2 1196 868 < 0.05
# oocytes 5.5 4.5 < 0.05
Fert (%) 81 72 NS
Preg/ET (%) 21.0 16.6 NS
Akman et al. Hum Reprod 2001;16:868

Poor Responders: Agonist vs Antagonist Conflicting Data: P,R n=534; higher OPR with microdose
flare vs. Antagonist/Letrozole 1
P,R; higher OPR with antagonist 2
Meta analysis of 6 trialsNo differences in cycle cxl, # oocytes,
pregnancy rate 3
1 Schoolcraft et al. Fertil Steril. 20072 Lainas et al. Hum Reprod. 20083 Franco et al. Reprod Biomed Online. 2006;13:618

CC/low dose FSH/Antagonist vs.Agonist/high dose FSH RCT, n=695 Group A(n=355)
Shorter stim, lower total FSH dose Lower peak E2
Group B (n=340) Lower cxl rate More oocytes, more mature ooc, more embryos
No diffs: Implantation rate, ongoing (12 week) IUP
Revelli A, et al. J Assist Reprod Genet 2014;31:809
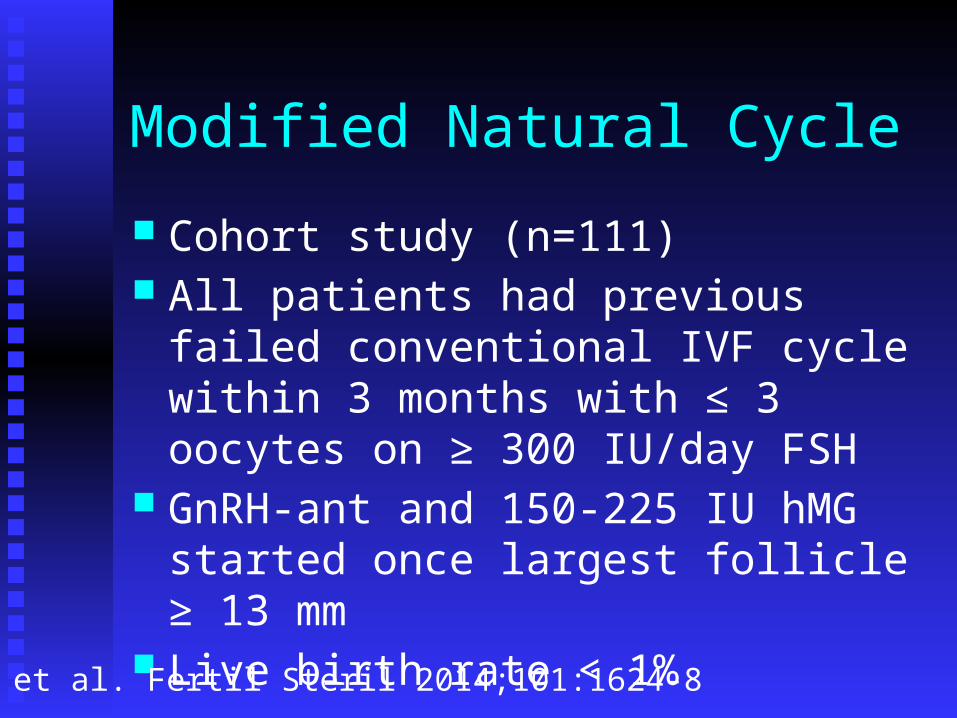
Modified Natural Cycle
Cohort study (n=111) All patients had previous failed
conventional IVF cycle within 3 months with ≤ 3 oocytes on ≥ 300 IU/day FSH
GnRH-ant and 150-225 IU hMG started once largest follicle ≥ 13 mm
Live birth rate < 1%
Kedem, et al. Fertil Steril 2014;101:1624-8
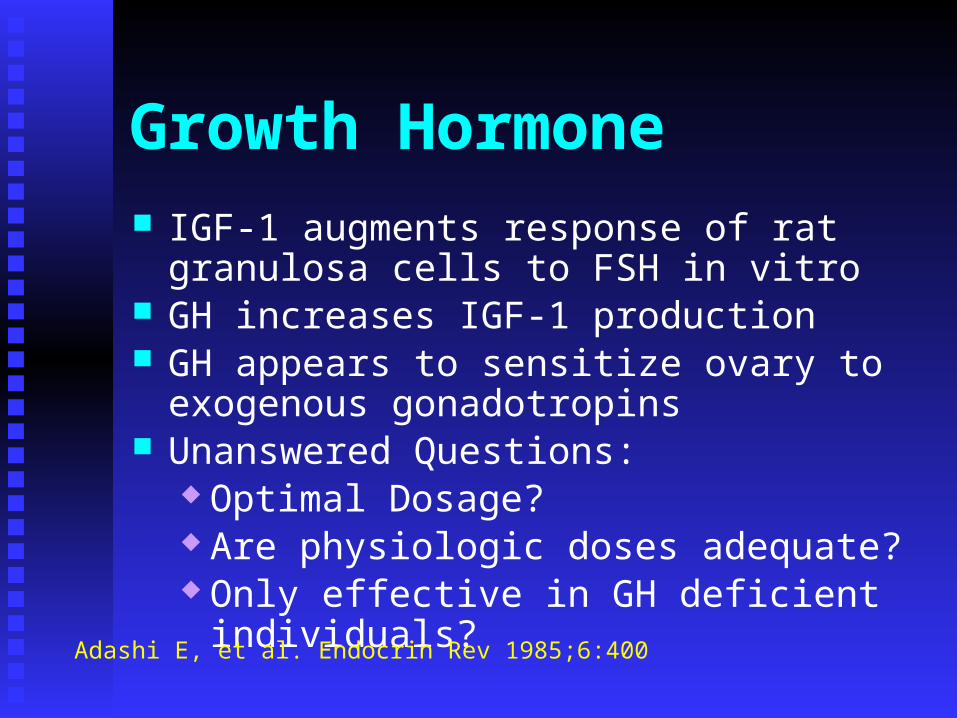
Growth Hormone IGF-1 augments response of rat granulosa cells to
FSH in vitro GH increases IGF-1 production GH appears to sensitize ovary to exogenous
gonadotropins Unanswered Questions:
Optimal Dosage? Are physiologic doses adequate? Only effective in GH deficient individuals?
Adashi E, et al. Endocrin Rev 1985;6:400

Adjunctive Growth HormoneHomburg 1990
Ibrahim 1991
Owen 1991 Shaker 1992
Levron 1993
Design P,R, Plac P P,R, Plac P R
N 16 10 13 10 7
Stim hMG LLL/hMG Long follGnRH/hMG
LLL/hMG FSH/hMG
Exog .Gonad.
# Ooc
Peak E2
No improvement in pregnancy rates
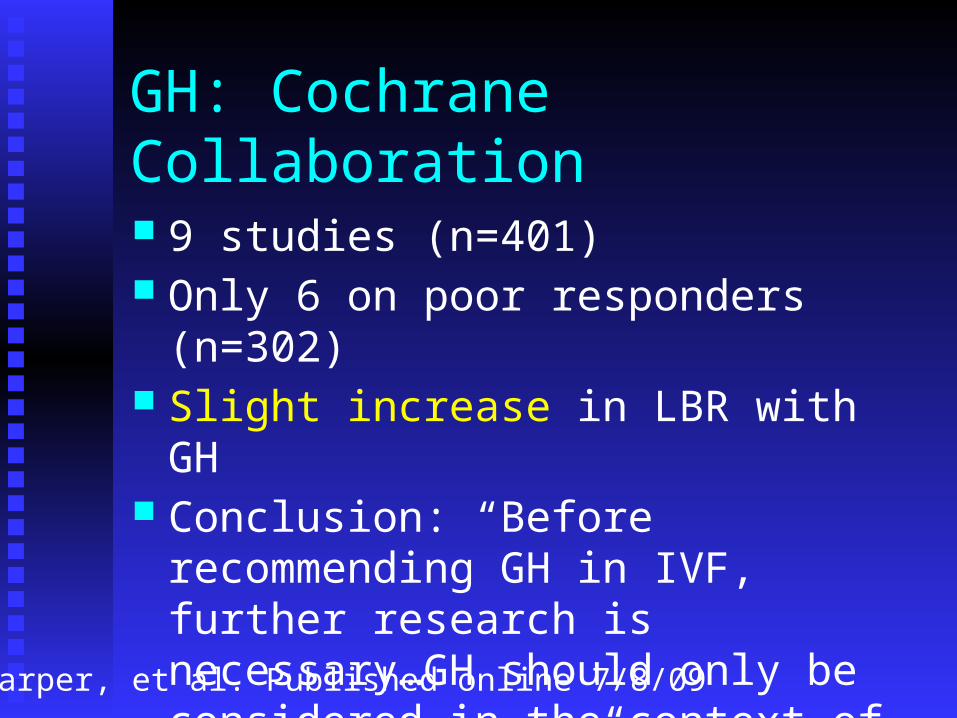
GH: Cochrane Collaboration
9 studies (n=401) Only 6 on poor responders (n=302) Slight increase in LBR with GH Conclusion: “Before recommending GH in
IVF, further research is necessary…GH should only be considered in the context of a clinical trial”…
Harper, et al. Published online 7/8/09

DHEA Unknown mechanism
IGF mediated (increases IGF-1) Suppressive effect on apoptosis Synergy with gonadotropins Possible reduction in aneuploidy
Effect peaks after 4-5 months of use Several small retrospective studies show improvements in:
CXL rate, Oocyte #, Preg rate, time to pregnancy1
Improvement in oocyte production in poor responders2
Reduction in SAb incidence (retrospective, n=73, p<0.05)3
More recent (2014) RCTs show no difference1Gleicher N. Repro Biol Endocrin 20112Barad D, Gleicher N. Fertil Steril 20053Gleicher N, et al. Repro Biol Endocrin 2009

DHEA
P, R trial, n=33 (51 cycles) a
75 mg/d DHEA Delivery 23% vs. 4% (controls, p<0.05)
“We would like to present how insufficient the current evidence of acceptable quality is to warrant a conclusion that DHEA supplementation is an effective treatment for women with diminished ovarian reserve. More studies needed…” b
a Wiser, et al. Hum Reprod.2010;25:2496b Yakin and Urman Hum Reprod Online, May 18,2011
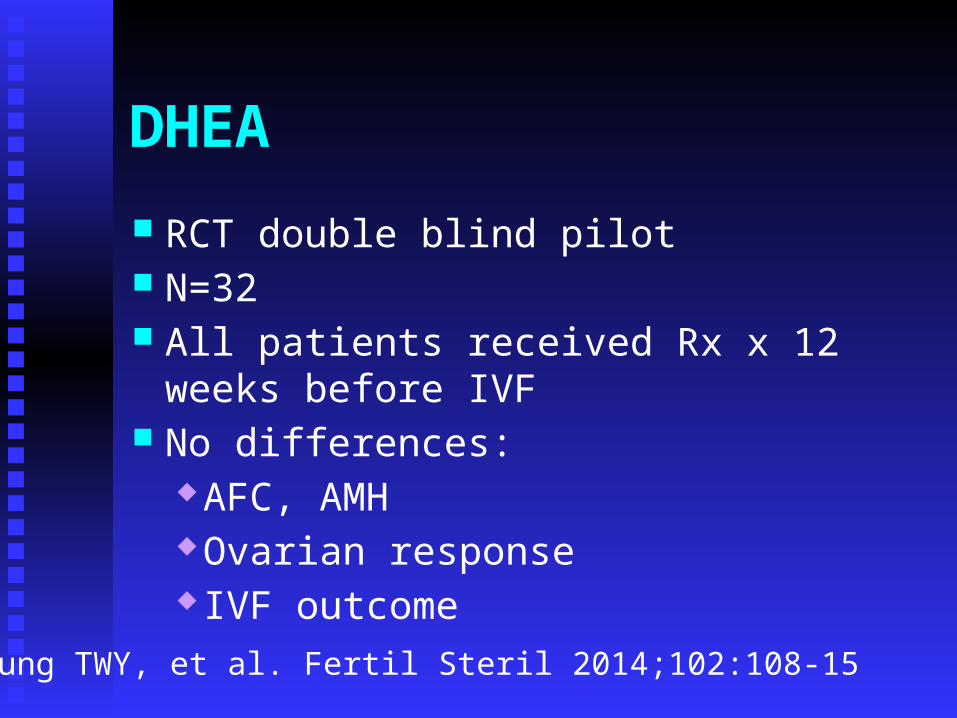
DHEA
RCT double blind pilot N=32 All patients received Rx x 12 weeks before
IVF No differences:
AFC, AMH Ovarian response IVF outcome
Yeung TWY, et al. Fertil Steril 2014;102:108-15

DHEA
RCT N=208, AMH<1 or D3 FSH > 15, & AFC <4 Microdose flare All patients received Rx x 12 weeks before IVF No differences:
# oocytes, fert rates (sl higher in study group)
Pregnancy rates (sl higher in control group)Kara M et al. Eur J OB/GYN 2014;173:63-5

CoQ 10
600-800 mg/day softgels Casper’s retrospective Canadian study in
animal and human models showed improved embryo quality
Only 1 RCT

Co Q-10
Double blind, placebo controlled RCT IVF/ICSI 35-43 yo, n=39 1° Outcome: post-meiotic aneuploidy rates 600 mg/day Aneuploidy: 46.5% (S) vs. 62.8% (C) Clin Preg Rate: 33% (S) vs. 26.7% (C) LBR: 25% (S) vs. 26.7% (C)
Bentov Y, et al. Clin Med Insights Reprod Health 2014;8:31-8

Low Dose Aspirin Retro (n=1250) Study patients:
Higher AFC, longer stim, more gonadotropin
Higher E2Lower fert rateNO DIFFERENCES in IR, OPR, SAB,
LBR
Frattarelli J, et al. Fertil Steril 2008;89:1113-7

Assisted Hatching Schoolcraft (1994): Significantly improved pregnancy
rates in poor responders (64% vs. 19%) Stein (1995): Significant improvement in pregnancy
rates in women > 38 yo with 3 previous IVF failures (24% vs. 7%)
Tucker (1996): Significant improvement in clinical pregnancy rates, but no difference in delivery rates.
Meldrum, Silverberg (1998): Significant improvement in clinical pregnancy rates in women > 40 yo but no improvement in delivery rates.
Hellebaut (1996), Lanzendorf (1998): No differences in prospective, randomized trials

Other Options
Acupuncture Herbal therapy Fish oil Megavitamins Freeze all Pre-transfer “scratch”biopsy Intrauterine hCG Embryo “Glue”

Donor Oocytes

CONCLUSIONS
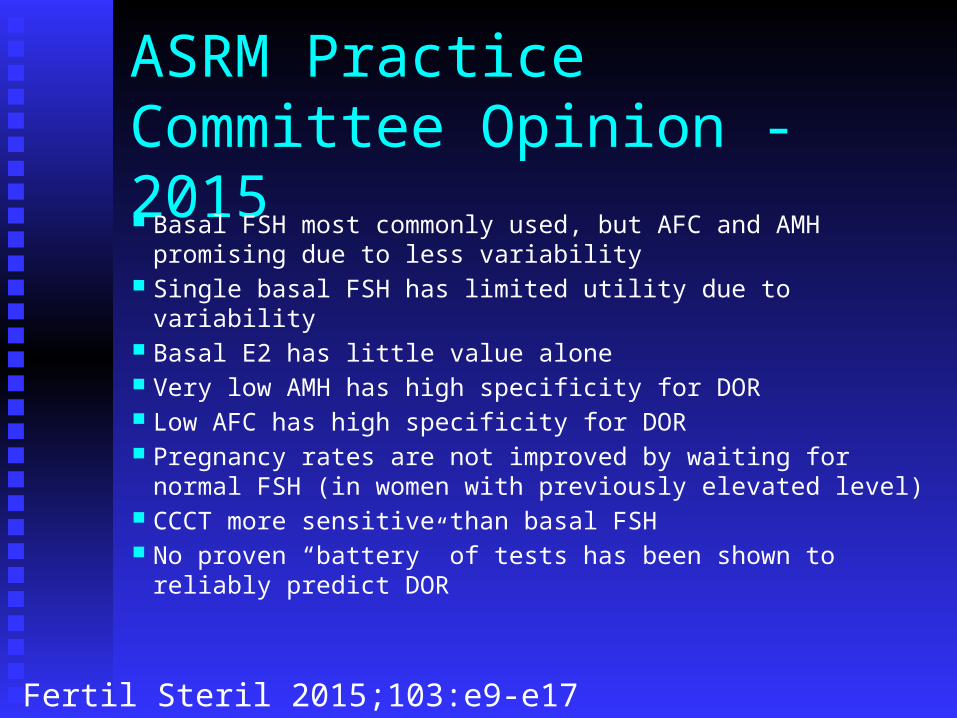
ASRM Practice Committee Opinion - 2015 Basal FSH most commonly used, but AFC and AMH promising
due to less variability Single basal FSH has limited utility due to variability Basal E2 has little value alone Very low AMH has high specificity for DOR Low AFC has high specificity for DOR Pregnancy rates are not improved by waiting for normal FSH
(in women with previously elevated level) CCCT more sensitive than basal FSH No proven “battery” of tests has been shown to reliably predict
DOR
Fertil Steril 2015;103:e9-e17

ConclusionsProbably Effective: Micro dose flare
Possibly Effective GnRH Antagonists Recombinant FSH CC/hMG Letrozole “Stop” GnRH protocol Assisted Hatching Growth Hormone

Conclusions
Probably Ineffective High dose gonadotropins Pulsatile gonadotropins Adding LH Standard Flare protocols GH-RH Baby Aspirin
Inconclusive DHEA CoQ-10
Definitely Effective:Donor Oocytes!