optimizing processes to minimize risk - nasa · optimizing processes to minimize risk ... factors...
TRANSCRIPT

Optimizing Processes to Minimize Risk
NASA, like the other hazardous industries, has suffered very catastrophic losses.
Human error will likely never be completely eliminated as a factor in our failures.
When you can’t eliminate risk, focus on mitigating the worst consequences and recovering operations.
Bolstering processes to emphasize the role of integration and problem solving is key to success.
Building an effective Safety Culture bolsters skill-based performance that minimizes risk and encourages
successful engagement.
https://ntrs.nasa.gov/search.jsp?R=20170006515 2018-08-25T18:33:47+00:00Z

Optimizing Processes to Minimize RiskNASA’s Risk Management Culture
David Loyd
Johnson Space Center
Safety & Test Operations
June 27, 2017
NASA Johnson Space Center
HOUSTON, TEXAS
“It can only be attributable to human error.“-- HAL 9000 (2001: A Space Odyssey)
Words of Wisdom
June 27, 2017 David T. Loyd 2

Optimizing Processes to Minimize Risk
• NASA’s Losses in Space and on the Ground – Failure is not an option we choose, but it is a reality we must face….
• Safety & Mission Assurance in the Project Life-Cycle– The Unique Role of the “Integration Engineer” and “Chief SMA Officer”
• Accommodating Human Error– Acknowledging human frailty and modeling error probabilities.
• NASA’s Safety Culture – Minimizing the Risk Environment– Reducing error by cultivating skill-based behavior.
– Bolstering trust throughout operations.
– Measuring safety culture growth.
June 27, 2017 David T. Loyd 3

Recent Mission Mishaps
NASA’s Losses
Columbia STS-107, February 1, 2003:• 7 fatalities; • $3 Billion vehicle loss;• 2.5 year mission impact.
NOAA N-Prime, September 6, 2003:• $135 Million
vehicle damage;• 5.5 year mission
impact.
Genesis, September 8, 2004:• Some sample retrieval materials lost.
DART, April 16, 2005:• Proximity operations
mission objectives lost.
OCO, February 24, 2009:• $280 Million vehicle loss;• 5+ year mission impact.
Glory, March 4, 2011:• $424 Million
vehicle loss;• ??? mission
impact.
June 27, 2017 David T. Loyd 4

NASA’s Losses
MSFC Freedom Star Tow-wire Injury, December 12, 2006• Hospitalization due to internal injuries from impact with SRB
tow-wire.
Location Where Deceased
Fell From Roof
Second Point of
Impact of Deceased
First Point of Impact
of Deceased
KSC Roofing Fatality, March 17, 2006• Subcontractor died
from head injuries suffered due to fall.
JSC Chamber B Asphyxiation, July 28, 2010• Shoulder
injury due to asphyxiation and fall.
WFF CNC Injury, October 28, 2010• Sub-dermal
tissue damage due to impact from machine tool shrapnel.
Recent Institutional Mishaps
June 27, 2017 David T. Loyd 5

Project Authorization
Program/CustomerAgreement
System RequirementsReview
Preliminary Design Review
Critical Design Review
Test ReadinessReview(s)
QualificationTesting
AcceptanceTesting
Delivery &Activation
Key MilestonesProject
Closeout System/Facility Decommission
PerformanceReview(s)
Major Tasks
• Program/Project Plans• Feasibility Studies• Trade Studies• Preliminary Hazard
Analysis• Risk Identification• Configuration
Management Plans• Requirements
Identification• Standards & Specifications
Identification
Concept & Requirements
PhaseMajor Tasks
• Design Review• Drawing/Configuration
Development• Verification/Validation
Planning• Supplier Assessment• Failure Modes & Effects
Analysis• Probabilistic Risk
Modelling and Assessment• Prototype Development• Procurement Specification• Test Planning
Design & Development
PhaseMajor Tasks
• Work Authorization Documentation Issuance
• Parts & Assembly Inspection
• Process Instruction Development
• Component and Assembly Testing
• Nonconformance Review• Acceptance Data Package
Compilation• “As Built” Configuration
Management
Manufacturing& Test Phase
Subject Matter Experts, Mission Planners, System Engineers
Integration Engineers, Quality Engineers, Safety Engineers, Analysts, Inspectors
Independent Technical Authority – Chief SMA Officer
Major Tasks
• Acceptance• Change Requests• Waiver/Deviation
Review• Operation &
Maintenance Training• Mission Evaluation• Anomaly Resolution• Logistics &
Maintenance Planning• Failure Analysis• Problem Reporting &
Corrective Action• Lessons Learned
Operations& Sustaining
Phase
Safety & Mission Assurance in the Project Life-Cycle
June 27, 2017 David T. Loyd 6
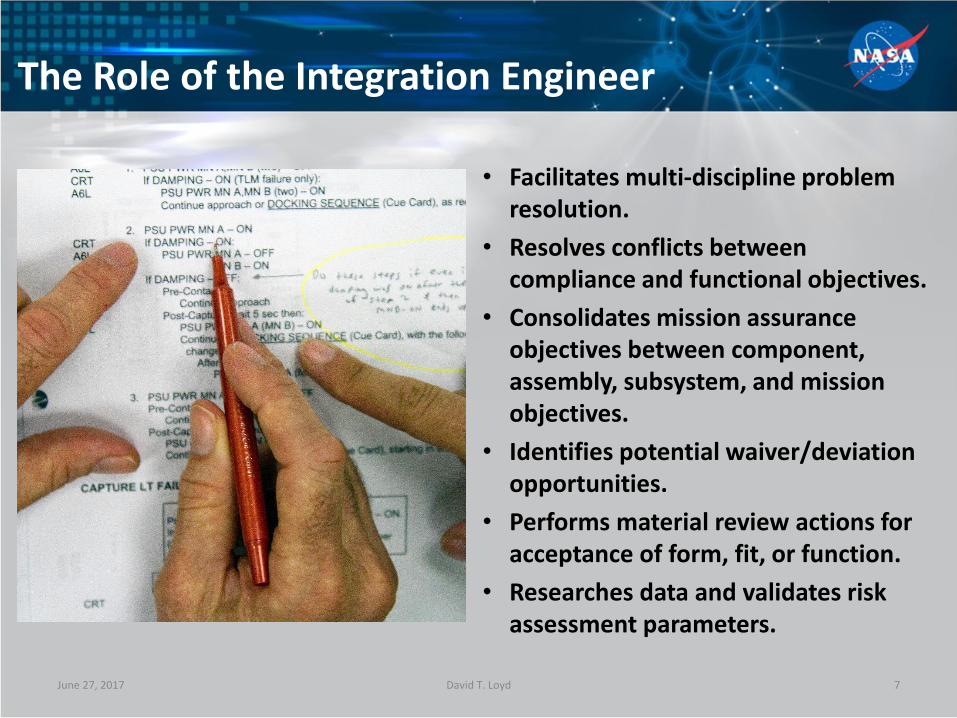
The Role of the Integration Engineer
• Facilitates multi-discipline problem resolution.
• Resolves conflicts between compliance and functional objectives.
• Consolidates mission assurance objectives between component, assembly, subsystem, and mission objectives.
• Identifies potential waiver/deviation opportunities.
• Performs material review actions for acceptance of form, fit, or function.
• Researches data and validates risk assessment parameters.
June 27, 2017 David T. Loyd 7

The Role of the Chief SMA Officer (CSO)
• Evaluates, approves or recommends the feasibility or modification of policies, requirements or systems.
• Performs technical SMA assessment in support of the Certificate of Flight Readiness (CoFR) endorsement.
• Leads independent assessments of Program-related process integrity impacts, anomalies, or unique failures.
June 27, 2017 David T. Loyd |8
• Formulates SMA position on significant technical issues or design trades across the Program.
• Dispositions assigned changes, waivers, deviations, and exceptions to program technical requirements.
• Accepts equivalent alternatives to applied requirements.
Accommodating Human Error…As much as we’d like to be able to predict error and eliminate it, the reality is that we must be prepared to accommodate it – measure known performance characteristics to identify vulnerabilities, mitigate greatest risk, and enable prudent response to the next accident.
David T. LoydJune 27, 2017 9

High Risk Occupations vs. Space Flight
Shuttle Astronaut
Northeast Multispecies Groundfish Fishing
Alaskan Commercial Fishing
Commercial Fishing
Extraction –Mining, Oil and Gas
Construction Worker
Alaskan Commuter Pilot
Airline Pilot
Timber Cutting and Logging
Truck Driver
0 1:100 1:50 1:33Probability
1:218
1:166
1:775
1:851
1:4420
1:4190
1:336
1:1270
1:998
1:3790
Person-Fatality Risk Per Year
Risk increases as “drill down” into smaller and smaller groups that drive the risk.
Shuttle Astronaut risk is a very small group that has high risk.
Miner risk does not include fatalities due to chronic illnesses like “black lung.”
June 27, 2017
1:70Mt. Everest Climber
David T. Loyd 10

June 27, 2017 David T. Loyd
Performance Shaping Factors
Organizational
Physical
EmotionalEnvironmental
Emergency Environment
• PSFs impact human performance in a variety of ways, such as intelligence, expertise, emotion, harsh conditions, conflicting orders, etc.
• PSFs are incorporated into PRA error modeling, accommodating anticipated human interaction with critical tasking.
• We work to minimize the affects of PSFs, but our expectation of performance must acknowledge their potential impact to operations.
Human Performance Shaping Factors (PSF) Integration with Probabilistic Risk Assessment (PRA)
11
Minimizing Human Error and Cultivating a Reduced Risk Environment
Rasmussen’s 3 Human Responses to Operator Information Processing
1. Skill-based: requires little or no cognitive effort.
2. Rule-based: driven by procedures or rules.
3. Knowledge-based: requires problem solving/decision making.
June 27, 2017 David T. Loyd
“The fewer rules a coach has, the fewer rules there are for players to break.”
John Madden
“Successful design is not the achievement of perfection but the minimization and accommodation of imperfection.”
Henry Petroski
12

How Safety Culture Optimizes Process Performance
• By advocating a pervasive Safety Culture, we can provide our workforce with:– Clear emphasis on continuous learning;
– Encouragement to develop intuitive personal values;
– Guidelines for decision-making behavior that focuses on long-term success;
– Reinforcement to build trust by reporting and communicating concerns and ideas.
• Practicing an effective Safety Culture: – Builds Skill-based response mechanisms;
– Sharpens and shares Knowledge-based response mechanisms where flexibility is necessary;
– Reduces the emphasis on Rule-based response;
– And breaks down barriers to Trust. June 27, 2017 David T. Loyd 13

NASA’s Safety/Risk Culture Model
“An environment characterized by safe attitudes and behaviors modeled by leaders and embraced by all that fosters an atmosphere of open communication, mutual trust, shared safety values and lessons, and confidence that we will balance challenges and risks consistent with our core value of safety to successfully accomplish our mission.”
An effective safety culture is characterized by the following
subcomponents:
Culture - We report our concerns
Culture - We have a sense of fairness
Culture - We change to meet new demands
Culture - We learn from our successes and mistakes
Culture - Everyone does his or her part
June 27, 2017 David T. Loyd |14
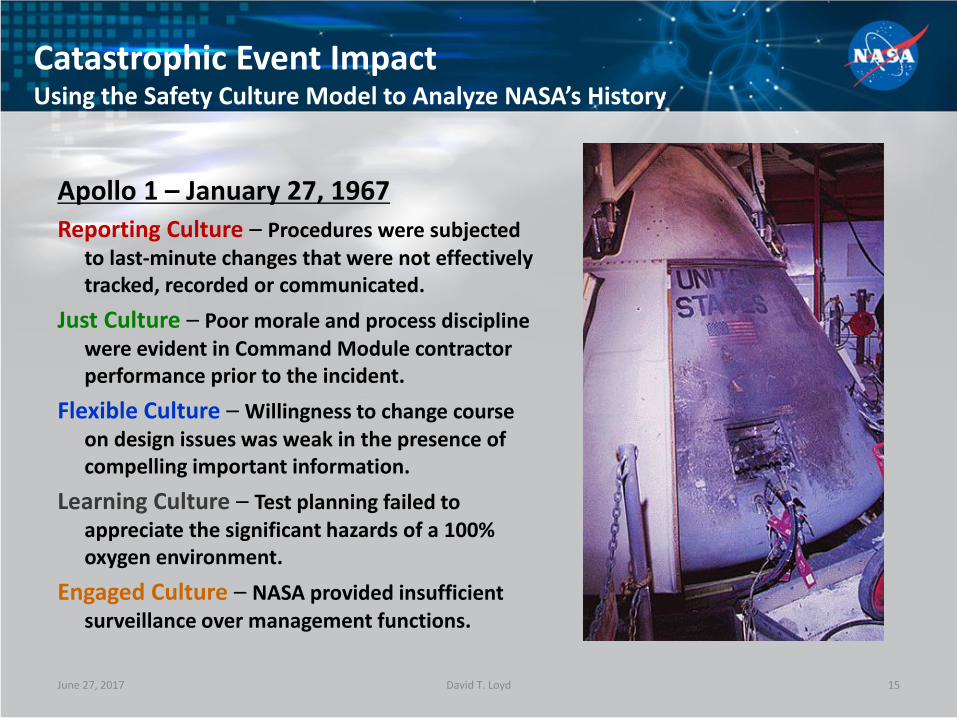
Catastrophic Event ImpactUsing the Safety Culture Model to Analyze NASA’s History
Apollo 1 – January 27, 1967
Reporting Culture – Procedures were subjected to last-minute changes that were not effectively tracked, recorded or communicated.
Just Culture – Poor morale and process discipline were evident in Command Module contractor performance prior to the incident.
Flexible Culture – Willingness to change course on design issues was weak in the presence of compelling important information.
Learning Culture – Test planning failed to appreciate the significant hazards of a 100% oxygen environment.
Engaged Culture – NASA provided insufficient surveillance over management functions.
June 27, 2017 David T. Loyd 15

Catastrophic Event ImpactUsing the Safety Culture Model to Analyze NASA’s History
Reporting – With both tragedies, launch process deficiencies, such as O-ring susceptibility in cold temperatures (Challenger) and foam shedding (Columbia), were passively reported problems, yet were not considered serious hazards.
Just – Some engineers were reluctant to raise concerns when faced with a return of an “in God we trust - all others bring data” attitude.
Flexible – With both incidents, the Shuttle Program was experiencing schedule pressure challenges.
Learning – With “normalization of deviance,” O-ring burn-through and foam impact had become classified as “in-family” and as a negligible risk.
Engaged – NASA management lacked involvement in critical discussions. June 27, 2017 David T. Loyd
Columbia – February 1, 2003
Challenger – January 28, 1986
16

Deepwater Horizon – April 20, 2010Reporting – Procedures were subjected to last-minute
distribution, last minute decision.
Just – Concerns of rig workers regarding test results were muted, not heeded or explored .
Flexible – All involved seemed prepared to exercise flexibility, but this may be indicative of insufficient process discipline.
Learning – Invalid confidence in new slurry, vents from Mud-Gas Separator (MGS) allowed gas to enter rig spaces, insufficient planning for contingencies.
Engaged – Incorrect reading of pressure tests, lack of recognition or timely control action related to kicks, diverted flow through MGS instead of overboard, reluctance to activate Blow-Out Preventer (BOP), reluctance to activate the Emergency Disconnect System, BOP testing and maintenance.
June 27, 2017 David T. Loyd
NASA Safety Culture Model Applied to Deepwater Horizon
17

Measuring Safety Culture
David T. Loyd
2015 Safety Culture Survey Results
June 27, 2017
HOT“Eliminate the recalcitrant
dinosaur dictators”WARM
“Emphasis on purpose of safety measures, not just
filling out a form or checking a box.”
TEPID“Watch out for everyone”
“Communication”
COOL“Keep doing what you
are doing. We are constantly being
reminded of Safety and its importance.”
Comment Temperature Perspectives
18

The Path to a Reduced Risk Environment
• NASA, like the other hazardous industries, has suffered very catastrophic losses.
• Human error will likely never be completely eliminated as a factor in our failures.
• When you can’t eliminate risk, focus on mitigating the worst consequences and recovering operations.
• Bolstering processes to emphasize the role of integration and problem solving is key to success.
• Building an effective Safety Culture bolsters skill-based performance that minimizes risk and encourages successful engagement. June 27, 2017 David T. Loyd 19
Backup Charts
June 27, 2017 David T. Loyd 20
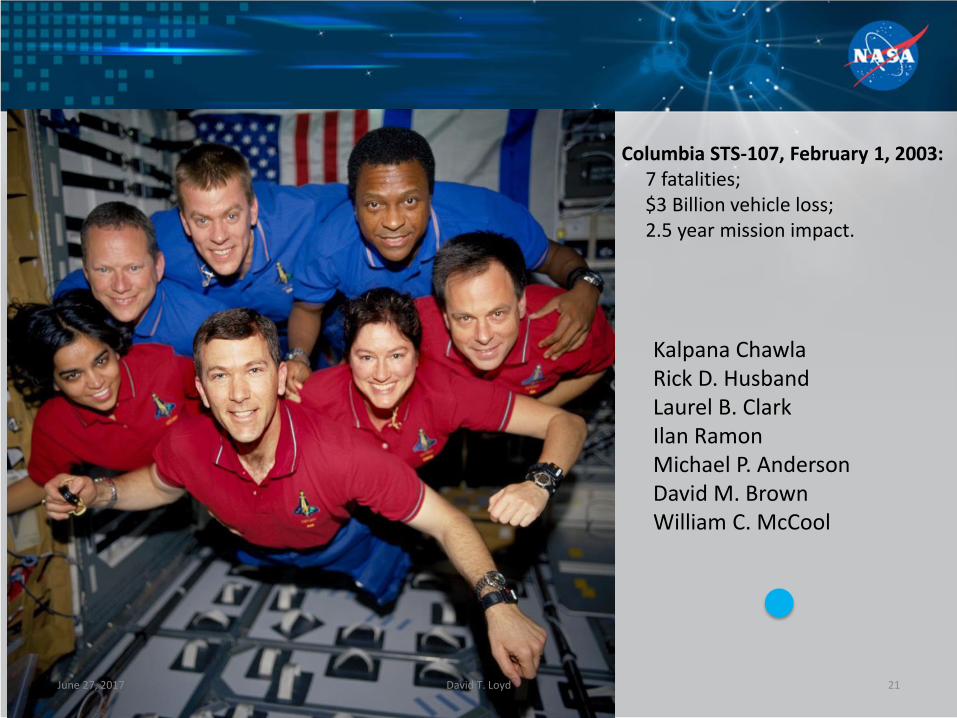
Columbia STS-107, February 1, 2003:7 fatalities; $3 Billion vehicle loss;2.5 year mission impact.
Kalpana ChawlaRick D. HusbandLaurel B. ClarkIlan RamonMichael P. AndersonDavid M. BrownWilliam C. McCool
June 27, 2017 David T. Loyd 21

NOAA N-Prime, September 6, 2003:• $135 Million vehicle damage;• 5.5 year mission impact. June 27, 2017 David T. Loyd 22

Genesis, September 8, 2004:• Some sample retrieval materials lost.
June 27, 2017 David T. Loyd 23
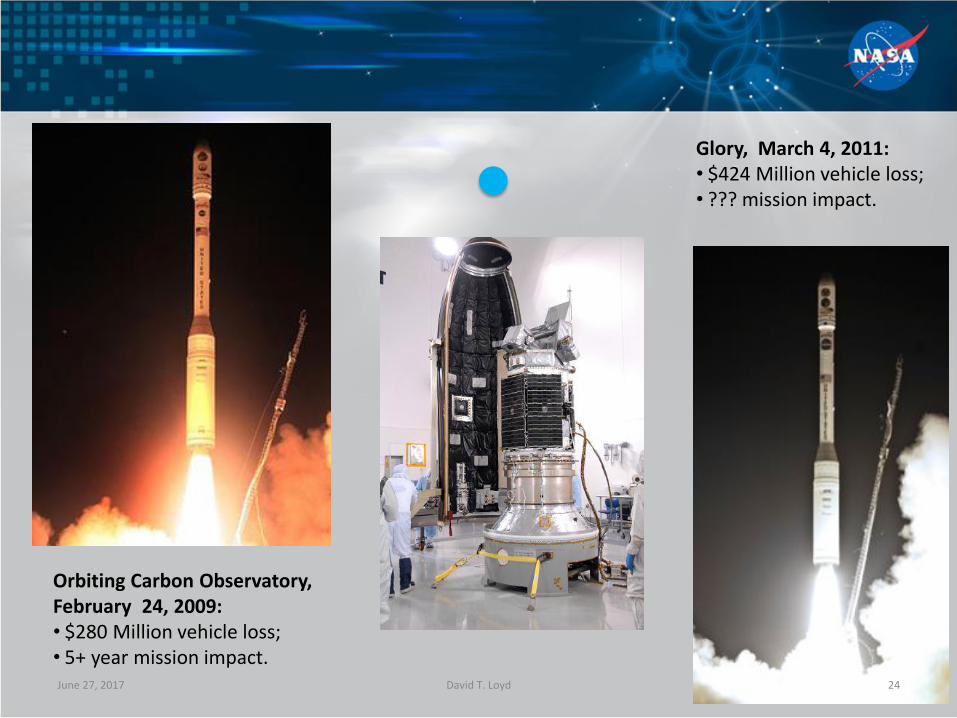
Orbiting Carbon Observatory, February 24, 2009:• $280 Million vehicle loss;• 5+ year mission impact.
Glory, March 4, 2011:• $424 Million vehicle loss;• ??? mission impact.
June 27, 2017 David T. Loyd 24
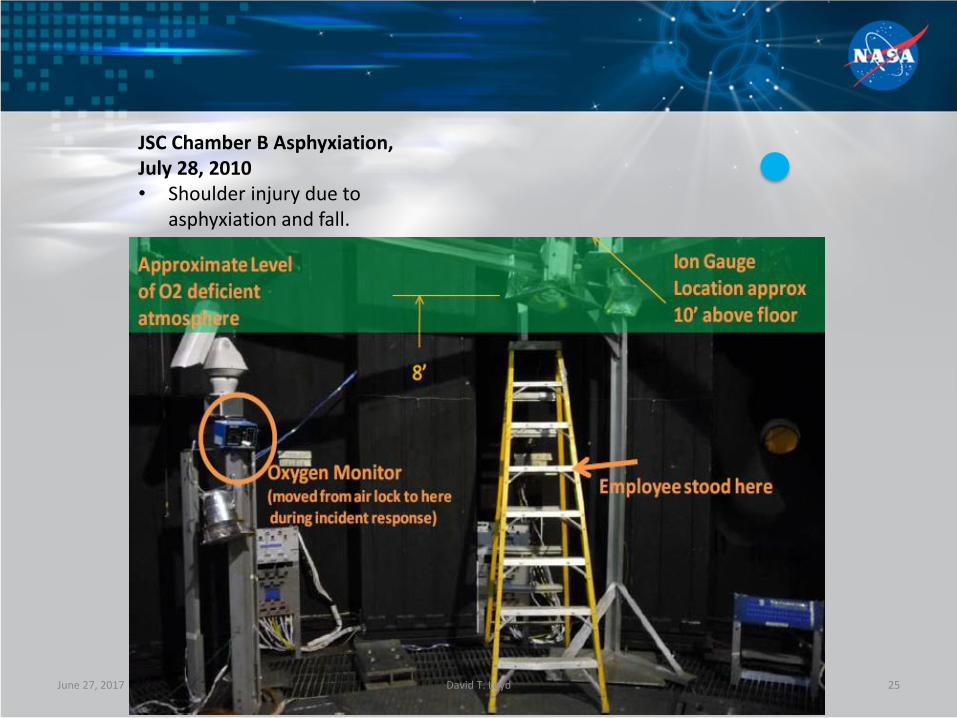
JSC Chamber B Asphyxiation,July 28, 2010• Shoulder injury due to
asphyxiation and fall.
June 27, 2017 David T. Loyd 25