optimizing microbial ethanol: carbon source influence and ... · optimizing microbial ethanol:...
TRANSCRIPT

Optimizing Microbial Ethanol:
Carbon source influence and detrimental genes for ethanol production
A Major Qualifying Project Report:
submitted to the Faculty
of the
WORCESTER POLYTECHNIC INSTITUTE
in partial fulfillment of the requirements for the
Degree of Bachelor of Science
by
________________________________
Kyle C. Peet
Date: April 24, 2008
Approved:
_____________________________
Professor Reeta Prusty Rao, Advisor

2
ABSTRACT
In the search for developing sustainable, renewable and carbon neutral fuel supplies,
bioethanol provides a potential replacement to petroleum-based fuels. Further optimization and
engineering is necessary to produce organisms capable of fermenting lignocellulosic biomass
that will not compete with human food supplies. A profile of ten wild-type Saccharomyces
cerevisiae strains was developed for ethanol yields from growth on different sugars.
Additionally, several higher ethanol producing yeast knockout strains were identified by use of a
Bromothymol Blue pH indicator assay.

3
ACKNOWLEDGEMENTS
The student would like to thank Professor Reeta Prusty Rao for generously hosting and
advising this major qualifying project at Gateway Park, WPI Life Sciences and Bioengineering
Center. Additional thanks are due to Dr. JoAnn Whitefleet-Smith for instruction and use of
laboratory equipment. Finally, WPI faculty Ally Hunter and graduate student Charu Jain were
very helpful in assisting with research and providing advice.
4
LIST OF FIGURES:
Figure 1: Cellulose, hemi-cellulose and lignin profiles………………………………………...8
Figure 2: Hemi-cellulose structure……………………………………………………………..9
Figure 3: Metabolic pathway for xylose and glucose break down……………………………13
Figure 4: The pathway showing both xylose and arabinose metabolism……………………..14
Figure 5: BTB color change as pH changes…………………………………………………..18
Figure 6: Sample BTB plate from Robillard, 2007, Sample unstreaked BTB………………..19
Figure 7: Y49, Y47, Y52, and Y717 streaked on BTB plates...................................................23
Figure 8: First batch of sugars tested on S. cerevisiae...………………………………………24
Figure 9: Second batch of sugars tested on S. cerevisiae…………………….………….……24
Figure 10: Retested third batch of sugars tested on S. cerevisiae …………………………….25
Figure 11: Sugars tested on Clostridium thermocellum……………………………………....26
Figure 12: Y101 knockout mutants identified from Appendix F……………………………..27

5
LIST OF TABLES:
Table 1: Mating type and genetic information for the 10 wild-type strains used…………….20
6
TABLE OF CONTENTS
Introduction……………………………………………………………………………….…...7
Materials and Methods………………………………………………………………………..19
1. Saccharomyces cerevisiae growth…………………………………………………...19
2. Clostridium thermocellum growth…………………………………………………...21
3. Gas Chromatogram analysis……………………………………………………........22
Results………………………………………………………………………………………...22
1. Darker colonies generally correlate with higher ethanol production…………….…..22
2. Highest ethanol yields resulted from hexose sugars in strains Y101, Y49, Y717, Y53,
Y52 and Y47…………………………………………………………………………....23
3. Clostridium thermocellum needs further optimization to increase growth…………..25
4. Seven potentially higher producing knockout mutants identified via BTB assay…...26
Discussion…………………………………………………………………………………….28
Future Experiments…………………………………………………………………………...32
Appendix A: Bromothymol Blue (BTB) agar plate protocol for S. cerevisiae………………34
Appendix B: CMS media protocol for C. thermocellum growth……………………………..35
Appendix C: Gas Chromatogram Protocol…………………………………………………...36
Appendix D: BTB Assay dark colonies from Y101 library screen…………………………..38
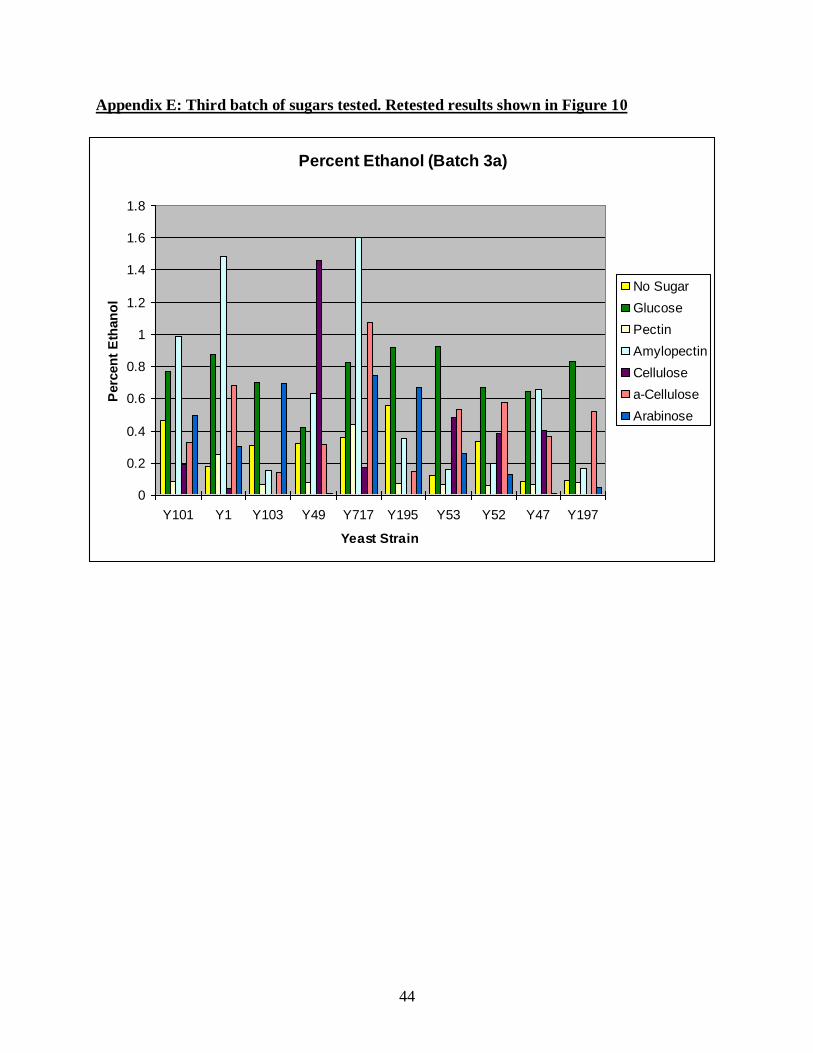
Appendix E: Third batch of sugars tested. Retested results shown in Figure 10…………….44
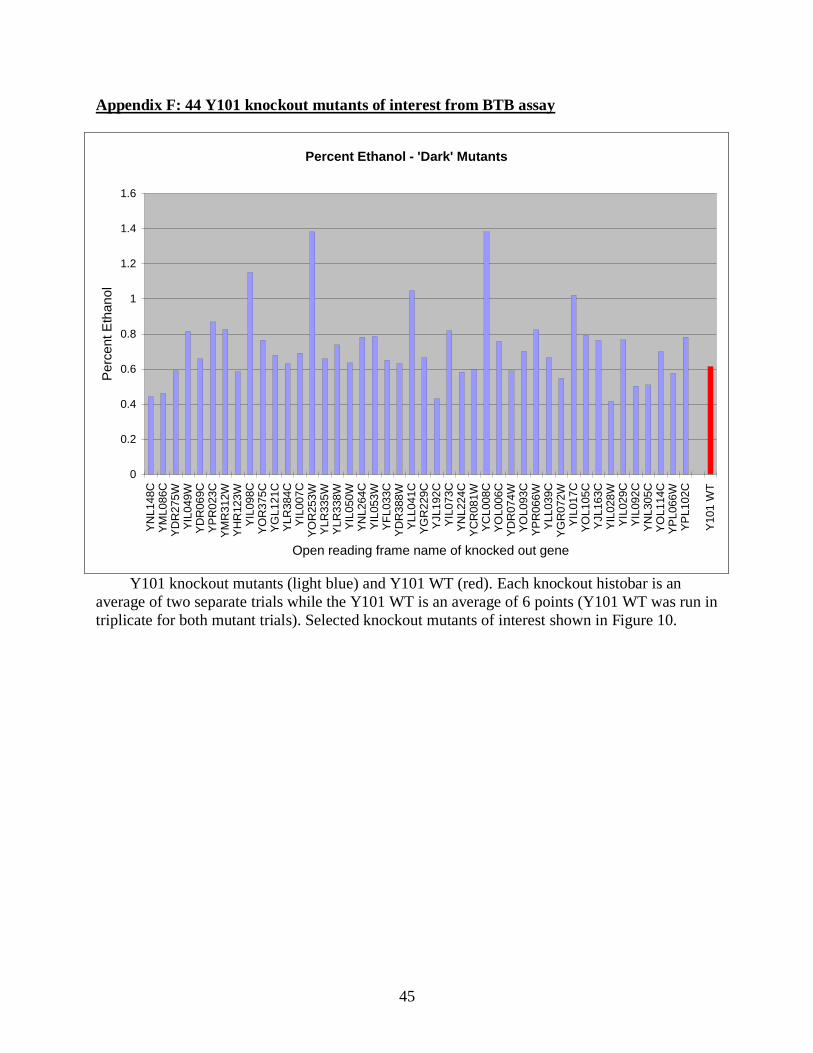
Appendix F: 44 Y101 knockout mutants of interest from BTB assay……………………….45
Literature Cited………………………………………………………………………….……46
7
Introduction:
Due to global climate change and rising fossil fuel costs, biological fuel sources show
increasing promise for replacing fossil fuels with renewable and sustainable alternatives. As
fossil fuels produce greenhouse gases, primarily CO2 during combustion, a fuel which does not
lead to a net increase in atmospheric greenhouse gases is essential. While bioethanol would also
yield CO2 in combustion engines, the CO2 is being produced from carbon recently sequestered
by plants, as opposed to carbon in fossil fuels which was fixed millions of years ago. Therefore
using fuels (such as biodiesel, bioethanol and biomethane) in which the carbon source was
recently fixed by plants, will lead to a cycling of carbon from atmosphere to plant tissue to fuel
and then back to the atmosphere. In addition to not contributing to net greenhouse gas emissions,
biological sources of fuel can be both renewable as plants are grown continuously, and
sustainable as there is not a finite supply as is the case with fossil fuel sources.
The biological production of ethanol has been conducted for thousands of years with
brewer’s yeast, Saccharomyces cerevisiae, as it is produces high ethanol yields and grows
rapidly in simple conditions. Unfortunately, the best energy sources for S. cerevisiae are also
those found in human food sources (starch-rich sources in both cases), which brings up the ‘food
versus fuel’ debate. It is an unfavorable situation for yeast and humans to have competing food
sources, so other options must be explored. It is important to find microbes which are capable of
fermenting the non-food portion of plant matter, or to alter S. cerevisiae so that it is capable of
metabolizing lignocellulosic plant tissue that is not nutritional for humans. As brewer’s yeast has
already been bred over the years to have high ethanol production and tolerance, it is one of the
most attractive organisms to work with. In addition to these traits, the S. cerevisiae genome has
been sequenced and much is known about this organism, making genetic manipulation an easier
process. Furthermore, it is the only organism with a whole genome deletion library, making

8
genome scale mutant hunts possible. A final note of potential importance is that S. cerevisiae is
an organism with GRAS (generally recognized as safe) status by the U.S. Food and Drug
Administration, which may eliminate concerns about potential runoff contamination and other
biohazard safety problems (U.S. Food and Drug Administration 2001).
Lignocellulose consists of cellulose, hemi-cellulose and lignin, the last of which is
essentially unfermentable. In the non food portion of corn for example, the dry weight consists
of: cellulose 40-50%, hemi-cellulose 25-35%, and lignin 15-20% (Gray, et al. 2006). Figure 1
below shows that the content of each of these components may vary greatly between different
crops and wastes, so optimizing organisms for fermenting cellulose or hemi-cellulose may be
very important to maximize ethanol production. Cellulose is most frequently in the range of
50%, but hemi-cellulose can range from less than 20% to as much as 50% in wheat straw or 85%
in leaves (Sun and Cheng 2002).
Figure 1: Cellulose, hemi-cellulose and lignin profiles for a variety of crops and wastes (Sun and
Cheng 2002).
Lignin is a complex and irregular molecule, and as a result is more difficult to degrade.
Cellulose and hemi-cellulose, while major constituents of plants are not fermented easily by

9
yeast. Cellulose consists of long chains of 1-4) linked glucose molecules. Hemi-cellulose
consists most frequently of a chain of 1-4) linked xylose molecules with a variety of branched
sugars, with the most common being xylose, mannose, galactose and arabinose (Gray, et al.
2006). There are a variety of types of hemi-celluloses that vary by plant species, such as xylan,
arabinoxylan, xyloglucan and others, which makes metabolizing them a more complex process.
Glucose is largest component monosaccharide of lignocellulose, with xylose the second most
abundant (Kuijper 2006). Figure 2 below shows an example of hemi-cellulose structure.
Figure 2: Sample hemi-cellulose structure. Note the xylose (X) (1-4) linked backbone with
branched xylose, arabinose (A), galactose (G) and other compounds such as ferulic acid
(FeA) which links lignin and hemi-cellulose (Gray, et al. 2006).
As lignocellulose is a complex and compact matrix of cellulose, hemi-celluloses and lignin,
it necessitates degradation into simpler components before feeding to microbes for fermentation.
In order to make lignocellulosic plant matter more readily fermentable by yeast and other
microbes, there are a variety of pre-treatment methods that are important to utilize. Pre-treatment
methods may be physical, chemical or biological, and all have varying advantages and
disadvantages. The simplest physical methods are chipping and grinding mechanisms to reduce
particulate sizes, increasing surface areas of biomass. Next are the most common physical-
10
chemical methods involving steam explosion. Steam explosion uses high pressure and steam
treatment followed by a rapid pressure decrease, to break down hemi-cellulose and lignin,
allowing cellulose to be attacked by enzymes (Sun and Cheng 2002). As steam explosion results
in the formation of compounds inhibiting enzymes and microbe growth and fermentation,
ammonia and CO2 explosion may also be used. While these treatments are more expensive, they
do not result in inhibitor compound formation, and CO2 is cheaper than ammonia explosion (Sun
and Cheng 2002).
Chemical pre-treatment techniques may use acid hydrolysis, base hydrolysis, ozone
treatment, and hydrogen peroxide treatment. Acid treatment tends to degrade hemi-cellulose the
most, while base treatment tends to degrade lignin to a higher degree, but both treatments may
result in the formation of various inhibitors (Gray, et al. 2006). Ozone treatment on the other
hand does not result in the creation of deleterious compounds while it effectively degrades
lignin, but it is an expensive process because it requires large amounts of ozone (Sun and Cheng
2002). A final method using hydrogen peroxide breaks down lignin and hemi-cellulose. While
physical and chemical pre-treatment steps are important for pulling apart the complex of
cellulose, hemi-cellulose and lignin, many pre-treatments are focused only at cellulose, as it is a
source of glucose. As the focus is on cellulose, many of the above methods result in losses of
fermentable sugars found in hemi-cellulose, which is a great loss of potential energy, as hemi-
cellulose can compose a significant portion of plant matter (see Figure 1). It is important to strike
a balance between the method that best exposes cellulose to enzymatic degradation, as well as
retaining hemi-cellulose as a significant energy source.
After physical and chemical processes, enzymatic action is used to break down cellulose
and hemi-cellulose polymers into saccharides that are fermentable by microbes. There are three

11
main types of cellulases involved in converting cellulose to individual glucose units:
endoglucanase, exoglucanase and -glucosidase. Endoglucanase attacks the interior of cellulose
molecules to create a many smaller molecules, exoglucanase cleaves cellobiose ( 1-4) linked
glucose disaccharide) units from the ends of cellulose, and -glucosidase breaks cellobiose into
two glucoses (Sun and Cheng 2002; Gray, et al. 2006). The major issues with these cellulases are
that it may be prohibitively expensive to produce large enough quantities for commercial
production, recycling of enzymes between batches can be difficult, and enzyme activities may be
low, in part due to inhibitors from lignin and product feedback inhibition (Sun and Cheng 2002;
Gray, et al. 2006). These cellulases can be obtained from several bacterial and fungal sources,
with the fungi Trichoderma reesei identified as one species which secretes high quantities of all
three types of cellulases as well as some hemi-cellulases (Foreman, et al. 2003).
There are a variety of reasons why large molecules such as cellulose and hemi-cellulose are
not easily fermented by S. cerevisiae. In the case of cellulose, the metabolic equipment is simply
not present to break cellulose into glucose monomers. Fungi such as T. reesei show promise for
solving S. cerevisiae’s lack of cellulases, either by pre-treatment using cellulases isolated from T.
reesei, or engineering these genes into yeast (Foreman, et al. 2003; Gray, et al. 2006). Another
option is species such as Clostridium thermocellum that produce cellulases in addition to being
able to ferment ethanol. Unfortunately many species, like C. thermocellum, have low ethanol
yields and are much more fastidious to grow than yeast, e.g. 60º C with obligate anaerobic
conditions (Rani and Seenayya 1999).
To metabolizing hemicellulose, the larger molecules need to be broken down with hemi-
cellulases into the constitutive hexoses and pentoses, and then these simple units can enter
metabolic pathways. There are many hexoses that yeast is naturally able to ferment, but pentoses

12
are less efficiently converted to ethanol. Having these enzymes is not enough because common
pentoses (xylose and arabinose) do not enter glycolysis easily. While S. cerevisiae technically
has the enzymes necessary to feed pentoses into glycolysis, endogenous enzymes do not have
high activities and favor reactions that do not push pentoses toward glycolysis (Jeffries and Jin
2004).
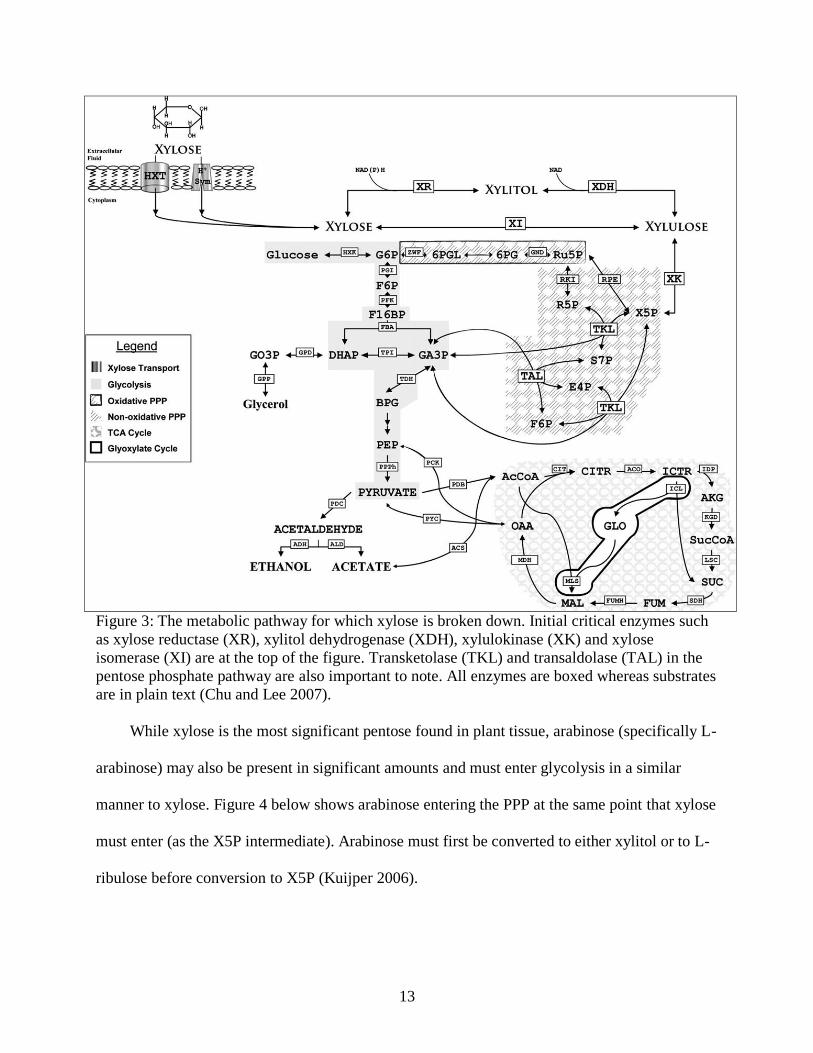
Shown in Figure 3 below, xylose must first be converted to xylitol via xylose reductase
(XR), and xylitol is then converted to xylulose via xylitol dehydrogenase (XDH). After XDH,
xylulokinase (XK) converts xylulose into xylulose-5-phosphate (X5P), which is an intermediate
of the non-oxidative pentose phosphate pathway (PPP). PPP intermediates will then be converted
to glycolysis intermediates as either glucose-6-phosphate (G6P) or glyceraldehyde-3-phosphate
(GA3P) (Chu and Lee 2007). The three enzymes (XR, XDH and XK) are in fact present in S.
cerevisiae, although there are other species, such as Candida shehatae and Pichia stipitis, whose
enzymes are more effective in pentose metabolism (Jeffries and Jin 2004). Additionally, the two
step conversion from xylose to xylulose can be accomplished in one step through xylose
isomerase (XI), although XI is not found in bakers yeast (Chu and Lee 2007).
13
Figure 3: The metabolic pathway for which xylose is broken down. Initial critical enzymes such
as xylose reductase (XR), xylitol dehydrogenase (XDH), xylulokinase (XK) and xylose
isomerase (XI) are at the top of the figure. Transketolase (TKL) and transaldolase (TAL) in the
pentose phosphate pathway are also important to note. All enzymes are boxed whereas substrates
are in plain text (Chu and Lee 2007).
While xylose is the most significant pentose found in plant tissue, arabinose (specifically L-
arabinose) may also be present in significant amounts and must enter glycolysis in a similar
manner to xylose. Figure 4 below shows arabinose entering the PPP at the same point that xylose
must enter (as the X5P intermediate). Arabinose must first be converted to either xylitol or to L-
ribulose before conversion to X5P (Kuijper 2006).

14
Figure 4: The pathway showing both xylose and arabinose metabolism. The enzymes of the
upper arabinose pathway are as follows: 5.3.1.4 is L-arabinose isomerase, 2.7.1.16 is L-
ribulokinase, and 5.1.3.4 is L-ribulose-5-phosphate 4-epimerase. The enzymes of the lower
arabinose pathway feeding into xylitol are as follows: 1.1.1.21 is aldose/xylose reductase,
1.1.1.12 is arabinitol 4-dehydrogenase, and 1.1.1.10 is L-xylulose reductase. Note that arabinose
has two methods of feeding into the PPP, one of which utilizes xylose enzymes XDH and XK
(Kuijper 2006).
Although engineering of exogenous XR and XDH (from P. stipitis) or XI (from Thermus
thermophilus or Piromyces sp. E2) into S. cerevisiae has greatly increased ethanol production
when using xylose as a carbon source, there are other important enzymes involved in pentose
metabolism (Chu and Lee 2007). Transaldolase (TAL in Figure 3) is central to the PPP and is a
rate limiting enzyme in S. cerevisiae strains that are expressing P. stipitis XR and XDH
(Walfridsson, et al. 1995). Additionally, many articles have shown that it is important to
overexpress the native XK and other PPP enzymes such as TKL for increasing ethanol yield
(Jeffries and Jin 2004; Chu and Lee 2007).
When comparing initial strategies to increase pentose metabolism, the two main strategies
are the addition of exogenous XR and XDH or the addition of XI. Both methods have shown to
15
be effective, but a comparison of the two tactics concluded that the XR-XDH combination
produces more ethanol than XI (Chu and Lee 2007). It is also important to note that in the study
mentioned, and many others, the endogenous XDH gene (gre3) was deleted in both strains,
which increased ethanol and decreased xylitol formation. This is due to the fact that S.
cerevisiae’s XDH actually favors the reverse reaction, forming xylitol instead of xylulose (Chu
and Lee 2007). Another potential reason to choose XR and XDH over XI is that if significant
amounts of arabinose are present, arabinose metabolism does not use XI, while it can use XDH
(See Figure 4), and this may or may not affect arabinose integration into the PPP. Additionally,
there are further methods for increasing the efficiency of the XR-XDH combination. One such
mechanism has been to alter the ratios of exogenous XR and XDH expression in S. cerevisiae. It
has been shown that greatly increasing the amount of XDH relative to XR will decrease xylitol
formation and increase ethanol production (Walfridsson, et al. 1997). It has not been
demonstrated whether adding all three enzymes would increase ethanol production more than the
XR and XDH combination or XI alone. This would depend on how fast XK (the next enzyme in
the pathway) can convert xylulose to X5P, as a bottleneck would be formed from XDH and XI
both producing xylulose.
One of the reasons adding XI to yeast is an attractive option is that it avoids the
accumulation of xylitol, and more significantly it avoids a redox imbalance formed by XR and
XDH. The reaction catalyzed by XR uses the coenzyme NADPH preferentially over NADH, and
the reaction catalyzed by XDH can only use the coenzyme NAD+ (Liang, et al. 2007). This is a
significant problem during anaerobic fermentation (which normally favors ethanol production)
because NADPH can continually be reformed by the PPP, but NAD+ cannot be reformed as
glycolysis does not result in a gain of NAD+
(Chu and Lee 2007). The end result of this
16
imbalance is that XDH is inhibited, and forms more xylitol than xylulose, stopping xylose
metabolism. Fortunately, a recent experiment has altered XR’s preference from NADPH to
prefer NADH, which allows for the cycling of NADH and NAD+ between these two enzymes,
removing the redox imbalance (Liang, et al. 2007).
After reviewing a variety of enzymes important for pentose metabolism, as S. cerevisiae is
currently able to effectively metabolize hexoses, there are further potentially rate limiting steps
to be examined. Transport is not a rate limiting step with relatively slower pentose metabolizing
strains, but as metabolic pathways are better manipulated, it becomes rate limiting. One method
for pentoses, such as xylose, to enter yeast cells is through facilitated diffusion using hexose
transporters (Chu and Lee 2007). The endogenous transporters found in S. cerevisiae have much
higher affinities for glucose, but certain transporters are more effective with xylose than others:
specifically HXT4, HXT5 and HXT7 (glucose transporters), GAL2 (galactose transporter), and
AGT1 (sucrose-proton symporter) (Chu and Lee 2007). GAL2 is also important for arabinose
uptake (Jeffries and Jin 2004). While these native genes may be good targets for upregulation, a
xylose/glucose proton symporter (GXS1) and xylose/glucose facilitator (GXF1) have recently
been identified from Candida intermedia, which have a high affinity for xylose (Leandro, et al.
2006).
As S. cerevisiae preferentially transports and utilizes glucose, it is essential that engineering
of yeast strains maintain pentose uptake and activity when glucose is also present. In plant
extracts containing cellulose and hemi-cellulose, a mixture of sugars will be obtained after pre-
treatment, which necessitates the organism used for fermentation be able to utilize all of the
substrates available for maximum ethanol yield. It has been shown that xylose consumption and
ethanol production increases in the presence of lower concentrations of glucose, when compared

17
to an equal amount of only xylose (van Zyl, et al. 1999). Furthermore this study showed that,
using a raffinose-xylose combination resulted in more ethanol than the glucose-xylose
combination. Other studies have shown that xylose and arabinose consumption are increased in
the presence glucose, although arabinose metabolism still needs optimization to produce ethanol
(Karhumaa, et al. 2006). Picking plant sources that yield the best substrate ratios may be
important for optimizing industrial ethanol production. As high concentrations of glucose inhibit
pentose uptake and metabolism, choosing the best substrates and altering important enzymes and
transporter activities will be important in the optimization process (Karhumaa, et al. 2006).
Many important genes have been identified for creating recombinant yeasts which can more
effectively ferment a wider variety of substrates. In addition to substrate variety, engineering
increased ethanol tolerance is possible, and it can a significant increasing yield, as shown by
Alper, et al. (2006). There are still many factors that have yet to be discovered with respect to
optimizing ethanol, and one area to begin searching is in current libraries of organisms with non-
essential genes knocked-out. Saccharomyces cerevisiae has a library of over 5000 genes, which
is a significant undertaking to screen all these mutants for their influence on ethanol yield.
Designing an assay to pre-screen mutants for potentially higher producing can save a great deal
of time and effort. The Y101 knockout library was pre-screened and 44 potentially higher
producing mutants were identified by use of the Bromothymol Blue (BTB) Assay (Robillard
2007).
The BTB assay uses bromothymol blue as a pH indicator because agar plates with this
reagent change color from a dark green-blue to orange as they become acidic. Specifically,
colonies of yeast that are more acidic will be a darker orange color, those that are less acidic will

18
be a paler yellow color. Figure 5 below shows the BTB color range in liquid at different pH
values.
pH 6 (acidic) pH 7 (neutral) pH 8 (basic)
Figure 5: BTB color change as pH changes (Robillard 2007).
Increasing acidity does not necessarily show increased ethanol, as ethanol and CO2 are the
primary products of fermentation (C6H12O6 → 2 CH3CH2OH + 2 CO2), but some CO2 will be
converted into carbonic acid in aqueous conditions, increasing the acidity. The addition of this
indicator to plates will not quantitatively determine ethanol production, but it provides a
qualitative method for screening large numbers of mutants in an easy manner. The Y101 yeast
knockout library was chosen as an initial target to screen with the BTB assay as S. cerevisiae is a
higher ethanol producing organism. Figure 6 below is one example of a plate of knockout
mutants from Robillard, 2007. This assay should also be considered for use in other mutant or
wild type libraries for species that are capable of ethanol production.

19
A) B)
Figure 6: A) Sample plate from Robillard, 2007 of Y101 knockout mutants in BTB assay.
Note the large, darker orange colony on the left side of the plate. This colony was selected
as a potentially higher producing. B) An unstreaked BTB plate for comparison. Note the
color change to yellow or orange with increasing acidity.
Materials and Methods:
1. Saccharomyces cerevisiae growth:
S. cerevisiae from frozen stocks were streaked with a toothpick onto YPD agar plates and
grown for 24 hours at 30º C. All plates were stored short term in a 4º C refrigerator. Individual
colonies were selected and used to inoculate 3 mL liquid YPD cultures for each strain to be
tested with sugars. The ten strains selected were: Y1, Y47, Y49, Y52, Y53, Y101, Y103, Y195,
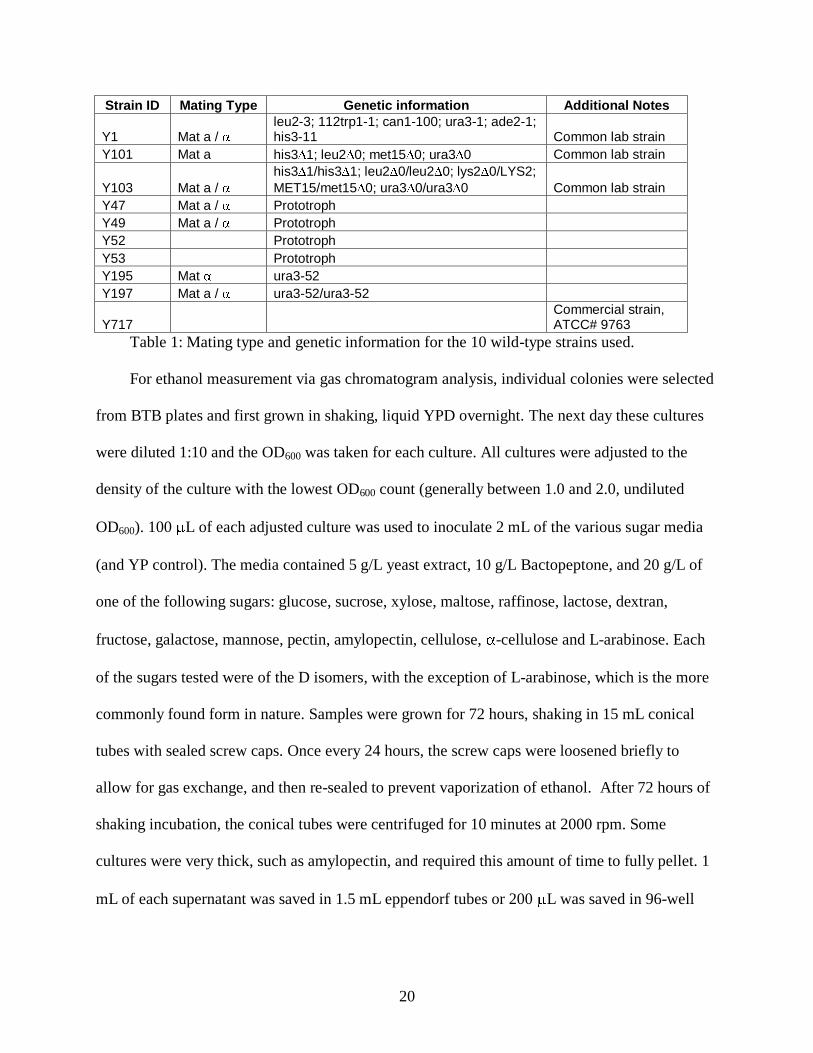
Y197 and Y717, based on previously used strains in Robillard (2007). Table 1 shows mating
types and genetic information for the 10 strains used. After growing overnight in 30º C shaker, a
10-4
dilution of cultures were spread on BTB plates to isolate individual colonies (see Appendix
A for BTB plate protocol). BTB plates were grown for 48 or 72 hrs depending on the strain.
Strains Y47, Y49, Y53 and Y101 needed only 48 hours, while the rest needed 72 hours for
colonies to grow large enough to select.
20
Strain ID Mating Type Genetic information Additional Notes
Y1 Mat a / leu2-3; 112trp1-1; can1-100; ura3-1; ade2-1; his3-11 Common lab strain
Y101 Mat a his3 1; leu2 0; met15 0; ura3 0 Common lab strain
Y103 Mat a /
his3 1/his3 1; leu2 0/leu2 0; lys2 0/LYS2;
MET15/met15 0; ura3 0/ura3 0 Common lab strain
Y47 Mat a / Prototroph
Y49 Mat a / Prototroph
Y52 Prototroph
Y53 Prototroph
Y195 Mat ura3-52
Y197 Mat a / ura3-52/ura3-52
Y717 Commercial strain, ATCC# 9763
Table 1: Mating type and genetic information for the 10 wild-type strains used.
For ethanol measurement via gas chromatogram analysis, individual colonies were selected
from BTB plates and first grown in shaking, liquid YPD overnight. The next day these cultures
were diluted 1:10 and the OD600 was taken for each culture. All cultures were adjusted to the
density of the culture with the lowest OD600 count (generally between 1.0 and 2.0, undiluted
OD600). 100 L of each adjusted culture was used to inoculate 2 mL of the various sugar media
(and YP control). The media contained 5 g/L yeast extract, 10 g/L Bactopeptone, and 20 g/L of
one of the following sugars: glucose, sucrose, xylose, maltose, raffinose, lactose, dextran,
fructose, galactose, mannose, pectin, amylopectin, cellulose, -cellulose and L-arabinose. Each
of the sugars tested were of the D isomers, with the exception of L-arabinose, which is the more
commonly found form in nature. Samples were grown for 72 hours, shaking in 15 mL conical
tubes with sealed screw caps. Once every 24 hours, the screw caps were loosened briefly to
allow for gas exchange, and then re-sealed to prevent vaporization of ethanol. After 72 hours of
shaking incubation, the conical tubes were centrifuged for 10 minutes at 2000 rpm. Some
cultures were very thick, such as amylopectin, and required this amount of time to fully pellet. 1
mL of each supernatant was saved in 1.5 mL eppendorf tubes or 200 L was saved in 96-well

21
plate format with foil covers. 5 L was used for gas chromatogram analysis. The remaining
supernatants were stored in -20º C freezer.
The 44 Y101 knockout mutants of interest identified in Robillard (2007) were grown in 100
L of YPD + G418 (or YPD for the Y101 WT control). 2 L of each frozen stock from the
library was used to inoculate 100 L of media and cells were grown for 48 hours at 30º C. 100
L of 50% glycerol (as a cryo-protectant) was added to each well, and cells were frozen in -80º
C storage. From this plate of 44 mutants and 3 wells of Y101 controls, 5 L of each well was
used to inoculate a fresh plate of 200 L YPD and cultures were grown for 48 hours at 30º C
with foil plate covers. Plates were centrifuged for 5 minutes at 1000 rpm. 5 L was used for gas
chromatogram analysis and the remaining supernatant was frozen.
2. Clostridium thermocellum growth:
C. thermocellum was initially grown from frozen stocks (ATCC # 27405) in CMS media;
see Appendix B for protocol (Rani and Seenayya 1999). As C. thermocellum is a thermophillic
obligate anaerobe, 2 mL cultures were grown at 60º C, without shaking, in gas tight jars
containing nitrogen gas. Using a 2 way stop-cock, as much air as possible was vacuumed out
and then nitrogen gas was added. This was repeated twice to remove as much oxygen as
possible. After 5 days incubation, 5 mL cultures of CMS with various sugars were set up in 15
mL conical tubes with screw tops. Amylopectin, pectin, cellulose, -cellulose, cellobiose (one
1-4 linked glucose disaccharide) and glucose were tested at 4 g/L, plus CMS media without
sugar. Using a Pasteur pipette with the cap held over most of the tube mouth, each sample was
flushed with nitrogen gas for 30 seconds to remove as much air as possible. Screw caps were
tightened immediately and samples were place in 60º C incubation without shaking for 7 days.
Cultures were centrifuged for 10 minutes at 2000 rpm, and 200 L of supernatant was frozen for

22
analysis. C. thermocellum from the initial culture was streaked onto standard BTB plates, as well
as those containing CMS, BTB and 18 g/L agar, but no growth was observed.
4. Gas Chromatogram analysis:
Samples were run on a Perkin Elmer Autosystem Gas Chromatogram, with a 0.53 mm
capillary column. Running temperatures were as follows: oven: 100º C; detector: 200º C;
injector: 250º C. Flow rate was 1.5 mL/min, with an automatic stop time of 2 minutes. Percent
ethanol values were calculated with a standard curve generated from running standards of 0.25%,
0.5%, 1% and 2% ethanol. For each different type of media, a new standard curve was generated.
All samples (including standards) were pre-diluted 1:50 in diH20. See Appendix C for complete
GC protocol and a sample standard curve.
Results:
1. Darker colonies generally correlate with higher ethanol production.
The ten wild-type strains were pre-grown on BTB plates and the results of two plates are
shown below. Strains Y49, 47, Y52 and Y717 are shown in Figure 7. These were among the
higher ethanol producing strains and the colonies are generally darker, an orange-red color.

23
A) B)
Figure 7: A) Y49 (left) and Y47 (right) on a BTB plate. B) Y52 (left) and Y717 (right) on a
BTB plate. These strains were among the highest ethanol producers and are a very red-
orange color.
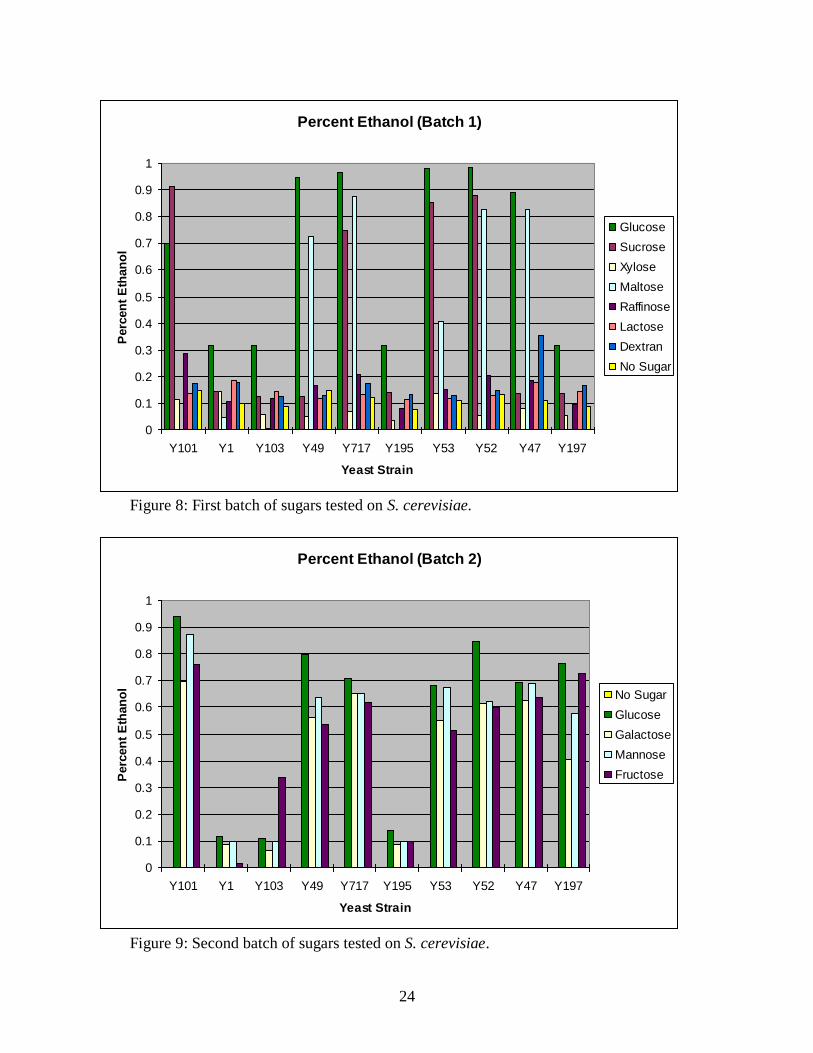
2. Highest ethanol yields resulted from hexose sugars in strains Y101, Y49, Y717, Y53,
Y52 and Y47.
Figures 8, 9 and 10 show the results for ethanol produced from the first three batches of
sugars tested across 10 WT strains. As ethanol percents are generated with standard curves
which do not intersect the y-axis at exactly the origin, some very low ethanol values show
negative values. The amount of ethanol produced is negligible in these cases. It is quite clear
that simple hexoses and disaccharide-hexoses such as glucose, sucrose, maltose, galactose,
mannose and fructose are carbon sources that result in high ethanol production. Additionally,
many WT strains show different profiles of what sugars they are capable of fermenting.
Generally, strains Y101, Y49, Y717, Y53, Y52 and Y47 consistently produced more ethanol
with a variety of energy sources, although other strains occasionally resulted in high yields.
Figure 8 and 9 demonstrate that the same strains, even in different batches have consistent
ethanol yields, with a variety of substrates.
24
Percent Ethanol (Batch 1)
0
0.1
0.2
0.3
0.4
0.5
0.6
0.7
0.8
0.9
1
Y101 Y1 Y103 Y49 Y717 Y195 Y53 Y52 Y47 Y197
Yeast Strain
Perc
en
t E
than
ol
Glucose
Sucrose
Xylose
Maltose
Raffinose
Lactose
Dextran
No Sugar
Figure 8: First batch of sugars tested on S. cerevisiae.
Percent Ethanol (Batch 2)
0
0.1
0.2
0.3
0.4
0.5
0.6
0.7
0.8
0.9
1
Y101 Y1 Y103 Y49 Y717 Y195 Y53 Y52 Y47 Y197
Yeast Strain
Perc
en
t E
than
ol
No Sugar
Glucose
Galactose
Mannose
Fructose
Figure 9: Second batch of sugars tested on S. cerevisiae.
25
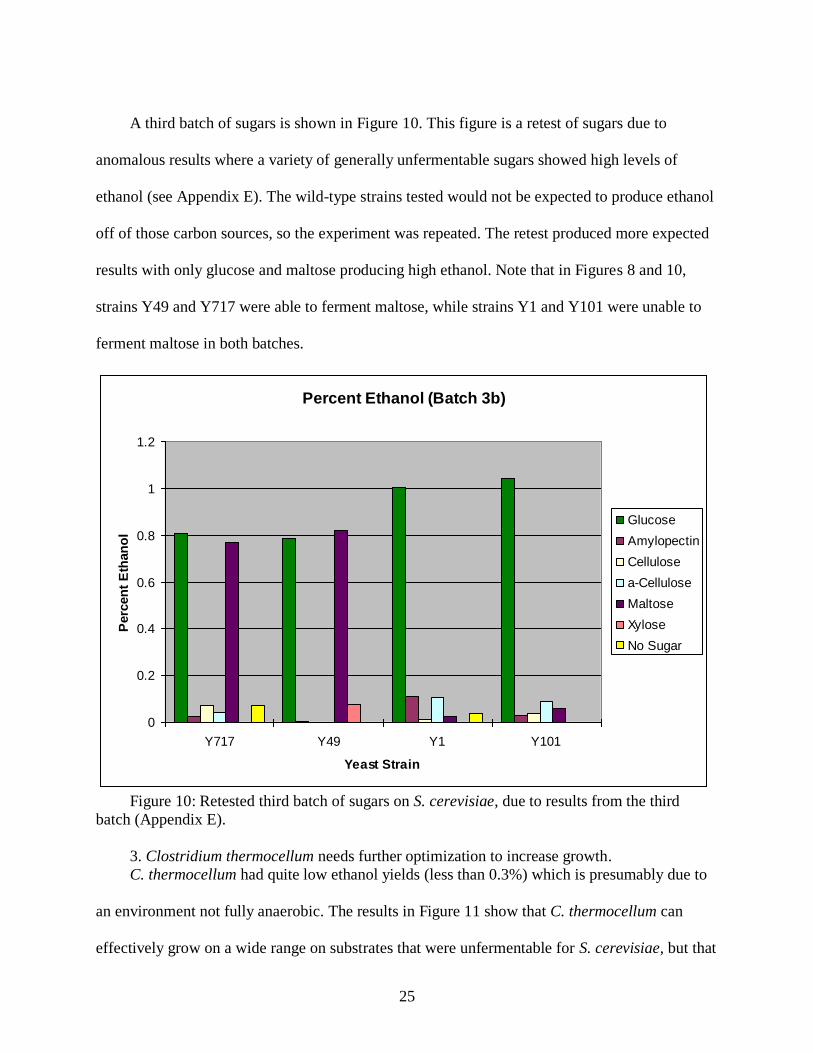
A third batch of sugars is shown in Figure 10. This figure is a retest of sugars due to
anomalous results where a variety of generally unfermentable sugars showed high levels of
ethanol (see Appendix E). The wild-type strains tested would not be expected to produce ethanol
off of those carbon sources, so the experiment was repeated. The retest produced more expected
results with only glucose and maltose producing high ethanol. Note that in Figures 8 and 10,
strains Y49 and Y717 were able to ferment maltose, while strains Y1 and Y101 were unable to
ferment maltose in both batches.
Percent Ethanol (Batch 3b)
0
0.2
0.4
0.6
0.8
1
1.2
Y717 Y49 Y1 Y101
Yeast Strain
Perc
en
t E
than
ol
Glucose
Amylopectin
Cellulose
a-Cellulose
Maltose
Xylose
No Sugar
Figure 10: Retested third batch of sugars on S. cerevisiae, due to results from the third
batch (Appendix E).
3. Clostridium thermocellum needs further optimization to increase growth.
C. thermocellum had quite low ethanol yields (less than 0.3%) which is presumably due to
an environment not fully anaerobic. The results in Figure 11 show that C. thermocellum can
effectively grow on a wide range on substrates that were unfermentable for S. cerevisiae, but that
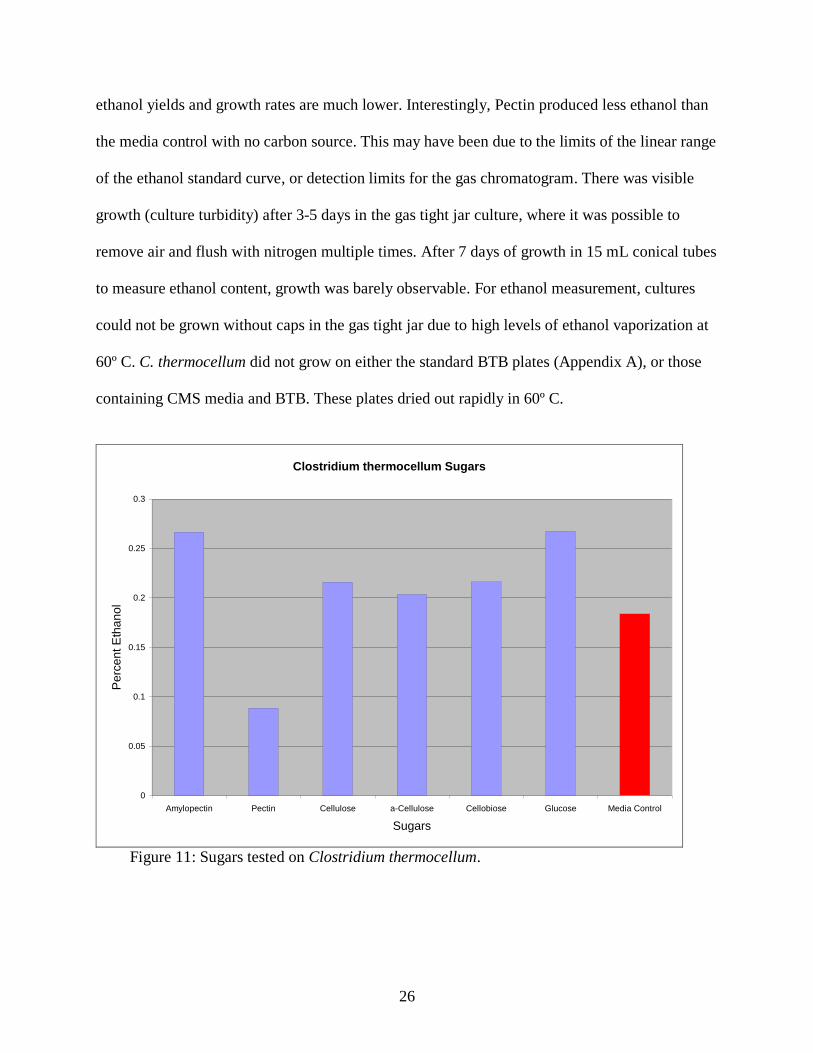
26
ethanol yields and growth rates are much lower. Interestingly, Pectin produced less ethanol than
the media control with no carbon source. This may have been due to the limits of the linear range
of the ethanol standard curve, or detection limits for the gas chromatogram. There was visible
growth (culture turbidity) after 3-5 days in the gas tight jar culture, where it was possible to
remove air and flush with nitrogen multiple times. After 7 days of growth in 15 mL conical tubes
to measure ethanol content, growth was barely observable. For ethanol measurement, cultures
could not be grown without caps in the gas tight jar due to high levels of ethanol vaporization at
60º C. C. thermocellum did not grow on either the standard BTB plates (Appendix A), or those
containing CMS media and BTB. These plates dried out rapidly in 60º C.
Clostridium thermocellum Sugars
0
0.05
0.1
0.15
0.2
0.25
0.3
Amylopectin Pectin Cellulose a-Cellulose Cellobiose Glucose Media Control
Sugars
Perc
ent E
than
ol
Figure 11: Sugars tested on Clostridium thermocellum.
27
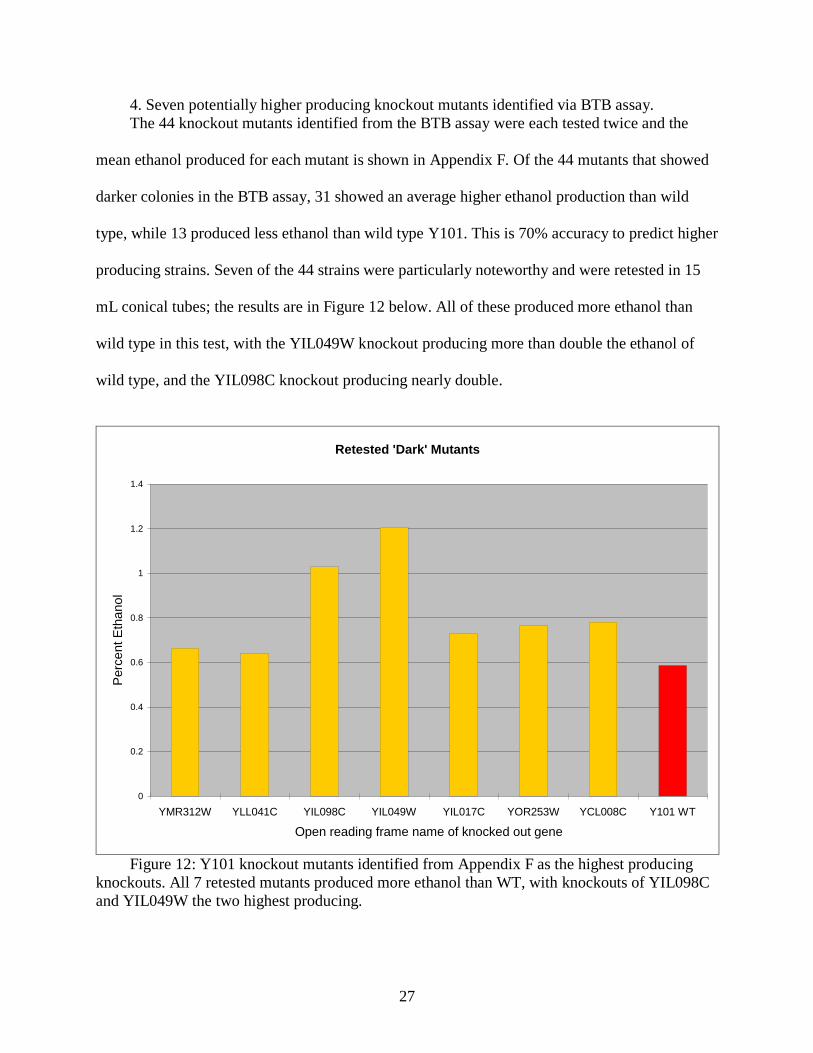
4. Seven potentially higher producing knockout mutants identified via BTB assay.
The 44 knockout mutants identified from the BTB assay were each tested twice and the
mean ethanol produced for each mutant is shown in Appendix F. Of the 44 mutants that showed
darker colonies in the BTB assay, 31 showed an average higher ethanol production than wild
type, while 13 produced less ethanol than wild type Y101. This is 70% accuracy to predict higher
producing strains. Seven of the 44 strains were particularly noteworthy and were retested in 15
mL conical tubes; the results are in Figure 12 below. All of these produced more ethanol than
wild type in this test, with the YIL049W knockout producing more than double the ethanol of
wild type, and the YIL098C knockout producing nearly double.
Retested 'Dark' Mutants
0
0.2
0.4
0.6
0.8
1
1.2
1.4
YMR312W YLL041C YIL098C YIL049W YIL017C YOR253W YCL008C Y101 WT
Open reading frame name of knocked out gene
Perc
ent E
than
ol
Figure 12: Y101 knockout mutants identified from Appendix F as the highest producing
knockouts. All 7 retested mutants produced more ethanol than WT, with knockouts of YIL098C
and YIL049W the two highest producing.
28
Discussion:
A wide variety of sugars (15 in total) were chosen to test across ten wild-type strains to
develop a profile for the best ethanol producing strains (Figures 8-10) . As a beginning step in
the process of optimizing ethanol production, choosing a strain that has a higher initial ethanol
output and tolerance is important. While general labs strains have been engineered to become
significantly more ethanol tolerant (Alper, et al. 2006), it will be beneficial to choose a target for
engineering that already has higher ethanol tolerance and the ability to ferment a wider variety of
substrates. The most robust starting organism will help in maximizing product when feeding an
organism a complex mix of plant tissues that will certainly contain many different sugars.
Unfortunately, none of the strains tested were able to ferment the sugars present in large
quantities in cellulose and hemi-cellulose; the non human food portion of plants. This is not
surprising, and it indicates what metabolic machinery needs to be improved upon or added in
these strains to increase ethanol production. For example, Y717 and Y52 are both higher ethanol
producing strains that effectively metabolize glucose, sucrose, maltose, mannose, galactose and
fructose, but important carbon sources like xylose and cellulose are unfermentable by these
strains. Fitting the strain to the substrate is certainly important, as some strains may produce
large amounts of ethanol with one carbon source, but very little with another. Y101 and Y1 are
two such examples as they produces high ethanol with several substrates, but close to zero
ethanol when fed maltose. Maltose did result in relatively high ethanol production for some
strains, such as Y717, Y52, Y47 and Y49 (See Figure 8). Y101 and Y1’s lack of ability to
ferment maltose may be due to the fact that they are domesticated, haploid lab strains, which
may have reduced some of their functionality. Y717 on the other hand is a commercial strain
obtained from the ATCC, and diploid as well, which generally makes a strain more robust. Y47,

29
Y49, Y52 and Y53 are all prototrophs (see Table 1) so they will grow quickly without requiring
amino acid supplementation.
While only an initial step in screening strains for their substrate fermenting versatility and
ethanol yield, it provides an important starting point. Screens such as the one done here will help
in a two-fold manner: by eliminating the weakest strains from the focus of research, and by
identifying areas where potentially useful strains need improvement. The most important areas
for improvement are for yeasts to be able to ferment cellulose and hemi-cellulose, so feed-stocks
will need pre-treatment to break cellulose and hemi-cellulose into monomers, and pentose
metabolizing enzymes will need to be added to S. cerevisiae. In addition to these two aspects,
discovering genes that may be detrimental to ethanol production is another step in the
optimization process.
Although the BTB assay does not predict every instance of high ethanol producing strains,
it has been demonstrated that 70% of the predicted higher producing strains actually produced
more ethanol. Therefore this assay may be a useful tool to screen a variety of strains. As the
color change in BTB plates shows increasing acidity, it is useful as a qualitative, but not
quantitative, measurement of increased metabolism. This increased acidity is correlated with
increased ethanol production as carbonic acid is formed as a byproduct of fermentation.
Appendix D provides descriptions of the 44 Y101 knockout mutations tested, the results
displayed in Appendix F.
The strains of particular interest in Figure 12 have knockouts in a variety of genes with
some that appear to be generally unrelated to ethanol production, and some that will clearly
influence cell metabolism. YMR312W is a subunit of the Elongator complex involved in
transcription with RNA polymerase II holoenzyme, and its deletion results in altered mRNA
30
expression for a wide variety of genes. This deletion mutant will therefore have an assortment of
altered cellular pathways and it is unknown how this may affect metabolism. YLL041C is the
iron-sulfur protein subunit of succinate dehydrogenase. This is interesting, because as an enzyme
involved in the TCA cycle, the aerobic respiration pathway, increased ethanol may result from
TCA cycle being shut down and glycolytic fermentation as the only energy source. Glycolysis
produces ethanol and acetate as its final products, so a non-functional TCA cycle may be
somewhat beneficial for ethanol production. YIL098C was of particular interest because it
resulted in over 1% ethanol, while wild type produced less than 0.6% ethanol. YIL098C is a
mitochondrial matrix protein involved in assembly of ATP synthase and knockout mutants have
decreased glycogen accumulation. This provides further evidence that proteins involved in
aerobic respiration (in the mitochondria) may be detrimental to increased ethanol formation, as
pyruvate is not turned into ethanol in aerobic respiration. If the YIL098C knockout mutant
cannot accumulating glycogen, perhaps it is producing more ethanol as a source of stored energy.
YIL049W was the highest producing of the re-tested knockout mutants in Figure 12, producing
more than double the ethanol as compared with wild type. It is particularly interesting as it is a
protein of unknown function, although it is utilized in filamentous growth. Further
characterization of the YIL049W protein may be important, as the knockout showed promising
ethanol yields. YIL017C is part of degradation of fructose-1,6-bisphosphatase, and it is a
negative regulator of gluconeogenesis. Fructose-1,6-bisphosphatase acts in gluconeogenesis,
performing the opposite function of phosphofructokinase in glycolysis. YOR253W is a subunit
of N-terminal acetyltransferase, which is involved in several cellular functions such as cell cycle,
heat-shock resistance, mating, and others. YCL008C is part of the ESCRT-I complex which is
involved in protein sorting into the endosome. It is unclear how these last three proteins may

31
impact ethanol production as their effects are wide-reaching. The genes identified in this report
have a variety of functions and influence many aspects other than ethanol formation. As the BTB
assay is a qualitative means for predicting ethanol yield, there are likely many more genes that
are important to up or downregulate for maximizing ethanol.
As C. thermocellum has the ability to metabolize cellulosic sources of carbon to form
ethanol, it is important to learn more about this organism. Using this microbe to ferment
cellulosic carbon sources may not be the most efficient process, but it is a potential candidate to
use for obtaining enzymes that can be inserted into more efficient fermenting microbes. The
greatest difficulties encountered with this organism are its fastidious growth requirements as an
obligate, thermophilic anaerobe. While growing cultures at 60º C it is not prohibitively difficult,
it does raise difficulties for retaining ethanol, which has a boiling point of 78.4º C. Maintaining
cultures which evaporate rapidly may skew results to show low ethanol levels. If this organism
was to be the subject of further experiments, two-way stoppers for individual test tubes would be
necessary to ensure a more anaerobic environment. Additionally, a smaller head-space (5 mL of
culture was grown in 15 mL tubes) would likely help, allowing less room for ethanol
evaporation. In addition to complications with growth in liquid cultures, the high growing
temperature makes the use of agar plates even more difficult. C. thermocellum colonies may
have grown on the various BTB plates tested if allowed to grow for longer, but this was not
possible as the plates dried out in approximately 1 week, and no growth was observed in this
time.

32
Future Experiments:
Further characterization of YIL049W and YIL098C:
As YIL049W and YIL098C were identified as high producing knockout mutants, it may
help to gain further information on these proteins, especially in the case of YIL049W. While it is
known that YIL098C is a mitochondrial protein, little is known about YIL049W. It would also
be beneficial to learn more about YIL049W for the sake of science, as it has not been studied
significantly. If either of these proteins inhibit ethanol production, it could be a simple way of
boosting ethanol yield by knocking it out in other strains.
Screen all mitochondrial proteins:
As both YIL098C and YLL041C were higher producing knockout strains and both are
involved in aerobic metabolism, a closer examination of all nuclear encoded mitochondrial
proteins may be beneficial. As ethanol is not produced during the aerobic TCA cycle, the
deletion of certain of these proteins may in fact increase ethanol yield, by stopping the cycle.
Shunting pyruvate toward ethanol production instead of the TCA cycle may be possible by
deletion of certain genes. Of course deletion of key enzymes involved in metabolism may stunt
growth greatly, resulting in lower ethanol yields, but a closer look is certainly warranted.
Screen Y101 library mutants with sugars other than glucose:
The easily fermentable sugars such as glucose and some other hexoses (Figures 8 and 9) are
most abundant in human food crops, so the fermentation of generally unfermentable sugars is
desired. Certain genes may inhibit fermentation of some sugars over others. This would involve
creating more BTB plates with a carbon source other than glucose to perform the initial BTB
assay.
33
Screen E. coli libraries with BTB assay:
S. cerevisiae is a useful model organism with a library of mutants, but there are other
organisms with this tool as well. E. coli is another organism that can produce ethanol, and
screening E. coli mutant libraries with the BTB assay followed by quantitative methods may
identify further genes of importance in ethanol production.
Add pentose fermenting genes to S. cerevisiae and conduct further co-substrate
experiments:
Small amount of glucose and raffinose have been shown to increase xylose metabolism and
ethanol yield (van Zyl, et al. 1999). Perhaps other sugars may be beneficial to test as co-
substrates with xylose. In order to perform co-substrate experiments, the addition of a variety of
genes that would enable S. cerevisiae to ferment xylose will be necessary as the wild-type strains
are not effective in utilizing xylose. The genes of interest for addition and upregulation are
discussed above in the introduction.
34
Appendix A: Bromothymol Blue (BTB) agar plate protocol for S. cerevisiae
SC drop out media:
1. 6.7 g/L Yeast nitrogen base without amino acids
2. 1.4 g/L Yeast synthetic drop out supplement
3. 18 g/L Bactoagar
Autoclave 20 minutes
4. 40 mL of 50% Glucose solution (w/V) per Liter of SC media
Autoclave Glucose solution for 20 minutes (separate container from 3 components
above).
5. Add autoclaved amino acid supplements to SC media in the following amounts:
10 mL/ L Leucine
9 mL/ L Uracil
6 mL/ L Tryptophan
3 mL/ L Histidine
pH adjustment:
6. After autoclaving SC media, adjust pH of entire bottle while keeping on hot plate
so media does not solidify.
7. Add 1.5 mL/ L of 5 N NaOH
8. Mix media and test pH with pH strip
9. Media should be ~ pH 7, if not adjust until it is at 7
Bromothymol Blue addition:
10. Add 0.13 g/ L of BTB
Media will turn to a dark blue-green.
11. Mix thoroughly and pour plates (~25 mL per plate or until plates are half full)

35
Appendix B: CMS media protocol for C. thermocellum growth
Add the following CMS media components:
1.5 g/L KH2PO4
2.0 g/L K2HPO4
2.0 g/L Urea
0.8 g/L MgSO4
0.15 g/L CaCl2
3.5 g/L Sodium Citrate
0.5 g/L Yeast Extract
0.15 g/L Cysteine HCl
0.002 g/L Resazurin
4.0 g/L Cellobiose (or glucose, cellulose, etc.)
pH adjustment:
pH will be ~7.5. Test pH with strip and adjust to 6.7-7.0 with HCl
Autoclave 20 minutes
For CMS BTB plates:
CMS media was made as described above with the absence of Resazurin which is
another indicator.
18g/L agar was added
0.13 g/L BTB was added after autoclaving
36
Appendix C: Gas Chromatogram Protocol
Turning on the GC and running samples:
1. Turn on GC power switch
2. Turn N2, H2 and Air tanks on
3. Turn on Integrator
4. Hit ‘Status Escape’ and wait until display reads ‘Ready’. Display will flash if not ready
5. Press ‘Auto Zero’ key when GC is ready.
6. Turn hydrogen knob (on top of GC) all the way on. Wait approximately 1 minute.
7. Open right panel and place igniter firmly on detector. Wait until you can see a slight
orange glow on the detector.
8. Turn air knob (on top of GC) all the way on. Listen for double pop noise. If unsure
whether gas is lit, retry, waiting for a few minutes between ignition attempts.
9. Dilute all samples and Standards (0.25%, 0.5%, 1% and 2% [can include 4% as well]
ethanol) 1:50 in reagent grade water.
10. Rinse syringe thoroughly with rdH20 before using.
11. Pull up 1 L of sample and then 1 L of air into syringe. Make sure no air bubbles are present in the sample.
12. Insert syringe into the detector and push plunger down in one smooth motion, while
hitting the ‘Start’ key on the Integrator at the same time. While insert syringe support the
needle so as not to bend it.
13. Rinse syringe 3-4 times in rdH20 and prepare next sample. The next sample can be
injected as soon as the green ready light on the integrator is on.
Turning off the GC:
1. Wait at least 10 minutes after last sample was run before turning off
2. Turn carrier gas (N2) off. Wait till pressure drops to zero.
3. Turn Air and H2 gas off.
Note: H2 gas will take a few days to drop as it has a closed seal with the GC.
4. Turn off flow valves for Air and H2 on top of the GC. The voltage on the display should
drop.
5. Turn off GC power
6. Turn off Integrator power
Data Analysis:
1. Make a standard curve with ethanol standards for each different type of media. Plot
percent ethanol vs. ethanol peak area. Run a linear regression line to the data plot. See
sample standard curve below:

37
Note: Ethanol peak areas should have a retention time between 0.34-0.38, but this will vary
depending on who injects the samples. The retention times are printed to the right of peaks
and below the graph, next to the corresponding peak area.
2. Use standard curve to calculate ethanol percents based on peak areas for each sample.
38
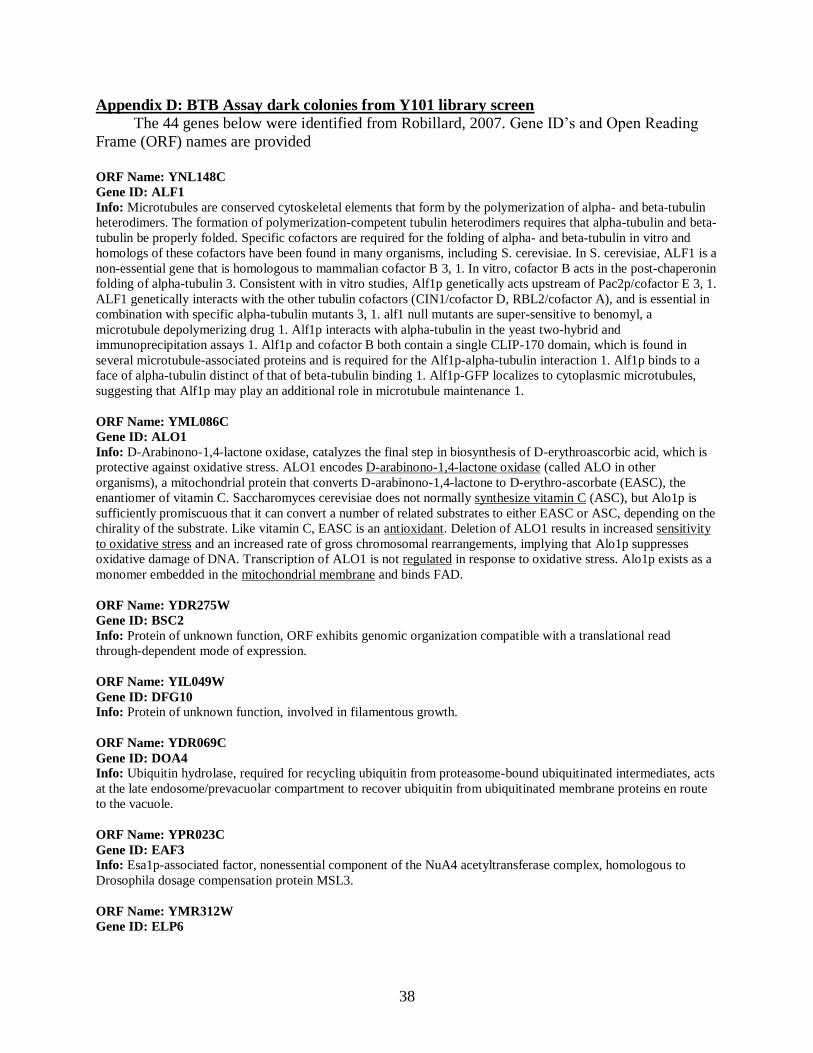
Appendix D: BTB Assay dark colonies from Y101 library screen
The 44 genes below were identified from Robillard, 2007. Gene ID’s and Open Reading
Frame (ORF) names are provided
ORF Name: YNL148C
Gene ID: ALF1
Info: Microtubules are conserved cytoskeletal elements that form by the polymerization of alpha- and beta-tubulin
heterodimers. The formation of polymerization-competent tubulin heterodimers requires that alpha-tubulin and beta-
tubulin be properly folded. Specific cofactors are required for the folding of alpha- and beta-tubulin in vitro and
homologs of these cofactors have been found in many organisms, including S. cerevisiae. In S. cerevisiae, ALF1 is a
non-essential gene that is homologous to mammalian cofactor B 3, 1. In vitro, cofactor B acts in the post-chaperonin
folding of alpha-tubulin 3. Consistent with in vitro studies, Alf1p genetically acts upstream of Pac2p/cofactor E 3, 1.
ALF1 genetically interacts with the other tubulin cofactors (CIN1/cofactor D, RBL2/cofactor A), and is essential in
combination with specific alpha-tubulin mutants 3, 1. alf1 null mutants are super-sensitive to benomyl, a
microtubule depolymerizing drug 1. Alf1p interacts with alpha-tubulin in the yeast two-hybrid and
immunoprecipitation assays 1. Alf1p and cofactor B both contain a single CLIP-170 domain, which is found in
several microtubule-associated proteins and is required for the Alf1p-alpha-tubulin interaction 1. Alf1p binds to a
face of alpha-tubulin distinct of that of beta-tubulin binding 1. Alf1p-GFP localizes to cytoplasmic microtubules,
suggesting that Alf1p may play an additional role in microtubule maintenance 1.
ORF Name: YML086C
Gene ID: ALO1
Info: D-Arabinono-1,4-lactone oxidase, catalyzes the final step in biosynthesis of D-erythroascorbic acid, which is
protective against oxidative stress. ALO1 encodes D-arabinono-1,4-lactone oxidase (called ALO in other
organisms), a mitochondrial protein that converts D-arabinono-1,4-lactone to D-erythro-ascorbate (EASC), the
enantiomer of vitamin C. Saccharomyces cerevisiae does not normally synthesize vitamin C (ASC), but Alo1p is
sufficiently promiscuous that it can convert a number of related substrates to either EASC or ASC, depending on the
chirality of the substrate. Like vitamin C, EASC is an antioxidant. Deletion of ALO1 results in increased sensitivity
to oxidative stress and an increased rate of gross chromosomal rearrangements, implying that Alo1p suppresses
oxidative damage of DNA. Transcription of ALO1 is not regulated in response to oxidative stress. Alo1p exists as a
monomer embedded in the mitochondrial membrane and binds FAD.
ORF Name: YDR275W
Gene ID: BSC2
Info: Protein of unknown function, ORF exhibits genomic organization compatible with a translational read
through-dependent mode of expression.
ORF Name: YIL049W
Gene ID: DFG10
Info: Protein of unknown function, involved in filamentous growth.
ORF Name: YDR069C
Gene ID: DOA4
Info: Ubiquitin hydrolase, required for recycling ubiquitin from proteasome-bound ubiquitinated intermediates, acts
at the late endosome/prevacuolar compartment to recover ubiquitin from ubiquitinated membrane proteins en route
to the vacuole.
ORF Name: YPR023C
Gene ID: EAF3
Info: Esa1p-associated factor, nonessential component of the NuA4 acetyltransferase complex, homologous to
Drosophila dosage compensation protein MSL3.
ORF Name: YMR312W
Gene ID: ELP6

39
Info: Subunit of Elongator complex, which is required for modification of wobble nucleosides in tRNA; required for
Elongator structural integrity. Elp6p is part of the six-subunit Elongator complex, which is a major histone
acetyltransferase component of the RNA polymerase II holoenzyme responsible for transcriptional elongation.
Elongator contains two discrete subcomplexes, one consisting of Iki3p/Elp1p, Elp2p, and Elp3p, and the other
consisting of Elp4p, Iki1p/Elp5p, and Elp6p. Elongator binds to both naked and nucleosomal DNA, can acetylate
both core histones and nucleosomal substrates, and plays a role in chromatin remodeling. Its activity is directed
specifically toward the amino-terminal tails of histone H3 and H4, with the predominant acetylation sites being
lysine-14 of histone H3 and lysine-8 of histone H4. Of the six Elongator subunits, only Iki1p/Elp5p is essential for
growth, and deletion of the other individual subunits causes significantly altered mRNA expression levels for many
genes. Disruption of the Elongator complex confers resistance to the Kluyveromyces lactis zymotoxin, and a
reduced sensitivity to the Pichia inositovora toxin.
ORF Name: YHR123W
Gene ID: EPT1
Info: sn-1,2-diacylglycerol ethanolamine- and cholinephosphotranferase; not essential for viability. Gene products
are diacylglycerol cholinephosphotransferase, diacylglycerol ethanolaminephosphotransferase.
ORF Name: YIL098C
Gene ID: FMC1
Info: Mitochondrial matrix protein, required for assembly or stability at high temperature of the F1 sector of
mitochondrial F1F0 ATP synthase; null mutant temperature sensitive growth on glycerol is suppressed by multicopy
expression of Odc1p. Deletion results in decreased metabolite accumulation (glycogen).
ORF Name: YOR375C
Gene ID: GDH1
Info: NADP(+)-dependent glutamate dehydrogenase, synthesizes glutamate from ammonia and alpha-ketoglutarate;
rate of alpha-ketoglutarate utilization differs from Gdh3p; expression regulated by nitrogen and carbon sources,
Exhibits sensitivity at 15 generations when grown in medium of pH 8. Topoisomerases are highly conserved; yeast
Top1p shares 57% identity with human Top1. The Top1 protein, like other type IB topoisomerases, relaxes
supercoiled DNA by forming a DNA-enzyme complex and transiently cleaving one strand via a nucleophilic attack
that results in a covalent linkage with the 3' end of the cleaved strand. The 5' end can then rotate freely. Top1p is the
target of the antitumor drug camptothecin. Camptothecin increases the half-life of the enzyme-DNA complex, which
results in double-stranded DNA breaks during DNA replication. Specific amino acid substitutions in Top1p have the
same effect as the drug. Suppressors of these mutations were identified that reduced the enzyme's affinity for DNA.
ORF Name: YGL121C
Gene ID: GPG1
Info: Proposed gamma subunit of the heterotrimeric G protein that interacts with the receptor Grp1p; involved in
regulation of pseudohyphal growth; requires Gpb1p or Gpb2p to interact with Gpa2p.
ORF Name: YLR384C
Gene ID: IKI3
Info: Subunit of Elongator complex, which is required for modification of wobble nucleosides in tRNA; maintains
structural integrity of Elongator; homolog of human IKAP, mutations that cause familial dysautonomia. Iki3p/Elp1p
is part of the six-subunit Elongator complex, which is a major histone acetyltransferase component of the RNA
polymerase II holoenzyme responsible for transcriptional elongation. Elongator contains two discrete subcomplexes,
one consisting of Iki3p/Elp1p, Elp2p, and Elp3p, and the other consisting of Elp4p, Iki1p/Elp5p, and Elp6p.
Elongator binds to both naked and nucleosomal DNA, can acetylate both core histones and nucleosomal substrates,
and plays a role in chromatin remodeling. Its activity is directed specifically toward the amino-terminal tails of
histone H3 and H4, with the predominant acetylation sites being lysine-14 of histone H3 and lysine-8 of histone H4.
Within Elongator, Iki3p/Elp3p interacts specifically with Elp2p. Of the six Elongator subunits, only Iki1p/Elp5p is
essential for growth, and deletion of the other individual subunits causes significantly altered mRNA expression
levels for many genes. Disruption of the Elongator complex confers resistance to the Kluyveromyces lactis
zymotoxin, and a reduced sensitivity to the Pichia inositovora toxin. Mutations in the human Iki3p homolog IKAP
are associated with the disease Familial Dysautonomia.
40
ORF Name: YIL007C
Gene ID: NAS2
Info: Protein with similarity to the p27 subunit of mammalian proteasome modulator; not essential; interacts with
Rpn4p.
ORF Name: YOR253W
Gene ID: NAT5
Info: Subunit of the N-terminal acetyltransferase NatA (Nat1p, Ard1p, Nat5p); N-terminally acetylates many
proteins, which influences multiple processes such as the cell cycle, heat-shock resistance, mating, sporulation, and
telomeric silencing.
ORF Name: YLR335W
Gene ID: NUP2
Info: Protein involved in nucleocytoplasmic transport, binds to either the nucleoplasmic or cytoplasmic faces of the
nuclear pore complex depending on Ran-GTP levels; also has a role in chromatin organization. NUP2 encodes a
non-essential nuclear pore protein that has a central domain similar to those of Nsp1p and Nup1p. Transport of
macromolecules between the nucleus and the cytoplasm of eukaryotic cells occurs through the nuclear pore complex
(NPC), a large macromolecular complex that spans the nuclear envelope. The structure of the vertebrate NPC has
been studied extensively; The yeast NPC shares several features with the vertebrate NPC, despite being smaller and
less elaborate. Many yeast nuclear pore proteins, or nucleoporins, have been identified by a variety of genetic
approaches. Nup2 mutants show genetic interactions with nsp1 and nup1 conditional alleles. Nup1p interacts with
the nuclear import factor Srp1p and with the small GTPase Ran.
ORF Name: YLR338W
Gene ID: OPI9
Info: Dubious open reading frame unlikely to encode a protein, based on available experimental and comparative
sequence data; partially overlaps the verified ORF VRP1/YLR337C.
ORF Name: YIL050W
Gene ID: PCL7
Info: Pho85p cyclin of the Pho80p subfamily, forms a functional kinase complex with Pho85p which
phosphorylates Mmr1p and is regulated by Pho81p; involved in glycogen metabolism, expression is cell-cycle
regulated. Involved in regulation of glycogen biosynthetic process, regulation of glycogen catabolic process.
ORF Name: YNL264C
Gene ID: PDR17
Info: Phosphatidylinositol transfer protein (PITP), downregulates Plb1p-mediated turnover of phosphatidylcholine,
found in the cytosol and microsomes, homologous to Pdr16p, deletion affects phospholipid composition.
ORF Name: YIL053W
Gene ID: RHR2
Info: Constitutively expressed isoform of DL-glycerol-3-phosphatase; involved in glycerol biosynthesis, induced in
response to both anaerobic and, along with the Hor2p/Gpp2p isoform, osmotic stress.
ORF Name: YFL033C
Gene ID: RIM15
Info: Glucose-repressible protein kinase involved in signal transduction during cell proliferation in response to
nutrients, specifically the establishment of stationary phase; identified as a regulator of IME2; substrate of Pho80p-
Pho85p kinase.
ORF Name: YDR388W
Gene ID: RVS167
Info: Actin-associated protein, subunit of a complex (Rvs161p-Rvs167p) involved in regulation of actin
cytoskeleton, endocytosis, and viability following starvation or osmotic stress; homolog of mammalian
amphiphysin.
41
ORF Name: YLL041C
Gene ID: SDH2
Info: Iron-sulfur protein subunit of succinate dehydrogenase (Sdh1p, Sdh2p, Sdh3p, Sdh4p), which couples the
oxidation of succinate to the transfer of electrons to ubiquinone. Involved in TCA cycle, aerobic respiration
pathways.
ORF Name: YGR229C
Gene ID: SMI1
Info: Protein involved in the regulation of cell wall synthesis; proposed to be involved in coordinating cell cycle
progression with cell wall integrity. Involved with 1,3-beta-glucan biosynthetic process, cell wall organization and
biogenesis.
ORF Name: YJL192C
Gene ID: SOP4
Info: ER-membrane protein; suppressor of pma1-7, deletion of SOP4 slows down the export of wild-type Pma1p
and Pma1-7 from the ER.
ORF Name: YIL073C
Gene ID: SPO22
Info: Meiosis-specific protein essential for chromosome synapsis, similar to phospholipase A2, involved in
completion of nuclear divisions during meiosis; induced early in meiosis.
ORF Name: YNL224C
Gene ID: SQS1
Info: Protein of unknown function; overexpression antagonizes the suppression of splicing defects by spp382
mutants; green fluorescent protein (GFP)-fusion protein localizes to both the cytoplasm and the nucleus.
ORF Name: YCR081W
Gene ID: SRB8
Info: Subunit of the RNA polymerase II mediator complex; associates with core polymerase subunits to form the
RNA polymerase II holoenzyme; essential for transcriptional regulation; involved in glucose repression.
ORF Name: YCL008C
Gene ID: STP22
Info: Component of the ESCRT-I complex, which is involved in ubiquitin-dependent sorting of proteins into the
endosome; homologous to the mouse and human Tsg101 tumor susceptibility gene; mutants exhibit a Class E Vps
phenotype.
ORF Name: YOL006C
Gene ID: TOP1
Info: Topoisomerase I, nuclear enzyme that relieves torsional strain in DNA by cleaving and re-sealing the
phosphodiester backbone; relaxes both positively and negatively supercoiled DNA; functions in replication,
transcription, and recombination. Topoisomerases catalyze the interconversion between topological states of DNA
by breaking and rejoining DNA strands. These changes in DNA topology are required during several cellular
processes such as replication, transcription, recombination, and chromosome condensation. There are three classes
of topoisomerases that are distinguished by substrate (IA, IB, II). Type I topoisomerases cleave one DNA strand,
while Type II enzymes cleave a pair of complementary DNA strands. The type IB topoisomerases relax both
positively and negatively supercoiled DNA; TOP1 encodes the type IB enzyme in yeast. Type IA topoisomerase,
encoded by TOP3 in yeast, relaxes only negatively supercoiled DNA, and yeast topoisomerase II is encoded by the
TOP2 gene.
ORF Name: YDR074W
Gene ID: TPS2
Info: Phosphatase subunit of the trehalose-6-phosphate synthase/phosphatase complex, which synthesizes the
storage carbohydrate trehalose; expression is induced by stress conditions and repressed by the Ras-cAMP pathway.
In Saccharomyces cerevisiae, trehalose is a major reserve carbohydrate involved in reponses to thermal, osmotic,

42
oxidative, and ethanol stresses, as well as the suppression of denatured protein aggregation. Trehalose biosynthesis
is a two-step process in which glucose 6-phosphate and UDP-glucose are converted by trehalose-6-phosphate
synthase (TPS), encoded by TPS1, into alpha,alpha-trehalose 6-phosphate, which is then converted with water into
trehalose and phosphate by trehalose-6-phosphate phosphatase (TPP), encoded by TPS2. The trehalose biosynthetic
pathway can affect glycolysis in that one of its intermediates, trehalose-6-phosphate, inhibits hexokinase activity,
which restricts the influx of sugars to glycolysis during the switch to fermentative metabolism. Tps1p and Tps2p are
part of the alpha,alpha-trehalose-phosphate synthase complex with Tps3p and Tsl1p, regulatory proteins with
partially overlapping functions, though some Tps1p appears to be present in the cell as a monomer. TPS1, TPS2,
TPS3 and TSL1 are coinduced under stress conditions, and corepressed by the Ras-cAMP pathway. Deletion of
TPS1 results in loss of both TPS activity and trehalose biosynthesis, whereas deletion of TPS2 results in temperature
sensitivity and loss of TPP activity.
ORF Name: YOL093W
Gene ID: TRM10
Info: tRNA methyltransferase, methylates the N-1 position of guanosine in tRNAs.
ORF Name: YPR066W
Gene ID: UBA3
Info: Protein that acts together with Ula1p to activate Rub1p before its conjugation to proteins (neddylation), which
may play a role in protein degradation; GFP-fusion protein localizes to the cytoplasm in a punctate pattern.
ORF Name: YLL039C
Gene ID: UBI4
Info: Ubiquitin, becomes conjugated to proteins, marking them for selective degradation via the ubiquitin-26S
proteasome system; essential for the cellular stress response.
ORF Name: YGR072W
Gene ID: UPF3
Info: Component of the nonsense-mediated mRNA decay (NMD) pathway, along with Nam7p and Nmd2p;
involved in decay of mRNA containing nonsense codons; involved in telomere maintenance.
ORF Name: YIL017C
Gene ID: VID28
Info: Protein involved in proteasome-dependent catabolite degradation of fructose-1,6-bisphosphatase (FBPase);
localized to the nucleus and the cytoplasm.
ORF Name: YOL105C
Gene ID: WSC3
Info: Partially redundant sensor-transducer of the stress-activated PKC1-MPK1 signaling pathway involved in
maintenance of cell wall integrity; involved in the response to heat shock and other stressors; regulates 1,3-beta-
glucan synthesis.
Gene ID: YJL163C
Info: Putative protein of unknown function.
Gene ID: YIL028W
Info: Dubious open reading frame unlikely to encode a protein, based on available experimental and comparative
sequence data.
Gene ID: YIL029C
Info: Putative protein of unknown function; deletion confers sensitivity to 4-(N-(S-glutathionylacetyl)amino)
phenylarsenoxide.
Gene ID: YIL092W

43
Info: Putative protein of unknown function; green fluorescent protein (GFP)-fusion protein localizes to the
cytoplasm and to the nucleus.
Gene ID: YNL305C
Info: Putative protein of unknown function; green fluorescent protein (GFP)-fusion protein localizes to the vacuole;
YNL305C is not an essential gene.
Gene ID: YOL114C
Info: Putative protein of unknown function with similarity to human ICT1 and prokaryotic factors that may function
in translation termination; YOL114C is not an essential gene.
Gene ID: YPL066W
Info: Hypothetical protein.
Gene ID: YPL102C
Info: Dubious open reading frame, not conserved in closely related Saccharomyces species; deletion mutation
enhances replication of Brome mosaic virus in S. cerevisiae, but this is likely due to effects on the overlapping gene
ELP4.
44
Appendix E: Third batch of sugars tested. Retested results shown in Figure 10
Percent Ethanol (Batch 3a)
0
0.2
0.4
0.6
0.8
1
1.2
1.4
1.6
1.8
Y101 Y1 Y103 Y49 Y717 Y195 Y53 Y52 Y47 Y197
Yeast Strain
Perc
en
t E
than
ol
No Sugar
Glucose
Pectin
Amylopectin
Cellulose
a-Cellulose
Arabinose
45
Appendix F: 44 Y101 knockout mutants of interest from BTB assay
Percent Ethanol - 'Dark' Mutants
0
0.2
0.4
0.6
0.8
1
1.2
1.4
1.6
YN
L148C
YM
L086C
YD
R275W
YIL
049W
YD
R069C
YP
R023C
YM
R312W
YH
R123W
YIL
098C
YO
R375C
YG
L121C
YLR
384C
YIL
007C
YO
R253W
YLR
335W
YLR
338W
YIL
050W
YN
L264C
YIL
053W
YF
L033C
YD
R388W
YLL041C
YG
R229C
YJL192C
YIL
073C
YN
L224C
YC
R081W
YC
L008C
YO
L006C
YD
R074W
YO
L093C
YP
R066W
YLL039C
YG
R072W
YIL
017C
YO
L105C
YJL163C
YIL
028W
YIL
029C
YIL
092C
YN
L305C
YO
L114C
YP
L066W
YP
L102C
Y101 W
T
Open reading frame name of knocked out gene
Pe
rce
nt E
tha
no
l
Y101 knockout mutants (light blue) and Y101 WT (red). Each knockout histobar is an
average of two separate trials while the Y101 WT is an average of 6 points (Y101 WT was run in
triplicate for both mutant trials). Selected knockout mutants of interest shown in Figure 10.
46
Literature Cited:
Alper, H., et al. (2006). Engineering Yeast Transcription Machinery for Improved Ethanol
Tolerance and Production. Science 314: 1565-1568
Chu, B.C.H., Lee, H. (2007). Genetic improvement of Saccharomyces cerevisiae for
xylose fermentation. Biotechnology Advances 25: 425-441.
Foreman, P.K., et al. (2003). Transcriptional Regulation of Biomass-degrading Enzymes in
the Filamentous Fungus Trichoderma reesei. The Journal of Biological Chemistry 278(34):
31988–31997
Gray, K.A., et al. (2006). Bioethanol. Current Opinion in Chemical Biology 10: 141–146
Jeffries, T.W., Jin, Y. (2004). Metabolic engineering for improved fermentation of
pentoses by yeasts. Applied Microbiology and Biotechnology 63: 495–509
Karhumaa, K., et al. (2006). Co-utilization of L-arabinose and D-xylose by laboratory and
industrial Saccharomyces cerevisiae strains. Microbial Cell Factories 5: 18
Kuijper, S.M. (2006). Engineering of Saccharomyces cerevisiae for the production of fuel
ethanol from xylose. Thesis. Delft University of Technology.
Leandro, M.J., et al. (2006). Two glucose/xylose transporter genes from the yeast Candida
intermedia: first molecular characterization of a yeast xylose-H+ symporter. Biochemical
Journal 395: 543–549
Liang, L., et al. (2007). Altering coenzyme specificity of Pichia stipitis xylose reductase
by the semi-rational approach CASTing. Microbial Cell Factories 6: 36
U.S. Food and Drug Administration. (2001). Partial List of Microorganisms and Microbial-
Derived Ingredients That Are Used In Foods. Retrieved April 23, 2008 from:
http://www.cfsan.fda.gov/~dms/opa-micr.html
Rani, K.S., Seenayya, G. (1999). High ethanol tolerance of new isolates of Clostridium
thermocellum strains SS21 and SS22. World Journal of Microbiology and Biotechnology
15: 173-178
Robillard, R. (2007). A Microbial Breathalyzer: Design of a colorimetric assay for the
detection and quantification of ethanol production in microbes. Major Qualifying Project.
Worcester Polytechnic Institute.
Sun, Y., Cheng, J. (2002) Hydrolysis of lignocellulosic materials for ethanol production: a
review. Bioresource Technology 83: 1–11

47
van Zyl, W.H., et al. (1999). Xylose utilisation by recombinant strains of Saccharomyces
cerevisiae on different carbon sources. Applied Microbiology and Biotechnology 52: 829-
833
Walfridsson, M., et al. (1995). Xylose-Metabolizing Saccharomyces cerevisiae Strains
Overexpressing the TKL1 and TAL1 Genes Encoding the Pentose Phosphate Pathway
Enzymes Transketolase and Transaldolase. Applied and Environmental Microbiology 61
(12): 4184–4190
Walfridsson, M., et al. (1997). Expression of different levels of enzymes from the Pichia
stipitis XYL1 and XYL2 genes in Saccharomyces cerevisiae and its effects on product
formation during xylose utilization. Applied Microbiology and Biotechnology 48: 218-224