optimizing completion techniques with data...
TRANSCRIPT

Optimizing Completion Techniques with Data Mining
Robert Balch Martha Cather
Tom Engler New Mexico Tech
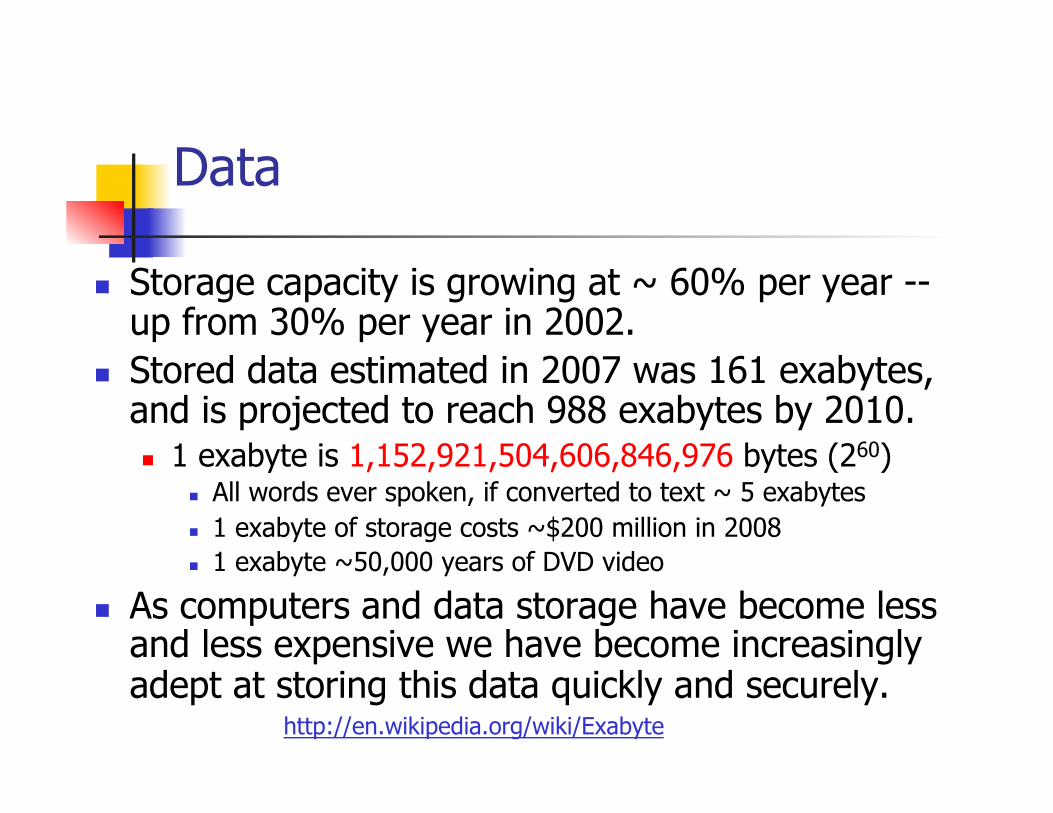
Data
Storage capacity is growing at ~ 60% per year -- up from 30% per year in 2002.
Stored data estimated in 2007 was 161 exabytes, and is projected to reach 988 exabytes by 2010. 1 exabyte is 1,152,921,504,606,846,976 bytes (260)
All words ever spoken, if converted to text ~ 5 exabytes 1 exabyte of storage costs ~$200 million in 2008 1 exabyte ~50,000 years of DVD video
As computers and data storage have become less and less expensive we have become increasingly adept at storing this data quickly and securely.
http://en.wikipedia.org/wiki/Exabyte
Data
We have become even more adept at increasing the rate of data generation.
Increased resolution, sampling rates, backups, and digitization all contribute.
Analyzing the sheer volumes of data that can exist about a subject is a daunting task that requires automation.

Data Mining
The extraction of hidden predictive information from large amount of Data using a variety of statistical algorithms and methods.
The goal of data mining is two-fold: Find useful (possibly unexpected) results Create models that allow prediction of
future trends
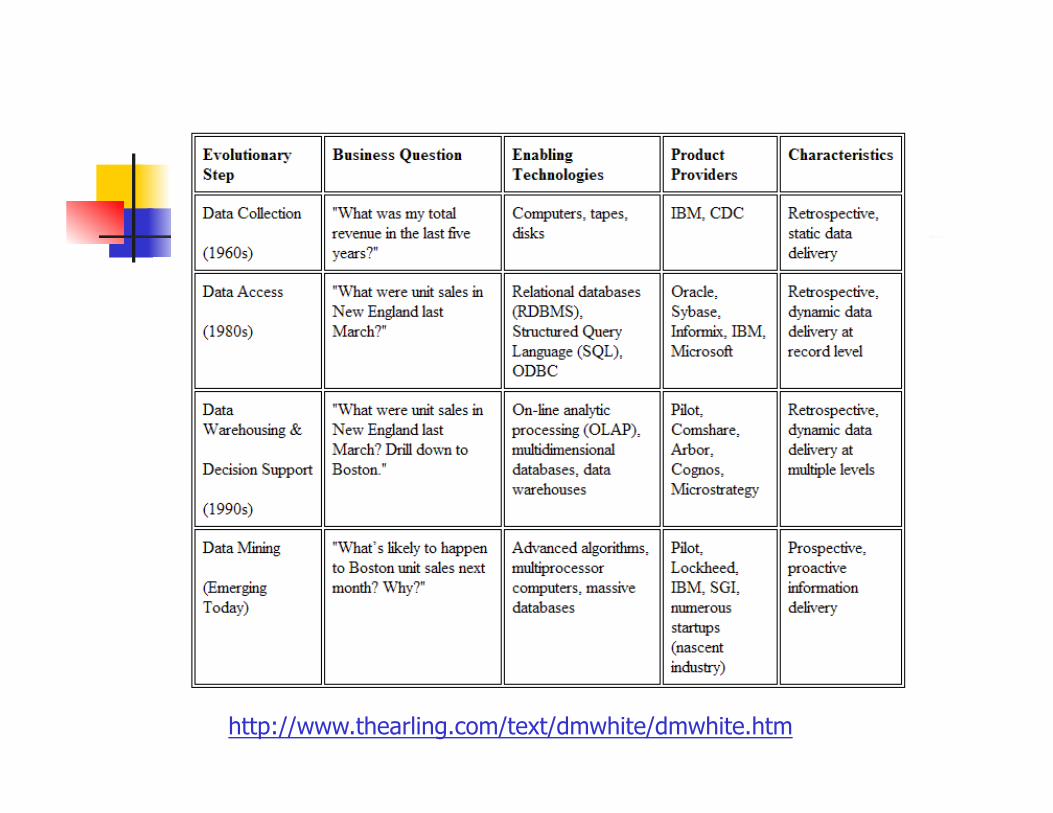
Evolution of Data Mining
http://www.thearling.com/text/dmwhite/dmwhite.htm

Data Mining Examples
Beer and Diapers Walmart, Budweiser, etc. Merck-Medco data mined its terabyte-
sized data warehouse of prescription drug orders. The mining project uncovered hidden links
between illnesses and known drug treatments, and spotted trends that helped pinpoint most effective treatments.
Consumer costs were reduced by 10–15%
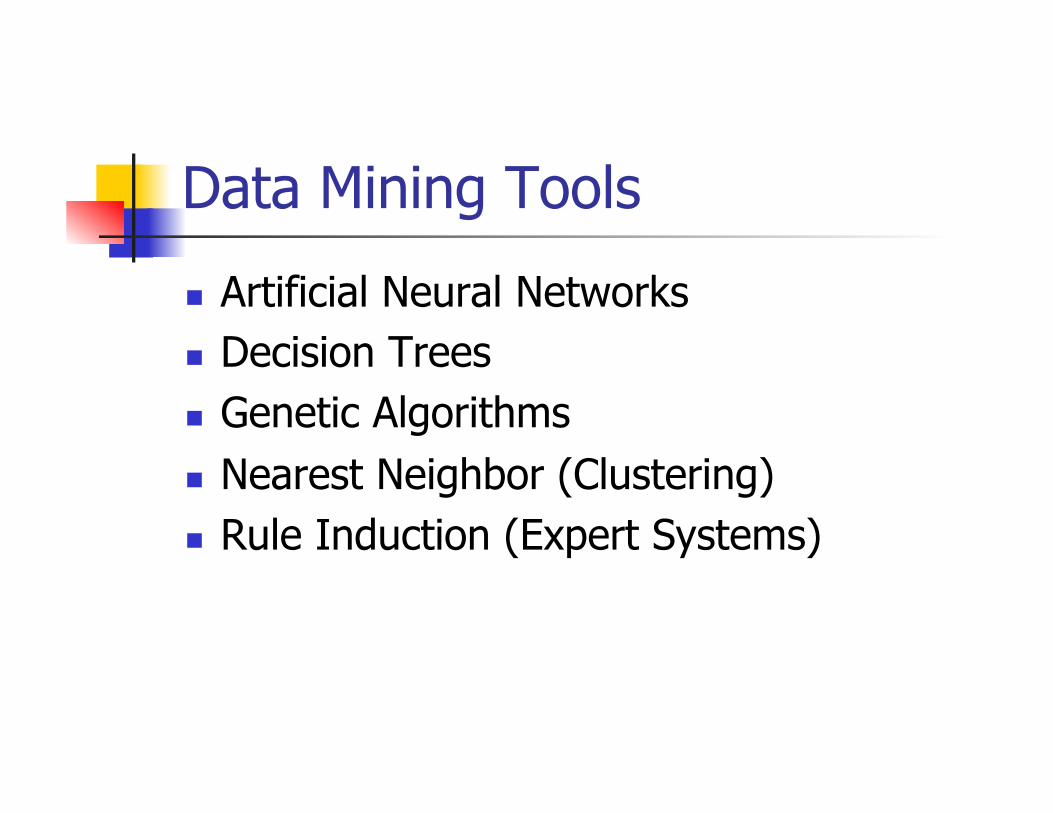
Data Mining Tools
Artificial Neural Networks Decision Trees Genetic Algorithms Nearest Neighbor (Clustering) Rule Induction (Expert Systems)

Data Mining Tools
Some free software: WEKA http://www.cs.waikato.ac.nz/
ml/weka/
TANAGRA http://eric.univlyon2.fr/~ricco/tanagra/en/tanagra.html
Some pay software: Salford Systems http://
www.salford-systems.com/landing.php
SAS http://www.sas.com/technologies/analytics/

Clean Data
Data mining thrives on accurate, tabular or relational data.
Preparation of data includes: Acquisition Cleaning (removal of outliers and other anomalous
data) Accounting for missing data Digitization Accounting for non-parametric data
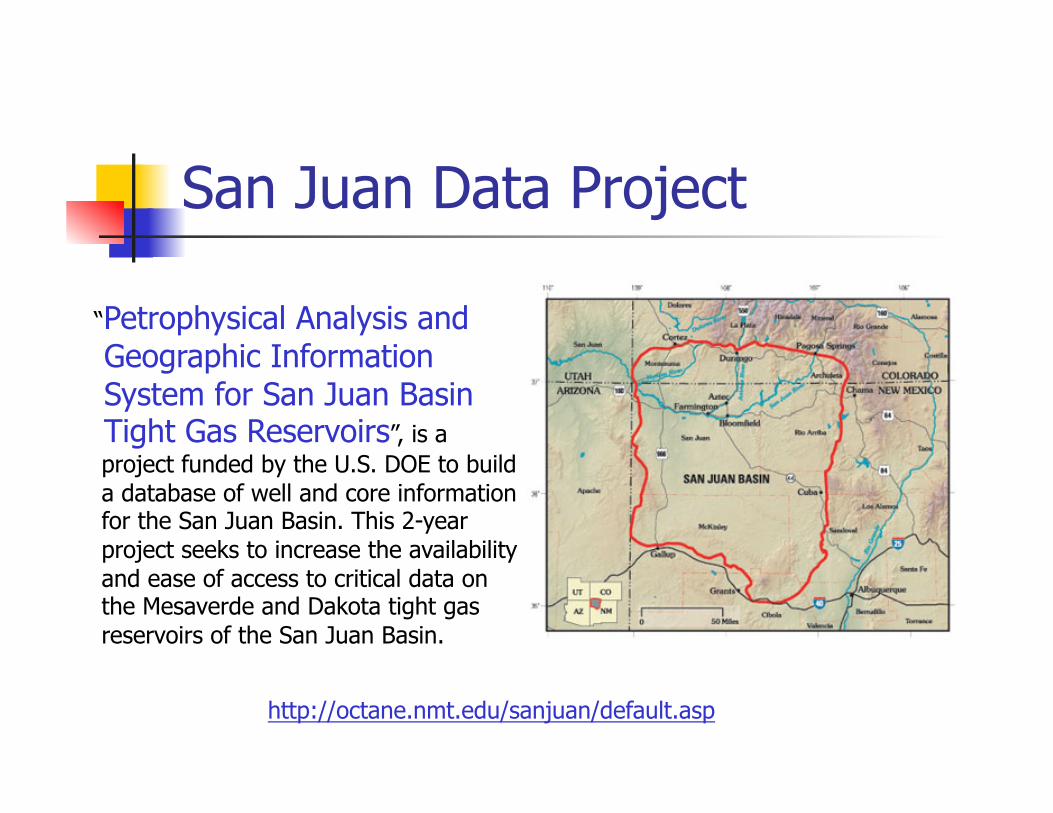
San Juan Data Project
http://octane.nmt.edu/sanjuan/default.asp
“Petrophysical Analysis and Geographic Information System for San Juan Basin Tight Gas Reservoirs”, is a project funded by the U.S. DOE to build a database of well and core information for the San Juan Basin. This 2-year project seeks to increase the availability and ease of access to critical data on the Mesaverde and Dakota tight gas reservoirs of the San Juan Basin.
San Juan Data Project
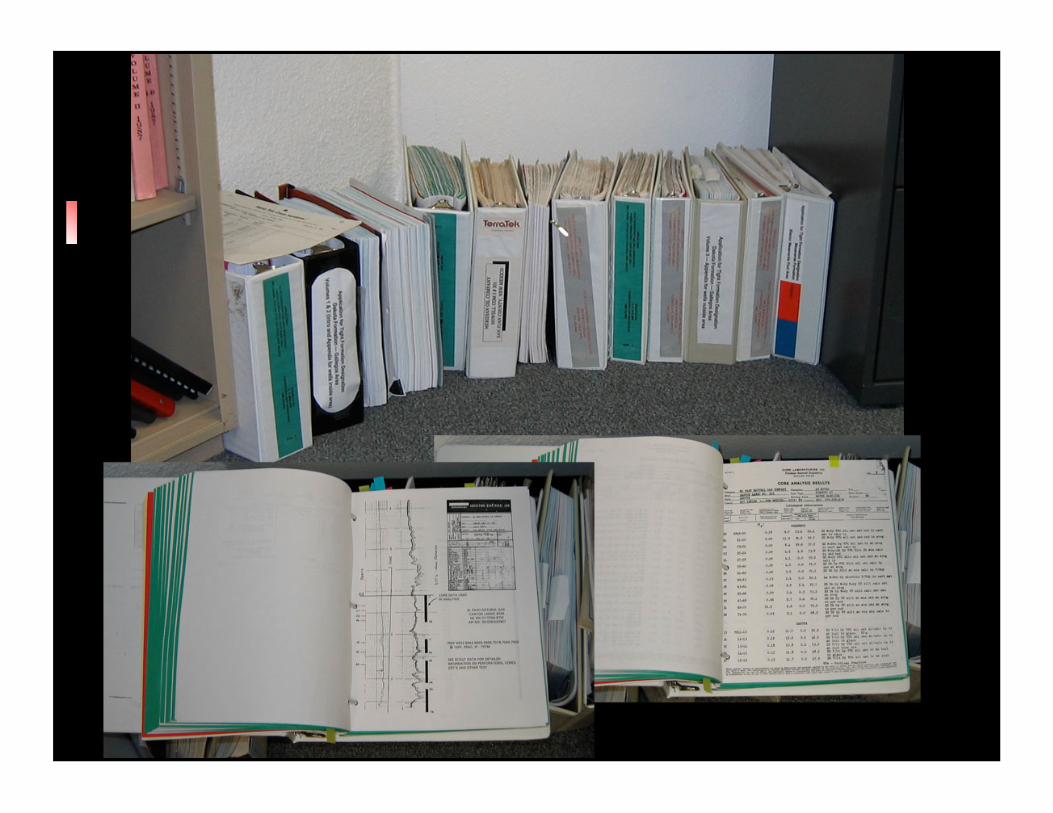
While compiling and cleaning data for the project we struck on the idea of using data mining to examine the relative effectiveness of completion techniques.

San Juan Data Project
While compiling and cleaning data for the project we struck on the idea of using data mining to examine the relative effectiveness of completion techniques.

Data Mining: San Juan Basin
With ~29000 (2003) active gas wells in the San Juan Basin, each with logs, scout cards, completion data, and Production histories the San Juan basin is data rich.
Such an immense amount of data would be impossible to examine as a whole by individuals, yet…
Is it possible that embedded information in this immense dataset can lead to more efficient and effective completion practices?
Data Mining: Dakota
The Dakota is an ideal candidate for application of data mining techniques.
There are a large number of existing wells and data about those wells. Ample sources of clean data. drilling activity is continuing.
This allows measurable economic advantages if improved completion practices are realized by the study.

Pilot Study:
To establish a proof of concept we have performed a pilot study on just Dakota wells drilled during the time period 1994-2004. Predictive models were also tested using wells
drilled between 2004-2006.
Data Sources: San Juan Data Project IHS CD’s ONGARD

Two phases: Data cleaning, database preparation
preliminary Analysis: Wadhah Al-Tailji: M.S. Petroleum Engineering
ANALYSIS OF WELL COMPLETION DATA WITH DATA MINING TECHNIQUES FOR THE DAKOTA FORMATION, SAN JUAN BASIN, NEW MEXICO, December 2006.
Data Mining Results: Ajay Kumar Iduri: M.S. Computer Science.
ANALYSIS OF WELL COMPLETION DATA TO PREDICT FIRST YEAR GAS PRODUCTION FOR THE DAKOTA FORMATION, SAN JUAN BASIN, NEW MEXICO, August 2007.
Database
Detectable Outliers were removed. Two data sets were generated
Training Data: 370 non-commingled wells drilled between 1994-2004.
Testing Data: 58 wells drilled between 2004-2006

Geographical Attributes
Company Name Completion Date Latitude & Longitude Dakota Top

Non Geographical Attributes Fracture parameters
Fracture Stages Fracture Net Thickness Fracture Gross
Thickness Fracture Fluid Type
Sand Attributes Sand Lbs Sand Type Sand Size Sand Additive
Acid Parameters Acid Gallons Acid Concentration Acid Type
Target Variable First Year Gas
Production (FYG)

Part I: Geographic analysis
First we wanted to determine of there exist differences between companies in individual well success.

Are some companies more Successful than others?
Dataset was split into two sets Companies which occurred more than 10
times in the Dataset Companies which occurred less than 10
times in the Dataset Companies which occurred only once were
removed from Dataset for this analysis.
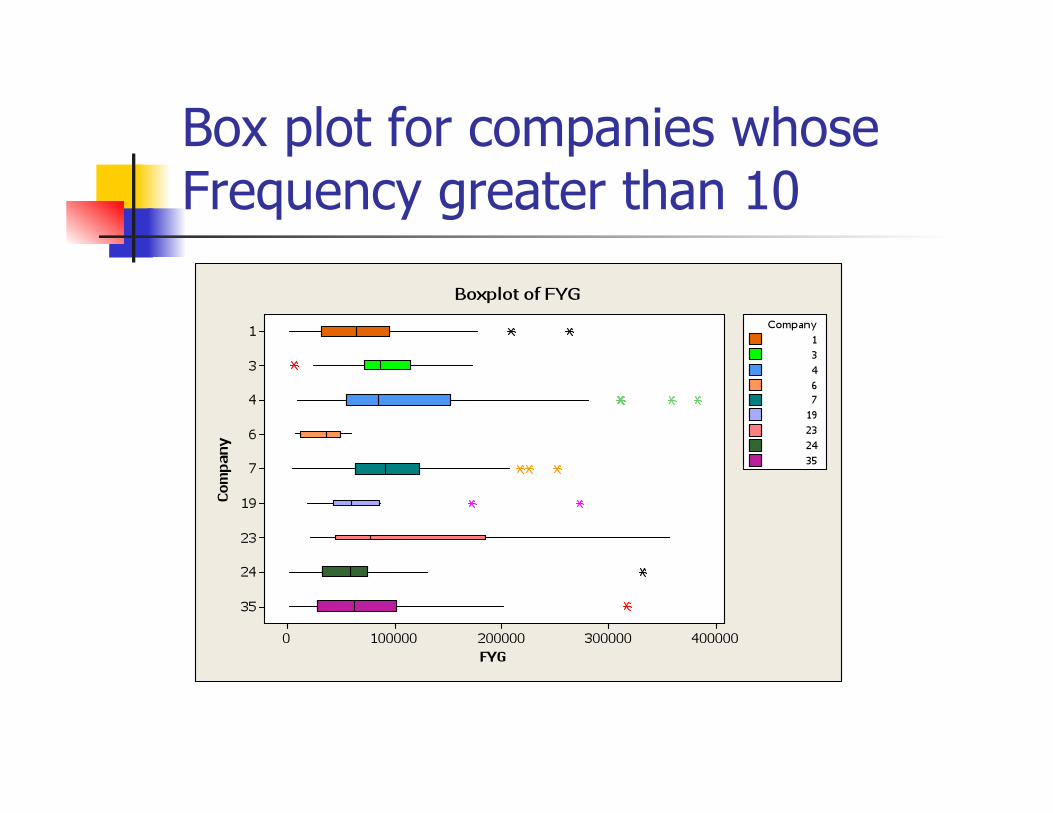
Box plot for companies whose Frequency greater than 10

Box plot for companies whose Frequency less than 10
Statistical Significance
A 2 sample T-Test was performed with a Null Hypothesis that each company FYG would be the same as the Average FYG of all Companies
We found that 6 of 8 companies with > 10 wells were statistically different from the null hypothesis
Part I: Summary An efficient model for predicting FYG could not be
built using geographical parameters alone. Unable to cluster FYG based on company criteria and well
location
The Statistical difference in FYG between the companies indicate that additional factors are involved in generating optimal production
Further mining was necessary to find the best parameters for predicting FYG. Assumption: Completion practices is an untested difference
between companies.
Part II: Data Mining Completion Information
Use Hypothesis-testing approach of data mining to: Confirm currently known trends
(Engineering Knowledge) Allow Predictive analysis of alternate
completion designs
Use Hypothesis-generating approach to discover interesting relationships and patterns in the data.

Software/Tools used
WEKA Fuzzy Rank (PRRC) Predict Online (PRRC) CART (Classification and Regression
Tree) MATLAB Minitab
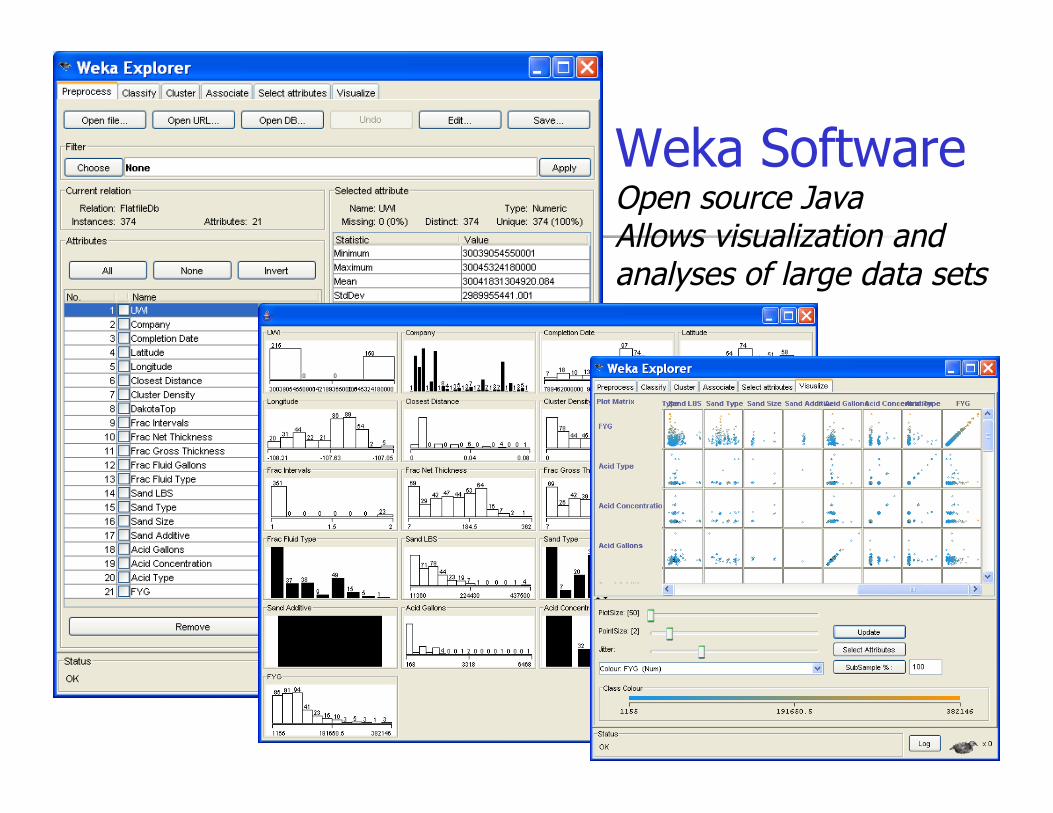
Weka Software Open source Java Allows visualization and analyses of large data sets
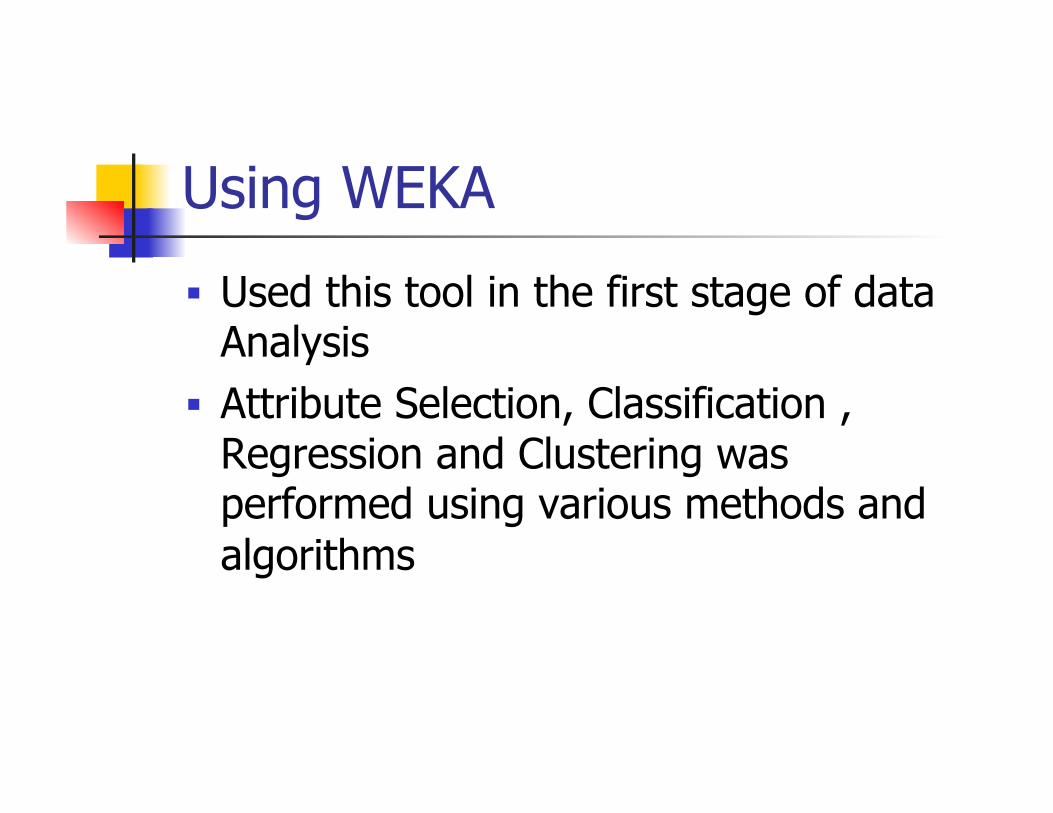
Using WEKA
Used this tool in the first stage of data Analysis
Attribute Selection, Classification , Regression and Clustering was performed using various methods and algorithms
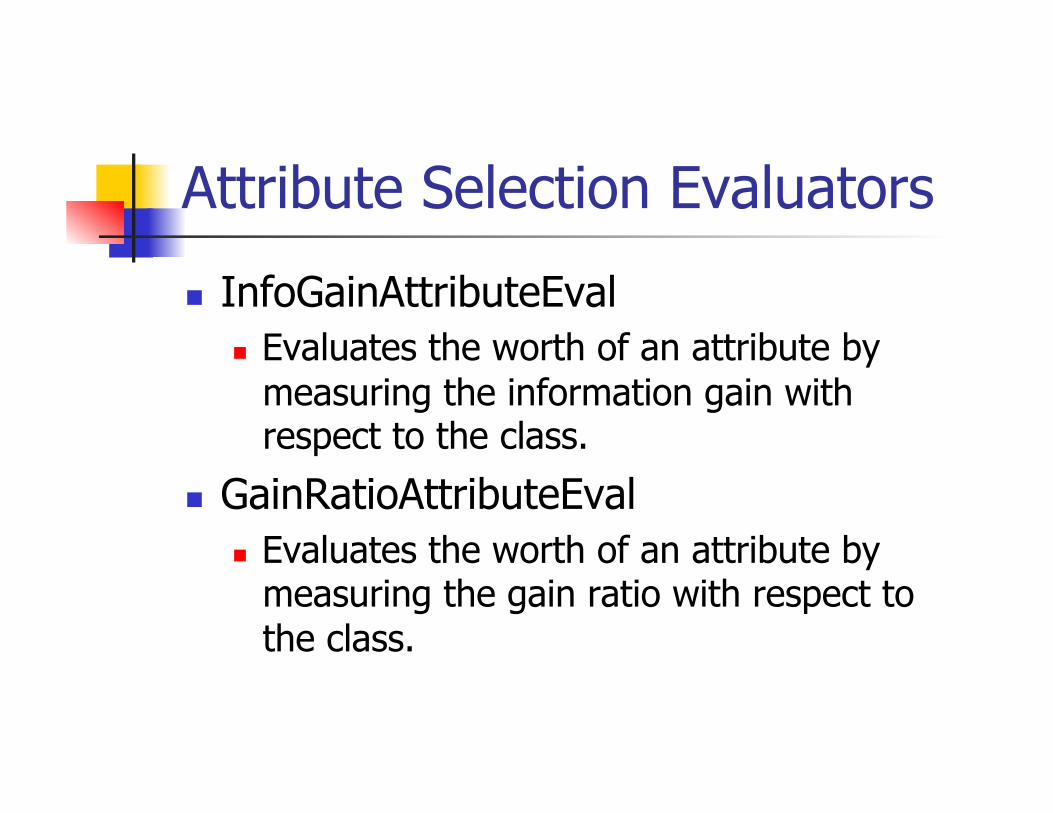
Attribute Selection Evaluators
InfoGainAttributeEval Evaluates the worth of an attribute by
measuring the information gain with respect to the class.
GainRatioAttributeEval Evaluates the worth of an attribute by
measuring the gain ratio with respect to the class.
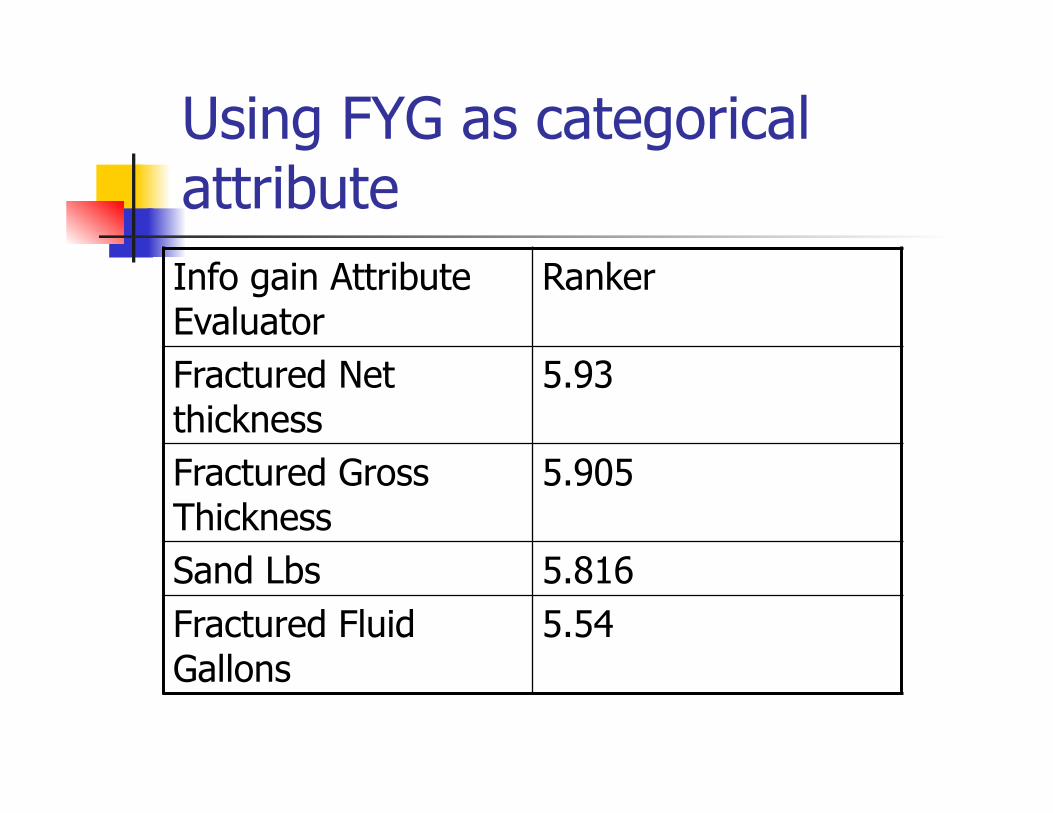
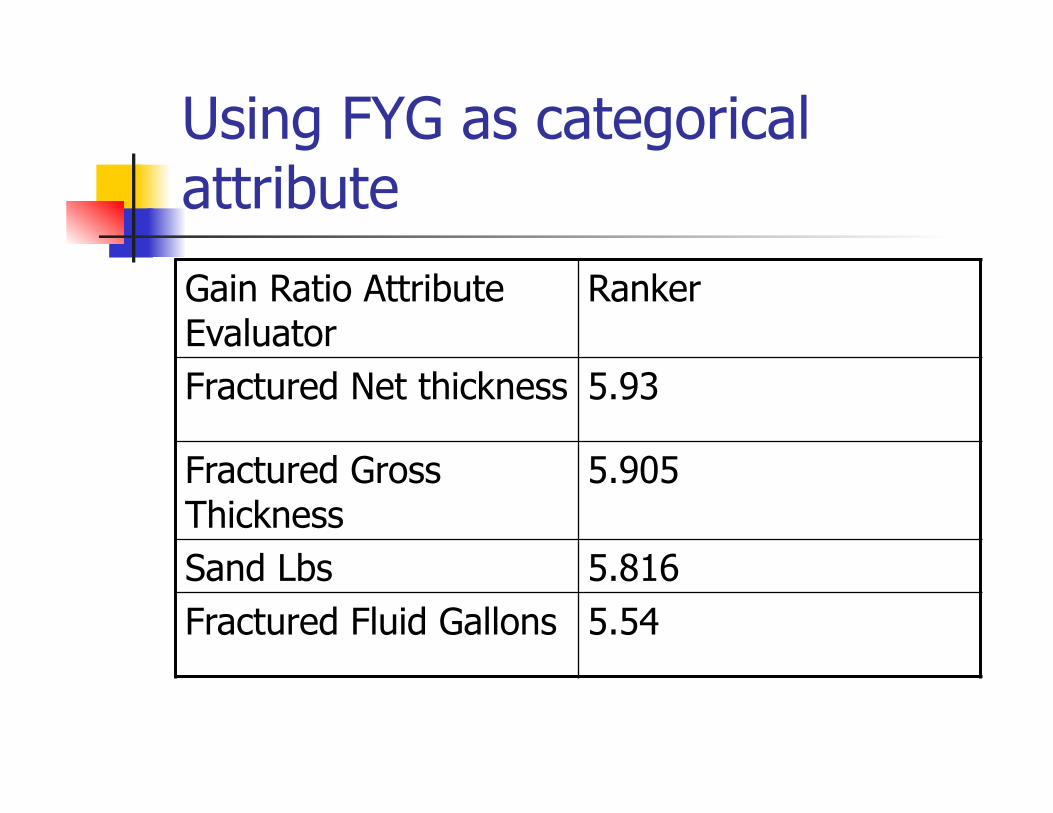
Using FYG as categorical attribute Info gain Attribute Evaluator
Ranker
Fractured Net thickness
5.93
Fractured Gross Thickness
5.905
Sand Lbs 5.816 Fractured Fluid Gallons
5.54
Using FYG as categorical attribute
Gain Ratio Attribute Evaluator
Ranker
Fractured Net thickness 5.93
Fractured Gross Thickness
5.905
Sand Lbs 5.816 Fractured Fluid Gallons 5.54

Chi-squared Attribute Evaluator
Evaluates the worth of an attribute by computing the value of the chi-squared statistic (a measure of “closeness”) with respect to the class.
The Important attributes found were Fractured Fluid Gallons Fractured Gross Thickness Fractured Fluid Type Sand Lbs Acid Gallons
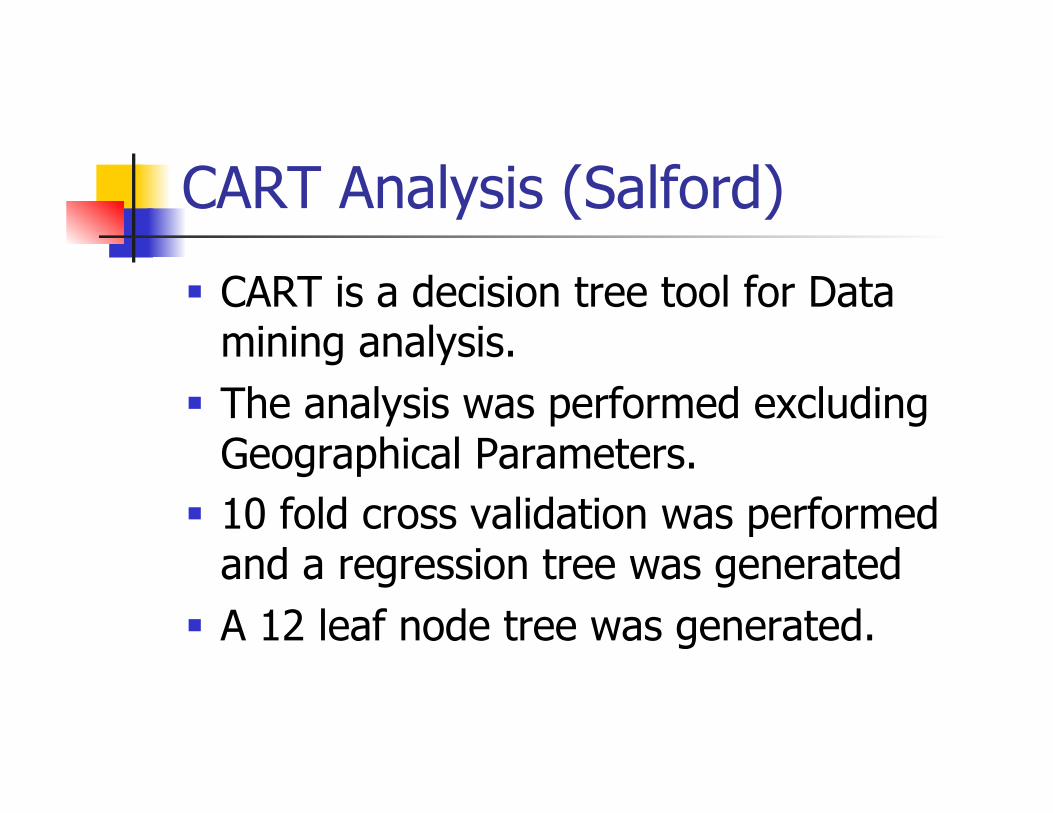
CART Analysis (Salford)
CART is a decision tree tool for Data mining analysis.
The analysis was performed excluding Geographical Parameters.
10 fold cross validation was performed and a regression tree was generated
A 12 leaf node tree was generated.
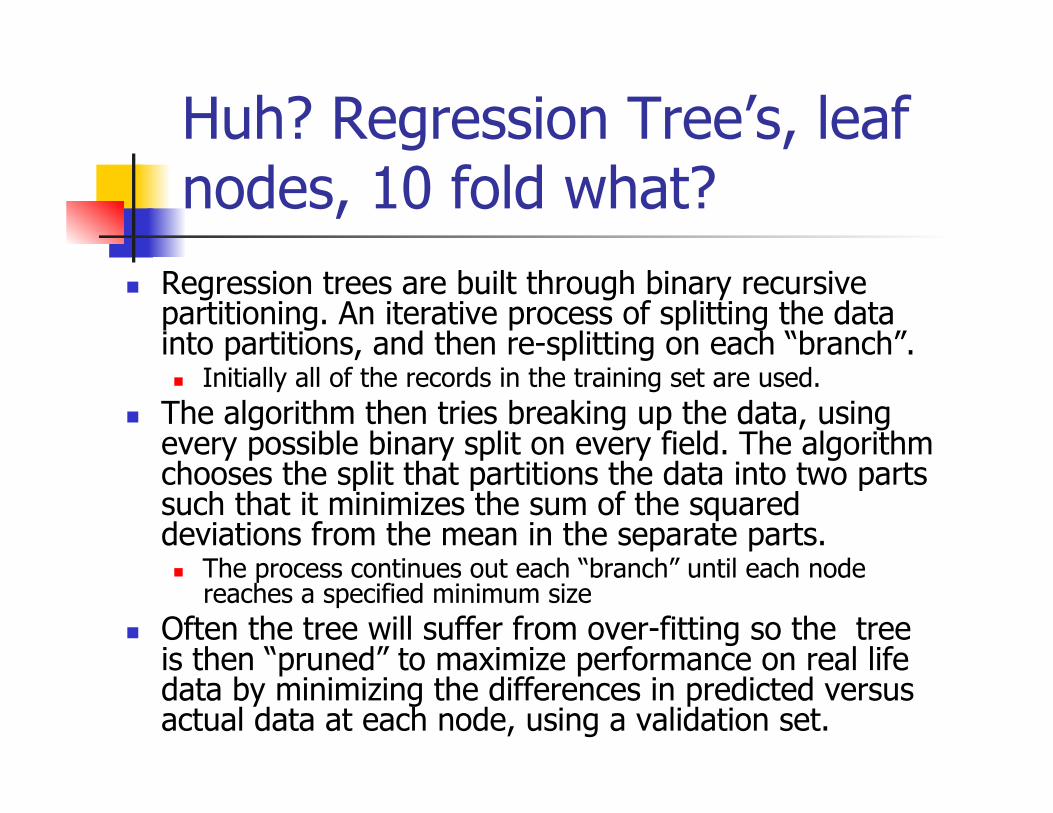
Huh? Regression Tree’s, leaf nodes, 10 fold what?
Regression trees are built through binary recursive partitioning. An iterative process of splitting the data into partitions, and then re-splitting on each “branch”. Initially all of the records in the training set are used.
The algorithm then tries breaking up the data, using every possible binary split on every field. The algorithm chooses the split that partitions the data into two parts such that it minimizes the sum of the squared deviations from the mean in the separate parts. The process continues out each “branch” until each node
reaches a specified minimum size Often the tree will suffer from over-fitting so the tree
is then “pruned” to maximize performance on real life data by minimizing the differences in predicted versus actual data at each node, using a validation set.

Tree Structure

Variable Importance

Primary Splitters
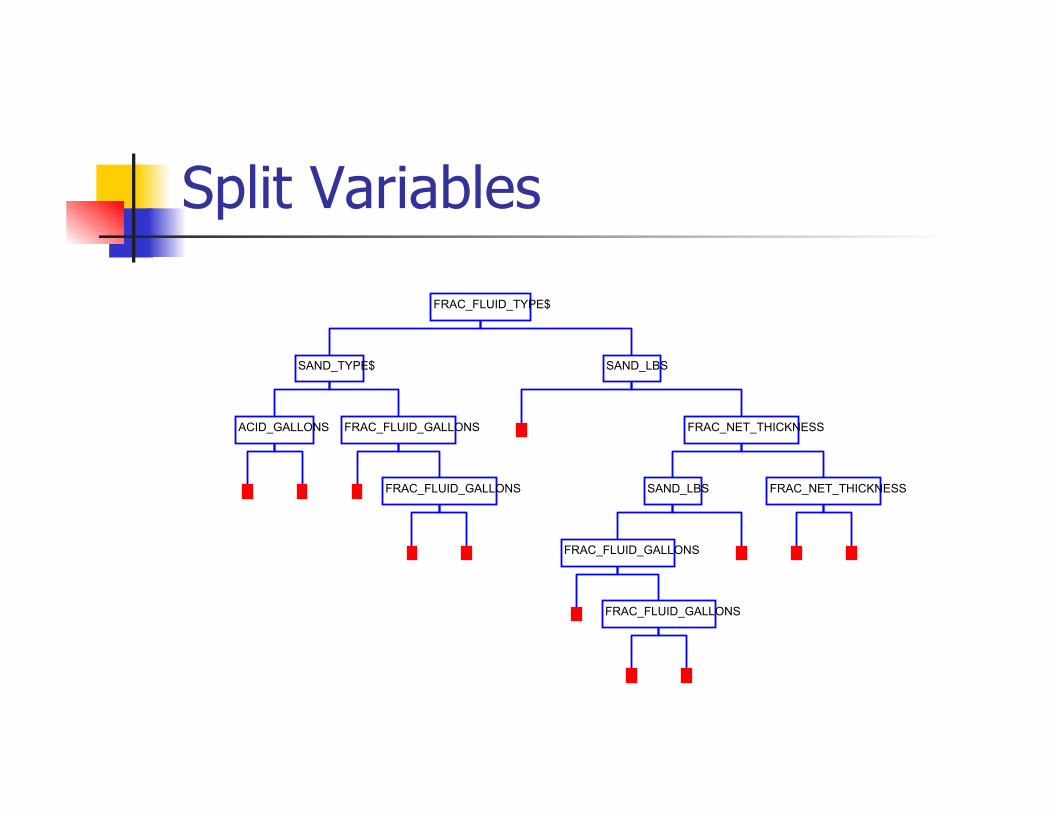
Split Variables
ACID_GALLONS
FRAC_FLUID_GALLONS
FRAC_FLUID_GALLONS
SAND_TYPE$
FRAC_FLUID_GALLONS
FRAC_FLUID_GALLONS
SAND_LBS FRAC_NET_THICKNESS
FRAC_NET_THICKNESS
SAND_LBS
FRAC_FLUID_TYPE$

RMS Error with Reduced Attributes
Part II: Summary
A decision tree could be built with CART that has a RMS error of 0.12 (perfect RMS error would be 0.0). CART is proprietary software so a predictive model
using it alone is not shareable.
The most important parameters for predicting FYG were identified and also matched those found with the Weka Attribute Selector. Neural Networks are a common predictive tool for
data mining projects.

Part III: Predictive Models
• Neural networks are essentially complex multivariate non-linear regression equations
• A robustly trained neural network can make predictions given new input data appropriate for its domain.
This approach was taken to find whether FYG can be predicted using the numeric attributes selected by the data mining algorithms.

Using Predict Online
Inputs Fracture Net Thickness Fracture Fluid Gallons Sand Lbs
Output FYG
http://ford.nmt.edu/

ANN Architecture
Best Architecture Found was 3-5-6-6-1 a non-linear equation with 87 coefficients
R2 (Average) R (Average) 0.87(Training) 0.93(Training) 0.72(Testing) 0.84(Testing)
http://ford.nmt.edu/
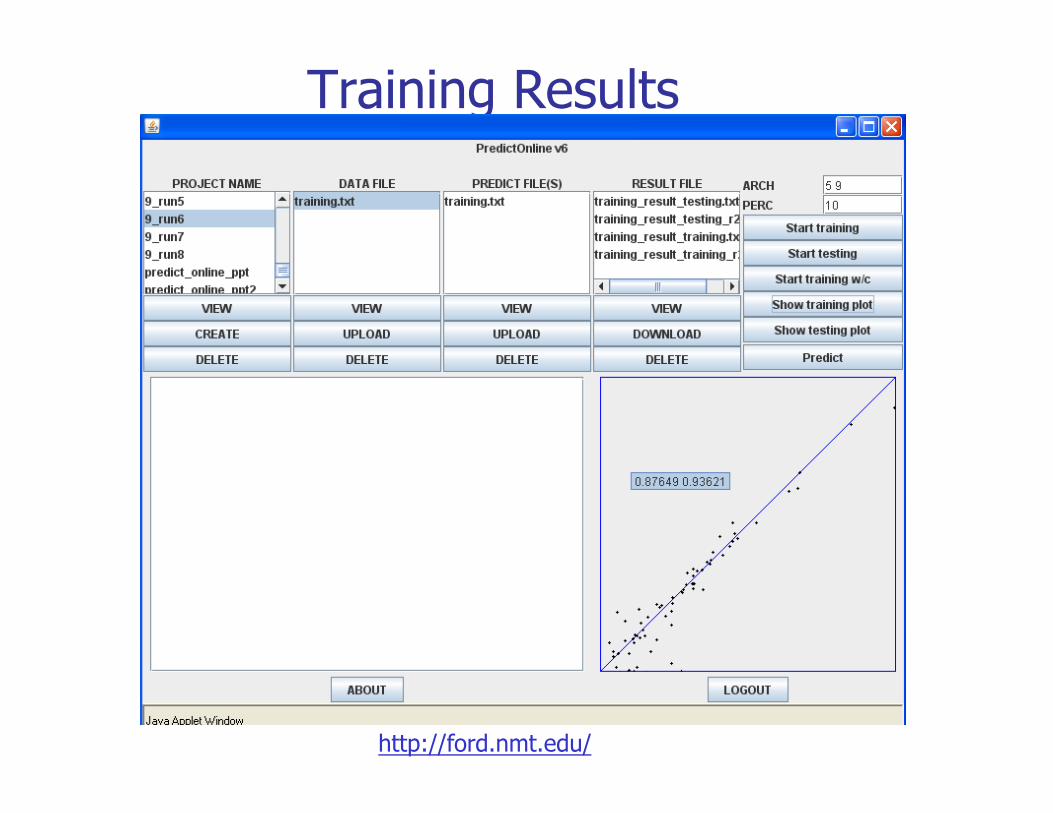
Training Results
http://ford.nmt.edu/

Predicted Data Results
The R2 value on the new data was 0.76 and R value was 0.87.
The network is able to fluctuate between the maximum and minimum values of FYG which indicats a robust solution.
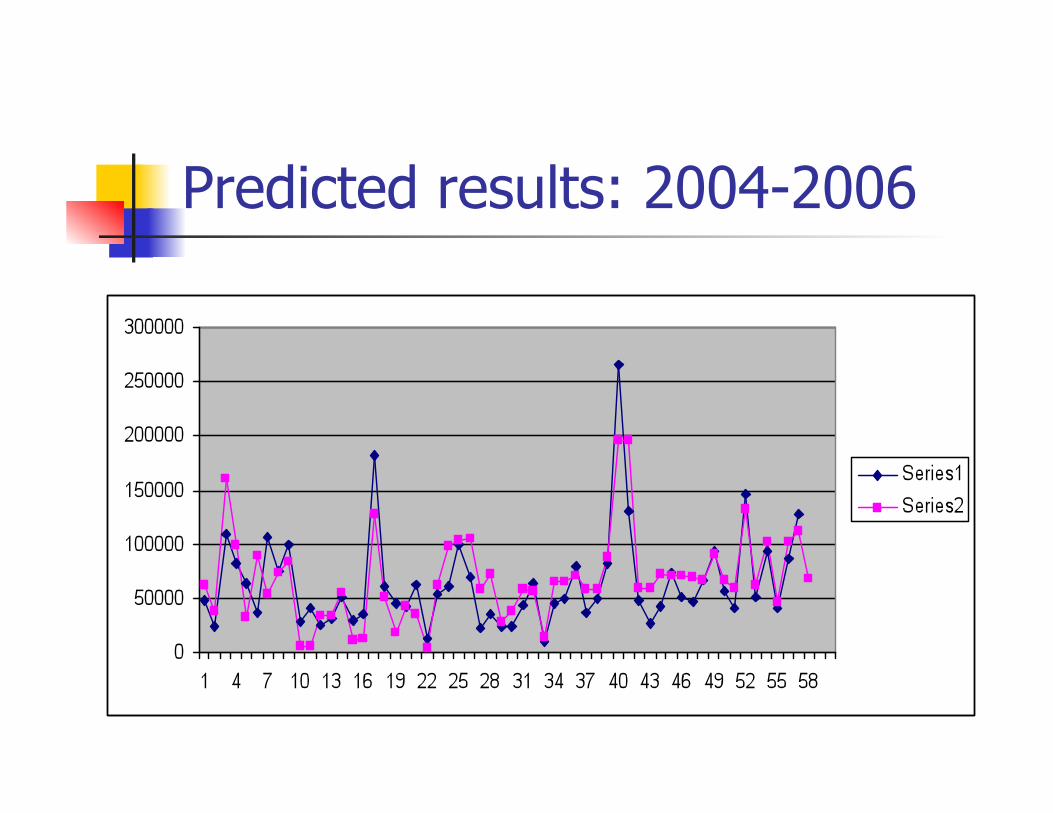
Predicted results: 2004-2006
Part III: summary
A robust predictive model was built using a Scaled conjugate gradient algorithm to train a Feed-forward back propagation neural network.
We were then able to look at those variables more closely to determine if there is an optimal completion process using those three factors.
Part IV: Preliminary Statistical observations
This analysis was performed to make observations about the relationships between the non-parametic Frac Fluid Type attribute and numeric attributes Sand Lbs & Frac Fluid Gallons.
Also examined were trends in Frac fluid Type throughout the study period.
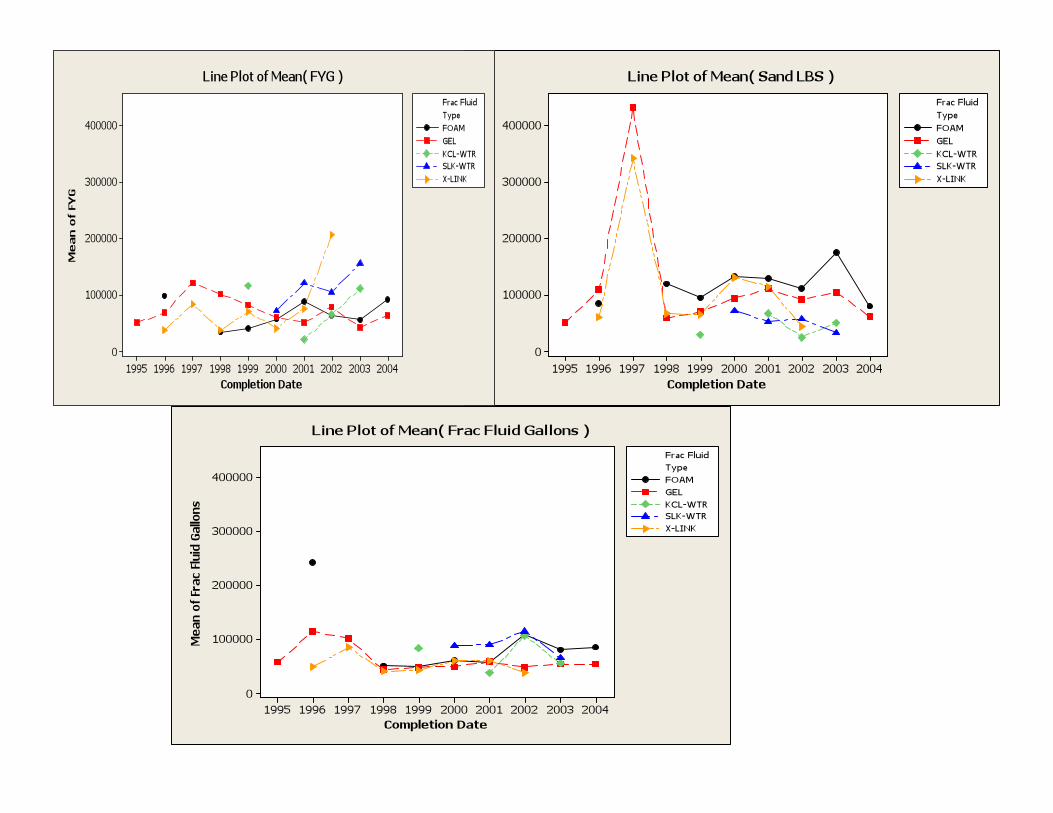
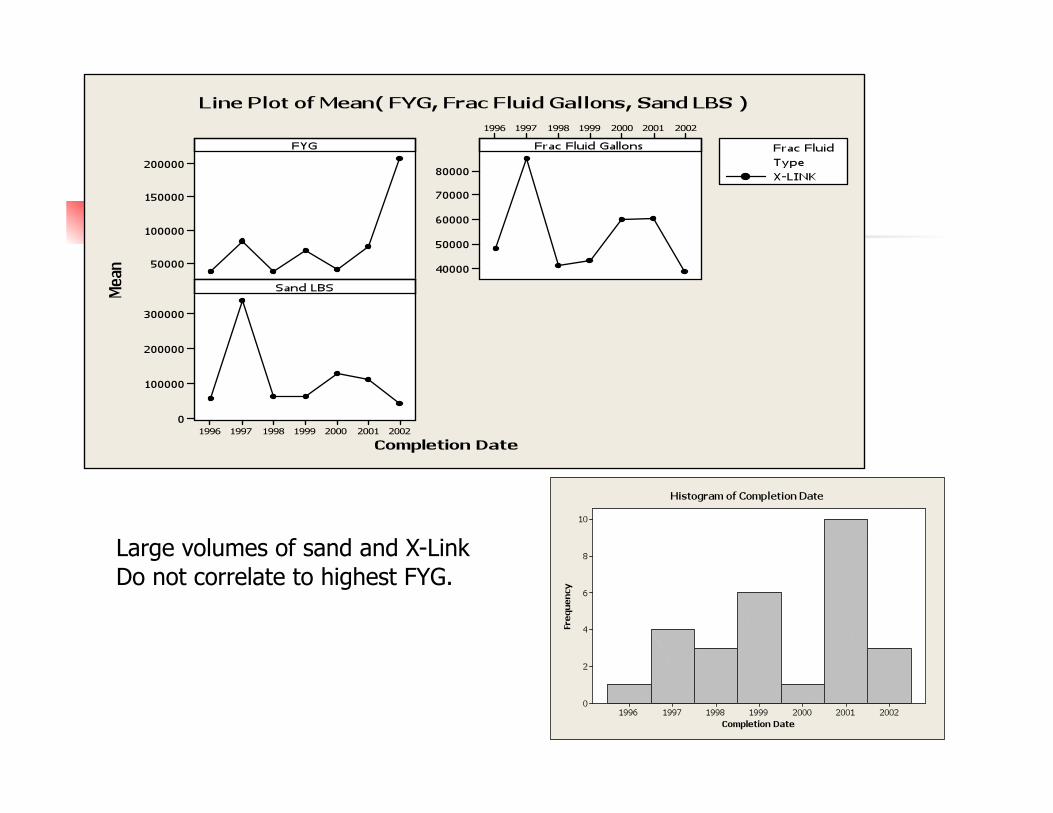
Large volumes of sand and X-Link Do not correlate to highest FYG.
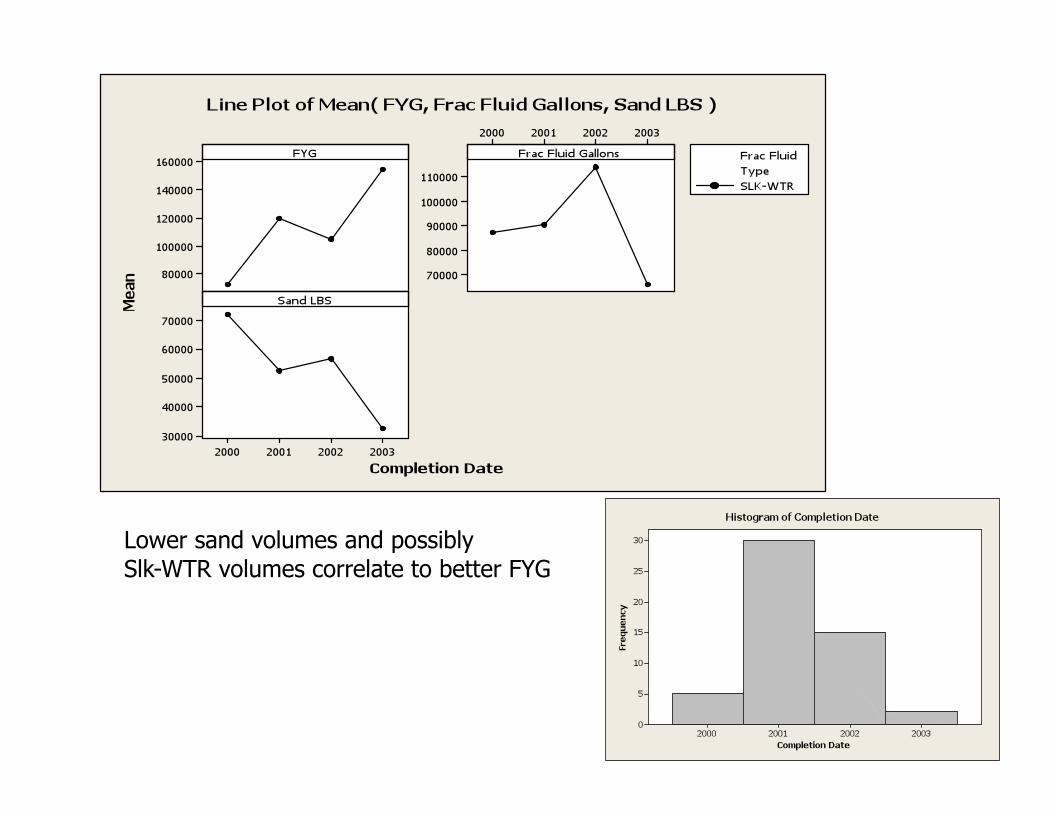
Lower sand volumes and possibly Slk-WTR volumes correlate to better FYG

Best FYG observed with high Gel volumes. Highest FYG continued with decreased sand volumes

Sand volume appears to improve FYG


Conclusions We were able to successfully determine primary
factors in completions that govern the FYG We were able to build a ANN model to predict future
Data. IE how well will a well perform using a certain set of
completion techniques. We were able to build a robust decision tree using
CART with a minimal RMS error which allows the use of non-parametric information such as Fracture Fluid type.
Trends between Fracture Fluid type and Sand Lbs and Frac Gallons give some indications of potentially useful data for future completions.
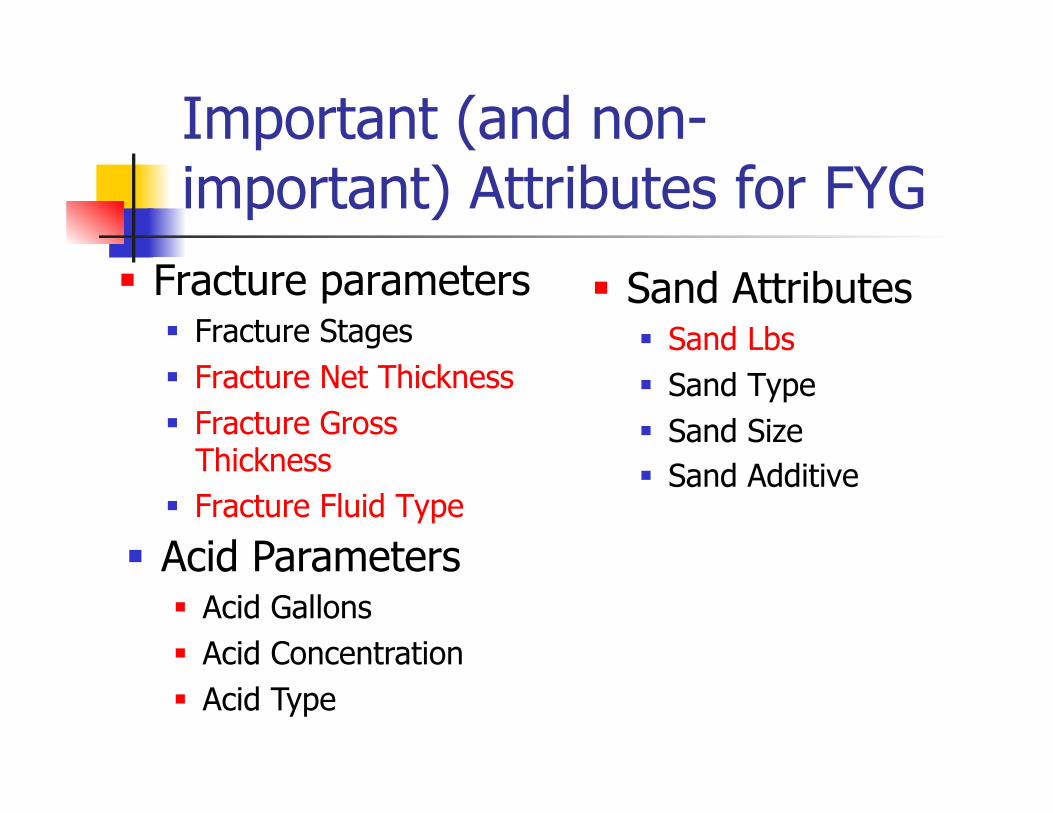
Important (and non-important) Attributes for FYG
Fracture parameters Fracture Stages Fracture Net Thickness Fracture Gross
Thickness Fracture Fluid Type
Sand Attributes Sand Lbs Sand Type Sand Size Sand Additive
Acid Parameters Acid Gallons Acid Concentration Acid Type