optimized waste heat utilization in the steel industry
TRANSCRIPT

12. Internationale Energiewirtschaftstagung an der TU Wien IEWT 2021
Seite 1 von 17
Optimized waste heat utilization in the steel industry with industrial heat pumps and low-temperature
distribution system
Anton Beck(1), Julian Unterluggauer(1), Sophie Knöttner1(1), Carlos Gonzales Niño(2), Julio Guillen Angel(2), Maria Lopez Arias(2)
Irene Solis(3)
(1) Austrian Institute of Technology GmbH, Giefinggasse 4, 1210 Vienna, Austria
(2) CIRCE, Parque Empresarial Dinamiza, Avenida Ranillas Edificio 3D, 1ª Planta. 50018, Zaragoza, Spain
(3) ArcelorMittal Global R&D Asturias, P.O. Box 90, Aviles 33400, Spain
Abstract:
Requirements regarding reduction of emissions, energy efficiency and flexibility are increasing
and force the implementation of corresponding measures in the industry. In this work,
opportunities for the substitution of mostly natural gas fired steam supply in steel processing
industry are analyzed. Heat recovery from flue gas and other waste heat sources is evaluated
using a systematic approach including pinch analysis and mathematical optimization.
A basic analysis is carried out for four individual facilities which shows potentials for direct heat
recovery and heat pump integration. The analysis further shows that the remaining surplus of
waste heat from one of the facilities could be transferred to the other facilities. A mathematical
design optimization model including optimal heat-exchanger network synthesis, heat pump
integration and the implementation of a steam driven low temperature distribution system is
used to identify economically feasible efficiency measures. Possible future development of
costs for energy and industrial heat pumps were considered through three different scenarios
with parameter variations as input for the following optimization.
The results show that using direct heat recovery alone 20-80% of the steam output can be
substituted. This potential can be further increased using industrial heat pumps to 30-100%
and with an inter-plant low temperature distribution system to 100%. Depending on the
technical configuration of the system and forecast for energy and equipment costs, payback
times between 1 to 4 years could be realized.
Keywords: Mathematical Programming, Steel making sector, Low Temperature Distribution
System, Heat Pump Integration
Introduction
Besides renewable energy generation and reduction of greenhouse gas emissions, efficiency
enhancement of industrial processes is one of the most important pillars of a strategy against
1 Young author

12. Internationale Energiewirtschaftstagung an der TU Wien IEWT 2021
Seite 2 von 17
global warming and a sustainable energy policy. Especially, the iron & steel industry bears a
huge potential with approximately 3.4 Gt CO2 emitted in the year 2019 [1] which accounts for
around 7% of global CO2 emissions [2]. The value is expected to rise further as the global
demand for steel is forecasted to increase until 2050 by approximately 50 % (1.7 billion tons
in 2018 to 2.6 billion tons in 2050) [3].
According to Wilk et al. [5], steam production accounts for up to 16 % of the final energy
demand In the Austrian steel industry whereas Statistik Austria claims that in Austria process
heat below 200°C accounts only for 1 % of the final energy consumption Fehler!
Verweisquelle konnte nicht gefunden werden.. Steam in steel processing is used for heat
distribution and in the steelmaking process itself and is in many cases generated burning
natural gas. Heat recovery (HR) studies in the steel industry showing varying potentials but
they show that besides direct heat recovery (DHR) measures electrification and thereby
especially the utilization of industrial heat pumps (HPs) can play an important role on the path
to decarbonization [7][8][9].
Typical methods for the identification of these potentials are pinch-based total site analysis and
mathematical programming approaches such as superstructure-based heat exchanger
network synthesis (HENS) as highlighted by Klemeš and Kravanja [14] with additions for the
integration of HPs [15] and distribution systems [16]. With the concept of the grand composite
curve Pinch Analysis can be used to identify feasible integration points for heat pumps from a
thermodynamic viewpoint [15]. Pinch Analysis also yields important insights for total site
integration and thus for inter-facility heat transfer. Depending on the imbalance between heat
demands and available excess heat within the individual facilities inter-facility distribution
systems can increase the overall energy efficiency of the industrial site substantially [17].
In the following chapters, the workflow applied in this work for identification of economically
viable HR measures is described, models for HPs and heat distribution systems used within a
mathematical programming formulation are presented and results for a specific use case from
the steel making industry are presented.
Methodology
Figure 1 shows the essential steps taken for the optimization of the plant heat recovery
network.
Figure 1: Flow chart of proposed methodology
At first, a basic Pinch Analysis was performed as it is an efficient and proven method to identify
HR potentials and thermodynamic bottlenecks in industrial processes [10]. The first and the
most important step is to identify actual process requirements for heating and cooling which
need to be fulfilled though connections with external utilities or by HR. These requirements are
called process streams and are specified through inlet and outlet temperatures, mass flows
and specific heat capacity or heat duties. Each process stream is classified either as a hot
stream or a cold stream which defines whether energy must be removed or supplied. The
Data collection / Stream table
Composite curves
Potentials for heat pumps and
distribution system
Elaboration of cost parameters
Cost-optimization of
inter-facility heat recovery

12. Internationale Energiewirtschaftstagung an der TU Wien IEWT 2021
Seite 3 von 17
overall goal is to match appropriate hot and cold streams to maximize HR. Often, there is a
gap between current and ideal energy consumption, which offers potential for a retrofit of the
heat exchanger network (HEN).
Data collection and extraction is usually difficult and time consuming. In order to reduce this
effort, information from the plant managers, estimates and calculated approximate values were
used in order to perform a rough pinch analysis. Additional information such as the feasibility
of heat transfer from excess heat sources in terms of market available HR equipment and
stream pollution, operating hours and temporal profiles were considered in the study. For the
following analysis, only HR options with high technology readiness levels were considered.
After establishing HR potentials for DHR, for HP and for low temperature distribution (LTD)
systems, a mathematical programming model was set up, that allows for simultaneous
optimization of the energy system considering these HR measures. A preliminary study on the
suitability of thermal oil, pressurized hot water and low-pressure steam was carried out. The
most promising alternatives were included in the optimization model and the selection of the
optimal system was subject to optimization. The optimization model is based on a linearized
version [18] of the often-used MINLP HEN superstructure proposed by Yee and
Grossmann [19] with extensions for heat pump integration and the introduction of heat
distribution systems. The models used for heat recovery are presented in the following.
For heat transfer between process streams, HPs and different types of heat
exchangers (HEXs) are considered for the individual media combinations. For instance, if a
process stream is corrosive stainless-steel components are necessary. Cost data for HEXs
(carbon steel, stainless steel, graphite) are taken from a cost database (DACE price booklet)
and were expressed in the form
𝐶𝑖𝑛𝑣 = 𝐶𝐹𝑖𝑥 + 𝐶𝑉𝑎𝑟𝐴𝛽
for the considered heat exchanger (HEX) types (Figure 2).
Figure 2: Costs for different heat exchanger types (SHT means shell and tube)
The HP model used in this work is a linearized Carnot-model. In this linearized model, virtual
condenser and evaporator capacities are introduced. In contrast to e.g. the work of Prendl and

12. Internationale Energiewirtschaftstagung an der TU Wien IEWT 2021
Seite 4 von 17
Hofmann [20], the idea is to model the condenser and evaporator capacities for the individual
hot and cold process streams separately as individual virtual HPs which yields more accurate
linear approximations. For the hot process streams this means that the heat loads supplied to
the evaporator 𝑄𝑒 are modelled directly whereas on the hot side of the HP, a virtual condenser
heat load 𝑄𝑐,𝑣 is derived using a linearized Carnot HP model. Similarly, the heat loads supplied
to the cold streams from the condenser are modelled directly and the corresponding virtual
evaporator loads are calculated. Ideally, the sum of virtual evaporator heat loads and the sum
of actual evaporator heat loads should be equal. The same is true for virtual and condenser
heat loads. In general, this is not the case due to the error made by linearizing the Carnot
model. A schematic drawing of this concept is presented in Figure 3.
Figure 3: Schematic representations of (a) the nonlinear Carnot model and (b) the linearized version using virtual heat loads
The correlation between the evaporator heat loads �̇�𝑖𝑒 and the corresponding virtual condenser
heat load �̇�𝑖𝑐,𝑣 is modelled as a function of 𝑑𝑇 using the coefficients 𝑐𝑖. The term including the
slack variable 𝑠𝑖 is used to (de)activate the constraint.
𝑑𝑇 ∗ 𝑐𝑖,0,0 + �̇�𝑖𝑒 ∗ 𝑐𝑖,1,0 + 𝑧𝑖
𝑒 ∗ 𝑐𝑖,2,0 + 𝑠𝑖(𝑑𝑇𝑚𝑎𝑥 ∗ 𝑐𝑖,0,0) = �̇�𝑖𝑐,𝑣
The correlation between virtual evaporator heat loads and actual condenser heat loads is
modelled with the same concept.
𝑑𝑇 ∗ 𝑐𝑗,0,0 + �̇�𝑗𝑒,𝑣 ∗ 𝑐𝑗,1,0 + 𝑧𝑗
𝑐 ∗ 𝑐𝑗,2,0 + 𝑠𝑗(𝑑𝑇𝑚𝑎𝑥 ∗ 𝑐𝑗,0,0) = �̇�𝑗𝑐
Virtual and actual condenser heat loads are set to be equal
∑ �̇�𝑗𝑐
𝑗
= ∑ �̇�𝑖𝑐,𝑣
𝑖
whereas in contrast to the actual Carnot model, the electricity consumption 𝑃𝑒𝑙 is larger than
both the difference of actual condenser and evaporator heat loads and the difference between
actual condenser heat loads and virtual evaporator heat loads.
𝑃𝑒𝑙 ≥ ∑ �̇�𝑗𝑐
𝑗
− ∑ �̇�𝑖𝑒
𝑖
𝑃𝑒𝑙 ≥ ∑ �̇�𝑗𝑐
𝑗
− ∑ �̇�𝑗𝑒,𝑣
𝑗
The slack variables are constrained by logical constraints activating or deactivating stream
connections.
12. Internationale Energiewirtschaftstagung an der TU Wien IEWT 2021
Seite 5 von 17
𝑠𝑖 ≤ 0 𝑠𝑖 ≥ −(1 − 𝑧𝑖
𝑒) 𝑠𝑗 ≤ 0
𝑠𝑗 ≥ −(1 − 𝑧𝑗𝑐)
Insights from the Pinch Analysis are used to restrict the domain for minimum and maximum
HP temperatures, temperature lift and heat loads. Costs for the considered industrial HP’s are
divided into costs for the HEXs (condenser and evaporator) and the residual HP costs. The
residual HP costs are heat load specific and are based on a rough estimate of 300 €/kWth.
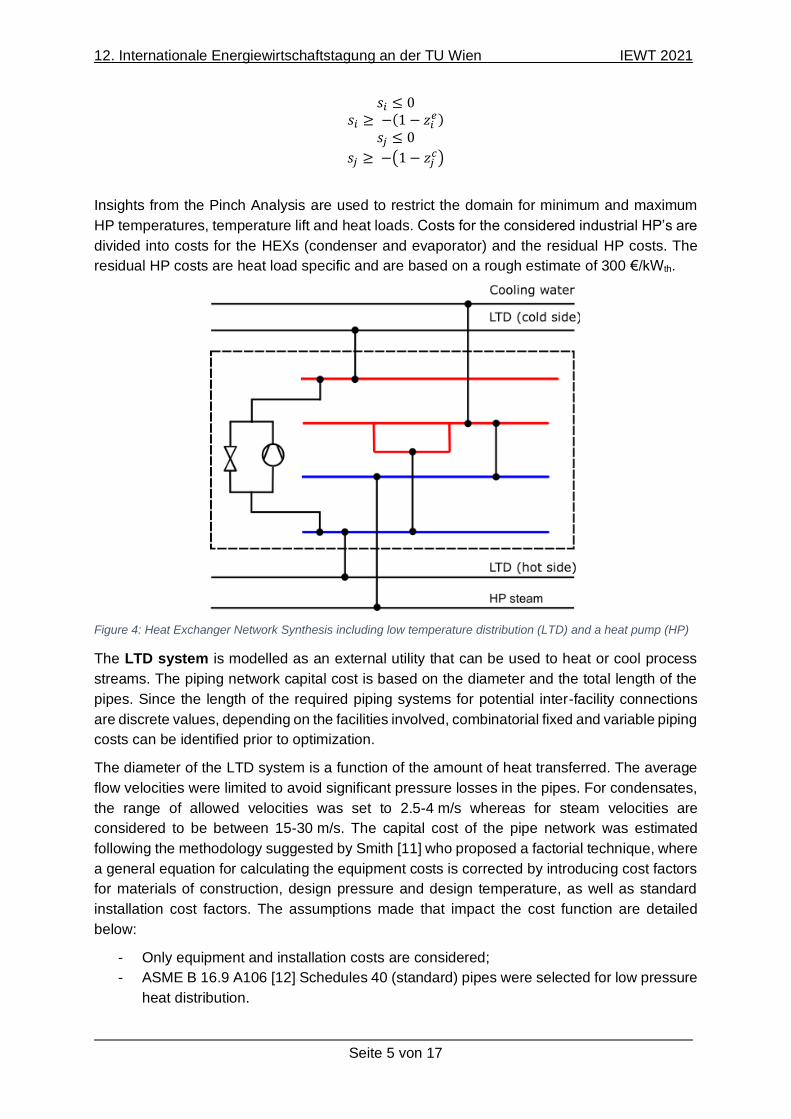
Figure 4: Heat Exchanger Network Synthesis including low temperature distribution (LTD) and a heat pump (HP)
The LTD system is modelled as an external utility that can be used to heat or cool process
streams. The piping network capital cost is based on the diameter and the total length of the
pipes. Since the length of the required piping systems for potential inter-facility connections
are discrete values, depending on the facilities involved, combinatorial fixed and variable piping
costs can be identified prior to optimization.
The diameter of the LTD system is a function of the amount of heat transferred. The average
flow velocities were limited to avoid significant pressure losses in the pipes. For condensates,
the range of allowed velocities was set to 2.5-4 m/s whereas for steam velocities are
considered to be between 15-30 m/s. The capital cost of the pipe network was estimated
following the methodology suggested by Smith [11] who proposed a factorial technique, where
a general equation for calculating the equipment costs is corrected by introducing cost factors
for materials of construction, design pressure and design temperature, as well as standard
installation cost factors. The assumptions made that impact the cost function are detailed
below:
- Only equipment and installation costs are considered;
- ASME B 16.9 A106 [12] Schedules 40 (standard) pipes were selected for low pressure
heat distribution.

12. Internationale Energiewirtschaftstagung an der TU Wien IEWT 2021
Seite 6 von 17
- The equation proposed by Ulrich and Vasudevan for complex networks was used that
considers one fitting (elbow or tee) every 3 m and one valve every 7.5 m (the
investment purchase of fittings is not considered in this study since the prices vary
widely) [13].
- Heat losses were neglected but costs of purchasing and installing for appropriate
insulation were included in the cost function.
- The inflation of the equipment prices has been measured by the CEPCI (Chemical
Engineering Plant Cost Index) since the costs given by Ulrich and Vasudevan are on
mid 2003 basis and in US$.
The cost function for the LTD piping system can be written as
𝐶𝐶𝐴𝑃,𝑃𝐼𝑃 = (𝐹𝐵𝑀 ∙ 𝐶𝑝,𝐶𝑆 + 𝐶𝐼𝑁𝑆) ∙ 𝐶𝐸𝑃𝐶𝐼 ∙ 𝑈𝑆𝐷𝑡𝑜𝐸𝑈𝑅 ∙ 𝐿
where 𝐹𝐵𝑀 is the installation factor, 𝐶𝑝,𝐶𝑆 is the piping base cost in USD/m, 𝐶𝐼𝑁𝑆 are the costs
for insulation in USD/m, 𝐶𝐸𝑃𝐶𝐼 is the Chemical Engineering Plant Cost Index, 𝑈𝑆𝐷𝑡𝑜𝐸𝑈𝑅 is
the currency conversion rate from USD to Euro and 𝐿 is the distance for the piping. The
installation factor 𝐹𝐵𝑀 is determined by
𝐹𝐵𝑀 = 3.22 − 0.05𝐷𝑛𝑜𝑚 − 0.001𝐷𝑛𝑜𝑚2
with the nominal pipe diameter 𝐷𝑛𝑜𝑚 in cm. The piping base costs are calculated by
𝐶𝑃,𝐶𝑆 = 0.4199𝐷𝑛𝑜𝑚2 + 1.9675𝐷𝑛𝑜𝑚 + 25.97.
Cost of purchasing and installing insulation is calculated as
𝐶𝐼𝑁𝑆 = 1.13 ∙ 𝑡𝑜𝑝𝑡 ∙ (𝐷𝑎𝑐𝑡 + 𝑡𝑜𝑝𝑡)
where 𝐷𝑎𝑐𝑡 is the actual outer bare-pipe diameter in cm and 𝑡𝑜𝑝𝑡 is the insulation thickness
which is obtained by
𝑡𝑜𝑝𝑡 = 0.085 ∙ 𝐷𝑛𝑜𝑚0.20 ∙ ∆𝑇0.65
where ∆𝑇 is the temperature difference between the bulk fluid and the ambient in °C.
Case-Study
The presented methodology is used to analyze a steel production site in Europe. Figure 5
shows a rough overview about the plant distribution and the general product flows and steam
supply. There are four individual facilities (A, B, C, D) within the range of 1 km which are further
processing raw material from the steel shop to semi-finished products. The distances between
these facilities can be seen in Table 1. Values in Table 1 include direct distance and additional
20 % in order to consider that realizable pipe length is usually greater than the direct distance.
The high pressure (HPr) steam production efficiency is assumed to be 95 %. As the blast
furnace and the steel shop are too far away for heat integration with the other facilities (> 5 km)
and they do not use the same steam supply system, they are not considered in the present
study.

12. Internationale Energiewirtschaftstagung an der TU Wien IEWT 2021
Seite 7 von 17
Figure 5: Part of the considered integrated steel production site
Table 1:Distances between facilities
Facility 1 Facility 2 Distance
A B 60 m
A C 120 m
A D 360 m
The heating demands for the four considered facilities are covered by HPr steam provided by
an external company. Currently these facilities are supplied with steam at 5 bara which is
mainly used to preheat cleaning water, air for drying and for combustion and for heat supply in
lubrication systems. The most prominent sources for excess heat are flue gases from furnaces
and warm cleaning water, which yield large quantities of relatively low temperature heat. The
considered changes to the existing system are depicted in Figure 6.

12. Internationale Energiewirtschaftstagung an der TU Wien IEWT 2021
Seite 8 von 17
Figure 6: Schematic of the considered changes to the existing system (reduction of steam supply, heat distribution system, excess heat usage)
Figure 7: Grand Composite Curves (GCCs) for (a) Facility A (b) Facility B (c) Facility C and (d) Facility D including potentials of an intermediate heating cycle as well as heat pumps

12. Internationale Energiewirtschaftstagung an der TU Wien IEWT 2021
Seite 9 von 17
The composite curves for all facilities are shown in Figure 7. These curves show that in facility
A, after DHR, there is no demand for external heating, but large quantities of excess heat could
be used elsewhere. Facilities B to D show potentials for HR and for HP integration at relatively
low temperature levels. The pinch point for these facilities lies in the range of 30-60°C.
Considering a second law efficiency 𝜂 of 0.45, which lies in the usual range of 0.4-0.6 [21], to
determine the 𝐶𝑂𝑃𝑟𝑒𝑎𝑙 for potential HPs, heating requirements of facilities B and D could be
covered.
𝐶𝑂𝑃𝑟𝑒𝑎𝑙 = 𝜂 ⋅ 𝐶𝑂𝑃𝐶𝑎𝑟𝑛𝑜𝑡 = 𝜂 ⋅𝑇ℎ𝑜𝑡
𝑇ℎ𝑜𝑡 − 𝑇𝑐𝑜𝑙𝑑
Analysis of the potentials for LTD between facilities shows that the excess heat from facility A
could be sufficient to cover residual heating demands of facilities B-D. Considering ideal heat
transport without losses, the analysis depicted in Figure 8 shows that within a temperature
range for the heat transfer fluid of 120°C up to 284°C, demands could be fully covered. This in
turn would eliminate the need for the existing gas-powered HPr steam system.
Figure 8: Potential of an intermediate cycle for low temperature heat distribution
In order to analyze the economic feasibility of the respective measures, costs for the individual
components such as HEX, HPs and the LTD system were elaborated and implemented in the
optimization model. For applicable LTD systems using thermal oil, pressurized water and low-
pressure steam were considered at first. However, based on the temperature levels steam is
advantageous and further elaborated in this work.
For the optimization model minimum approach temperatures of 5°C for evaporators and
condensers of the HPs and 30°C for all other HEXs were selected. Cooling water was
considered as cold utility. The optimization model was parameterized for different scenarios,
which are shown in Table 2:
• A base scenario, which was derived from both historic price data on Central European
energy spot markets and with costs provided by a worldwide steelmaking company
• A scenario with current (July 2021) energy and CO2 costs for Central Europe
• A progressive future scenario with increased costs for CO2 emissions compared to
current values.
In the latter, HP investment costs are reduced to 90% due to assumed learning curves.

12. Internationale Energiewirtschaftstagung an der TU Wien IEWT 2021
Seite 10 von 17
Table 2: Scenario definition
Scenario Electricity price
(€/MWh)
Natural gas price
(€/MWh)
CO2 price
(€/t)
Base 40 25 40
EU average 90 35 53.2
Prog. CO2 prices 90 35 128
Results
For each of the scenarios the status quo and four different technology combinations for HR
measures were considered:
• No heat recovery at all (NO HR);
• only direct heat recovery (DHR);
• direct heat recovery & heat pump integration (DHR HP);
• direct heat recovery & low temperature distribution system (DHR LTD);
• direct heat recovery, heat pumps & low temperature distribution system (DHR HP
LTD).
In the optimization model an annualization period of 10 years was considered for CAPEX for
minimization of total annual costs. The normalized heat loads for HR and for residual HPr
steam and cooling water demands are presented in Table 3. Normalized HR is also shown in
Figure 9.
Table 3: Overview of results – normalized heat recovery (highest values emphasized in bold) and utility loads
Scenario Con-
figuration
DHR LTD HP sink HR
total
HPr
Steam
Cooling
water
Status quo NO HR - - - - 9.71 23.37
Base DHR 5.72 - - 5.72 3.99 23.37
Base DHR LTD 5.00 4.70 - 9.71 - 23.37
Base DHR HP 5.71 - 1.25 6.96 2.74 23.36
Base DHR HP LTD 5.00 4.70 - 9.71 - 23.37
EU average DHR 5.72 - - 5.72 3.99 23.37
EU average DHR LTD 5.00 4.70 - 9.71 - 23.37
EU average DHR HP 5.72 - 0.49 6.21 3.50 23.36
EU average DHR HP LTD 5.00 4.70 - 9.71 - 23.37
Prog. CO2 price DHR 5.72 - - 5.72 3.99 23.37
Prog. CO2 price DHR LTD 5.00 4.70 - 9.71 - 23.37
Prog. CO2 price DHR HP 5.72 - 1.26 6.98 2.72 23.36
Prog. CO2 price DHR HP LTD 5.00 4.70 - 9.71 - 23.37

12. Internationale Energiewirtschaftstagung an der TU Wien IEWT 2021
Seite 11 von 17
Results show that introduction of an LTD system is favorable compared to only DHR and HPs.
In all cases where LTD was available for the solver, it was selected to cover all residual heating
requirements after DHR leaving costs for cooling water (0.01 €/kWh) as the only remaining
OPEX. Thus, in terms of costs, all scenarios yield the same results for configurations including
LTD. However, depending on the scenario, cost savings vary significantly as costs for HPr
steam range from 40 to 90 €/MWh and CO2 prices range from 40 €/t to 128 €/t.
The energy price differences between the individual scenarios does not impact the costs for
systems with LTD since there are no residual energy costs for heating. Depending on the
energy prices, HP normalized nominal powers range from 0.49 to 1.26. Especially the EU
average scenario with relatively high electricity costs reduces HP utilization.
Figure 9: Normalized heat recovery for all scenarios and combinations of heat recovery measures
Energy flows for the individual configurations are presented in Figure 10. Figure 10 (a) shows
the status quo without any additional HR measures. All facilities require HPr steam. Figure
10 (b) introduces DHR in all facilities represented by loops. In Figure 10 (c), HPs are integrated
in facilities C and D eliminating HPr steam demands for facility C. In facility B no HP is
considered, even though pinch analysis would suggest potentials at relatively low
temperatures. Figure 10 (d) shows heat flows including the LTD system. The resulting heat
exchanger network for all cases considering LTD is shown in Figure 11. The LTD is extensively
used and heats all cold streams in facilities B to D. HEX for DHR are placed in facilities A, B
and C. Hot streams without any HEX do not have a cooling requirement but are rather potential
heat sources that in this case have not been used.
0
2
4
6
8
10
12
base base EUaverage
prog.CO2price
base EUaverage
prog.CO2price
base EUaverage
prog.CO2price
base EUaverage
prog.CO2price
NO HR DHR DHR LTD DHR HP DHR HP LTD
No
rmal
ized
hea
t re
cove
ry (
-)
Direct HR
LTD
Heat pump sink
HR total

12. Internationale Energiewirtschaftstagung an der TU Wien IEWT 2021
Seite 12 von 17
Figure 10: Sankey diagrams for the base case scenario (a) without HR, (b) with DHR, (c) with DHR and HP, (d) with DHR and LTD
(a)
(b)
(c)
(d)

12. Internationale Energiewirtschaftstagung an der TU Wien IEWT 2021
Seite 13 von 17
Figure 11: Heat exchanger networks including LTD (CW means cooling water)
Figure 12 summarizes OPEX and CAPEX for all scenarios and configurations. It shows that
for all measures, drastic reductions in OPEX can be obtained. As mentioned before, integration
of an LTD reduces OPEX to costs for cooling water, but CAPEX for the entire HR system
account for approximately 7 M€. In these cases, the original HPr steam distribution system is
not used any longer. Reuse of the already existing HPr steam distribution system for the LTD
was not considered in this work but could potentially reduce CAPEX for LTD systems. In the
cost-optimized system with LTD DHR is reduced compared to pinch analysis targets leading
to increased usage of the LTD (4.7 vs. 3.9 from the pinch analysis target).
Figure 12: CAPEX and OPEX for all scenarios and combinations of heat recovery measures
0 €
1.000.000 €
2.000.000 €
3.000.000 €
4.000.000 €
5.000.000 €
6.000.000 €
7.000.000 €
8.000.000 €
bas
e
EU a
vera
ge
pro
g. C
O2
pri
ce
bas
e
EU a
vera
ge
pro
g. C
O2
pri
ce
bas
e
EU a
vera
ge
pro
g. C
O2
pri
ce
bas
e
EU a
vera
ge
pro
g. C
O2
pri
ce
bas
e
EU a
vera
ge
pro
g. C
O2
pri
ce
NO HR DHR DHR LTD DHR HP DHR HP LTD
OPEX
CAPEX

12. Internationale Energiewirtschaftstagung an der TU Wien IEWT 2021
Seite 14 von 17
In order to facilitate evaluation of the costs for the different configurations, the net present value
(NPV) was calculated for 10 years starting from the implementation of the recovery measures
and is shown in Figure 13.
Figure 13: Net present value for all combinations of heat recovery measures for all scenarios with an assumed discount rate of 5%

12. Internationale Energiewirtschaftstagung an der TU Wien IEWT 2021
Seite 15 von 17
The figure clearly shows that introduction of LTD is the most expensive in terms of investment
costs and has the longest payback period but after approximately 5-10 years (depending on
the scenario and according prices), the NPV exceeds DHR alone and HP integration. After 10
years, overall savings from LTD integration are between 10 and 30 M€ whereas integration of
DHR measures alone and DHR combined with HPs yield approximately 10 to 20 M€ in NPV
after 10 years.
Conclusion & Outlook
A steel production site with four individual facilities was analyzed using Pinch Analysis and
mathematical programming regarding cost efficient heat recovery by means of direct heat
recovery, heat pumps and inter-facility heat transfer. For economic evaluation, three different
scenarios including a base case, the status quo of the energy market in Central Europe and a
futured scenario were considered. The results show that introduction of an LTD system might
be the most promising solution since using excess heat from flue gas in one facility could
potentially supply the other facilities with enough heat so that the existing HPr steam system
would not be necessary any longer. Within the considered timeframe of 10 years the LTD
system is the most favorable. Especially in the future case scenario the integration of the DHR
HP LTD system yields the highest potential as the NVP shows overall savings of almost 30 M€
after 10 years. Moreover, analysis showed that DHR alone bears a potential of at least
approximately 10 M€ referring to the base case. However, NPV analysis also shows that
depending on the scenario for energy costs, potential revenues from energy savings with the
LTD system only exceed DHR and HP integration only after 5 to 10 years.
It has to be noticed that the costs considered in this work do not include integration, which
adds a high degree of uncertain additional costs which could jeopardize economic viability.
Furthermore, analysis is based on a so-called rough pinch-analysis which yields some
uncertainties due to inaccessible stream data. Therefore, to confirm the results from this study,
more detailed analyses including site measurements are needed.

12. Internationale Energiewirtschaftstagung an der TU Wien IEWT 2021
Seite 16 von 17
Bibliography
[1] World Steel Association, Sustainability indicators 2020 report:
https://www.worldsteel.org/en/dam/jcr:6d73d7fa-9739-439e-96d8-
b2d57b32951c/Indicator%2520data%2520report%25202020.pdf (accessed on
28.06.2021)
[2] IEA: Iron and Steel Technology Roadmap 2020:
https://iea.blob.core.windows.net/assets/eb0c8ec1-3665-4959-97d0-
187ceca189a8/Iron_and_Steel_Technology_Roadmap.pdf (accessed on 28.06.2021)
[3] Arcelor Mittal: Climate Action Report 2019:
https://storagearcelormittaluat.blob.core.windows.net/media/hs4nmyya/am_climateaction
report_1.pdf (accessed on 8 September 2019)
[4] Statistik Austria, Nutzenergieanalyse für Österreich 1993-2019, https://www.statistik.at/,
(accessed on 03.08.2021)
[5] Wilk V., Helminger F., Dusek S., Lauermann M., Fleckl T.: Dampferzeugung aus
Abwärme mit Wärmepumpen, DKV-Tagung 2019, Ulm, AA IV.22
[6] U.S.Department of Energy (Hg.): Bandwidth Study on Energy Use and Potential Energy
Saving Opportunities in U.S. Iron and Steel Manufacturing, June 2015, Online:
https://www.energy.gov/sites/prod/files/2015/08/f26/iron_and_steel_bandwidth_report_0.
pdf, (accessed on 09.08.2021)
[7] Kosmadakis, G., Estimating the potential of industrial (high-temperature) heat pumps for
exploiting waste heat in EU industries, Applied Thermal Engineering 156 (2019), 287–
298
[8] Pulm, P., Raupenstrauch, H., Roadmap Industrie - Energieeffizienz in der Eisen- und
Stahlindustrie, Diskussionspapier, Klima- und Energiefonds der österreichischen
Bundesregierung (Hrsg.), Wien 2014
[9] Helminger, F., Dusek S., Krämer J., Wilk V.: "Effiziente industrielle Abwärmenutzung mit
Wärmepumpen in der Stahlindustrie"; Presentation: Deutsche Kälte‐ und Klimatagung
(2020), Online; 19.11.2020 - 20.11.2020; in: "Deutsche Kälte‐ und Klimatagung", (2020)
[10] Linnhoff, B: User guide on process integration for the efficient use of energy. AIChE J.,
28, 000-000, 1982.
[11] Smith, R., 2005. Chemical process design and integration 1st ed., Chichester West
Sussex, UK: Wiley.
[12] www.spiraxsarco.com
[13] Ulrich, G.D. & Vasudevan, P.T., 2006, How to Estimate Utility Costs. Chemical
Engineering WWW.CHE.COM
[14] Klemeš, J. J. & Kravanja, Z., Forty years of Heat Integration: Pinch Analysis (PA) and
Mathematical Programming (MP), Current Opinion in Chemical Engineering, Volume 2,

12. Internationale Energiewirtschaftstagung an der TU Wien IEWT 2021
Seite 17 von 17
Issue 4, 2013, Pages 461-474, ISSN 2211-3398,
https://doi.org/10.1016/j.coche.2013.10.003.
[15] Schlosser F., Arpagaus C., Walmsley T.G., 2019, Heat Pump Integration by Pinch
Analysis for Industrial Applications: A Review, Chemical Engineering Transactions, 76,
7-12.
[16] Chang C., Chen X., Wang Y., Feng X., Simultaneous optimization of multi-plant heat
integration using intermediate fluid circles, Energy, Volume 121, 2017, Pages 306-317,
ISSN 0360-5442, https://doi.org/10.1016/j.energy.2016.12.116.
[17] Tao R., Liu L., Gu S., Zhuang Y., Zhang L., Du J., 2020, Flexible Synthesis of Inter-Plant
Heat Exchanger Networks Considering the operation of Intermediate circles, Chemical
Engineering Transactions, 81, 13-18
[18] Beck, A., Hofmann R., A Novel Approach for Linearization of a MINLP Stage-Wise
Superstructure Formulation, Computers & Chemical Engineering, Volume 112, 2018,
Pages 17-26, ISSN 0098-1354, https://doi.org/10.1016/j.compchemeng.2018.01.010.
[19] Yee, T.F., Grossmann I.E., Simultaneous optimization models for heat integration—II.
Heat exchanger network synthesis, Computers & Chemical Engineering, Volume 14,
Issue 10, 1990, Pages 1165-1184, ISSN 0098-1354, https://doi.org/10.1016/0098-
1354(90)85010-8.
[20] Prendl, L., Hofmann R., An Extended Approach for the Integration of Heat Pumps into
HENS Multi-Period MILP Superstructure Formulation for Industrial Applications,
Editor(s): Sauro Pierucci, Flavio Manenti, Giulia Luisa Bozzano, Davide Manca,
Computer Aided Chemical Engineering, Elsevier, Volume 48, 2020, Pages 1351-1356,
ISSN 1570-7946, ISBN 9780128233771, https://doi.org/10.1016/B978-0-12-823377-
1.50226-3.
[21] Arpagaus, C.; Bless, F.; Uhlmann, M.; Schiffmann, J.; Bertsch, S.S. High temperature
heat pumps: Market overview, state of the art, research status, refrigerants, and
application potentials. Energy 2018, doi:10.1016/j.energy.2018.03.166