optimization of ecf bleaching of kraft pulp: i. optimal ...€¦ · combination of high effective...
TRANSCRIPT
OPTIMIZATION OF ECF BLEACHING OF KRAFT PULP: I. OPTIMAL BLEACHING OF HARDWOOD PULPS MADE WITH DIFFERENT ALKALI CHARGES Thomas J. McDonough,* Shunichiro Uno,† Alan W. Rudie‡ and Charles E. Courchene§
Institute of Paper Science and Technology, Atlanta GA
ABSTRACT In an earlier modeling study, we showed that when a hardwood kraft pulp is bleached in the Do(EO)D1ED2 sequence with a Do stage kappa factor of 0.20, the brightness of the pulp emerging from the D2 stage can be accurately predicted from the brightness of the pulp entering that stage. The entering brightness, in turn, is a well-defined function of the ratio of the D1 stage ClO2 charge to the (EO) stage kappa number. In the present study, we use the results of pulping and bleaching experiments on southern U.S. red oak chips to extend the model to account for the effect of changing the Do kappa factor and use it to assess the effect of digester alkali charge on pulp bleachability. We also show how this approach can be used to minimize the total C1O2 requirement for any desired final brightness and to optimize the allocation of ClO2 to the three D stages of the D(EO)DED sequence or the two D stages of the D(EO)D sequence. Among the conclusions resulting from application of the model are the findings that the combination of high effective alkali and high D0 kappa factor gives pulp with a higher final brightness ceiling than any other combination but that, for brightness targets of 91 or lower, the combination of low effective alkali and low kappa factor is the most economical.
INTRODUCTION In multistage kraft pulp bleaching sequences there exists, for each stage, a relationship between the entering pulp properties, the conditions prevailing within the stage, and the properties of the pulp leaving it. It is possible to describe this relationship by a mathematical model, the output of which can serve as one of the necessary inputs to a similar model of the following stage. A collection of such models, one for each stage of the sequence, constitutes a predictive model of the entire sequence.
To provide a complete description of the bleaching process, each of the component single-stage models would have to account for the effects of the composition of the entering pulp, the composition of the liquid phase mixed with the pulp, flow patterns within the mixer and bleaching tower, concentration gradients throughout the system, temperature, and retention time. Such models would obviously be exceedingly complex and virtually impossible to derive. A more realistic approach involves adopting simplifying assumptions. For example, Wang and co-workers1
lumped chemical kinetics and mass transfer and used kinetic expressions derived from low-consistency experiments in which the pH and bleaching agent concentrations were held constant. Earlier, Axegård and co-workers2 had used similar data to create a model of the DED partial sequence as applied to pulp prebleached in an O(C+D)E partial sequence. Both groups assumed that such expressions were applicable to the real situation, in which the pH and bleaching chemical concentrations change continuously as a result of chemical consumption in the bleaching reactions. Because they incorporate kinetic expressions and flow pattern assumptions, models of this kind are, in principle, capable of simulating the dynamic behavior of the bleach plant, a desirable feature for process control applications. However, this capability comes at a price: a high degree of complexity, a large number of parameters, and a demanding requirement for tuning and validation. Keski-Sätti and co-workers3 adopted an alternative approach, using neural networks to infer the needed relationships from mill operating data. Among the virtues of this method are its high degree of relevance to the particular installation on which it is based and the fact that it does not rely on the availability of laboratory-derived kinetic relationships and assumptions concerning their applicability in the field On the other hand, the predictive ability of the resulting model is limited to the ranges of the operating variables
*Professor Emeritus. E-mail: [email protected] †On leave from Nippon Paper Industries, to which he has since returned. E-mail: [email protected] ‡Associate Professor; now at USDA, Forest Service, Forest Products Laboratory, Madison Wisconsin. E-mail: [email protected] § Senior Research Engineer. E-mail: [email protected]
represented in the operating data used. This is a significant limitation since it is possible, and perhaps even likely, that optimal operating conditions lie outside these ranges. Such models are therefore limited in their ability to optimize the system. For applications where it is not necessary to simulate process dynamics, much simpler steady-state models suffice. Among the applications of steady-state models is the determination of optimum set points for chemical dosage controllers, which is equivalent to optimizing the allocation of chemicals to the different stages of the sequence for any desired final brightness. Another application of steady-state bleach plant models is as a basis for comparison of the bleachability characteristics of different types of pulp in terms of their minimum chemical requirement to attain a given set of final product properties, such as fully bleached brightness, content of nonfibrous contaminants, brightness stability, etc.
In an early study4, we identified a broadly applicable equation that describes brightness development in ClO2
bleaching stages. Subsequently5 we incorporated it into a full-sequence model for the D0(EO)D1ED2 bleaching of a hardwood kraft pulp. The latter work showed that when the pulp was bleached with a D0 stage kappa factor (KF) of 0.20, the brightness of the pulp emerging from the D2 stage can be accurately predicted from the brightness of the pulp entering that stage. The entering brightness, in turn, was shown to be a well-defined function of the ratio of the D1 stage ClO2 charge to the (EO) stage kappa number. The model incorporating these relationships was used to determine the optimum allocation of ClO2 to the D1 and D2 stages and the minimum total ClO2 requirement for any desired final brightness. Since then, Hart and Connell6 have used this model, with suitable adjustment of its parameters, to optimize unbleached kappa number with respect to the combined costs of wood and bleaching chemicals, for various brightness targets. Their work validates the model and illustrates how its site-specific application can yield benefits in the form of reduced operating costs. More recently, Dumont et al.7 have used the same equations to illustrate an approach for determining optimal ClO2 dosage controller set points.
In the present study, we extend the model to account for the effect of changing the D0 KF and use it to assess the effect of digester alkali charge on pulp bleachability. We also show how this approach can be used to unambiguously characterize pulp bleachability, minimize the total ClO2 requirement for any desired final brightness and optimize the allocation of ClO2 to the three D stages of the D(EO)DED sequence or the two D stages of the D(EO)D sequence.
EXPERIMENTAL Red oak chips were provided by a southern U.S. mill. Pulps were prepared in an M/K Systems 10-liter laboratory digester, using 30% sulfidity liquor and a temperature schedule that consisted of a 110-min rise from ambient temperature to a maximum cooking temperature of 170°C. Synthetic pulping liquors were prepared from sodium hydroxide and sodium sulfide. Pulps with a kappa number of 14 were prepared with two different effective alkali (EA) charge levels, 13.6% and 17.9%, expressed as Na2O based on o.d. wood weight. The pulps were screened on a laboratory flat screen having 0.008" slots. Pulps from four cooks with EA levels ranging from 13.5 to 13.7% and H-factors from 993 to 1025 were combined to give the low-EA pulp. Pulp from a cook with 18% EA and H-factor 350 and one from a cook with 17.8% EA and H-factor 375 were combined to give the high-EA pulp.
The bleaching sequence was D0(EO)D1ED2. The pulp was thoroughly washed between stages. The ClO2 charge in the D0 stage was chosen to give one of three specified KFs: 0.16, 0.20 or 0.24. For example, when the KF was 0.20, the amount of ClO2 charged was equivalent to a chlorine charge numerically equal to 20% of the kappa number of the unbleached pulp. The first stage was carried out for 30 min at 45°C in a Quantum mixer, with an exit pH in the range 1.8 - 2.3. The (EO) stage was conducted at 70°C and 10% consistency in a horizontal shaft peg mixer rotating at 200 rpm and lasted for 60 min. The oxygen pressure, initially at 60 psig, was decreased by 12 psig every five min during the first 30 min, and the alkali charge was equal to 50% of the active chlorine charge in the D0 stage, giving an exit pH of 11 or higher. The D1 and D2 stages were conducted for 180 min at 70°C, and the E2 stage was at 70°C for 60 min, with an NaOH charge of 0.4%. After the (EO) stage, each pulp was divided into three equal portions, which were then bleached in the D1 stage with 0.2,0.6, and 1.8% ClO2. Each of the three resulting D1 pulps was then extracted with caustic and further subdivided for bleaching with 0.1, 0.3, and 0.9% ClO2 in the D2 stage. Measurements included pH and residual chemical at the end of each stage, the kappa number after the (EO) stage, and the brightness after the D1 and D2 stages. Kappa number and ISO brightness were determined according to TAPPI Test Methods.

RESULTS AND DISCUSSION
D0 Stage Model The results of Do(EO) bleaching of the two pulp types are presented in Figure 1. Despite the well known curvilinear dependence of extracted kappa number on KF (6), the relationship was adequately represented by a linear
Figure 1. Dependence of (EO) kappa number on D0 stage kappa factor
regression relationship over the range of KFs studied in the present case. The high-alkali pulps were more difficult to delignify in the first two stages than those produced with a lower digester alkali charge. The following equation describes the curves shown in Figure 1 :
(1) in which
yo = kappa number after the D0 and (EO) stages and
f = Do stage KF. The constants in this equation, as well as in the other equations of this paper, are named according to following rule: The first subscript identifies the order of the constant within the equation and the second is the same as that of the stage it refers to (e.g., 0 for D0, 1 for D1). For the low-EA and high-EA pulps, regression analysis gave b00 values of 8.08 and 8.78, respectively. The value of b10 was 23.2 for both pulps.

Figure 2 shows the relationships between brightness and kappa number for pulps exiting the (EO) stage. The high-EA pulps, despite their higher kappa number, were brighter than their low-EA counterparts. On the average, they were 3.5 points brighter.
Figure 2. D0(EO) brightness-kappa number relationships
D1 Stage Model The results of experiments in which-the low-EA and high-EA pulps were fully bleached are presented in Tables I and II, respectively. The brightness after the D1 and E stages correlates closely with the ClO2 charge in the D1 stage divided by the kappa number of the pulp entering the Dl stage. This quotient may be referred to as the “D1 multiple.” Note that the ClO2
charge is expressed as ClO2, not as equivalent chlorine, when calculating the D1 multiple. In an earlier study (5), the relationship between D1 brightness and D1 multiple was accurately described by an exponential relationship of the type,
(2) in which
y1 = brightness after the D1 stage and
m = D1 stage ClO2 charge multiple. The constants b10, b11, and b21 are, respectively, the brightness of the pulp leaving the (EO) stage, the maximum brightness gain achievable in the D1 stage, and a constant that is characteristic of the relative rate of approach to this maximum as the chemical charge is increased.
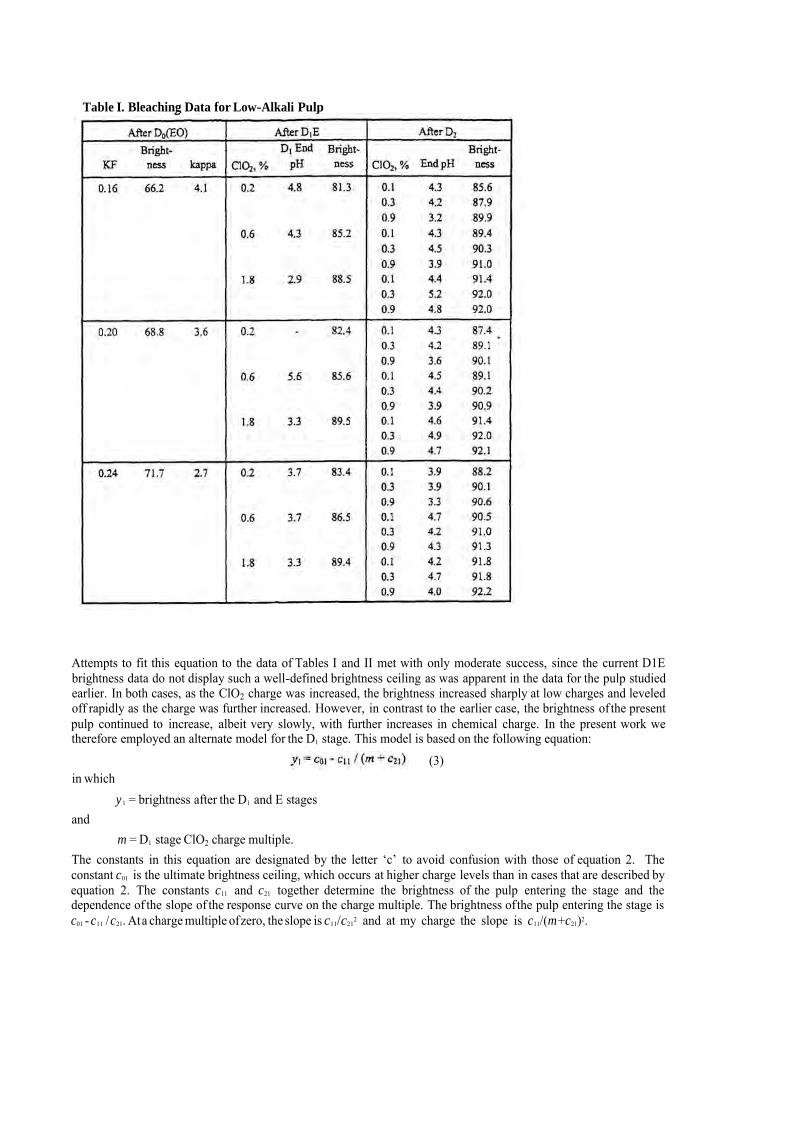
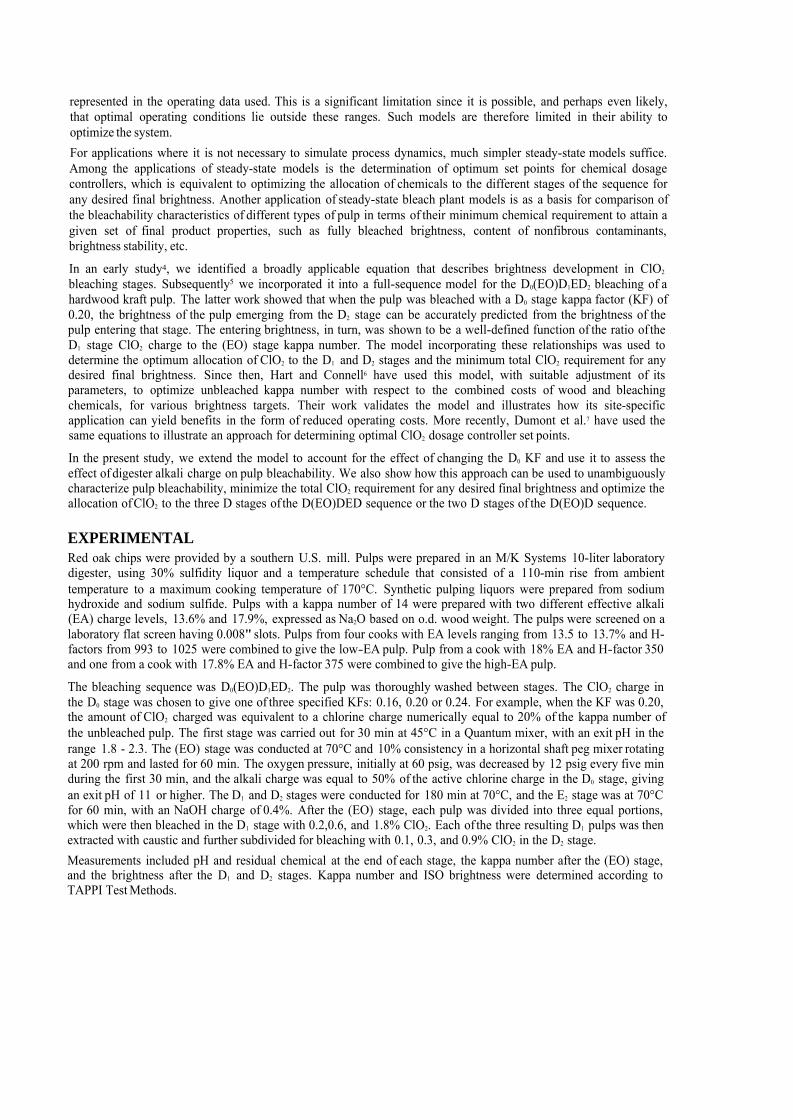
Table I. Bleaching Data for Low-Alkali Pulp
Attempts to fit this equation to the data of Tables I and II met with only moderate success, since the current D1E brightness data do not display such a well-defined brightness ceiling as was apparent in the data for the pulp studied earlier. In both cases, as the ClO2 charge was increased, the brightness increased sharply at low charges and leveled off rapidly as the charge was further increased. However, in contrast to the earlier case, the brightness of the present pulp continued to increase, albeit very slowly, with further increases in chemical charge. In the present work we therefore employed an alternate model for the D1 stage. This model is based on the following equation:
(3) in which
y1 = brightness after the D1 and E stages and
m = D1 stage ClO2 charge multiple. The constants in this equation are designated by the letter ‘c’ to avoid confusion with those of equation 2. The constant c01 is the ultimate brightness ceiling, which occurs at higher charge levels than in cases that are described by equation 2. The constants c11 and c21 together determine the brightness of the pulp entering the stage and the dependence of the slope of the response curve on the charge multiple. The brightness of the pulp entering the stage is c01 -c11 / c21. At a charge multiple of zero, the slope is c11/c21
2 and at my charge the slope is c11/(m+c21)2.

Table II. Bleaching Data for High-Alkali Pulp
Regression analysis showed that, although all of the conditions investigated gave very similar charge multiple-brightness relationships, there were significant differences. In particular, regardless of charge level, high-EA pulp that had been delignified in a D0 stage at the relatively high KF of 0.24 had higher D1E brightness than any of the other pulps. This effect compensated somewhat for the higher (EO) kappa number of this pulp relative to that of the low-EA pulp delignified in a Do stage at the same KF. Conversely, high-EA pulp that had been delignified in a D0
stage at the relatively low KF of 0.16 had lower D1E brightness than any of the other pulps, adding to the disadvantage already suffered by this pulp on account of its relatively high (EO) kappa number. All of the low-EA pulps and the high-EA, 0.20 KF pulp fell on a curve intermediate between the above two cases, as shown in Figure 3. The values of c01, c11 and c21 for the high-EA, high-KF pulp are 91.32, 0.7372 and 0.04141, respectively. For the high-EA, low-KF pulp they are 90.35, 0.9669 and 0.03728; for all of the remaining pulps, they are 90.10, 0.7405 and 0.03596.
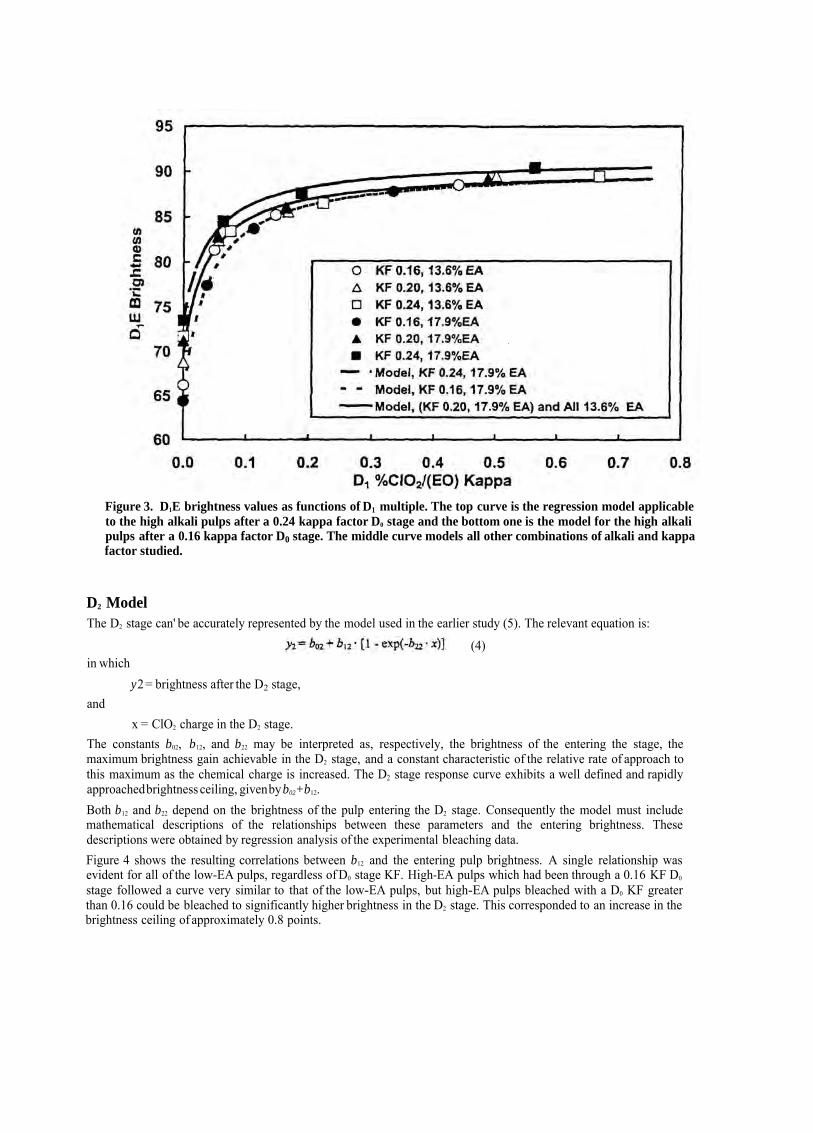
Figure 3. D1E brightness values as functions of D1 multiple. The top curve is the regression model applicable to the high alkali pulps after a 0.24 kappa factor D0 stage and the bottom one is the model for the high alkali pulps after a 0.16 kappa factor Do stage. The middle curve models all other combinations of alkali and kappa factor studied.
D2 Model The D2 stage can' be accurately represented by the model used in the earlier study (5). The relevant equation is:
(4) in which
y2 = brightness after the D2 stage, and
x = ClO2 charge in the D2 stage. The constants b02, b12, and b22 may be interpreted as, respectively, the brightness of the entering the stage, the maximum brightness gain achievable in the D2 stage, and a constant characteristic of the relative rate of approach to this maximum as the chemical charge is increased. The D2 stage response curve exhibits a well defined and rapidly approached brightness ceiling, given by b02+b12. Both b12 and b22 depend on the brightness of the pulp entering the D2 stage. Consequently the model must include mathematical descriptions of the relationships between these parameters and the entering brightness. These descriptions were obtained by regression analysis of the experimental bleaching data. Figure 4 shows the resulting correlations between b12 and the entering pulp brightness. A single relationship was evident for all of the low-EA pulps, regardless of D0 stage KF. High-EA pulps which had been through a 0.16 KF D0
stage followed a curve very similar to that of the low-EA pulps, but high-EA pulps bleached with a D0 KF greater than 0.16 could be bleached to significantly higher brightness in the D2 stage. This corresponded to an increase in the brightness ceiling of approximately 0.8 points.

Figure 4. Maximum possible brightness gain in the D2 stage vs. the brightness of the pulp entering the stage.
The equations of the lines shown in Figure 4 are of the form: (5)
in which b12 = maximum possible brightness gain in the D2 stage (a parameter in Eq. 4), y1 = brightness after the D1 and E stages, b120,b121, b122 = regression coefficients.
The values of b120, b121 and b122 for the low-EA pulps are -87.43, 2.90 and 0.0211. For the high-EA, low-KF pulp they are -142.08, 4.26 and 0.0296. For the high-EA, higher-KF pulps they are -141.33,4.26 and 0.0296. The brightness ceiling advantage of the high-EA, high-KF pulps is more apparent in Figure 5, which shows the estimated ceiling value as a function of entering brightness for each pulp condition. The other input required by the D2 stage model is the parameter b22 of equation 4. It can also be predicted from the brightness of the pulp entering the stage, although with somewhat less precision than b12, as shown in Figure 6. This lack of precision is not serious, since the response curve is relatively insensitive to this parameter, except at unrealistically low ClO2 charges.

Figure 5. D2 stage brightness ceiling dependence on entering pulp brightness
Figure 6. Dependence of the D2 stage model parameter b22 on entering pulp brightness.

The equation of the lines shown in Figure 6 is of the form:
(6) in which
b22 = maximum possible brightness gain in the D2 stage (a parameter in Eq. 4), y1 = brightness after the D1 and stages, b220, b221, b222 = regression coefficients.
The values of b220, b221 and b222 are 504.9, 13.06 and 0.0853.
Applications of the Model A major motivation for deriving a full-sequence model of an existing bleach plant is that it provides a means for optimizing the operation of the bleach plant, subject, of course, to the limitation that optimization will only be possible with respect to the independent variables (e.g., chemical charges) included in the model. Another benefit of having such a model available is that, from a research standpoint, it allows the bleachability of a given pulp to be unambiguously characterized, in terms of a curve showing the minimum chemical requirement for any desired final brightness target. Other methods, such as laboratory bleaching with constant conditions in all but the last stage and varying the chemical in that stage, fail to show each pulp to its best advantage and may well result in incorrect rankings of pulps with respect to their bleachabilities. In the following we use the model derived here to illustrate both applications. Figure 7 shows the minimum ClO2 requirement to reach various final brightness targets. These curves are characteristic of the bleachabilities of the four pulp types represented. For brightness targets of 91 or lower, the most
Figure 7. Minimum ClO2 requirement vs. final brightness target. D(EO)DED sequence.
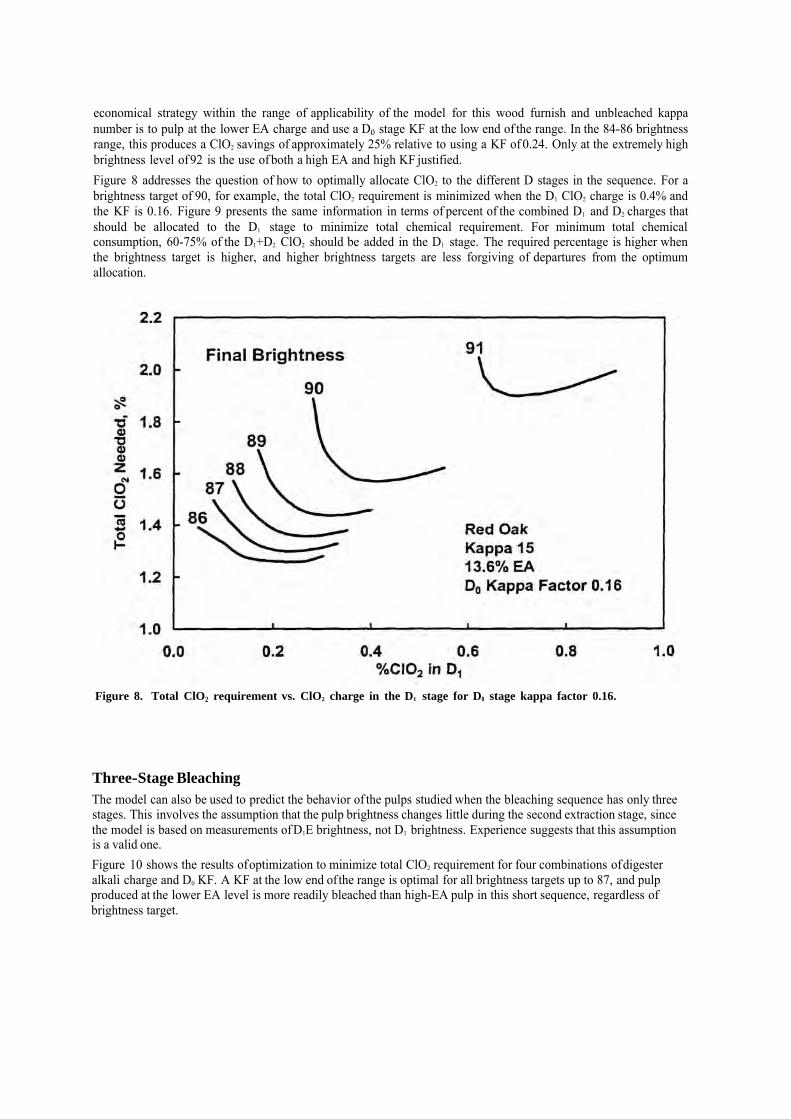
economical strategy within the range of applicability of the model for this wood furnish and unbleached kappa number is to pulp at the lower EA charge and use a Do stage KF at the low end of the range. In the 84-86 brightness range, this produces a ClO2 savings of approximately 25% relative to using a KF of 0.24. Only at the extremely high brightness level of 92 is the use of both a high EA and high KF justified. Figure 8 addresses the question of how to optimally allocate ClO2 to the different D stages in the sequence. For a brightness target of 90, for example, the total ClO2 requirement is minimized when the D1 ClO2 charge is 0.4% and the KF is 0.16. Figure 9 presents the same information in terms of percent of the combined D1 and D2 charges that should be allocated to the D1 stage to minimize total chemical requirement. For minimum total chemical consumption, 60-75% of the D1+D2 ClO2 should be added in the D1 stage. The required percentage is higher when the brightness target is higher, and higher brightness targets are less forgiving of departures from the optimum allocation.
Figure 8. Total ClO2 requirement vs. ClO2 charge in the D1 stage for Do stage kappa factor 0.16.
Three-Stage Bleaching The model can also be used to predict the behavior of the pulps studied when the bleaching sequence has only three stages. This involves the assumption that the pulp brightness changes little during the second extraction stage, since the model is based on measurements of D1E brightness, not D1 brightness. Experience suggests that this assumption is a valid one. Figure 10 shows the results of optimization to minimize total ClO2 requirement for four combinations of digester alkali charge and D0 KF. A KF at the low end of the range is optimal for all brightness targets up to 87, and pulp produced at the lower EA level is more readily bleached than high-EA pulp in this short sequence, regardless of brightness target.

Figure 9. Total ClO2 requirement vs. relative allocation of chemical to the D1 and D2 stages.
Figure 10. Minimum ClO2 requirement vs. final brightness target. D(EO)D sequence.

CONCLUSIONS Compared to those made with 17.9% effective alkali, kraft pulps made from red oak chips with an effective alkali charge of 13.6% are more readily delignified in the first two stages of the D0(EO)D1ED2 bleaching sequence, but they have a lower brightness at any given D0(EO) kappa number. When bleaching hardwood kraft pulps represented by the pulps studied here, the behavior of the D1 stage can be precisely modeled by an equation of the form, y1 = c01 - c11 / (m + c21 ) in which y1 = brightness after the D1 and E stages and m = D1 stage ClO2 charge multiple (the ClO2 charge in the D1 stage divided by the kappa number of the pulp entering the D1 stage). Among pulps prepared with 13.6 and 17.9% effective alkali charges and bleached at Do stage kappa factors in the range 0.16-0.24, the combination of high effective alkali and high kappa factor gave the highest D1E brightness at any Dl charge multiple. However, the brightness advantage was not great enough to justify the incremental cost of the kappa factor increase. The combination of high effective alkali and low kappa factor gave the lowest D1E brightness at any D1 charge multiple. All other combinations had intermediate D1E brightness. The D2 stage can be accurately represented by the model used in an earlier study. The relevant equation is y2 = b02 + b12 • [ 1 - exp(-b22 • x)] in which y2 = brightness after the D2 stage, and x = ClO2 charge in the D2 stage. The constants b02, b12, and b22 may be interpreted as, respectively, the brightness of the pulp entering the stage, the maximum brightness gain achievable in the D2 stage, and a constant characteristic of the relative rate of approach to this maximum as the chemical charge is increased. The D2 stage response curve exhibits a well defined and rapidly approached brightness ceiling, given by b02 + b12. The values of b12 and b22 are functions of the entering pulp brightness and can therefore be predicted from that brightness. The combination of high effective alkali and high D0 kappa factor gives pulp with a higher final brightness ceiling than any other combination. However, for brightness targets of 91 or lower, the combination of low effective alkali and low kappa factor is the most economical. For minimum total chemical consumption, 60-75% of the D1+D2 ClO2 should be added in the D1 stage. The required percentage is higher when the brightness target is higher, and higher brightness targets are less forgiving of departures from the optimum allocation. When bleaching in the three-stage sequence D0(EO)D1, a kappa factor at the low end of the range is optimal for all brightness targets up to 87, and pulp produced at the lower effective alkali level is more readily bleached than high effective alkali pulp, regardless of brightness target.
ACKNOWLEDGMENTS Financial assistance of this research by Nippon Paper Industries and by the Member Companies of the Institute of Paper Science and Technology is gratefully acknowledged.
REFERENCES
1Wang, R.X., Tessier, P.J.-C. and Bennington, C.P.J., “Modeling and Dynamic Simulation of a Bleach Plant,” AIChE J. 41(12): 2603-13 (1995). 2Axegård, P., Jansson, U., and Teder, A., “The E2 Stage Improves the Reactivity of Pulp Towards Chlorine Dioxide,” J. Pub Paper Sci. 10(1): J1-5 (1984). 3Keski-Shtti, J., Leivish, K. and Lampela, K., “Production Optimization of the Pulp Bleach Plant - Intelligent Methods Utilization Approach,” Proceedings, 6th International Conference on New Available Technologies, SPCI, Stockholm, 1999, pp. 402-8. 4McDonough, T.J., Brightness Development in the Final ClO2 Stages of an ECF Kraft Pulp Bleaching Sequence: Modeling and Effects of Pulping Conditions,” Proceedings, 1996 TAPPI Pulping Conference, TAPPI PRESS, Atlanta, p. 201. 5McDonough, T.J., Rawat, N. and Krishnagopalan, G.A., “A Highly Predictive Steady State Model of the D(EO)DED Kraft Pulp Bleaching Sequence,” Proceedings of the 57th Appita Annual General Conference and Exhibit, p 179-184, 2003, Melbourne, Vic., Australia; Appita Journal 57(5):381 (2904).

6Hart, P. and Connell, D., “The Effect of Digester Kappa Number on the Bleachability and Yield of EMCC™ Softwood Pulp,” TAPPI J. 5(4):23 (2006). 7Dumont, G., Van Fleet, R and Stewart, G., “A Setpoint Generation Tool for Optimal Distribution of Chemical Load Between Bleaching Stages,” Pulp and Paper Canada 107(7/8): T175-177 (July/August, 2006).

McDonough, Thomas J.; Uno, Shunichiro, Rudie. Alan W,; Courchene, Charles E 2006 Optimization of ECF bleaching of Kraft pulp. I. optimal bleaching of hardwood pulps made with different alkali charges. In. Proceedings of 2006 TAPPI engineering pulping and environmental conference. 2006 November 5-8 Atlanta, GA: Atlanta, GA: TAPPI Press. 14 p Available online. http://www.tappi.org