optimization of carbon dioxide fixation and starch
TRANSCRIPT

African Journal of Biotechnology Vol. 10(10), pp. 1888-1901, 7 March, 2011 Available online at http://www.academicjournals.org/AJB DOI: 10.5897/AJB10.1620 ISSN 1684–5315 © 2011 Academic Journals
Full Length Research Paper
Optimization of carbon dioxide fixation and starch accumulation by Tetraselmis subcordiformis in a
rectangular airlift photobioreactor
Yang Zheng1,2, Zhaoan Chen1, Hongbin Lu1 and Wei Zhang1,3*
1Marine Bio-products Engineering Group, Dalian Institute of Chemical Physics, Chinese Academy of Sciences, Dalian,
China. 2Graduate School of Chinese Academy of Sciences, Beijing 100039, China.
3Flinders Centre for Marine Bioprocessing and Bioproducts, School of Medicine, Flinders University, Adelaide, SA 5042,
Australia.
Accepted 21 February, 2011
Culture conditions are very important to CO2 bio-fixation and carbohydrate accumulation in microalgae. The objective of this study was to optimize semi-continuous culture conditions of Tetraselmis subcordiformis in a rectangular airlift photobioreactor for obtaining maximized carbon dioxide fixation rate and intracellular starch productivity. The effects of the initial biomass concentration (0.13, 0.8, 1.8, 2.8 and 3.47 g L
-1), the gas flow rate (0.03, 0.1, 0.2, 0.3 and 0.37 V V
-1 m
-1)
and different carbon dioxide concentrations (1.63, 5, 10, 15 and 18.37%) were considered using a central composite design. By using response surface methodology and the desirability function approach, the optimal CO2 fixation rate of 55.15 mg L
-1 h
-1 and the intracellular starch productivity of
10.66 mg L-1
h-1
occurred when the initial biomass concentration was 1120 mg L-1
and the air supplemental CO2 concentration was 6.9% with a gas flow rate of 0.35 V V
-1 m
-1. These results suggest
the potential of applying T. subcordiform to CO2 mitigation and starch production.
Key words: Photobioreactor, CO2 fixation rate, starch productivity, response surface methodology, desirability function approach.
INTRODUCTION Global warming induced by increasing concentrations of greenhouse gases in the atmosphere is causing more and more concern. CO2 is the main greenhouse gas, and 28.8 billion tons of it was released into the atmosphere in 2007 alone (International Energy Agency, 2009). The IEA predicted this number would reach to 34.5 billion tons or more by the year 2020. During the last two decades, various CO2 mitigation strategies were investigated that have included chemical reaction-based approaches, renewable biological energy sources, CO2 fixation and terrestrial sequestration of carbon, among others. At present, a large amount of research suggests that, using
*Corresponding author. E-mail: [email protected]. Tel:+86-411-84379527. Fax: +86-411-84379069.
microalgae for CO2 fixation is a sustainable strategy because microalgae have much higher growth rates and CO2 fixation abilities than conventional terrestrial plants. They can incorporate CO2 into cells in the form of biopolymers such as carbohydrates, proteins, lipids and other valuable products by photosynthetic reactions (Chiu et al., 2008; Hsueh et al., 2009). In addition, a recent report (Ramanan et al., 2010) indicated that Chlorella sp. and Spirulina platensis were able to deposit CO2 in the form of calcite with CO2 fixation photosynthetically occurring at the same time. This seems a viable option in the efforts to sequester increasing CO2 emissions.
Starch is one of the main biopolymers that accumulate intracellularly in unicellular green algae and it can be converted to hydrogen and alcohol. Several groups that have focused on microalgal hydrogen production found that intracellular starch content markedly effected hydrogen
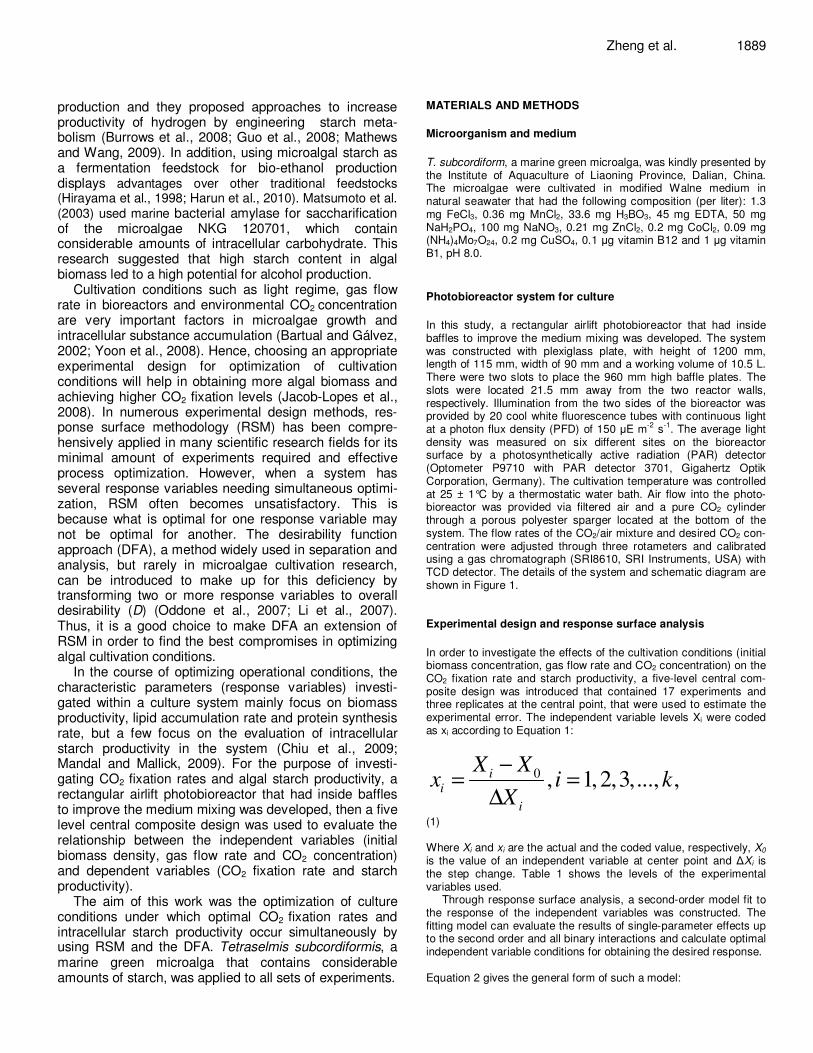
production and they proposed approaches to increase productivity of hydrogen by engineering starch meta-bolism (Burrows et al., 2008; Guo et al., 2008; Mathews and Wang, 2009). In addition, using microalgal starch as a fermentation feedstock for bio-ethanol production displays advantages over other traditional feedstocks (Hirayama et al., 1998; Harun et al., 2010). Matsumoto et al.
(2003) used marine bacterial amylase for saccharification of the microalgae NKG 120701, which contain considerable amounts of intracellular carbohydrate. This research suggested that high starch content in algal biomass led to a high potential for alcohol production.
Cultivation conditions such as light regime, gas flow rate in bioreactors and environmental CO2 concentration are very important factors in microalgae growth and intracellular substance accumulation (Bartual and Gálvez, 2002; Yoon et al., 2008). Hence, choosing an appropriate experimental design for optimization of cultivation conditions will help in obtaining more algal biomass and achieving higher CO2 fixation levels (Jacob-Lopes et al., 2008). In numerous experimental design methods, res-ponse surface methodology (RSM) has been compre-hensively applied in many scientific research fields for its minimal amount of experiments required and effective process optimization. However, when a system has several response variables needing simultaneous optimi-zation, RSM often becomes unsatisfactory. This is because what is optimal for one response variable may not be optimal for another. The desirability function approach (DFA), a method widely used in separation and analysis, but rarely in microalgae cultivation research, can be introduced to make up for this deficiency by transforming two or more response variables to overall desirability (D) (Oddone et al., 2007; Li et al., 2007). Thus, it is a good choice to make DFA an extension of RSM in order to find the best compromises in optimizing algal cultivation conditions.
In the course of optimizing operational conditions, the characteristic parameters (response variables) investi-gated within a culture system mainly focus on biomass productivity, lipid accumulation rate and protein synthesis rate, but a few focus on the evaluation of intracellular starch productivity in the system (Chiu et al., 2009; Mandal and Mallick, 2009). For the purpose of investi-gating CO2 fixation rates and algal starch productivity, a rectangular airlift photobioreactor that had inside baffles to improve the medium mixing was developed, then a five level central composite design was used to evaluate the relationship between the independent variables (initial biomass density, gas flow rate and CO2 concentration) and dependent variables (CO2 fixation rate and starch productivity).
The aim of this work was the optimization of culture conditions under which optimal CO2 fixation rates and intracellular starch productivity occur simultaneously by using RSM and the DFA. Tetraselmis subcordiformis, a marine green microalga that contains considerable amounts of starch, was applied to all sets of experiments.
Zheng et al. 1889 MATERIALS AND METHODS
Microorganism and medium
T. subcordiform, a marine green microalga, was kindly presented by the Institute of Aquaculture of Liaoning Province, Dalian, China. The microalgae were cultivated in modified Walne medium in natural seawater that had the following composition (per liter): 1.3 mg FeCl3, 0.36 mg MnCl2, 33.6 mg H3BO3, 45 mg EDTA, 50 mg NaH2PO4, 100 mg NaNO3, 0.21 mg ZnCl2, 0.2 mg CoCl2, 0.09 mg (NH4)4Mo7O24, 0.2 mg CuSO4, 0.1 µg vitamin B12 and 1 µg vitamin B1, pH 8.0.
Photobioreactor system for culture
In this study, a rectangular airlift photobioreactor that had inside baffles to improve the medium mixing was developed. The system was constructed with plexiglass plate, with height of 1200 mm, length of 115 mm, width of 90 mm and a working volume of 10.5 L. There were two slots to place the 960 mm high baffle plates. The slots were located 21.5 mm away from the two reactor walls, respectively. Illumination from the two sides of the bioreactor was provided by 20 cool white fluorescence tubes with continuous light at a photon flux density (PFD) of 150 µE m
-2 s
-1. The average light
density was measured on six different sites on the bioreactor surface by a photosynthetically active radiation (PAR) detector (Optometer P9710 with PAR detector 3701, Gigahertz Optik Corporation, Germany). The cultivation temperature was controlled at 25 ± 1°C by a thermostatic water bath. Air flow into the photo-bioreactor was provided via filtered air and a pure CO2 cylinder through a porous polyester sparger located at the bottom of the system. The flow rates of the CO2/air mixture and desired CO2 con-centration were adjusted through three rotameters and calibrated using a gas chromatograph (SRI8610, SRI Instruments, USA) with TCD detector. The details of the system and schematic diagram are shown in Figure 1. Experimental design and response surface analysis
In order to investigate the effects of the cultivation conditions (initial biomass concentration, gas flow rate and CO2 concentration) on the CO2 fixation rate and starch productivity, a five-level central com-posite design was introduced that contained 17 experiments and three replicates at the central point, that were used to estimate the experimental error. The independent variable levels Xi were coded as xi according to Equation 1:
0 , 1, 2,3,..., ,ii
i
X Xx i k
X
−= =
∆
(1) Where Xi and xi are the actual and the coded value, respectively, X0 is the value of an independent variable at center point and ∆Xi is the step change. Table 1 shows the levels of the experimental variables used.
Through response surface analysis, a second-order model fit to the response of the independent variables was constructed. The fitting model can evaluate the results of single-parameter effects up to the second order and all binary interactions and calculate optimal independent variable conditions for obtaining the desired response. Equation 2 gives the general form of such a model:

1890 Afr. J. Biotechnol.
Figure 1. Photobioreactor diagram. (a), Design dimension of the bioreactor; (b), bioreactor procedure scheme. 1, inside baffle; 2, gas sparger; 3, riser; 4, downcomer; 5, CO2 gas cylinder; 6, air compressor; 7, rotameter; 8, bioreactor; 9 , fluorescent lamp.
0 ,
1 1 1
k k k
i i i j i j
i i j
Y x x xβ β β= = =
= + +∑ ∑∑
(2) Where, Y is the predicted response, ß represents a regression co-efficient, xi and xj are the input variables that influence the response variable and k is the number of factors. In this study, the k value was equal to three. The experimental design and the statistical analyses were carried out using Statistica 8.0 software (Statsoft, USA).
Simultaneous optimization of two response variables
When a system has several response variables needing simulta-neous optimization, RSM often becomes unsatisfactory in solving this kind of problem. The desirability function approach (DFA) can be introduced to make up for this deficiency. In the DFA, the multicriteria problem is reduced to a single criterion problem of D optimization by transforming two or more response variables to the
overall desirability (Derringer and Suich, 1980). D is defined as follows in Equation 3:
1 /
1
nn
i
i
D d=
=
∏
(3) Where, n is the number of responses to be included in the optimi-zation and di is the individual desirability of response i. In this study, a one-sided transformation was used to transform individual responses into a corresponding desirability value. Equation 4 defined the individual desirability (di):
0
1
i i
i i
i i
rY Y
i i i iY Y
i i
Y Y
d Y Y Y
Y Y
∗∗
∗
∗
− ∗
∗−
∗
≤ = < <
≥ (4) Where, Yi is response i, Y
*i and Yi* are the highest and lowest
Zheng et al. 1891
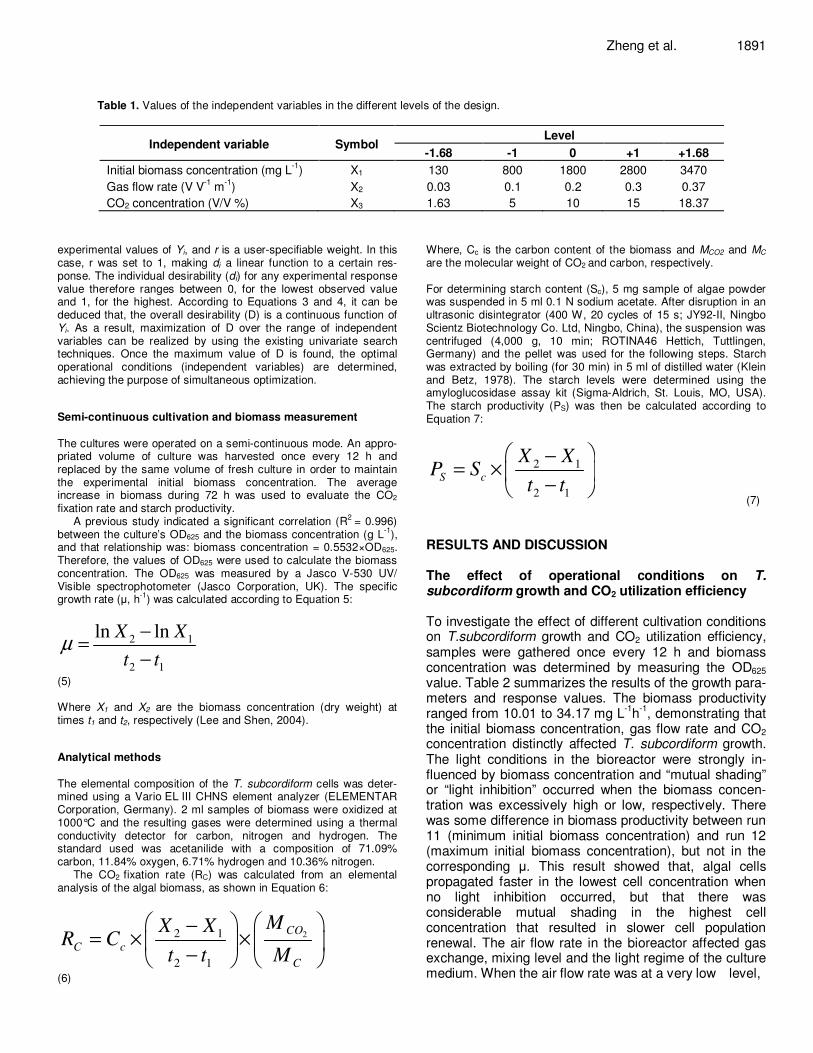
Table 1. Values of the independent variables in the different levels of the design.
Independent variable Symbol Level
-1.68 -1 0 +1 +1.68
Initial biomass concentration (mg L-1
) X1 130 800 1800 2800 3470
Gas flow rate (V V-1
m-1
) X2 0.03 0.1 0.2 0.3 0.37
CO2 concentration (V/V %) X3 1.63 5 10 15 18.37
experimental values of Yi, and r is a user-specifiable weight. In this case, r was set to 1, making di a linear function to a certain res-ponse. The individual desirability (di) for any experimental response value therefore ranges between 0, for the lowest observed value and 1, for the highest. According to Equations 3 and 4, it can be deduced that, the overall desirability (D) is a continuous function of Yi. As a result, maximization of D over the range of independent variables can be realized by using the existing univariate search techniques. Once the maximum value of D is found, the optimal operational conditions (independent variables) are determined, achieving the purpose of simultaneous optimization. Semi-continuous cultivation and biomass measurement The cultures were operated on a semi-continuous mode. An appro-priated volume of culture was harvested once every 12 h and replaced by the same volume of fresh culture in order to maintain the experimental initial biomass concentration. The average increase in biomass during 72 h was used to evaluate the CO2 fixation rate and starch productivity.
A previous study indicated a significant correlation (R2
= 0.996) between the culture’s OD625 and the biomass concentration (g L
-1),
and that relationship was: biomass concentration = 0.5532×OD625. Therefore, the values of OD625 were used to calculate the biomass concentration. The OD625 was measured by a Jasco V-530 UV/ Visible spectrophotometer (Jasco Corporation, UK). The specific growth rate (µ, h
-1) was calculated according to Equation 5:
2 1
2 1
ln lnX X
t tµ
−=
− (5) Where X1 and X2 are the biomass concentration (dry weight) at times t1 and t2, respectively (Lee and Shen, 2004). Analytical methods
The elemental composition of the T. subcordiform cells was deter-mined using a Vario EL III CHNS element analyzer (ELEMENTAR Corporation, Germany). 2 ml samples of biomass were oxidized at 1000°C and the resulting gases were determined using a thermal conductivity detector for carbon, nitrogen and hydrogen. The standard used was acetanilide with a composition of 71.09% carbon, 11.84% oxygen, 6.71% hydrogen and 10.36% nitrogen.
The CO2 fixation rate (RC) was calculated from an elemental analysis of the algal biomass, as shown in Equation 6:
22 1
2 1
CO
C c
C
MX XR C
t t M
−= × ×
− (6)
Where, Cc is the carbon content of the biomass and MCO2 and MC are the molecular weight of CO2 and carbon, respectively. For determining starch content (Sc), 5 mg sample of algae powder was suspended in 5 ml 0.1 N sodium acetate. After disruption in an ultrasonic disintegrator (400 W, 20 cycles of 15 s; JY92-II, Ningbo Scientz Biotechnology Co. Ltd, Ningbo, China), the suspension was centrifuged (4,000 g, 10 min; ROTINA46 Hettich, Tuttlingen, Germany) and the pellet was used for the following steps. Starch was extracted by boiling (for 30 min) in 5 ml of distilled water (Klein and Betz, 1978). The starch levels were determined using the amyloglucosidase assay kit (Sigma-Aldrich, St. Louis, MO, USA). The starch productivity (PS) was then be calculated according to Equation 7:
2 1
2 1
S c
X XP S
t t
−= ×
− (7)
RESULTS AND DISCUSSION The effect of operational conditions on T.
subcordiform growth and CO2 utilization efficiency To investigate the effect of different cultivation conditions on T.subcordiform growth and CO2 utilization efficiency, samples were gathered once every 12 h and biomass concentration was determined by measuring the OD625 value. Table 2 summarizes the results of the growth para-meters and response values. The biomass productivity ranged from 10.01 to 34.17 mg L
-1h
-1, demonstrating that
the initial biomass concentration, gas flow rate and CO2 concentration distinctly affected T. subcordiform growth. The light conditions in the bioreactor were strongly in-fluenced by biomass concentration and “mutual shading” or “light inhibition” occurred when the biomass concen-tration was excessively high or low, respectively. There was some difference in biomass productivity between run 11 (minimum initial biomass concentration) and run 12 (maximum initial biomass concentration), but not in the corresponding µ. This result showed that, algal cells propagated faster in the lowest cell concentration when no light inhibition occurred, but that there was considerable mutual shading in the highest cell concentration that resulted in slower cell population renewal. The air flow rate in the bioreactor affected gas exchange, mixing level and the light regime of the culture medium. When the air flow rate was at a very low level,

1892 Afr. J. Biotechnol.
Table 2. Coded matrix of the effects of the initial biomass concentration, gas flow rate and CO2 concentration on the growth parameters and response values.
Run
Factor Growth parameter Response value
Initial biomass
concentration
(X1)
Gas flow
rate (X2)
CO2
concentration
(X3)
Productivity
(mg L
-1h
-1)
µ
(h-1
)
Carbon
content
(100%)
RC
(mg L-1
h-1
)
CO2 utilization
efficiency
(100%)
Starch
content
(100%)
PS
(mg L
-1h
-1)
1 -1.00 -1.00 -1.00 11.67 0.0138 45.32 19.40 3.29 20.96 2.45
2 -1.00 1.00 1.00 29.15 0.0299 43.81 46.83 0.88 31.83 9.28
3 1.00 -1.00 1.00 19.99 0.0072 46.49 34.07 1.93 29.11 5.82
4 1.00 1.00 -1.00 17.51 0.0066 45.84 29.44 1.67 37.26 6.53
5 0.00 0.00 0.00 29.19 0.0143 44.15 47.25 2.00 33.64 9.82
6 -1.00 -1.00 1.00 11.67 0.0130 44.32 18.96 1.07 27.19 3.17
7 -1.00 1.00 -1.00 34.17 0.0341 44.80 56.14 3.18 28.98 9.90
8 1.00 -1.00 -1.00 13.34 0.0046 44.78 21.91 3.72 30.61 4.08
9 1.00 1.00 1.00 20.00 0.0068 45.83 33.61 0.63 24.29 4.86
10 0.00 0.00 0.00 29.15 0.0149 44.23 47.27 2.01 33.59 9.79
11 -1.68 0.00 0.00 10.01 0.0545 46.19 16.96 0.72 33.35 3.34
12 1.68 0.00 0.00 14.20 0.0038 46.04 23.98 1.02 34.67 4.92
13 0.00 -1.68 0.00 10.79 0.0059 45.42 17.97 5.08 17.76 1.92
14 0.00 1.68 0.00 27.52 0.0140 45.84 46.26 1.06 30.62 8.43
15 0.00 0.00 -1.68 23.31 0.0121 45.76 39.11 10.18 30.55 7.12
16 0.00 0.00 1.68 15.85 0.0085 44.68 25.97 0.60 20.93 3.32
17 0.00 0.00 0.00 29.27 0.0149 44.33 47.57 2.02 33.93 9.93
the algae growthrate slowed down due to poor gas exchange, lower mixing levels and algal cells settling (Merchuk et al., 2007). Run 13 confirmed this. On the other hand, it was harmful to the algae growth when the air flow was at a very high level, be-cause the excessive gas flow induced a higher shear level (Brindley Alías et al., 2004). The productivity level of run 14 was slightly lower when compared with the control group, probably due to the high shear level. CO2 is a very important carbon source of algal photosynthesis, so supplementing CO2 in the course of algal culture can promote cell proliferation, inhibit photo respiration and enhance photosynthetic efficiency (Iwasaki et al. 1998). Run 7 and the control
groups (run 5, 10, 17) showed it was beneficial to algae growth to supplement 5 to 10% (V/V) CO2; this result is in accordance with Chiu et al. (2008) who supplemented 5% CO2 in a Chlorella sp. culture and obtained higher biomass productivity and specific growth rate. The CO2 fixation efficiency of all runs ranged from 0.60 to 10.18%, similar to the reports of Zhang et al. (2002) and Chiu et al. (2008). As there is an inverse relationship between CO2 utilization efficiency and CO2 concentration, the quantity of supplemental CO2 can be decreased to increase the economical efficiency. In addition, introducing a membrane module (Cheng et al., 2006), optimizing the mixing device (Ryu et al., 2009) and improving the gas
sparger (Talbot et al., 1990) also contributed to increasing the CO2 utilization efficiency. The effect of operational conditions on CO2 fixation rate To investigate the effects of cultivation conditions on CO2 fixation rate, a five-level central composi-tion design was introduced. As Table 2 shows, the carbon content of the algal cells ranged from 43.81 to 46.49% in different operational conditions and a t-test (p < 0.05) indicated that there was no evident difference between all runs, namely, initial biomass concentration, gas flow rate and CO2

Zheng et al. 1893
Table 3. Regression coefficients of polynomial functions for different responses.
Factor CO2 fixation rate Starch content Starch productivity
Effect S.D. t(2) p coefficient Effect S.D. t(2) p coefficient Effect S.D. t(2) p coefficient
Constant 47.02 0.10 452.11 <0.00001 47.02 33.64 0.11 318.08 0.00001 33.64 9.77 0.04 228.79 0.00002 9.77
X1(L) -1.54 0.10 -15.75 0.00401 -0.77 2.13 0.10 21.42 0.00217 1.06 -0.12 0.04 -3.11 0.08973 -0.06
X1(Q) -16.65 0.11 -154.89 0.00004 -8.32 0.72 0.11 6.56 0.02246 0.36 -3.50 0.04 -79.23 0.00016 -1.75
X2(L) 17.47 0.10 178.82 0.00003 8.73 5.29 0.10 53.24 0.00035 2.64 3.81 0.04 94.95 0.00011 1.90
X2(Q) -8.41 0.11 -78.26 0.00016 -4.21 -6.23 0.11 -56.95 0.00031 -3.11 -2.76 0.04 -62.56 0.00026 -1.38
X3(L) -2.27 0.10 -23.23 0.00185 -1.13 -3.16 0.10 -31.78 0.00099 -1.58 -0.91 0.04 -22.73 0.00193 -0.46
X3(Q) -8.13 0.11 -75.47 0.00018 -4.06 -5.14 0.11 -46.93 0.00045 -2.57 -2.73 0.04 -61.80 0.00026 -1.37
X1X2 -14.38 0.13 -112.70 0.00008 -7.19 -2.71 0.13 -20.86 0.00229 -1.35 -3.02 0.05 -57.65 0.00030 -1.51
X1X3 6.52 0.13 51.08 0.00038 3.26 -5.89 0.13 -45.36 0.00049 -2.94 -0.01 0.05 -0.17 0.88373 -0.005
X2X3 -4.21 0.13 -33.02 0.00092 -2.11 -3.71 0.13 -28.60 0.00122 -1.86 -1.19 0.05 -22.68 0.00194 -0.59
concentration had almost no effect on cell carbon content. On the contrary, operational conditions had a strong effect on the CO2 fixation rate, which ranged from 16.96 (run 11), to 56.14 mg L
-1 h
-1
(run 7). These results were higher than those obtained by Yun et al. (1997), who obtained rates of 23.4 mg L
−1 h
−1 for the microalga Chlorella
vulgaris (UTEX 259) under conditions of 27°C, 15% CO2 and 110 µE m
−2 s
−1. This suggested the
potential of applying T. subcordiformis to the car-bon fixation process. In addition, as there was no evident difference in the carbon content of all runs, according Equation 6, the effect of the operation conditions on the CO2 fixation rate was similar to those on algae productivity.
Table 3 shows the results for the effects of and the interactions between the factors of the initial biomass concentration, gas flow rate and CO2 concentration, as well as the coefficients of the model with the CO2 fixation rate as the response. An analysis of this table showed that in the range evaluated, the CO2 fixation rate was controlled by the gas flow rate (L), initial biomass concentration (Q) and interaction between initial biomass con-centration (L) and gas flow rate (L), in the order of
importance. The other factors and interactions showed a lower proportion of statistical impor-tance. According to Table 3, Equation 8 can be obtained, which represents the statistical model for the variable response to CO2 fixation rate:
2 2 2
1 2 3 1 2 3 1 2 1 3 2 347.02 0.77 8.73 1.13 8.32 4.21 4.06 7.19 3.26 2.11Y X X X X X X XX XX X X= − + − − − − − + −
(8) In Figure 2, the contour curves, shows the varia-tion in the CO2 fixation rate as a function of the factors studied. These results reflect that an increase of CO2 fixation rate needs appropriate operational conditions, which are fixing the initial biomass concentration at the central region, the gas flow rate in the highest region and the CO2 concentration at the central region.
According to the statistical model and the contour curves, the CO2 fixation rate can reach the maximum predicted value of 59.93 mg L
-1 h
-1
when the initial biomass concentration is 340 mg L
-1, the gas flow rate is 0.46 V V
-1 m
-1 and the CO2
concentration is 2.9% (Table 5). The model for the variable response to CO2
fixation rate was validated from the F distribution
(Table 4), which suggested the existence of a quadratic relationship between the variables, in-dicating that the proposed model fitted the experimental data well. The effect of operational conditions on starch content As Table 2 shows, unlike carbon content, the starch content of the algal cell was clearly affected by the culture operational conditions and it ranged from 17.76 to 37.26%. A study by Hu et al. (1998) indicated that the biomass concentration directly affected light distribution in the bioreactor, the accepted light level of the algal cell and the level of metabolized carbohydrate. It was also found that, the content of carbohydrate decreased with increasing biomass concentrations when Chlorococcum littorale cell density was less than 10 g L
-1 in the bioreactor and the inverse tendency
when it was more than 10 g L-1
. In this study, no similar phenomenon was observed, as the results of run 11 (the minimum initial biomass concen-tration) and run 12 (the maximum initial biomass

1894 Afr. J. Biotechnol.
Figure 2. Contour curves for the variable CO2 fixation rate.
concentration) were approximately equal. Thus, there was less effect of initial biomass concentration on starch content in the experimental range. The gas flow rate in
the bioreactor not only affected gas-liquid transfer and mixing levels, but also affected the carbohydrate content in algal cells (Fabregas et al., 1995). As Table 2 shows,
Zheng et al. 1895
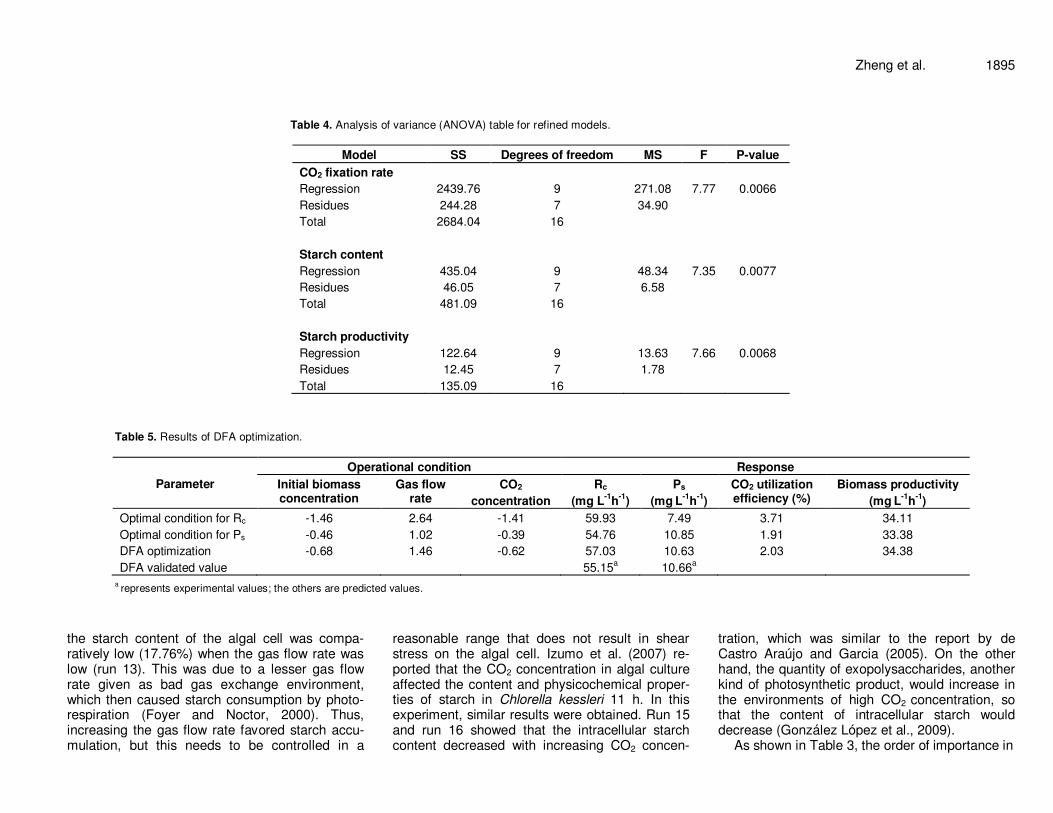
Table 4. Analysis of variance (ANOVA) table for refined models.
Model SS Degrees of freedom MS F P-value
CO2 fixation rate
Regression 2439.76 9 271.08 7.77 0.0066
Residues 244.28 7 34.90
Total 2684.04 16
Starch content
Regression 435.04 9 48.34 7.35 0.0077
Residues 46.05 7 6.58
Total 481.09 16
Starch productivity
Regression 122.64 9 13.63 7.66 0.0068
Residues 12.45 7 1.78
Total 135.09 16
Table 5. Results of DFA optimization.
Parameter
Operational condition Response
Initial biomass concentration
Gas flow rate
CO2
concentration
Rc
(mg L-1
h-1
)
Ps
(mg L
-1h
-1)
CO2 utilization efficiency (%)
Biomass productivity
(mg L
-1h
-1)
Optimal condition for Rc -1.46 2.64 -1.41 59.93 7.49 3.71 34.11
Optimal condition for Ps -0.46 1.02 -0.39 54.76 10.85 1.91 33.38
DFA optimization -0.68 1.46 -0.62 57.03 10.63 2.03 34.38
DFA validated value 55.15a 10.66
a
a represents experimental values; the others are predicted values.
the starch content of the algal cell was compa-ratively low (17.76%) when the gas flow rate was low (run 13). This was due to a lesser gas flow rate given as bad gas exchange environment, which then caused starch consumption by photo-respiration (Foyer and Noctor, 2000). Thus, increasing the gas flow rate favored starch accu-mulation, but this needs to be controlled in a
reasonable range that does not result in shear stress on the algal cell. Izumo et al. (2007) re-ported that the CO2 concentration in algal culture affected the content and physicochemical proper-ties of starch in Chlorella kessleri 11 h. In this experiment, similar results were obtained. Run 15 and run 16 showed that the intracellular starch content decreased with increasing CO2 concen-
tration, which was similar to the report by de Castro Araújo and Garcia (2005). On the other hand, the quantity of exopolysaccharides, another kind of photosynthetic product, would increase in the environments of high CO2 concentration, so that the content of intracellular starch would decrease (González López et al., 2009).
As shown in Table 3, the order of importance in

1896 Afr. J. Biotechnol. affecting starch content is the gas flow rate (Q), the inte-raction between the initial biomass concentration (L) and CO2 concentration (L), the gas flow rate (L) and CO2 concentration (Q). The other factors and interactions showed a lower proportion of statistical importance. According to Table 3, Equation 9 can be obtained, which represents the statistical model for the variable response starch content: 2 2 2
1 2 3 1 2 3 1 2 1 3 2 333.64 1.06 2.64 1.58 0.36 3.11 2.57 1.35 2.94 1.86Y X X X X X X X X X X X X= + + − + − − − − −
(9) The contour curves (Figure 3) showed the variation in the intracellular starch content as a function of the factors studied. Thus, an increase in intracellular starch content was obtained not only by altering the CO2 concentration to a lower level, that is, carrying out the cultivation under reduced proportions of CO2 enrichment in the air entering the photobioreactor, but also by fixing the gas flow rate in the highest region. Unlike the two factors stated earlier, the initial cell concentration had no evident effect on the intracellular starch content.
The model for the variable response intracellular star-ch content was validated from the F distribution (Table 4) that suggested the existence of a quadratic relationship between the variables, indicating that the proposed model fitted the experimental data well.
The effect of operational conditions on starch productivity As Table 2 shows, the highest starch productivity rea-ched 9.93 mg L
-1 h
-1 (run 17), and the result was higher
than those obtained by Maeda et al. (2006), who obtained intracellular starch productivity of 4.1 mg L
−1 h
−1
(calculated) for the microalga Chlamydomonas sp. in a turbidostat culture. According Equation 7, the rate of starch production is the result of biomass productivity and intracellular starch content. Hence, the change in starch productivity was a combined action of the biomass productivity and the intracellular starch content. When compared with the previous two responses, the optimal region of the contour curve (Figure 4) with starch pro-ductivity as the response was most inclined to the central region. This means that carrying out the cultivation under moderate, initial biomass concentrations and CO2 atmos-phere was favored and the intracellular starch produc-tivity was increased.
As Table 3 shows, the effect of the first three terms on starch productivity in order of importance is the gas flow rate (L), the initial biomass concentration (Q), the interac-tion between the initial biomass concentration (L) and the gas flow rate (L). The other factors and interactions showed a less important statistical significance. Accor-ding to Table 3, the statistical model for the variable response starch productivity can be obtained (Equation 10):
2 2 2
1 2 3 1 2 3 1 2 1 3 2 39.77 0.06 1.90 0.46 1.75 1.38 1.37 1.51 0.005 0.59Y X X X X X X XX XX X X= − + − − − − − − −
(10) According to the statistical model and the contour curves, starch productivity can reach the maximum predicted value of 10.85 mg L
-1 h
-1 when the initial biomass con-
centration is 1340 mg L-1
, the gas flow rate is 0.30 V V-1
m
-1 and the CO2 concentration is 8.1% (Table 5). The model for the variable response starch productivity
was validated from the F distribution (Table 4), which suggested the existence of a quadratic relationship bet-ween the variables, indicating that the proposed model fitted the experimental data well.
Simultaneous optimization of two responses In the above results, the maximal CO2 fixation rate and starch productivity were obtained in different optimal re-gions. However, in this study, the objective was given a proper compromise region in which the CO2 fixation rate and starch productivity were at a satisfactory level. Taking this into consideration, a DFA was used to find the best compromise between the two responses based on the mathematical models constructed in RSM.
The responses, CO2 fixation rate (Y1) and starch pro-ductivity (Y2), were transformed into the corresponding desirability scales d1 and d2, and D was obtained according to Equations 3 and 4. During this step, it should be noted that stringency can be added to a chosen predicted optimum by increasing or decreasing the Y*i and Yi* used during optimization. In this study, with the goal of choosing the optimal operational condi-tions for both CO2 fixation rate and starch productivity simultaneously, it proved sufficient to use Y*I equal to the highest and Yi* equal to the lowest observed value in the experimental range, respectively.
The contour curves (Figure 5) show the overall desir-ability D as a function of the factors studied. The visible similarity of Figures 4 and 5 indicate that the DFA optimized region was close to the optimal region for Ps and was relatively removed from the optimal region for Rc. As a result, the predicted values of responses in the optimal region for Ps and the DFA-optimized region had no evident difference (Table 5) except a slightly higher CO2 fixation rate. From the angle of CO2 utilization efficiency and biomass productivity, the DFA-optimized region was advisable. On the other hand, when com-pared with the optimal region for Rc, the DFA-predicted Ps reached 10.63 mg L
-1 h
-1, which was much higher than
that of the optimal region for Rc (7.49 mg L-1
h-1
). This meant that starch productivity was more sensitive than the CO2 fixation rate for changing operational conditions. Optimal culture conditions validation
As from the DFA optimization (Table 5), which suggested

Zheng et al. 1897
Figure 3. Contour curves for the variable starch content.
maintaining the initial biomass concentration at 1120 mg L
-1, fixing gas flow rate at 0.35 V V
-1 m
-1 and injecting air
enriched with 6.9% CO2, cultures were carried out
under these conditions in order to prove its validity. The results showed that the predicted value of DFA optimiza-tion fitted the experimental data well. The validated value

1898 Afr. J. Biotechnol.
Figure 4. Contour curves for the variable starch productivity.
of Rc (55.15 mg L
-1h
-1) was almost invariable and the
value of Ps (10.66 mg L
-1h
-1), which increased to 7.4%
when compared with the maximum values of previous
optimized experiments (Table 2). It was concluded that the optimization of DFA can present compromises at which the CO2 fixation rate and starch productivity can be in

Zheng et al. 1899
Figure 5. Contour curves for the DFA optimization.

1900 Afr. J. Biotechnol. desired levels. Conclusions The initial biomass concentration in the bioreactor, the gas flow rate and the CO2 concentration in the culture were determining factors in the carbon fixation and starch accumulation processes of the marine microalga T. subcordiform. During the course of optimization, RSM was adequate for determining the effects of the factors and the processes were fitted to a model. By the optimi-zation of the combined RSM and DFA, the CO2 fixation rate and starch productivity was obtained at the levels of 55.15 mg L
-1 h
-1 and 10.66 mg L
-1 h
-1, respectively, under
operational conditions of maintaining the initial biomass concentration at 1120 mg L
-1, fixing the gas flow rate at
0.35 V V-1
m-1
and injecting air enriched with 6.9% CO2. These results suggest the potential for applying T.subcordiform to CO2 mitigation and starch production. ACKNOWLEDGEMENTS This work was funded by the Special Funds for National Key Basic Research Program of China “973 Program” (2009CB220004), the National High Technology Research and Development Program of China “863 Program” (2006AA05Z106), the National Natural Science Foundation of China (20806081), the Knowledge Innovation Program of the Chinese Academy of Sciences (KSCX2-YW-G-073), the Knowledge Innovation Program of the Chinese Academy of Sciences (KSCX2-YW-373-2), Knowledge Innovation Program of the Chinese Aca-demy of Sciences (KGCX2-YW-223), the Natural Science Foundation of Liaoning Province (20082152) and the Knowledge Innovation Program of the Chinese Academy of Sciences (KSCX2-YW-G-002). REFERENCES Bartual A, Galvez JA (2002). Growth and biochemical composition of
the diatom phaeodactylum tricornutum at different pH and inorganic carbon levels under saturating and subsaturating light regimes. Botanica. Marina, 45: 491-501.
Brindley Alías C, García-Malea López MC, Acién Fernández FG, Fernández Sevilla JM, García Sánchez JL, Molina Grima E (2004). Influence of Power Supply in the Feasibility of Phaeodactylum tricornutum Cultures. Biotechnol. Bioeng. 87: 723-733.
Burrows EH, Chaplen FWR, Ely RL (2008). Optimization of media nutrient composition for increased photofermentative hydrogen production by Synechocystis sp. PCC 6803. Int. J. Hydrogen Energy, 33: 6092-6099.
Cheng L, Zhang L, Chen H, Gao C (2006). Carbon dioxide removal from air by microalgae cultured in a membrane-photobioreactor. Sep. Purif. Technol. 50: 324-329.
Chiu SY, Kao CY, Chen CH, Kuan TC, Ong SC, Lin CS (2008). Reduction of CO2 by a high-density culture of Chlorella sp. in a semicontinuous photobioreactor. Bioresour. Technol. 99: 3389-3396.
Chiu SY, Kao CY, Tsai MT, Ong SC, Chen CH, Lin CS (2009). Lipid accumulation and CO2 utilization of Nannochloropsis oculata in
response to CO2 aeration. Bioresour. Technol. 100: 833-838. De Castro Araújo S, Garcia VMT (2005). Growth and biochemical
composition of the diatom Chaetoceros cf. wighamii brightwell under
different temperature, salinity and carbon dioxide levels. I. Protein, carbohydrates and lipids. Aquaculture, 246: 405-412.
Derringer G, Suich R (1980). Simultaneous optimization of several response variables. J. Qual. Technol. 12: 214-219.
Fabregas J, Ferron L, Abalde J, Cabezas B, Otero A (1995). Changes in the gross chemical composition of mass cultures of the marine microalga Dunaliella tertiolecta with difference aeration rates. Bioresour. Technol. 53: 185-188.
Foyer CH, Noctor G (2000). Oxygen processing in photosynthesis: regulation and signaling. New Phytol. 146: 359-388.
González López CV, Acién Fernández FG, Fernández Sevilla JM, Sánchez Fernández JF, Cerón García MC, Molina Grima E (2009). Utilization of the cyanobacteria Anabaena sp. ATCC 33047 in CO2 removal processes. Bioresour. Technol. 100: 5904-5910.
Guo Z, Chen Z, Zhang W, Yu X, Jin M (2008). Improved hydrogen photoproduction regulated by carbonylcyanide m-chlorophenylhrazone from marine green alga Platymonas subcordiformis grown in CO2-supplemented air bubble column
bioreactor. Biotechnol. Lett. 30: 877-883. Harun R, Danquah MK, Forde GM (2010). Microalgal biomass as
fermentation feedstock for bioethanol production. J. Chem. Technol. Biotechnol. 85: 199-203.
Hirayama S, Ueda R, Ogushi Y, Hirano A, Samejima Y, Hon-Nami K, Kunito S (1998). Ethanol Production from Carbon Dioxide by Fermentative Microalgae. Stud. Surf. Sci. Catal. 114: 657-660.
Hsueh HT, Li WJ, Chen HH, Chu H (2009). Carbon bio-fixation by photosynthesis of Thermosynechococcus sp. CL-1 and Nannochloropsis oculta. J. Photochem. Photobiol. B. 95: 33-39.
Hu Q, Kurano N, Kawachi M, Iwasaki I (1998). Ultrahigh-cell-density culture of a marine green alga Chlorococcum littorale in a flat-plate
photobioreactor. Appl. Microbiol. Biotechnol. 49: 655-662. IEA (2009). World energy outlook 2009. International Energy Agency,
Paris. Iwasaki I, Hu Q, Kurano N, Miyachi S (1998). Effect of extremely high-
CO2 stress on energy distribution between photosystem I and photosystem II in a 'high-CO2' tolerant green alga, Chlorococcum littorale and the intolerant green alga Stichococcus bacillaris. J. Photochem. Photobiol. B. 44: 184-190.
Izumo A, Fujiwara S, Oyama Y, Satoh A, Fujita N, Nakamura Y, Tsuzuki M (2007). Physicochemical properties of starch in Chlorella change depending on the CO2 concentration during growth: Comparison of structure and properties of pyrenoid and stroma starch. Plant Sci. 172: 1138-1147.
Jacob-Lopes E, Lacerda LMCF, Franco TT (2008). Biomass production and carbon dioxide fixation by Aphanothece microscopica Nägeli in a bubble column photobioreactor. Biochem. Eng. J. 40: 27-34.
Klein U, Betz A (1978). Fermentative metabolism of hydrogen-evolving Chlamydomonas moewusii. Plant Physiol. 61: 953-956.
Lee YK, Shen H (2004). Basic culturing techniques. In: Richmond A (ed). Handbook of Microalgal Culture. Blackwell Publishing, pp. 40-56.
Li J, Ma C, Ma Y, Li Y, Zhou W, Xu P (2007). Medium optimization by combination of response surface methodology and desirability function: an application in glutamine production. Appl. Microbiol. Biotechnol. 74: 563-571.
Maeda I, Seto Y, Ueda S, Cheng Y, Hari J, Kawase M, Miyasaka H, Yagi K (2006). Simultaneous control of turbidity and dilution rate through adjustment of medium composition in semi-continuous Chlamydomonas cultures. Biotechnol. Bioeng. 94: 722-729.
Mandal S, Mallick N (2009). Microalga Scenedesmus obliquus as a potential source for biodiesel production. Appl. Microbiol. Biotechnol. 84: 281-291.
Mathews J, Wang G (2009). Metabolic pathway engineering for enhanced biohydrogen production. Int. J. Hydrogen Energy, 34: 7404-7416.
Matsumoto M, Yokouchi H, Suzuki N, Ohata H, Matsunaga T (2003). Saccharification of marine microalgae using marine bacteria for ethanol production. Appl. Biochem. Biotechnol. 105: 247-254.
Merchuk JC, Rosenblat Y, Berzin I (2007). Fluid flow and mass transfer

in a counter-current gas-liquid inclined tubes photo-bioreactor. Chem. Eng. Sci. 62: 7414-7425.
Oddone GM, Lan CQ, Rawsthorne H, Mills DA, Block DE (2007). Optimization of fed-batch production of the model recombinant protein GFP in lactococcus lactis. Biotechnol. Bioeng. 96: 1127-1138.
Ramanan R, Kannan K, Deshkar A, Yadav R, Chakrabarti T (2010). Enhanced algal CO2 sequestration through calcite deposition by Chlorella sp. and Spirulina platensis in a mini-raceway pond.
Bioresour. Technol. 101: 2616-2622. Ryu HJ, Oh KK, Kim YS (2009). Optimization of the influential factors
for the improvement of CO2 utilization efficiency and CO2 mass transfer rate. J. Ind. Eng. Chem. 15: 471-475.
Talbot P, Lencki RW, de la Nouie J (1990). Carbon dioxide absorption characterization of a bioreactor for biomass production of Phormidium bohneri: comparative study of three types of diffuser. J. Appl. Phycol. 2: 341-350.
Zheng et al. 1901 Yoon JH, Shin JH, Park TH (2008). Characterization of factors
influencing the growth of Anabaena variabilis in a bubble column reactor. Bioresour. Technol. 99: 1204-1210.
Yun YS, Lee SB, Park JM, Lee C, Yang JW (1997). Carbon dioxide fixation by algal cultivation using wastewater nutrients. J. Chem. Technol. Biotechnol. 69: 451-455.
Zhang K, Kurano N, Miyachi S (2002). Optimized aeration by carbon dioxide gas for microalgal production and mass transfer characterization in a vertical flat-plate photobioreactor. Bioprocess. Biosyst. Eng. 25: 97-101.