optimising quality-of-service for the composition of electronic … · 2017-10-30 · optimising...
TRANSCRIPT

Optimising Quality-of-Servicefor the Composition of Electronic Services
vorgelegt vonDiplom-IngenieurMichael C. Jager
Von der Fakultat IV – Elektrotechnik und Informatik –der Technischen Universitat Berlin
zur Erlangung des akademischen GradesDoktor der Ingenieurwissenschaften
– Dr.-Ing. –
genehmigte Dissertation
Promotionsausschuss:
Vorsitzender: Professor Dr. Hans-Ulrich HeißGutachter: Professor Dr. Bernd Mahr
Professor Dr. Robert Tolksdorf
Tag der wissenschaftlichen Aussprache:
1. Dezember 2006
Berlin 2007D 83

ii

.
iii

.
iv

Zusammenfassung
Kompositionen aus elektronischen Diensten finden in Softwaresystemen Verwen-dung, die bei der Umsetzung von prozess-orientierten Vorgangen in Unterneh-men, so-genannten Geschaftsprozessen, zum Einsatz kommen. Dies begrundetsich darin, dass Kompositionen aus elektronischen Diensten und Geschaftsprozessegemeinsame Charakteristiken besitzen. Daher sind Dienstkompositionen fur dieRealisierung von Geschaftsprozessen besonders geeignet.
Um eine Komposition aus individuellen Diensten zusammen zu stellen, wer-den Dienstvermittler herangezogen, die anhand von Anforderungsbeschreibungengeeignete Dienste identifizieren. Dabei konnen Optimierungskriterien berucksich-tigt werden, um die Eigenschaften der Komposition zu verbessern. Als Opti-mierungskriterien dienen in dem berucksichtigten Anwendungsszenario quantifi-zierbare Dienstguteigenschaften. Sollen mehrere Kriterien gleichzeitig beruck-sichtigt werden, entsteht ein Optimierungsproblem, das in einem unpraktikablenAufwand resultieren kann. Fur dieses Problem soll die Anwendbarkeit von heuris-tischen Algorithmen untersucht werden. Der Ansatz heuristische Algorithmen aufdieses Problem anzuwenden ist neu und bedarf daher einer Untersuchung: Heu-ristische Verfahren konnen die optimale Losung nicht garantieren. Eine zu beant-wortende Frage ist daher, welche Eigenschaften Annaherungen im Vergleich zueiner optimalen Losung aufweisen.
Zunachst wird ein Verfahren entwickelt, um die Dienstguteeigenschaften einerDienstkomposition zu berechnen. Fur die Problemstellung ist dieses Verfahrennotwendig, um bei der Auswahl eines einzelnen Dienstes die Auswirkungen aufdie Komposition zu bestimmen. Basierend auf diesem Verfahren wird ein Modellfur das Problem definiert. Anhand dieses Modells wird der Bezug zu verwandtenProblemstellungen verdeutlicht und der resultierende Aufwand zur Losung desProblems diskutiert. Daruber hinaus wird anhand des Problemmodells die An-wendung der heuristischen Algorithmen erklart.
Mit der Implementierung einer Simulation wird die Leistungsfahigkeit der heu-ristischen Algorithmen untersucht. Der Begriff der Leistungsfahigkeit bezieht sichhierbei auf die Berechnungsdauer und auf die Dienstguteeigenschaften der Kom-position resultierend aus der jeweilig ermittelten Losung bzw. Annahrung. DieErgebnisse durchgefuhrter Simulationen ermoglichen eine quantitative Bewertungder implementierten Algorithmen im Vergleich zueinander als auch den Vergleichzu einem Verfahren, das die optimale Losung garantiert.
v

vi

Summary
Electronic services and their composition gain a growing interest from businessesthat intend to implement their processes with software systems. The general char-acteristics of electronic services resemble the idea of process-orientation as pro-posed by the business process re-engineering initiative introduced in the 90s. Thus,the software industry promotes developing service compositions in order to effi-ciently implement business processes.
The development of service compositions involves service brokers. These bro-kers implement a trading functionality in order to identify the suitable servicesbased on requirement descriptions. The trading functionality can also consider dif-ferent optimisation criteria in order to optimise the resulting composition. In theproposed application scenario, numerical Quality-of-Service (QoS) characteristicsusually serve as optimisation criteria. When multiple criteria have to be consideredat once, an optimisation problem arises that can result in an unfeasible computa-tional effort. A novel approach for this problem is to apply heuristic algorithms.This approach requires a discussion, because heuristic algorithms do not guaranteeto find the optimal solution. The question is how well the approximations comparewith the optimal solution referring to the resulting QoS of the composition.
Based on the characteristics of the application scenario a method is developedfor computing the QoS of compositions based on the QoS statements of the in-volved services. A QoS-based selection must use such a method in order to deter-mine the QoS of the entire composition when selecting individual services. Basedon this method, a model for the problem of QoS-based selection is defined. Themodel enables the understanding about the problem and it also serves as the refer-ence for the discussion about the relations to other combinatorial problems. More-over, the problem model is used for the explanation of the heuristic algorithmsapplied to the selection problem.
Based on the problem model and the relevant QoS concepts, the implemen-tation of a simulation provides the evaluation of the performance of the heuristicalgorithms. The simulation presents measures based on the resulting QoS of thecomposition and the computation time. The results from conducted simulation runsallow the comparison among the algorithms and with a method that always findsthe optimal solution.
vii

viii

Contents
1 Introduction 11.1 Service Trading . . . . . . . . . . . . . . . . . . . . . . . . . . . 4
1.1.1 Trading to Form Compositions . . . . . . . . . . . . . . . 71.2 Problem Statement . . . . . . . . . . . . . . . . . . . . . . . . . 10
1.2.1 Research Issues . . . . . . . . . . . . . . . . . . . . . . . 111.3 Structure of the Thesis . . . . . . . . . . . . . . . . . . . . . . . 12
2 Workflows, Business Processesand Service Compositions 152.1 Business Processes . . . . . . . . . . . . . . . . . . . . . . . . . 15
2.1.1 Definition of Business Processes . . . . . . . . . . . . . . 172.1.2 Modelling Business Processes . . . . . . . . . . . . . . . 18
2.2 Workflow Management . . . . . . . . . . . . . . . . . . . . . . . 202.2.1 Modelling Workflows . . . . . . . . . . . . . . . . . . . 22
2.3 Workflows versus Business Processes . . . . . . . . . . . . . . . 242.4 Realising Business Processes and Workflows . . . . . . . . . . . 26
2.4.1 Modelling Service Compositions . . . . . . . . . . . . . . 27
3 Quality-of-Service in Service Compositions 333.1 Exchange of Quality-of-Service Information . . . . . . . . . . . . 35
3.1.1 Quality-of-Service in a Service-Oriented Architecture . . 363.1.2 The Role of the Retailer . . . . . . . . . . . . . . . . . . 39
3.2 Quality-of-Service Characteristics . . . . . . . . . . . . . . . . . 443.2.1 Quality-of-Service Characteristics for Web Services . . . 463.2.2 Summary of Quality-of-Service Characteristics . . . . . . 49
4 Aggregation of the Quality-of-Servicein Service Compositions 514.1 The Business Process Execution Language . . . . . . . . . . . . . 524.2 Workflow Patterns . . . . . . . . . . . . . . . . . . . . . . . . . . 534.3 Structural Model of Service Compositions . . . . . . . . . . . . . 574.4 A Method for Quality-of-Service Aggregation . . . . . . . . . . . 64
4.4.1 Aggregation of Throughput . . . . . . . . . . . . . . . . 66
ix

Contents
4.4.2 Aggregation of Response Time . . . . . . . . . . . . . . . 664.4.3 Aggregation of Cost . . . . . . . . . . . . . . . . . . . . 674.4.4 Aggregation of Availability and Reliability . . . . . . . . 684.4.5 Aggregation of Reputation and Fidelity . . . . . . . . . . 694.4.6 Aggregation of Encryption Grade . . . . . . . . . . . . . 70
4.5 Support of Un-Structured Models . . . . . . . . . . . . . . . . . 714.5.1 Open Elements . . . . . . . . . . . . . . . . . . . . . . . 724.5.2 Arbitrary Loops . . . . . . . . . . . . . . . . . . . . . . . 734.5.3 Nested Patterns . . . . . . . . . . . . . . . . . . . . . . . 744.5.4 Transformations to Structured Workflow Models . . . . . 74
4.6 Related Methods for Quality-of-Service Aggregation . . . . . . . 794.7 Aggregation for Quality-of-Service Monitoring . . . . . . . . . . 81
4.7.1 Aggregation of Mean Values . . . . . . . . . . . . . . . . 83
5 Quality-of-Service-based Selection of Services 855.1 Introduction to the Selection Problem . . . . . . . . . . . . . . . 855.2 The Problem Model . . . . . . . . . . . . . . . . . . . . . . . . . 91
5.2.1 The Selection Criteria . . . . . . . . . . . . . . . . . . . 935.2.2 Modelling the Structure . . . . . . . . . . . . . . . . . . 935.2.3 Problem Model Summary . . . . . . . . . . . . . . . . . 945.2.4 Aggregation of Multiple Optimisation Criteria . . . . . . 95
5.3 Relations to Other Combinatorial Problems . . . . . . . . . . . . 965.3.1 The Knapsack Problem . . . . . . . . . . . . . . . . . . . 975.3.2 The Project Scheduling Problem . . . . . . . . . . . . . . 1035.3.3 Query Planning based on Quality-of-Service . . . . . . . 1055.3.4 Routing in the Internet based on Quality-of-Service . . . . 1075.3.5 Computational Complexity . . . . . . . . . . . . . . . . . 109
5.4 Heuristic Algorithms . . . . . . . . . . . . . . . . . . . . . . . . 1125.4.1 Greedy-based Selection . . . . . . . . . . . . . . . . . . 1125.4.2 Discarding Subsets . . . . . . . . . . . . . . . . . . . . . 1135.4.3 Bottom-Up Approximation . . . . . . . . . . . . . . . . . 1165.4.4 Pattern-wise Selection . . . . . . . . . . . . . . . . . . . 1175.4.5 Comparison of the Algorithms . . . . . . . . . . . . . . . 119
6 Evaluation 1216.1 Simulation Model . . . . . . . . . . . . . . . . . . . . . . . . . . 1216.2 Evaluation Methods and Metrics . . . . . . . . . . . . . . . . . . 123
6.2.1 Statistical Measures . . . . . . . . . . . . . . . . . . . . 1246.3 Parameters and Implementation . . . . . . . . . . . . . . . . . . 125
6.3.1 Quality-of-Service Parameters . . . . . . . . . . . . . . . 1266.3.2 Implementation . . . . . . . . . . . . . . . . . . . . . . . 1276.3.3 Technical Details . . . . . . . . . . . . . . . . . . . . . . 129
6.4 Simulation Campaigns and their Results . . . . . . . . . . . . . . 1306.4.1 Increasing Number of Tasks without Constraint (C1) . . . 131
x

Contents
6.4.2 Increasing Number of Tasks with One Constraint (C2) . . 1346.4.3 Increasing Number of Service Candidates (C3) . . . . . . 1386.4.4 Volatility of the Quality-of-Service (C4) . . . . . . . . . . 1426.4.5 Parallel vs. Sequential Composition Structures (C5) . . . 146
6.5 Evaluation Conclusions . . . . . . . . . . . . . . . . . . . . . . . 149
7 Developing Service Compositions 1537.1 Introduction to the Model Driven Architecture . . . . . . . . . . . 154
7.1.1 Model Driven Development of Web Service Compositions 1577.2 Model-Driven Development of Service Compositions . . . . . . . 158
7.2.1 Modelling the Composition . . . . . . . . . . . . . . . . 1607.2.2 Trading: Matchmaking . . . . . . . . . . . . . . . . . . . 1637.2.3 Trading: Quality-of-Service-based Selection of Candidates 1667.2.4 Advertisement and Deployment . . . . . . . . . . . . . . 1677.2.5 Development as an Iterative Process . . . . . . . . . . . . 169
8 Conclusions 1738.1 Summary of Main Contributions . . . . . . . . . . . . . . . . . . 1758.2 Outlook and Future Work . . . . . . . . . . . . . . . . . . . . . . 176
A Specification of theHard- and Software Platform 179
B List of Abbreviations 181
xi

Contents
xii

List of Figures
1.1 Service-Oriented Architecture - The RM-ODP view [50] and itsWeb service counterparts (shown in grey boxes, cf. WSA [11]). . . 5
1.2 The business roles in the TINA [27] and roles in the domain ofWeb service compositions (shown in grey boxes). . . . . . . . . . 8
1.3 A simple example of the QoS-based selection problem. . . . . . . 9
2.1 The roles of a business process model. . . . . . . . . . . . . . . . 182.2 The roles of business process and workflow models. . . . . . . . . 252.3 The relation between business process, workflow and service com-
position models. . . . . . . . . . . . . . . . . . . . . . . . . . . . 302.4 Release dates of service composition languages. . . . . . . . . . . 312.5 The role of the service composition model. . . . . . . . . . . . . . 32
3.1 Flow of QoS information without involving a broker. . . . . . . . 403.2 Flow of QoS information involving a broker. . . . . . . . . . . . . 413.3 Flow of QoS information involving dedicated brokers. . . . . . . 42
4.1 Composition patterns. . . . . . . . . . . . . . . . . . . . . . . . . 604.2 Example of join-relevant aggregation of response time. . . . . . . 614.3 Collapsing the graph step by step. . . . . . . . . . . . . . . . . . 644.4 Examples of open parallel structures. . . . . . . . . . . . . . . . . 734.5 Examples of loops. . . . . . . . . . . . . . . . . . . . . . . . . . 744.6 Examples of nested patterns. . . . . . . . . . . . . . . . . . . . . 754.7 Open parallel and arbitrary loop structures and possible transfor-
mations. . . . . . . . . . . . . . . . . . . . . . . . . . . . . . . . 764.8 Structures that contain nested parallelism. . . . . . . . . . . . . . 774.9 Structures that contain nested parallelism and possible transforma-
tions. . . . . . . . . . . . . . . . . . . . . . . . . . . . . . . . . . 784.10 Example for the aggregation based on a critical path. . . . . . . . 80
5.1 Relation between the MCKP and the selection problem. . . . . . . 875.2 Relation between the MCKP and the integer linear and non-linear
variant of the selection problem. . . . . . . . . . . . . . . . . . . 885.3 Composition structure that contains parallelism. . . . . . . . . . . 89
xiii

List of Figures
5.4 Relation between the MCKP and the selection problem involvingthe number of constraints. . . . . . . . . . . . . . . . . . . . . . . 90
5.5 Summary of relations between the MCKP and the selection problem. 915.6 Relation between the MCKP, the MMKP and the selection problem. 995.7 Graphical representation of the example selection problem (with
candidates in rectangular boxes). . . . . . . . . . . . . . . . . . . 1025.8 Relation between the RCPSP and the selection problem. . . . . . 1055.9 Relation between the QoS-based evaluation of queries and the se-
lection problem. . . . . . . . . . . . . . . . . . . . . . . . . . . . 1075.10 Reduction of the MCKP to the selection problem. . . . . . . . . . 1115.11 Example processing order of bottomup heuristic. . . . . . . . . . 116
6.1 Main steps of performing a simulation run. . . . . . . . . . . . . . 1236.2 Relative QoS to constraint selection (C1, with 5 candidates). . . . 1326.3 Computation times of selection methods (C1, with 5 candidates). . 1326.4 Histogram of computation times of the pattern method (C1, setup
with 12 tasks). . . . . . . . . . . . . . . . . . . . . . . . . . . . . 1336.5 Histogram of computation times of the global method (C1, setup
with 12 tasks). . . . . . . . . . . . . . . . . . . . . . . . . . . . . 1336.6 Relative QoS to constraint selection (C2, with 5 candidates). . . . 1356.7 Computation times (C2 with 5 candidates). . . . . . . . . . . . . 1356.8 Histogram of computation times of the discarding method (C2,
with 12 tasks). . . . . . . . . . . . . . . . . . . . . . . . . . . . . 1376.9 Histogram of computation times of the bottomup method (C2, with
12 tasks). . . . . . . . . . . . . . . . . . . . . . . . . . . . . . . 1376.10 Relative QoS to constraint selection of optimisation-only methods
(C3). . . . . . . . . . . . . . . . . . . . . . . . . . . . . . . . . . 1396.11 Relative QoS to constraint selection of constraint-aware methods
(C3). . . . . . . . . . . . . . . . . . . . . . . . . . . . . . . . . . 1396.12 Computation duration of optimisation-only methods (C3). . . . . 1396.13 Computation duration of constraint-aware methods (C3). . . . . . 1396.14 Histogram of computation times for the local method (C3, 11 can-
didates). . . . . . . . . . . . . . . . . . . . . . . . . . . . . . . . 1416.15 Histogram of computation times for the pattern method (C3, 11
candidates). . . . . . . . . . . . . . . . . . . . . . . . . . . . . . 1416.16 Rel. QoS to constr. selection: optimisation-only methods (C4). . . 1446.17 Rel. QoS to constr. selection: constraint-aware methods (C4). . . 1446.18 Rel. QoS to random selection: optimisation-only methods (C4). . 1446.19 Rel. QoS to random selection: constraint-aware methods (C4). . . 1446.20 Computation duration: optimisation-only methods (C4). . . . . . 1456.21 Computation duration: constraint-aware methods (C4). . . . . . . 1456.22 Relative QoS to constr. selection: optimisation-only methods (C5). 1486.23 Relative QoS to constr. selection: constraint-aware methods (C5). 1486.24 Computation duration: optimisation-only methods (C5). . . . . . 148
xiv

List of Figures
6.25 Computation duration: constraint-aware methods (C5). . . . . . . 148
7.1 Separation of the models in the MDA (based on OMG’s MDA doc-ument [96, section 2.3]). . . . . . . . . . . . . . . . . . . . . . . 155
7.2 The evolution of the models in the MDA (based on Bezivin et al. [9]).1567.3 Main steps of developing service compositions. . . . . . . . . . . 1597.4 First step: modelling the composition. . . . . . . . . . . . . . . . 1617.5 Proposed taxonomy of service descriptions. . . . . . . . . . . . . 1647.6 Second step: matchmaking. . . . . . . . . . . . . . . . . . . . . . 1667.7 Third step: QoS-based selection of candidates. . . . . . . . . . . . 1677.8 Fourth step: advertisement and deployment. . . . . . . . . . . . . 1687.9 The iterative development process. . . . . . . . . . . . . . . . . . 171
xv

List of Figures
xvi

List of Tables
2.1 Overview: Web service composition languages. . . . . . . . . . . 29
3.1 QoS-based trading in the domain of Web services. . . . . . . . . . 383.2 QoS characteristics in the domain of Web services. . . . . . . . . 493.3 Summary of QoS characteristics . . . . . . . . . . . . . . . . . . 50
4.1 Workflow patterns [146] and their relevance for the QoS aggregation. 554.2 Aggregation rules for throughput. . . . . . . . . . . . . . . . . . 674.3 Aggregation rules for the response time. . . . . . . . . . . . . . . 684.4 Aggregation rules for the cost. . . . . . . . . . . . . . . . . . . . 684.5 Aggregation rules for the availability. . . . . . . . . . . . . . . . 694.6 Aggregation rules for the mean reputation and the encryption level. 714.7 Aggregation rules for the mean response time and the mean cost. . 84
5.1 Array values resulting from dynamic programming approach. . . . 1035.2 Summary of introduced heuristic algorithms. . . . . . . . . . . . 119
6.1 Availability rates and resulting downtimes by Kenyon [72, p. 411]. 1276.2 Parameter value ranges of the simulation. . . . . . . . . . . . . . 1286.3 QoS and times, setup with 12 tasks in C1. . . . . . . . . . . . . . 1326.4 QoS and times, setup with 12 tasks in C2. . . . . . . . . . . . . . 1366.5 QoS and times, setup with 11 candidates in C3. . . . . . . . . . . 1406.6 Examples of generated QoS values at different qv. . . . . . . . . . 1426.7 QoS and times, setup with qv = 2 in C4. . . . . . . . . . . . . . . 1466.8 QoS and times, setup with a parallel probability of 100% in C5. . 149
A.1 Specification of the host system. . . . . . . . . . . . . . . . . . . 179
xvii

List of Tables
xviii

Chapter 1
Introduction
The concept of a service covers many domains of application. In computer science,a couple of attempts to define a service exist in the literature. Often such definitionsuse assumed technical characteristics such as “defined interface” or “available ina network”. However, services exist that are not available in a computer networkand, in general, software components also offer an interface. Such simple examplesmake clear that it is difficult to define services by referencing to characteristics ofexisting examples. The ISO 9004 standard offers a definition of services that isfree from such references [127, section 3.5]:
[A service represents] the results generated, by activities at the in-terface between the supplier and the customer and by supplier-internalactivities to meet customer needs.
The title of this work contains electronic services (e-services) denoting a spe-cial kind of services. The term refers to a service provided by a computer system.Hull et al. also consider the idea that an e-service provides its operations referringto a common purpose, meaning that the different operations of an e-service form aset of interrelated functionality [48]. In addition to these basic characteristics, theyemphasise also the following application of e-services:
... [the goal of e-services is] to have a collection of network-resident software services accessible via standardised protocols, whosefunctionality can be automatically discovered and integrated into ap-plications or composed to form more complex services.
According to this view, the development and application of e-services also an-ticipate their composition. E-services and their compositions are supposed to pro-vide their functionality in a computer network. The Internet represents such anetwork or, in other cases, the network remains in an organisational domain, suchas a company. Regardless of organisational boundaries, e-services use protocolsand software compatible with the Internet (cf. Huhn et al. [47]).
1

In the field of service compositions, two main applications are considered: Thedevelopment of a component-oriented software system represents a first case. Inthis scenario, a software developer arranges individual e-services to create morecomplex software. Considering the provision over a network, this application pre-sumes the ability to discover services in these networks or in the Internet. A soft-ware developer can consider software components that reside outside his organisa-tional scope or local facilities. Software developing companies can provide theirsoftware in the Internet using an e-service infrastructure. Then, customers can in-tegrate these e-services into their software systems. This setup establishes a newmarket of e-services offered by service providers and new profit mechanisms. Ina broader sense, it provides customers with a wider range of products. This appli-cation case represents the motivation for using the Web services proposal by theWorld Wide Web Consortium (in short W3C) [11]. The W3C defines a Web serviceas follows:
A Web service is a software system designed to support interoper-able machine-to-machine interaction over a network. It has an inter-face described in a machine-processable format (specifically WSDL).Other systems interact with the Web service in a manner prescribed byits description using SOAP messages, typically conveyed using HTTPwith an XML serialisation in conjunction with other Web-related stan-dards.
The Web services from the W3C represent a proposal to develop e-servicesusing specific XML-based conventions, languages and using Internet protocols.
The second application case targets the software support of existing businessprocesses or the development of new business processes entirely performing withincomputer systems. Business processes are often associated with workflows. In fact,the Workflow Reference Model published by the Workflow Management Coalition(WfMC) defines a workflow as the implementation of a business process with com-puter systems: The goal of establishing workflows is the facilitation or automationof business processes by using computer systems [45, section 2]. A workflow caninclude the participation of humans, usually actors in a business process. Thiswork, however, will cover only workflows that do not include operations of users,i.e. do not require human interactions, because e-services represent primarily atechnology aiming at the interoperation of software systems.
The use of e-services has already become reality in today’s businesses: Lastyear, a Gartner Group study presented the average numbers of e-services in com-panies and enterprises [107]. According to this study, an average small companydeploys about 25 e-services, while very large enterprises usually have more than1000 of them. In such large enterprises, more than 100 clients access these e-services more than one million times a day.
As one of the first, Bolcer and Kaiser have recognised the rising potentialand introduced a proposal to leverage e-services available in the Internet in or-der to build workflows [10]. Since then, many publications have mentioned the
2

realisation of workflows as the motivating scenario to develop compositions of e-services. Ganesarajah and Lupu have developed a workflow management systembased on compositions of Web services [36]. Hull et al. have discussed the theo-retical foundation of e-service compositions including their application to developworkflows [48]. Patel et al. have recently introduced their SemWebQ frameworkwhich provides the automated discovery and composition of Web services basedon a approach using metadata about e-services to form workflows [105]. In sum-mary, existing research work and the application of e-services in today’s businessesindicate the consensus that software developers can use e-service compositions asthe technical foundation to implement workflows.
Considering the creation of business processes, the motivation arises to ex-plore techniques to design and develop e-service compositions. For this purpose,different solutions already exist. In most cases, the products and development en-vironments cover the currently most popular service architecture: the Web servicesarchitecture from the W3C. This thesis will consider e-services in general and willmention at certain points available technologies in the Web services domain. Inorder to build such e-service compositions, the following main steps are identified:
• Design of the composition. First, a software developer or workflow mod-eller defines and arranges abstract tasks that provide the desired functionalityto form the composition. The outcome is an execution plan and a descriptionof the required e-services. For this step, research work and industry consortiahave already proposed composition languages.
• Discovery and selection of e-service candidates. Based on the descriptionof the required e-services, a discovery process must evaluate available e-services in terms of their suitability for the composition. If more than onee-service suits a particular task, a selection should be based on preferencecriteria. The Reference Model for Open Distributed Processing (RM-ODP),published by the ISO, names the entire process – consisting of discovery andselection – trading [50, section 13]. The trading step results in an assignmentof one or more candidates to the tasks in the composition.
• Provision of the composition. Based on the composition description andthe assignment of available e-services to its tasks, an execution environmentprovides the composition by executing the individual e-services in this pre-defined way. In addition, the composition must be advertised to make futuretrading efforts consider the new composed e-service.
This work focusses on the trading of e-services to form compositions. Morespecifically, this work will discuss methods and algorithms to perform the selectionof discovered e-service candidates based on preference criteria. The discoveryprocess aims at identifying the functional suitability of candidates, whereas theselection assigns the optimal candidates to the tasks of the composition based onthe preference criteria. As criteria the quality-of-service (QoS) is considered.
3

1.1. Service Trading
In general, the design of a system must be concerned with QoS in order to de-liver dependable and consistent functionality. In a work about QoS in workflowmanagement systems, Weikum has explained the importance of this issue [138]:After decades of development and research, database systems offer functionalitywith such characteristics. Today, database systems are known for almost neverloosing data, offering uninterrupted availability and a sustained level of high per-formance. At the time when Weikum has written his text, workflow managementsystems did not offer this level of quality and neither do e-services today. Thisthesis aims at covering one aspect of QoS of e-services in order to improve theirquality for future applications. A detailed discussion about what QoS represents inservice compositions will be presented in a dedicated chapter. Until then, the ISO9004 standard also offers a definition that is considered as a starting point [127,section 3.5]:
[The quality is] the totality of features and characteristics of aproduct or service that bear on its ability to satisfy stated or impliedneeds.
Another more mundane definition is that the QoS denotes how well a serviceprovides its functionality. In the remainder of this work e-services will simply becalled services. The reference to electronic services will be taken for granted.
1.1 Service Trading
As for trading of services, this work considers the trading specification of the RM-ODP [53]. In general, the RM-ODP represents a model of distributed softwaresystems that is independent of particular technologies. The Web services, men-tioned in the previous section, can be seen as an implementation of such a system.Web services represent a popular and widely accepted technology for developinga distributed system. The W3C has introduced different standards and recommen-dations that cover the message exchange between the actors, the description ofinterfaces, behaviour of actors and many further specific aspects of distributed sys-tems, such as security, QoS or monitoring. This thesis takes into considerationWeb services in order to provide practical examples in addition to the theoreticalfoundations of the RM-ODP.
Although the RM-ODP and the RM-ODP trading specification cover many as-pects of open distributed systems and of trading services, they do not cover thetrading of different service types at once in order to build compositions of services.Consequently, trading software referencing the RM-ODP did not focus on this par-ticular form of trading (cf. Kutvonen [76, chapter 3 and chapter 8]). As the previoussection has explained, the idea to build service compositions came up later with thedevelopment of the Web services idea and the propagation of process-orientationin businesses.
4

1.1. Service Trading
However, regarding the basic concepts of an open distributed system, RM-ODP and Web services identify three main actors in a setup that research workdescribes as service-oriented architecture (SOA): (1) a service exporter is a partythat provides a service, (2) a service importer invokes a service and (3) a brokertrades services between ex- and importers. The basic procedures within this setupare as follows:
1. An exporter exports his service description to the broker. A broker is a com-ponent that implements a trading function and facilitates the matchmakingbetween requirements of importers and advertisements of services. The Webservices corner uses the concept of a discovery service to provide a broker.The service description usually covers the interface and the location of theservice.
2. An importer queries the broker whether a service is available by submittinga description about his requirements. The broker compares the requirementswith his available service descriptions and – if available – returns the de-scription and location of the matched services.
3. After receiving the interface and location of a service, the importer starts theinteraction with the matched service. This step is mentioned in the RM-ODPas importing.
1. Service Export 2. Service Query
3. Service ImportImporter Service
RequesterExporter Service
Provider
Broker DiscoveryService
Figure 1.1: Service-Oriented Architecture - The RM-ODP view [50] and its Webservice counterparts (shown in grey boxes, cf. WSA [11]).
Figure 1.1 illustrates this arrangement, with the three basic actors and theirrelations. To facilitate steps 1 and 2, the proposal of the Web services movementfavours a specification called Universal Description Discovery and Integration pub-lished by the OASIS (UDDI, [135]). The UDDI proposal represents the idea of acentralised repository providing broker functionality. Although the UDDI spec-ification has reached its third revision, software developers still do not use suchfacilities. So far, no products or development methodologies utilise the discoveryof services over the Internet. The main problem lies in two aspects: The first aspectincludes an organisational problem. An organisation is not likely to use services
5

1.1. Service Trading
of other organisations revealed by an automated service discovery. Usually, busi-ness relations need a contract or similar explicit agreement. This problem relatesto reputation, trust and contracting issues in this field.
The second problem is that current broker technologies cannot adequately pro-cess the requirements of service importers. Different research groups have alreadyproposed extensions for supporting more sophisticated descriptions about the ser-vice functionality by using semantic service descriptions (cf. Trastour et al. [134],Paolucci et al. [102], Akkiraju et al. [1], or Srinivasan et al. [123]). Other work con-siders QoS requirements as the necessary criteria to identify the suitability of avail-able services. In the field of Web services, several authors, for example Ran [112]or Benatallah et al. [6], have already proposed extending brokers with QoS support.
Regardless of currently evolving research to enhance the discovery of services,the ISO has published a technology-independent foundation for service trading,namely the trading specification as a part of the RM-ODP [53]. This specificationdefines the process of trading as a chain of subsequent isolation operations appliedto the set of available services:
• At the beginning, the set N1 contains all services which the broker has listed.Speaking of Web services, N1 would consist of all services that some UDDIservice contains.
• The first isolation is represented by the set of candidates N2. This set rep-resents the result of a search for a keyword or similar search criteria amongN1. In the Web service domain, a UDDI repository could provide this func-tionality.
• The second isolation is reached by matching functionality. This isolationresults in the third set N3. In this context, matching means comparing de-scriptions from a service exporter with the requirements of an importer. Thisdescription can cover the interface as well as other metadata like organi-sational information. UDDI also covers this issue to some extent, and theabove-mentioned research work on semantic descriptions has the goal to im-prove the efficiency of this step.
• In the third phase, the importer can apply preference criteria, not in order toform a new subset, but to give an order to N3. Usually, statements about therequired QoS represent common preference criteria. Applying preferencecriteria results in a candidate ranking. The outcome of this step is a tuple TO
4
defined by the order O applied to N3: TO4 = (N3, O).
• The last isolation is the result of applying return policies. For example, areturn policy can restrict the answer to return only one candidate (e.g. thebest according to preference criteria). The result is a set N5 with an order,which is based on a subset of N3. This can be also seen as a tuple TO
5 withthe same order O, applied to N5: TO
5 = (N5, O).
6

1.1. Service Trading
In summary, the trading specification defines that |N1| ≥ |N2| ≥ |N3| ≥ |N5|.This definition of trading explains that the QoS-based selection must be performedafter a preceding matchmaking process has determined the functional suitability.The QoS-based selection results in the decision about which service represents theoptimal choice according to the requirements of the service importer.
1.1.1 Trading to Form Compositions
So far, this introduction has discussed the trading of individual services. However,in the case of forming a composition of services, the process requires a new ac-tor. This actor forms the composition by importing services as an importer whilehe is also offering the composed service as an exporter. The TelecommunicationsInformation Networking Architecture (TINA) by the TINA consortium (TINA-C)provides an existing definition about the roles when composing services [27] anddescribes this setup as the TINA Business Model. This model contains the follow-ing roles:
• A Consumer. According to the TINA architecture, a consumer just importsservices provided by the TINA system. As a consequence, a consumer alsoimports a composition of services.
• A Broker. A broker enables stakeholders of the TINA system to find otherstakeholders. In the domain of Web services, the discovery is mainly fo-cussed on finding service providers or retailers.
• A Retailer. In the TINA sense, a retailer provides consumers the accessto services that are originally provided by 3rd party providers. Thus, a re-tailer represents the role that provides consumers also with compositions ofindividual services from 3rd party providers.
• A 3rd Party Service Provider. A 3rd party service provider offers his ser-vices to a retailer or other 3rd party service providers. The self-relating linkfrom a 3rd party provider matches the idea of composing services: A com-posed service may also integrate other composed services as a part of itscomposition.
In addition, the TINA also defines relations among brokers. This relation im-plies that a broker can contact other brokers to enhance the discovery of services.Moreover, a retailer can access services provided by other retailers, which, in thissense, would represent 3rd party providers. Figure 1.2 shows the TINA businessmodel and points out the analogies to an environment of service compositions.1
1The TINA business model mentions a connectivity provider. In the field of Web services, theInternet provider represents the connectivity provider. However, the use of services usually does notinterfere with any aspects of the underlying network protocols in the Internet. Thus, the connectivityprovider is neglected in this discussion.
7

1.1. Service Trading
BrokerBroker or DiscoveryService
Retailer CompositionDesigner
3rd PartyServiceProvider
3rd PartyServiceProvider
Consumer Requester
service advertisements
servicequery
service query
serviceinvocation
serviceinvocation
imports services from other3rd party service providers
contacts other brokers
Figure 1.2: The business roles in the TINA [27] and roles in the domain of Webservice compositions (shown in grey boxes).
The retailer plays the central role in developing and providing compositions. Theretailer has the following characteristics:
• A retailer imports services from 3rd party service providers to integrate themin his composition.
• A retailer queries a broker for discovering services. As for his composed ser-vice, the retailer publishes his offerings of composed services to the brokeras well.
• A retailer provides the composed service to consumers. According to thebusiness model, the retailer also offers his composed service to other retailersas a third party provider from their perspective. Considering this distinction,a consumer represents the concept of an end customer in this setup.
The Special Role of the Retailer
The TINA business model does not mention any role that performs the entire cre-ation process of a composition. Neither is it discussed which role takes whichresponsibility when forming compositions. In this thesis, the creation process isassigned to the retailer; the retailer represents the developer and provider of thecomposition. The previous section has introduced the different steps of trading. Abroker could cover the complete trading functionality as described by these steps.However, when forming a composition, the trading involves an acting party withknowledge about the entire composition aiming at optimising the trading result.The TINA business model provides two actors, the retailer and the broker, for thistrading process. It is clear that a broker is generally capable of trading individualservices.
8

1.1. Service Trading
However, the trading of multiple services to form a composition requires spe-cial consideration. For example, a retailer can consider the requirement that theexecution of the integrated services will not exceed a given duration. From the lo-cal perspective of the broker when trading individual services, such trading cannotmeet global requirements. Thus, the retailer must perform the trading of individualservices from a global perspective in order to ensure the desired result. Havinglooked at the trading specification and the TINA, the topic of this thesis can benarrowed down in the following way:
The QoS-based selection involves QoS as preference criteria as apart of a trading process. If a retailer builds a composition, he canperform a QoS-based selection on the service candidates in order tooptimise the resulting QoS of the composition.
One issue still remains open: where precisely lies the difficulty of the QoS-based selection? The before-mentioned argumentation implies that an issue existswith the trading of services and requires a global view on the composition. Thefollowing example clarifies the difference between trading from a local and from aglobal perspective: Figure 1.3 shows a model of an example composition.
Task A
Task D
Task CTask B
Candidate 1:exec time: 160
cost: 8
Candidate 2:exec time: 250
cost: 6
Candidate 3:exec time: 210
cost: 5
Candidate 1:exec time: 30
cost: 6
Candidate 2:exec time: 70
cost: 5
Candidate 3:exec time: 100
cost: 4
Figure 1.3: A simple example of the QoS-based selection problem.
This composition consists of four tasks. After executing the first task A, twosubsequent tasks B and C are executed simultaneously. Then, after both tasks arefinished, a fourth task D is executed. Considering the parallel arrangement of thetwo tasks B and C, it is assumed that a preceding matchmaking process has iden-tified three service candidates for each task, each providing different QoS. In ad-dition, it is assumed that the optimisation goal is to form the quickest compositionwith the lowest cost. In the given example, the quickest candidate for task C needslonger than any candidate for task B. Consequently, the optimal assignment forthe task C is candidate 3. A selection from a local perspective, as performed by a
9

1.2. Problem Statement
broker without knowledge about the composition, would have identified candidate2 for task C. Clearly, this would have resulted in a higher cost for the composition.
An approach from a global perspective would consider this potential optimi-sation. A naıve algorithm simply evaluates all possible combinations. This thesisexplains that a combinatorial problem arises from this strategy. Using a naıveapproach can result in unfeasible efforts. If the number of candidates increasesby one, the number of combinations to evaluate is doubled. More tasks in thecomposition will result in a higher number of candidates as well. The quicklyrising computational effort poses a problem for the retailer when performing theQoS-based selection for larger compositions. Thus, this thesis concentrates ondiscussing the problem and on evaluating the application of heuristic algorithms.Such approaches may identify the optimisation as outlined in the example and leadto adequate results while showing lower computational efforts in comparison to anaıve approach.
1.2 Problem Statement
The previous sections explained the motivation of this thesis, narrowed down itstopic and explained the discussed problem. Based on these, a problem statement isformulated:
A retailer that builds a service composition can improve the pro-vided QoS of the composition by means of a QoS-based selection thatconsiders the QoS of the individual service candidates.The QoS-based selection results in a combinatorial problem of quicklyrising computational efforts for a growing number of candidates. Thedevelopment of heuristic methods for solving this combinatorial prob-lem represents a novel approach. In order to assess the feasibility ofthis approach, the performance of the algorithms when applied to theselection problem must be evaluated.
The foundation for the outlined discussion and assessment is a problem modelof the selection problem. Based on this model, the application heuristic algorithmscan be explained and their efforts can be discussed. The problem model can alsoserve as the foundation for the implementation of a simulation for performanceevaluations. In conjunction with the definition of appropriate metrics, the per-formance penalty of the heuristic approaches can be assessed. This discussion isbased on findings and techniques that require an explanation in advance. Thus, theargumentation is divided into four steps building on each other:
1. Determining the QoS of Compositions. In order to evaluate the QoS op-timisation performance of the considered heuristics, a method is presentedthat determines the QoS of the composition based on the provided QoS ofthe individual services. To ensure its applicability, this method must not be
10

1.2. Problem Statement
limited to specific QoS measures used in particular application cases. More-over, it must be capable of processing different compositions, referring totheir structure and size.
2. Modelling the Problem of a QoS-based Selection of Services. A problemmodel is presented that allows understanding the combinatorial issue withthe QoS-based selection. Based on the problem model, the relation to relatedproblems can be discussed in a more precise manner.
3. Explanation of the Heuristic Algorithms. Different heuristic algorithmsare proposed and their implementation is discussed. Some heuristic ap-proaches exist for other combinatorial problems such as the knapsack prob-lem. The goal of this discussion is the potential evaluation of existing heuris-tics with regard to their suitability for the problem of QoS-based selection.
4. Evaluation of Heuristic Algorithms. An implementation of the simulationperforms the algorithms for their evaluation. A first part covers the setup ofthe simulation and its set parameters. It is expected that the heuristics willperform differently, depending on, for example, the structural characteristicsof the composition or on the variance of the provided QoS by the servicecandidates. Based on this, different simulation campaigns are defined. Byvarying parameters and setup, the simulation results indicate specific weak-nesses or strengths of the heuristics.
1.2.1 Research Issues
The previously explained parts of the argumentation cover different open researchissues. In order to provide the argumentation as outlined, the following crucialresearch questions must be covered:
• Aggregation Method. Different methods already exist for the aggregationof QoS in service compositions. However, these methods either discuss spe-cific QoS characteristics such as response time or cost (cf. Yu and Lin [158])or they focus on compositions that consist of a sequential execution of ser-vices (cf. Lee [78]).
Apart from the composition of services, aggregation methods exist that coverthe execution time of software in real-time environments (cf. Puschner andSchedl [111]) or the aggregation of the QoS in workflows (cf. Cardoso [15]).Based on the existing research work, the presented aggregation method sup-ports different QoS characteristics and is tailored to the possible structuresas found in service compositions.
• Problem Model. Different research work also discusses the combinatorialproblem that arises when a QoS-based selection is performed to form com-positions (cf. Lee [78], Zeng et al. [159], Yu and Lin [158]). But, similar
11

1.3. Structure of the Thesis
to the aggregation method, existing discussions consider only specific QoScategories, i.e. response time and cost (cf. Lee [78], Yu and Lin [158]), orthey reduce the problem to a sequential execution of services (cf. Lee [78],Yu and Lin [158]).
All three mentioned research efforts in this area define the problem of theQoS-based selection as a variant of a knapsack problem, namely the multiple-choice knapsack problem (MCKP, cf. Lee [78], Zeng et al. [159], Yu andLin [158]). Consequently, the approach is to apply existing solutions to theMCKP in order to perform the QoS-based selection. This thesis explains,why this represents a simplification that does not cover all problem cases:very briefly, the MCKP-approach is tied to QoS characteristics that result inan integer linear optimisation statements and also covers mainly a sequentialexecution of services. In contrast to this, a problem model is defined thatis independent of particular QoS categories, covers different structural ele-ments found in compositions and, thus, is not equivalent to the MCKP. Then,existing solutions cannot be applied. As a consequence, the application ofheuristics is discussed as an approach to deliver near-optimal solutions whilerequiring reduced efforts as compared to methods that guarantee optimal so-lutions.
• Simulation Setup. Results from previous research about a simulation en-vironment for the QoS-based selection have shown that the efficiency ofthe applied heuristic algorithms depends on different simulation parameters(cf. Jaeger and Goldmann [62]). Thus, the goal is to deduce from existingstudies the nature of the needed parameters in order to design realistic simu-lation conditions.
Furthermore, this thesis identifies the impact of the simulation parameters onthe efficiency of the heuristic algorithms. For this, different simulation cam-paigns will examine the particular impact of different parameters. Then, theevaluation of the heuristic algorithms provides more precise findings abouttheir strengths and weaknesses.
1.3 Structure of the Thesis
The structure of this thesis follows the argumentation of the previous section. Be-fore the argumentation starts, Chapter 2 clarifies in detail the origin of servicecompositions and their main application, which is the implementation of businessprocesses. It also discusses the relation between workflow and business processmanagement. Then, different approaches of modelling business processes andcompositions are presented.
Chapter 3 discusses the QoS of service compositions in detail. It begins withclarifications on the different concepts and on the used terms in this field. Then, itexplains how QoS needs to be processed in order to perform the QoS-based selec-
12

1.3. Structure of the Thesis
tion. Based on these clarifications, Chapter 4 presents the aggregation of QoS. Thechapter is divided into two parts: Its first part covers a structural model indepen-dent of particular technologies. Its second part deals with the aggregation of QoSbased on this model.
Chapter 5 explains the problem of QoS-based selection and defines a problemmodel. Furthermore, this chapter discusses the characteristics of the problem andcontinues with the introduction of the heuristic approaches. Chapter 6 explainsthe simulations, the different campaigns, and how the simulations are performed.Then, the chapter also presents the results and discusses their interpretation. Thechapter ends with an analysis of the efficiency of the applied heuristic approaches.
After the discussion of the selection problem, Chapter 7 explains how the QoS-based selection is integrated into the process of developing service compositions.The chapter introduces different research works that discuss designing and creatingcompositions. Based on the presented contributions, a basic development processis presented that provides a description about its required activities and facilities.Then, the chapter identifies at which points the QoS-based selection is performed.In addition, it clarifies which information the process must provide in order toperform the QoS-based selection as well as how the output of the selection is usedfor subsequent tasks in the process.
Chapter 8 provides a summary of the research contributions provided by thisthesis and presents the conclusions. It also discusses possible improvements andenvisages future directions of this work.
13

1.3. Structure of the Thesis
14

Chapter 2
Workflows, Business Processesand Service Compositions
This section will introduce background information of the application scenario thatis considered in this work: As briefly mentioned in the introduction, the goal is todevelop business processes and workflows by means of compositions of services.In such a scenario, software components available as services perform individualtasks of a business process or a workflow. Such a setup is often embedded into an ITinfrastructure that is tailored to the provision and utilisation of services, the SOA.This chapter intends to clarify the terms business process and workflow, and theirrelation to each other. Because the structure of processes will become importantfor the subsequent chapters of this work, this chapter will also introduce differentmodelling languages for business processes, workflows and service compositions.
2.1 Business Processes
In the mid-90s, the term “business process (re)engineering” drew attention to anumber of opportunities for optimising the efficiency of enterprises, companiesand other organisations. The work of Hammer and Champy, who promoted thereengineering of business processes [43], drew the attention of the IT industry todeveloping software systems that facilitate the creation and management of busi-ness processes [86] [34, p. 230].
The basic idea of this initiative is to implement business processes in an ex-isting organisation in the most modern and optimised way: The business processreengineering should result in a new and optimal process without any legacy arte-facts. The basic approach is to start with an evaluation and analysis of the activitieswithin an organisation. Based on the analysis, the goal is to redesign the activitiesand to group them into defined processes. A business process should provide aclear and unambiguous definition about what it does, what its output is and whatit needs as an input. This represents a clear analogy to computer programs: Ingeneral, they also feature unambiguously defined in- and outputs, as well as a clear
15
2.1. Business Processes
definition about what they do, which is represented by the source code of a pro-gram. In addition, every business process should have a dedicated customer –either internal or external of the organisation – and thus, have a clear purpose. Bythis way, a process can be clearly oriented to the needs of a customer. And it willbe the client of the process who will pay for the results of its execution. Besidesthe consumer, a process should also have an owner, who is in charge and respon-sible for a particular process, in order to provide customers with a defined point ofcontact.
When the business process paradigm was introduced, just the opposite situationwas the reality in companies: Different organisational units where divided by theirfunctional responsibilities. As a consequence, a process typically crossed manyorganisational parts and involved a number of responsible persons. In such con-stellations, the average process duration slowed down. Thus, in case of problems orinquiries it was hard to identify a responsible person. Among different motivationsand anticipated benefits from applying the business process reengineering idea, themain drivers were (cf. Krallmann et al. [34, p. 230]):
• Optimisation of existing activities. The business process reengineeringgives the opportunity to re-evaluate the advantages and disadvantages ofwhat the actors in the business do and how they do it. The obvious goal is tooptimise existing activities. For example, it is possible to evaluate whethersequentially performed tasks can be performed in parallel in order to savetime.
• Improved controlling. An organisation might perform many different in-dividual activities. As a result, common metrics and comparison values arehard to apply. This makes monitoring and benchmarking efforts more dif-ficult. Based on the standardised processes, monitoring and benchmarkingthe ongoing processes will results in values and findings that are more suit-able for comparison and analysis. Moreover, controlling efforts to preventunintended activities can be reduced.
• Reducing overhead. What applies to the controlling, also applies to whenthe process is performed. Based on a exact definition of the processes, mis-taken activities or misunderstandings between involved actors are reducedand thus the productivity is improved.
Apart from the evident advantages, analyses of the performed business processreengineering efforts have also revealed problems that may occur. Most noticeableis that applying too radical changes in order to establish more efficient processeswill lead to social problems in the organisation [34, p. 239]. Moreover, a strongfocus on the process optimisation also carries the risk of poor improvements on thequality of the individual activities.
16

2.1. Business Processes
2.1.1 Definition of Business Processes
Like with many terms in the field of IT, there are many definitions available forthe term business process. The general definition of a process provided by theISO 9000 standard is that a process “is a transformation that adds value” [128,section 4.6]. Hammer and Champy [43] define a business process as “a set ofactivities that, taken together, produces a result of value to a customer”. Davenportdefines a business process as “an ordering of work activities across and place, witha beginning, an end, and clearly identified inputs and output” [21]. There are manymore definitions available in various books. When considering the basic attributesof business processes as discussed in the mentioned literature, they show somesimilarities with service compositions:
• Input and output. A process has a defined input and output. This ideahas clear analogies to the compositions of services that provide a definedinput and output as well. A composed service starts and ends each with anindividual service. A service represents a software operation which has inputand output parameters as well.
• Purpose. A process should address at least one goal. This aspect is alsoinherent to the composition of services, which must follow a goal as well.
• Responsibility. A process has one responsible person or unit. In the domainof service compositions, the role of the retailer who provides the composedservice represents this function.
• Recipient. A process has at least one consumer. In this respect it is analo-gous to the service composition, because the retailer would not provide thecomposed service if there were not consumers using the service.
• Activities. A process consists of activities. The idea of activities that to-gether form a process also resembles the nature of a service composition,which consists of individual services.
Consumers or clients, i.e. responsible and acting individuals, play defined roles,which are attached to a process. Besides the general attributes of a process, con-straints can be also applied. For example, a constraint exists when a process mustgenerate a positive value or that the goal of the process is to serve a consumer witha high performance. Furthermore, a business process can be divided among organ-isations, which increases the efforts to establish and to run the process. The aspectof covering business processes between organisations also matches the nature ofservice compositions: The used techniques and technologies allow involving indi-vidual services from different organisations as well.
17

2.1. Business Processes
2.1.2 Modelling Business Processes
A model of a business process models a set of activities and its relations. This setcan be described with inputs, outputs and a definition of the involved roles. Thebasic idea of the modelling step for the software engineering side, as well as forthe business process engineering mentioned before, is to achieve a clear and com-mon understanding of what a business process should do and what its benefits are.A business process model thus can serve as the common point of understandingbetween the management and the software developers that are supposed to de-velop the service composition. Then, the realisation of the process can be plannedand the technical feasibility can be assessed. Business process models are alsothe foundation of business process analysis aimed at identifying the potential forimprovements. Possible improvements are automation, elimination of unnecessarymedia changes or the reduction of delays. A model can also help to verify processesin order to prevent live- or deadlocks which prevent the process from terminatingproperly. Figure 2.1 shows the basic two roles of a business process model withrespect to the business process and a service composition.
Business Process Model
Service Composition
Business Process
Management Software Development
is a model of is a model for
Figure 2.1: The roles of a business process model.
Since this topic has gained reasonable attention from the industry, the numberof companies that offer products and services for business process (re)engineeringactivities has increased. In addition, various languages and methodologies for mod-elling, managing or performing business processes were introduced. For the mod-elling, different graphical and textual languages and conventions exist, which canbe used to create diagrams or a description of a business process. Then these de-scriptions can be interpreted by software systems. Graphical representations canbe flow diagrams, block diagrams, graphs or listings. Considering a basic graph,a node represents an activity, an event or an entity where directed edges representthe relations between the elements.
One early graphical language for the modelling of processes is the Event-
18

2.1. Business Processes
Driven Process Chain (EPC) [71]. As the name suggests, the basic element ofthe event-driven process chain is the event, which is a defined condition and thuscan be the result of a process, a function or an external event. In addition, eventscan also trigger a function. Because the events are not routing the flow, events areregarded to be passive. Contrary to events, a function is an active element whichdescribe state changes. The events or functions can be combined with routing oper-ators. With EPCs, conjunctive (AND), disjunctive (XOR) and adjunctive (AND-OR)operators are supported. EPCs are suitable for the modelling of control flows thatdefine the order of occurring events and executed functions. To model the data flowof a business process (or also the flow of goods) extensions are proposed that ap-pear in literature as extended EPCs [34, p. 221]. However, modelling the data-flowis not the focus of this work and therefore not subject to further investigations.
The Business Process Modelling Language (BPML, [29]) is a specificationof the Business Process Management Initiative (BPMI) and is a textual languagefor describing business processes. The BPMI represents a non-profit organisation,with the goal to support and coordinate the advances in business processes amongits members. The BPML is intended to serve as a comprehensive description of abusiness process. It consists of different constructs to describe the control flow of abusiness process as well as the data flows in it. The standard representation used forBPML documents is XML. The BPMI has also released a graphical notation calledBusiness Process Modelling Notation (BPMN, [140]) to provide a set of graphicalsymbols and layout conventions for drawing business process models. In additionto the BPML, the BPMI has also discussed differences of business processes man-agement when compared to the workflow management (cf. Smith at al. [121, 122]and van der Aalst [141]). Very briefly, this discussion has revealed that differencesare hard to specify. Rather, business processes and workflow management showmany similarities, as the next section about workflows will point out as well.
Considering another modelling proposal in the field of business processes, theBusiness Process Execution Language (BPEL), also named BPEL for Web Ser-vices (BPEL4WS) and now being renamed to WS-BPEL, represents a special pro-posal because it specifically covers Web services. Although its name, mentioningexecution, indicates a different scope than BPML, which carries the name mod-elling in it, both proposals compete with each other. At the moment, a commit-tee at the Organisation for the Advancement of Structured Information Standards(OASIS) coordinates the development of BPEL. Before, BPEL was carried out bya joint venture of mainly IBM, Microsoft and BEA.1 Originally BPEL was theresult of a merger of the Web Services Flow Language by IBM (WSFL, [80]),which shows influences from IBM’s MQ Series workflow software [143], andXLANG [129], which was intended to serve as the process modelling languagein Microsoft’s BizTalk middleware. All the three languages are designed for real-ising the activities or tasks of a process by using Web services. Following the Web
1Today, additional main contributors to the development of the BPEL are the software companiesSiebel and SAP.
19

2.2. Workflow Management
services paradigm, all three proposals define an XML-based notation as well ascover elements that a process modeller can use to directly refer to WSDL interfacedescriptions of involved Web services.
The main difference between the two languages WSFL and XLANG is thatXLANG provides a block-structured flow description whilst a process descriptionusing WSFL is oriented to an unrestricted graph. The main process element foundin XLANG can represent basic structural arrangements like a sequence or a con-ditional branch. Contrary to that, WSFL covers activities that represent the nodesin a process flow graph. Then, WSFL provides elements to define the edges in thegraph which denote the invocation order among the activities. Consequently, thecombination of both, BPEL4WS, features both ways to model a business process,using block-structures as well as a flow-graph. For example, looking at the ele-ments provided to describe the control flow structure in BPEL4WS: It can be seenthat the element all from XLANG meaning that all activities are supposed to be ex-ecuted in parallel has been dropped. Contrary to that, the other parallel statements(pick, while, switch) have survived in BPEL4WS. In addition, the element flowreplaces the element all from XLANG and also introduces the concept of controllinks as originally found in WSFL.
Besides the mentioned EPC, BPML, BPEL, WSFL and XLANG, there aremany other approaches to model business processes. In addition, the literaturementions WSFL, XLANG and BPEL4WS as languages for modelling composi-tions of Web services, which also indicate that the border between business pro-cesses and service compositions is becoming blurred. Another proposal for mod-elling business processes is to use the Unified Modelling Language (UML) fromthe OMG, for example by using activity diagrams [100, section 2.13.2.1]. Origi-nally intended for “software-intensive” systems, as the foreword of the UML spec-ification says, this approach is used by some software products. This is also pro-posed in related research works, especially when it comes to the realisation ofbusiness processes. Section 7.1.1 will introduce some efforts in more detail.
2.2 Workflow Management
The field of workflows has got a different origin and thus also a different historythan the field of business processes. Not following an application-independent ap-proach as a general strategy for organisations, first workflow management systemswere applied for specific application cases. One of the systems mentioned as thefirst steps in the workflow area is the OfficeTalk software, which came as a partof the Xerox Star system [68]. The Xerox Palo Alto Research Center (PARC) de-veloped this system in the 70s. It represented a computer system for working withelectronic documents of different kinds, like texts, memos, messages etc. in a typi-cal office environment. Such a system does not represent a workflow managementsystem as it is understood today: Today, many works consider the definition of theWorkflow Management Coalition (WfMC) [45, section 2.1] which says that
20

2.2. Workflow Management
[A workflow represents] the computerised facilitation or automa-tion of a business process, ...
The way OfficeTalk worked was trying to reflect the way humans would work ondocuments without computers and thus it was covering a specific process. Thisrepresented a workflow by realising real-world processes with a computer system.Clearly, workflow has in this sense a strong relation to support collaboration anddocument management.
Other systems that also focussed on the workflow around electronic documentsfollowed. The primary purpose was to support the creation of documents, to sendthem around and to control the evolutions of these. The workflow managementcontrolled the order in which the users would work on a document. Also the sys-tems tried to offer a seamless integration with e-mail systems, word processingapplications and input forms in order to standardise the user input. In summary,workflow management systems optimised the handling of documents in the fol-lowing ways:
• Prevention of media breaks. When dealing with documents and data, ithappens that the media, which transports the information, changes. E.g. adocument is printed out on paper from an electronic document and needsto be entered in manually into another system. This is named media break.It was the hope to reduce such media breaks with workflow managementsystems and to come one step closer to the paperless office.
• Accelerated forwarding between tasks. Moving a document from one’sdesk to the next took time and relied on the motivation of the employees.Workflow management systems can forward documents right after one partyhas finished its tasks.
• Controlling. When workflow management systems facilitate or automate aworkflow, data can be derived that allows performance measurements. More-over, such data can be used to predict future performance for controllingpurposes.
• Automation of tasks. Tasks that do not require an interactive handling canbe automatically executed by a workflow management system and thus ac-celerate the workflow.
These early workflow management systems developed further. The systems be-came more sophisticated and more compatible to external systems. An article byMahling et al. explains the evolution of workflow management systems by referringto the Poise system which covers all the industry’s developments since its begin-ning in the 70s. The first version of the Poise development represented an officeinformation system supporting tasks that occurred in the handling of documents,such as entering information or realising static workflows [86]. In the mid-80s,a subsequent development named Polymer took advantage of the lessons learned
21

2.2. Workflow Management
with Poise: Its main innovation was a more sophisticated concept of modellingworkflows that resulted in more flexible workflows as well as in better coverageof different application scenarios. Based on the previous products, Polyflow wasintroduced in 1995 as an application- and domain-independent workflow manage-ment system.
Besides the early orientation of workflow management systems to documentmanagement and collaboration, these systems became also more sophisticated inother aspects. In the beginning, such products were installed in an office environ-ment. Their architecture followed the classical client-server principle presumingthat clients and server reside within a local network. Today, workflow managementsystems provide different versions of client software as well. And, they support dif-ferent communication protocols to communicate beyond the local network. More-over, different workflow management systems can interoperate with each otherto support federations of workflow management systems. This scenario becomesuseful, if different workflow management systems serve different organisational orfunctional needs but still need to interoperate. The result of these developments isthat workflow management software today represent versatile systems that facili-tate processes in various application cases.
Among the different products and developments, the WfMC has standardisedthe characteristics of workflow management systems in a reference model [45].The WfMC represents a non-profit organisation that tried to coordinate advancesand developments in the workflow area. Apart from the architectural advances, thedevelopment made progress in the area of modelling workflows, which is the focusof the next section.
2.2.1 Modelling Workflows
Since the development of workflow management systems begun, most vendorshave provided their own workflow modelling language. And up to today, the com-munity has the choice between many proposals for workflow modelling by differ-ent (industry) organisations, software vendors and research groups.
Van der Aalst et al. have introduced a set of product- and vendor-independentpatterns that discusses and compares the structural characteristics of the differ-ent workflow modelling proposals [146]. Examples of such patterns are differentfork-conditions if the workflow splits into two sub-flows. Another example is thecapability of a workflow management system to process multiple instances of aworkflow at once. As for orientation, the analysis of workflow management sys-tems conducted by van der Aalst et al. based on the workflow patterns covers about15 different workflow management systems each with different workflow mod-elling capabilities [146]. There are more products available, but those 15 can beconsidered as the group of popular ones.
Besides workflow management software, vendor-independent approaches existas well. Such an effort is represented by the XML Process Definition Language(XPDL, [87]) published by the WfMC. The XPDL did not convince many software
22

2.2. Workflow Management
vendors to be used [143]. However, contrary to other commercial proposals, theXPDL represents an effort independent of a particular vendor.
The XPDL serves as a part of the workflow reference model of the WfMC,because it represents a reference implementation for the process definitions. Basedon this interface, the authors of the XPDL have created a model process defini-tion on a meta-level. The authors admit that this meta-model will likely not coverevery concept that is found in all the available workflow software products, mod-elling methodologies and modelling languages. However, their hope is that allthe other players in the field of modelling workflows accept their model as theminimum consensus. Based on the meta-model of XPDL, an XML representationexists. The authors have chosen XML because of its wide support among dif-ferent computing platforms. As a consequence, XPDL was intended to serve as aplatform-independent description language that allows sharing a workflow descrip-tion between workflow modelling tools and workflow execution environments aswell as the interoperation of different workflow execution environments.
XPDL supports both workflows that require the interaction between human andmachines, as well as entirely automated processes, by supporting concepts for in-voking external services and execute local software applications. As for the secondversion of XPDL, which was released three years later in 2005, the authors proposeXPDL also as the XML notation format for serialising graphical models using theBPMN [118]. Moreover, the WfMC has changed the used terminology and ex-plains that XPDL serves as language for modelling business processes whilst theterm workflow slips into the background. These signs indicate that WfMC andBPMI try to merge their efforts into one common consensus. Looking at the struc-tural modelling elements, XPDL offers both elements to define block-like struc-tures, a block-activity, as well as elements to define a graph of activities, using theconcept of an activity-map [118].
Besides these efforts, research work covers also the modelling and specifica-tion of workflows. Most approaches in the research area consider the application ofevent-driven process chains, or formal calculus or (high-level) Petri nets as a foun-dation for modelling workflows. A Petri net, named after its inventor Petri, is aconvention for modelling and specifying discrete events of dynamic systems. Petrinets, also named Place-/Transition-Nets (P/T-Nets) have been applied for differentscenarios such as the specification of telecommunication protocols, or in businessapplications such as description of a logistic chain. Petri nets were introduced byPetri in the year 1962. Since then, many extensions and applications were intro-duced in literature. Today, the ISO covers Petri nets as an industry standard [56].
Janssens et al. have introduced an analysis of existing workflow modelling ef-forts that use Petri nets [67]. Their analysis covers twelve different major contribu-tions that have covered research issues of modelling workflows with Petri nets orPetri net variants. The main reason for using Petri nets for modelling workflows isthat they offer, besides a graphical notation, a formally defined semantic descrip-tion of the elements. This allows the application of formally proven analysis tech-niques (cf. Janssen et al. [67] and van der Aalst [142]). Among these contributions,
23

2.3. Workflows versus Business Processes
van der Aalst et al. have defined a popular Petri net variant that they name Work-flow Net. The workflow net represents a convention for modelling workflows withPetri nets [148]. Based on this work and the workflow patterns analysis mentionedat the beginning of this section, van der Aalst et al. have also introduced a work-flow modelling language named Yet Another Workflow Language (YAWL, [149]).YAWL represents a language proposal which extends the concepts of Petri nets inorder to support the workflow patterns to their full extend, while keeping a formalfoundation that allows the anticipated verification on modelled workflows.
2.3 Workflows versus Business Processes
The previous sections have introduced two concepts, namely business processesand workflows, which seem to have many issues in common. Apart from theirorigin and their purpose, which showed different roots in the beginning, both havemany research questions in common. For example, in order to specify either pro-cesses or workflows, common approaches exist that use notation techniques basedon Petri nets or event-process-chains. Considering the execution side, both sharecommon challenges regarding distributed executions, fault-tolerance or optimisa-tions. The resulting question is: In what aspects are these fields different? Thereference model of the WfMC defines a workflow as a business process facilitatedby computer systems. This definition, which has been stated in many researchworks since 1995, says that any computer system processing business processesrepresents in fact a workflow management system.
The two terms are used synonymously sometimes, and many publications donot mention any difference between the two, suggesting that using either the one orother is based on historic reasons. However, two main communities exist, one rep-resenting the workflow side and the other representing the business process com-munity: the WfMC and the BPMI. In a retroperspective of the workflow referencemodel published by the WfMC, the authors acknowledge the growing momentumof business process management [46]. The WfMC explains that the evolution ofthe involved technologies and techniques of workflow management systems meettoday the concept of business process management: Business process managementis supposed to cover accounting issues and the management of resources. Businessprocesses include both machine and human activities. Consequently, the WfMCproposes using their original reference model as the foundation for a future refer-ence model that covers business process management.
Members from the BPMI promote a different view on the relation between themanagement of workflows and business processes. Smith and Fingar have initi-ated a discussion by publishing the statement that a workflow is purely concernedwith process description [122]. According to their view, a comparison betweenworkflow management systems on the one hand, and business process manage-ment systems on the other hand, reveals that workflow management systems showa number of disadvantages that make them less suitable for the new demands of
24

2.3. Workflows versus Business Processes
today’s enterprises. They explain that workflows are more static (i.e. application-dependent) and do not support modifications of the business process. Commonworkflow management systems do not cover the concepts needed for the majorityof business processes and workflow management systems do not refer to a commonmodel of workflow. This approach of the BMPI has received a response, which hasmotivated the authors of the original article to publish clarification [121]. What re-mains is that, according to the BPMI, workflow represents just one aspect of whatis covered by business process management. In addition to workflows, businessprocess management covers the integration of different computer systems as wellthe non-computerised parts of business processes.
When it comes to the application of the terminology and the referring lan-guages, the main disadvantage is that a clarification must be made between whatis different and what is only claimed to be different. Considering the presentedoverview, the conclusion is that workflow and business processes move together tobecome the same. Apparently, the difference between both as they have evolveduntil today results from their different origins – on the one side stands a visionabout automating the paperwork in an office environment and on the other sidethere is the optimisation of what happens in companies from a business perspec-tive. The underlying problems, such as the expressiveness of the modelling lan-guages, how verifications can be applied or which graphical modelling language isthe most efficient, appear to be similar for both fields. Considering the workflowdefinition of the WfMC, Figure 2.1 is modified by considering the relation betweenworkflows and business processes as shown in Figure 2.2.
Service CompositionBusiness Process
Management Software Eingineering
is a model of is a model for
BusinessProcess Model
Workflow Model
is amodel for
is amodel for
Figure 2.2: The roles of business process and workflow models.
25
2.4. Realising Business Processes and Workflows
2.4 Realising Business Processes and Workflows
After the clarification of the relation between business processes and workflows,this section summarises how these two fields can benefit from an SOA and thecomposition of services. Different research work has analysed the characteristicsof business processes and workflows with regard to service compositions. Theseresearch works also provide several proposals on how to create business process(and workflows) in an SOA. The main points in favour of using services and com-positions of them are:
• Technology Independence. (cf. Hunhs and Singh [47], Papazoglou [104],and Yang [154]) The basic idea behind promoting the SOA architecture isto establish a middleware that ties together functionality offered by differ-ent systems, regardless of their hard- and software. Services should usecommon interaction protocols as well as common interface descriptions andplatform-independent types. With Web services as an implementation of anSOA, it appears that is becoming reality: Both, service consumer and serviceprovider can run on different hardware as well as be implemented in differ-ent programming languages. However, to a certain extent all the differentplayers can interoperate.
The role of Web services as the middleware for integration goes even further:Solutions exist that encapsulate other middleware platforms, which wereoriginally designed to provide independence from language and hardware aswell. Thus, software products exist that use Web service technologies to pro-vide a common interface technology for existing technologies, e.g. CORBA,mainframes, Java component frameworks etc. [109]. Heterogeneous IT sys-tems are standard in large businesses, because these businesses have usuallystarted the integration of computer systems at early stages, when the interop-eration of computer systems was not a major concern. Thus, these differentsystems must be integrated into one common platform in a potential businessprocess reengineering effort.
• Implementation Neutrality. (cf. Dijkmann and Dumas [22], Hunhs andSingh [47], and Yang [154]) One of the main differences between service-oriented computing and distributed object computing [4] is that services usu-ally provide one aggregated interface that might use objects. However, ser-vices hide the structure of the software that provides the functionality behindthe interfaces. This leads to an encapsulation of underlying objects. As aconsequence, changes applied to the particular implementation do not nec-essarily result in a change to the service interface and therefore do not requirechanges when establishing the interoperation between service requester andprovider. The previous point and this point are covered by the concept ofaccess transparency defined by the RM-ODP (cf. [50, section 8.1.2]).
26

2.4. Realising Business Processes and Workflows
• Location Transparency. (cf. Bolcer and Kaiser [10], and Papazoglou [104])Location transparency provides an abstraction of the physical location wherethe service is provided in the sense of the RM-ODP (cf. [50, section 8.1.2]).Today’s SOA implementations support Internet protocols and consumers inthe Internet can invoke services across the local computer, the local networkor the local organisation. Although an organisation might not consider invok-ing just any service that is available somewhere in the world, using Internetprotocols offers a greater level of flexibility than using runtime environmentsthat run on specific computers or a federation of computers.
• Loose Coupling. (cf. Hunhs and Singh [47], and Papazoglou [104]) A com-mon definition for loose coupling does not exist. Usually, in an SOA, loosecoupling means that a service consumer knows what kind of service is re-quired during design time. However, the binding (“coupling”) to a real avail-able service takes place during run-time. This does not necessarily implythat a service consumer will bind services only during run-time. However,loose coupling enables service consumers to revise existing bindings duringrun-time when necessary.
• Process Orientation. (cf. Bolcer and Kaiser [10], and Dijkmann and Du-mas [22]) Modelling business processes also leads to a description of re-quired tasks and a specification about the execution order of the tasks. Acomposition of services can provide a business process using an SOA envi-ronment when every task can be provided as a service. This presumes that,for example, human interaction is not required. The orientation to the serviceinterfaces stands in contrast to what a set of objects would provide in a dis-tributed object computing environment. The resulting implementation neu-trality conforms to the business process paradigms: Like services, businessprocesses should have a defined input and output, whilst the implementationof each task in the process becomes secondary.
This list of points represents the motivation that already a couple of productshave been introduced already be software vendors to develop business processeswith forming service compositions. Examples from the Software industry are theOracle BPEL Process Manager [117], or the WebSphere Integration Developer byIBM [85].
2.4.1 Modelling Service Compositions
Based on the modelling languages for workflows and business processes that havebeen used so far, different languages have been proposed (and also already beenmentioned) that directly model compositions of services. These languages do notfocus on user interactions and consider mainly automated processes. Most lan-guages provide direct support for Web services as this represents the major SOAimplementation used today. In this context, support means that languages refer to
27

2.4. Realising Business Processes and Workflows
WSDL or SOAP or other specifications from the field of Web services. Currently,many different proposals are available to describe compositions of Web services;similar to what can be observed in the field of workflow or business process mod-elling. To provide a clear view of the different languages, the following threegroups for these languages are proposed:
• Abstract level languages, Level 1. Languages that are primarily intended todescribe an abstract process with activities. In this case, services might pro-vide these activities but the reference to concrete services is not mandatory tomake the description complete. If available particular services are not men-tioned, such a description describes the composition on an abstract level andhandles the activities or involved services as black boxes with technology-independent interface descriptions.2
• Concrete level languages, Level 3. On the concrete level, the descriptioninvolves particular services and a description of each particular service. Themain issue when talking about services is that a service does not representonly an atomic, stateless operation, but provides a set of different operations.Depending on the complexity of the service and the composition, a specifica-tion of a composition must involve this aspect. These languages do not focuson service compositions, because they can be also applied for describing theinteraction between individual parties on a technical level.
• Languages covering both levels, Level 2. Some proposals clearly focus ondefining the interoperation between service exporter and importer and otherproposals focus more on modelling the process and its activities. As a thirdgroup, some languages are right in the middle of both, not showing a clearprocess modelling focus and also not a clear interoperation focus.
It must be noted that this categorisation does not provide a formal basis noran argumentation like: If concept x is found in a language then it belongs to levely. This categorisation only has the purpose of giving a rough orientation. Thetwo main levels 1 and 3 have their analogies to the items mentioned in Figure 2.2which has shown the relation between the business process model and the servicecomposition. In accordance with this figure, an updated version 2.3 shows thatlevel 1 modelling languages refer to the business process model, while level 3languages are used to express service composition models. The work of Ouyanget al. discusses the transformation between process models and models of servicecompositions by considering BPMN and UML activity diagrams on the processside, and BPEL for modelling the service compositions [101].
Table 2.4.1 lists a selection of proposals that were mentioned in the literatureas Web service composition languages, with their acronyms and their proposed
2The term abstract is used in the same sense as in the ISO RM-ODP: The process of suppressingirrelevant detail to establish a simplified model, or the result of that process [51, section 6.2]
28

2.4. Realising Business Processes and Workflows
categorisation. In addition, Figure 2.4 shows a chronological overview of theirintroduction dates. The two BPEL proposals, WSFL and XLANG, were mentionedalready in the Section 2.1.2 about business process modelling. The focus of theselanguages lies on the specification of a business process by using available Webservices. A specification using one of these languages forms a composition ofservices that is ready for execution. Thus, these candidates can clearly be namedWeb service composition languages and would fit into the second group.
Regarding the languages at the first level, Table 2.4.1 mentions XPDL, BPML,and the Business Process Specification Schema (BPSS). All three offer language el-ements to directly support the invocation of Web services. However, the invocationof a Web service is not required in the XPDL for the realisation of an activity [118,section 7.1.4.1]. The BPSS clearly has the smallest focus on supporting compo-
L. Acronym Full Name, ReferenceSupporting Parties, Remarks
1 XPDL XML Process Definition Language [118]WfMC, contributing authors were from Global 360, FileNet,Staffware/TIBCO, Prozone and Fujitsu Software
1 BPML Business Process Modelling Language [29]BPMI, the specification mentions only one contributing author fromIntalio
1 BPSS Business Process Specification Schema [29](Part of the ebXML Suite) UN/CEFACT, an United Nations Bodyfor Electronic Trade and an OASIS Technical Committee, includ-ing members from Cyclone Commerce, Fujitsu, SAP AG and SunMicrosystems
2 WSFL Web Services Flow Language [80]IBM, moved into the BPEL4WS proposal
2 XLANG subtitled ”Web Services for Business Process Design” [129]Microsoft, merged with the BPEL4WS proposal
2 BPEL4WS Business Process Execution Language for Web Services [31]IBM, Microsoft and BEA, merged with the WS-BPEL proposal
2 WS-BPEL Web Services Business Process Execution Language [126]An OASIS Technical Committee involving 18 industry parties,among them BEA Systems, IBM, Microsoft, Oracle, Sun Microsys-tems, SAP AG
3 WSCI Web Service Choreography Interface [30]W3C Note submitted by BEA Systems, Intalio, SAP AG und SunMicrosystems
3 WS-C Web Service Choreography [14]W3C Working Group, continuing with the WSCI proposal
Table 2.1: Overview: Web service composition languages.
29

2.4. Realising Business Processes and Workflows
Business Process / Workflow Model
e.g. using Level 1/2 modelling langauges
ServiceComposition Modele.g. using Level 2/3 modelling languages
Business Process
Management Software Eingineering
is a model of is a model for
Figure 2.3: The relation between business process, workflow and service compo-sition models.
sitions of services. The BPSS is a part of the ebXML suite, which supports es-tablishing agreements to facilitate electronic businesses on an inter-organisationallevel. The motivation for this effort is to provide a specification for helping de-veloping countries to participate in electronic commerce without being dependenton technologies by particular vendors. The ebXML is maintained by the UnitedNations Centre for Trade Facilitation and Electronic Business (UN/CEFACT) anda Technical Committee at OASIS. The first release was submitted in 2001. At thattime, compositions of services or an SOA environment was not mentioned at all.
There are two reasons why this work considers BPSS as member in the circleof the composition languages: At first, it has been mentioned in some publicationsas a language for expressing compositions of services (cf. [120, 143, 152]), thusit is useful to clarify its relation to service composition and the other languages.However, considering the BPSS as a composition language must take into accountthat the specification is independent from particular SOA technologies. To pro-vide the ties to concrete SOA implementations like Web services, separate speci-fications named Collaboration Protocol Profile (CPP) and Collaboration ProtocolAgreement (CPA) are proposed. A BPSS document may refer to a CPP or CPAto provide a description of the involved services. For example, a BPSS documentcould refer to a WSDL interface description of a Web service. However, sincethe BPSS has clear a focus on enabling international electronic trade, it is not thepreferred candidate to develop business processes in an average company.
The Web Service Choreography Interface (WSCI) represents the foundationfor the third group. Considering a Web service, it usually does not provide atomicsingle operations to be invoked but rather a set of operations in a specific orderwhile capturing the state of the invocation. The WSCI proposal directly focusseson specifying the needed message flow between Web services resulting from theiroffered operations [30]. Consequently, the authors of BPML mention explicitly
30

2.4. Realising Business Processes and Workflows
2
3
1
BPEL4WS
1.0: July 2002 1.1: May 2003
WSFL
1.0: May 2001
Pre-Release: April 2005XLANG
Work in Progress: June 2001
WS-BPEL ("2.0")
Draft: September 2005
20052004200320022001 2006
XPDL
2.0: May 20051.0: October 2002
BPML
Working Draft June 2002Final 1.0 Novmeber 2002
BPSS
1.0.1: May 2001 1.0.5: July 2002 Public Draft 2.0: April 2005Draft of 1.10: August 2003
WSCI
1.0: August 2002
WS Choreography
Working Draft: March 2004
Figure 2.4: Release dates of service composition languages.
that WSCI and WSDL specification are complementary [29, section 1.2]. TheWSCI has been submitted to the W3C as a technical note in 2002. Since then, thisproposal has not received any further updates. In beginning of 2003, a W3C work-ing group named Web Services Choreography has begun its work to take the WSCIproposal as input. Based on the WSCI, the working group continues to work onthis topic [14]. By choreography, the working group refers to the “characteristic ofdescribing linkages and usage patterns between Web services”. The working groupuses the term choreography in a similar manner as other proposals use collabora-tion, conversation, coordination or orchestration. Currently, the working group hasreleased several documents which are under further development.
A criterion for comparing the different languages is not only their applicationbut also their expressiveness. As expressiveness, not the expressive power butthe convenience to express particular aspects is considered. Such a comparisonhas already been conducted by Wohed, van der Aalst et al. [151]. In their work,they have presented a comprehensive analysis on the structural capabilities of lan-guages to specify Web service compositions for BPEL4WS, XLANG, and WSFL.Based on this research work, further work has been published covering BPMLand WSCI [150] and XPDL [143]. The general result of this work is an analy-sis on which composition language directly supports which (structural) workflowpattern. By using the patterns, Wohed, van der Aalst et al. give a detailed explana-tion about the languages’ capabilities and problems and – more importantly – theyalso explain how previously introduced workflow modelling languages have copedwith expressing specific aspects. Thus, their summarising conclusion is that Web
31

2.4. Realising Business Processes and Workflows
service composition languages do not offer a greater level of expressiveness whencompared to workflow modelling languages. However, it must be noted that theirprimary purpose is to facilitate the development of service compositions. Conse-quently, Figure 2.3 can be extended as shown in Figure 2.5: The business processmodel represents the interface between the organisational side and the softwareengineering side. On the software engineering side, the model of a service compo-sition is used as a model for the required development tasks. The development ofcompositions will be the topic of Chapter 7.
ServiceComposition Modele.g. using Level 2/3 modelling languages
Development of
ServiceComposition
Business Process / Workflow Model
e.g. using Level 1/2 modelling langauges
Management Software Eingineering
is a model for
is a model for
Figure 2.5: The role of the service composition model.
Despite of the clarifying statement of this particular research group, the de-velopment of the different composition languages is ongoing. The OASIS-drivenWS-BPEL effort has currently the largest attention in the area of service composi-tions. It considers the widely accepted Web services standards and gathers manyindustry players providing SOA-based products, such as IBM, Microsoft, Oracle,SAP AG and Sun Microsystems, together. Besides, the WS Coordination work-ing group shows ongoing activities. Taking into account that existing documentspublished so far have only draft status, they indicate that there is more to expect.Apart from these languages, which directly focus on Web services, this chapter hasintroduced other proposals that focus on different purposes but can be consideredfor describing service compositions as well.
32

Chapter 3
Quality-of-Service in ServiceCompositions
The introduction has already presented a general definition of the QoS which citesthe ISO 9004 standard [127, section 3.5]. Every system is designed to provide acertain functionality which represents the functional behaviour of the system. Forexample, if a service that performs a mathematical calculation on a given num-ber is considered, the description and definition of this calculation would coverthe functional behaviour of the system. Nevertheless, a system shows also a non-functional behaviour. If the example of the calculation service is considered, itsnon-functional behaviour can cover the consumption of resources, the time neededfor an operation, or the precision or the delivered result. Such nun-functional is-sues show a relation to the concept of QoS, which will be elaborated further inSection 7.2.1 of the chapter that discusses the application of the QoS-based selec-tion when developing service compositions.
In literature, the two, QoS and non-functional behaviour, sometimes appearas synonyms (e.g. in the WSA from the W3C [11]), whereas other publicationsmention them with clearly separated meanings. In this work, the concept of QoSis subsumed by the concept of non-functional aspects, which is also the view ofthe UML Profile for Modelling Quality of Service and Fault Tolerance Charac-teristics and Mechanisms (the “UML QoS-Profile”, [99]). In accordance with thisrecommendation, the QoS describes quantifiable non-functional characteristics ofa system.
The concept of QoS covers a wide area of aspects. Today, the QoS refersmostly to the field of telecommunication networks. Besides the functionality that atelecommunication network provides – the transmission of data – QoS characteris-tics are inherent properties. Such characteristics can be the delay that occurs whendata is transmitted, or the bandwidth representing the amount of data that can betransmitted within a given time. A telecommunication network can be seen as aservice that transports data from one point to the other. The concept of QoS can beeasily transferred to the field of the SOA. Looking at the RM-ODP, the standardisa-
33

tion efforts to define what QoS means in a open distributed processing system havebeen published as a designated proposal [54], which represents the intended sixthpart of the RM-ODP. The currently available normative reference about QoS by theISO is the Quality of Service Framework published in the Information Technologysection [55]. From this reference, this work considers the following selection ofdefinitions:
QoS characteristic: A quantifiable aspect of QoS, which is definedindependent of the means by which it is represented or controlled.
QoS establishment: The use of QoS mechanisms to create the con-ditions for some system activity, before that activity occurs, so that adesired set of QoS characteristics is attained.
QoS mechanism: A specific mechanism that may use protocol ele-ments, QoS parameters or QoS context, possibly in conjunction withother QoS mechanisms, in order to support establishment, monitoring,maintenance, control, or enquiry of QoS.
QoS data: QoS information other than QoS requirements, e.g. warn-ings, QoS measures and information used in QoS enquiries.
QoS requirement: QoS information that expresses part or all of arequirement to manage one or more QoS characteristics, e.g. a maxi-mum value, a target, or a threshold; when conveyed between entities,a QoS requirement is expressed in terms of QoS parameters.
QoS parameter: QoS information that is conveyed between entitiesas part of a QoS mechanism; parameters are classified into require-ment parameters and data parameters; the information conveyed mayrelate to one or more QoS characteristics.
QoS information: Information related to QoS: [...] It is classified intoQoS requirements (if it expresses a requirement for QoS) and QoS data(if it does not).
There are other recommendations and specifications from industry bodies andnon-profit organisations, such as the UML QoS-Profile [99], which was mentionedalready in this work. The authors have taken both documents from the ISO [55,54] in account for the specification of this recommendation. In addition to thedocuments of the ISO, the UML QoS-Profile provides also definitions for the terms“QoS characteristic” and “QoS category”, which are considered as the basis for thiswork [99, page 10]:
QoS characteristic: A QoS characteristic represents a quantifiablecharacteristic of services. A QoS characteristics is specified indepen-dently of the elements that they qualify. A QoS characteristic is theconstructor for the description of non-functional aspects like: latency,
34

3.1. Exchange of Quality-of-Service Information
throughput, capacity, scalability, availability, reliability, safety, confi-dentiality, integrity, error probability, (...)
QoS dimension: QoS dimensions are dimensions for the quantifica-tion of QoS characteristics. QoS characteristics can be quantified indifferent ways (e.g., absolute values, maximum and minimum values,statistical values). For example, the latency of a system can representan end-to-end delay of the invocation, the mean time of all invocations,or the variance of time delay. (...)
QoS category: When the number of QoS characteristics is large, orthey are especially complex, some mechanisms for grouping are re-quired. Some examples of general groupings of quality attributes are:i) performance: performance references to the timeliness aspects ofhow software systems behave. ii) dependability: (...)
3.1 Exchange of Quality-of-Service Information
Based on these definitions, a model is designed that covers the flow of QoS in-formation when trading services. The first chapter has defined that the retailerprocesses the QoS information covering compositions. However, it remained un-clear how a retailer will obtain such information and which role is represented bythe broker in such a setup. Different methods exist to exchange QoS informationas introduced by the RM-ODP, the trading specification and the Business Modelof the TINA-C architecture [156]. The trading specification defines that a serviceoffer includes so-called service properties which subsume the concept of QoS inthis context [53, section 7.2]. The TINA-C Business Model defines a broker thatcan involve (QoS) attributes about a service as well [156, section 2.3]. However,the architecture description of the TINA defines that the QoS is negotiated betweenthe retailer and the 3rd party service [156, section 3.5]. Telecommunications ser-vices are regarded as volatile and subject to change to every interoperation betweenimporter and exporters. Thus, a repeating re-negotiation between retailer and 3rdparty provider is preferred to better cope with this volatility.
The currently available proposals for processing QoS in open distributed pro-cessing propose a separate, dedicated broker that only processes QoS information.This is a QoS broker component that is added to the standard setup of an SOA. Adedicated QoS broker has the advantage that such a software can also perform QoSmonitoring and dynamically trigger QoS improvements if necessary. Researchwork in the mid 90s proposed broker architectures to provide a QoS-aware ser-vice interoperation in the telecommunications domain. The work of Nahrstedt andSmith represents an example of such an approach [94]. In their work, the QoSbroker is arranged as an “application subsystem”, a tier between the service im-porter and the underlying communication tiers, to implement a QoS mechanismand co-ordinate the flow of QoS information.
35
3.1. Exchange of Quality-of-Service Information
Frøhlund and Koistinen have discussed the QoS in open distributed processingsystems [35]. Their contribution is focussed on the specification of QoS infor-mation and its representation during runtime. Then, a so-called QoS-based traderestablishes the interoperation between service exporter and importer. Apart fromtheir abstract specification, their work also explains the application of their find-ings in a CORBA environment. A couple of other research groups have workedon the QoS-based trading to the CORBA environment. Among them is the workof Cardoso et al. [16] which covers the implementation of QoS-aware middlewarefacilities to provide the optimisation of QoS in workflows.
Besides the workflow domain, the research in the mid-90s discusses multime-dia applications in telecommunication networks. In this scenario, there is a strongdemand to provide real-time characteristics for the transmission of audio and videodata. Their transmission requires a constant data rate with minimum delays. Oth-erwise, the service can become useless. For example a telephony service is uselesswhen the delay resulting from the transmission is too long. Aurrecoechea et al. [3]have discussed the issues of such applications and their underlying QoS-aware in-frastructure in a survey that summarises the different approaches in this field.
3.1.1 Quality-of-Service in a Service-Oriented Architecture
A software infrastructure that provides telecommunication services differs from anSOA. Contrary to the telecommunication domain, the scenario is as such that exist-ing software and components are integrated into one common invocation middle-ware that allows to the interoperation of the different applications involved in thismiddleware tier. The telecommunication domain is influenced by the ISO OpenSystem Interconnection Model (ISO-OSI, [57]) that denotes a tiered architecturein which one tier offers its functionality as a service to the next upper tier.
The functionality of telecommunication services is concerned with the trans-mission of data, while services in an SOA can provide different functionality thatinclude telecommunication aspects (e.g. a service that offers to send an e-mail).The QoS that covers real-time characteristics is not as often considered in an SOAas for telecommunication services. The main reason is that two of the SOA char-acteristics imply just the opposite: a) the loose coupling and b) the use of Internetprotocols (cf. Jaeger and Muhl [60]). Because an SOA usually provides a loosecoupling characteristic, the binding operation requires an unpredictable amount oftime. Internet protocols are known for their robustness. However, they do notguarantee that a connection can be established and can be hold with a constantQoS level. Thus, for some soft real-time applications such as telephony and video-broadcast, extensions to the Internet protocols are used which provide reservationand signalling functionality. In summary, the support for QoS is not as present inan SOA as it is for telecommunication systems.
36

3.1. Exchange of Quality-of-Service Information
Quality-of-Service with Web Services
Different research groups have worked on how to cover the QoS in an SOA or inthe field of Web service infrastructures. A topic in this field is the discussion aboutQoS-based brokers specifically for trading Web services [88, 115, 116, 131, 136].All works share the idea that a separate dedicated broker processes the QoS in-formation. Either service providers must submit their QoS parameters as a part oftheir advertisement, or the QoS broker obtains the QoS information from a moni-toring process. The difference between the mentioned works lies in how the QoSinformation is modelled and represented during run-time.
The mentioned research works have in common that a shared agreement aboutthe QoS information is required. This agreement is necessary to enable all involvedparties to exchange this information. Wang et al. and Tian et al. propose each a pro-prietary XML-based language [136] for the specification of QoS information thatshould be used when communicating with a QoS broker. The work of Maximilienand Singh puts the standardisation of used QoS concepts into an abstract taxon-omy that appears independent from notation formats such as XML or an XMLSchema [88].
In addition, some approaches exist that extend the common Web service repos-itory specification UDDI with the capability to process the QoS rather than es-tablishing separate facilities [2, 78, 112]. Besides the research work, the UDDIimplementation as a part of Microsoft’s server platform allows extensions in or-der to support the processing of QoS information [93]. The common approachregarding UDDI repositories is to extend the data model with custom definitionsof certain QoS characteristics. The specification allows extensions to the standarddata structure by supporting the addition of data models, so-called tModels, usingthe standard API of a UDDI repository. When querying a service, the query caninclude QoS requirements that refer to the added QoS concepts. In this scenario,a UDDI repository represents the broker role that also processes QoS information.Then, the broker is involved when establishing the interaction between importerand exporter.
Besides the broker-oriented approaches, proposals exist for Web services tonegotiate the QoS directly between the importer and exporter. Such proposals con-sist of a negotiation protocol and a QoS specification language. Menasce has dis-cussed common issues of this setup in conjunction with Web services [90]; thebasic idea is that the importer negotiates a Service Level Agreement (SLA) withthe exporter. Both parties define in this SLA the QoS that the service exportermust provide. Examples for SLA languages are the Web Service Level AgreementLanguage by IBM (WSLA, [84]), the Web Service Offerings Language by Tosic etal. (WSOL, [133]) or a similar proposal to express SLAs by Sahai et al. [113]. Theauthors of the WSOL have also published a Web Service Offerings Infrastructure(WSOI, [132]) which explains the use of the WSOL. Generally, the WSOI is notconcerned with the concept of trading services, but with monitoring and managingservices during the run-time. Consequently, the WSOI provides an extended server
37
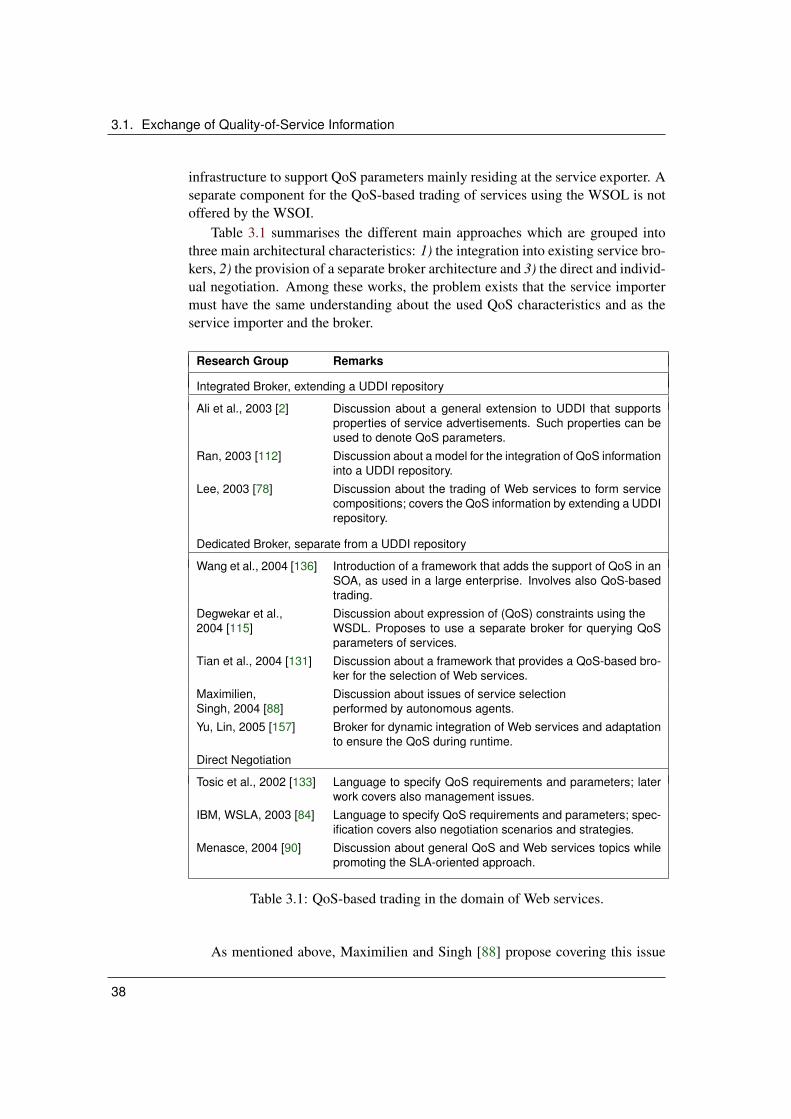
3.1. Exchange of Quality-of-Service Information
infrastructure to support QoS parameters mainly residing at the service exporter. Aseparate component for the QoS-based trading of services using the WSOL is notoffered by the WSOI.
Table 3.1 summarises the different main approaches which are grouped intothree main architectural characteristics: 1) the integration into existing service bro-kers, 2) the provision of a separate broker architecture and 3) the direct and individ-ual negotiation. Among these works, the problem exists that the service importermust have the same understanding about the used QoS characteristics and as theservice importer and the broker.
Research Group Remarks
Integrated Broker, extending a UDDI repository
Ali et al., 2003 [2] Discussion about a general extension to UDDI that supportsproperties of service advertisements. Such properties can beused to denote QoS parameters.
Ran, 2003 [112] Discussion about a model for the integration of QoS informationinto a UDDI repository.
Lee, 2003 [78] Discussion about the trading of Web services to form servicecompositions; covers the QoS information by extending a UDDIrepository.
Dedicated Broker, separate from a UDDI repository
Wang et al., 2004 [136] Introduction of a framework that adds the support of QoS in anSOA, as used in a large enterprise. Involves also QoS-basedtrading.
Degwekar et al., Discussion about expression of (QoS) constraints using the2004 [115] WSDL. Proposes to use a separate broker for querying QoS
parameters of services.Tian et al., 2004 [131] Discussion about a framework that provides a QoS-based bro-
ker for the selection of Web services.Maximilien, Discussion about issues of service selectionSingh, 2004 [88] performed by autonomous agents.Yu, Lin, 2005 [157] Broker for dynamic integration of Web services and adaptation
to ensure the QoS during runtime.Direct Negotiation
Tosic et al., 2002 [133] Language to specify QoS requirements and parameters; laterwork covers also management issues.
IBM, WSLA, 2003 [84] Language to specify QoS requirements and parameters; spec-ification covers also negotiation scenarios and strategies.
Menasce, 2004 [90] Discussion about general QoS and Web services topics whilepromoting the SLA-oriented approach.
Table 3.1: QoS-based trading in the domain of Web services.
As mentioned above, Maximilien and Singh [88] propose covering this issue
38

3.1. Exchange of Quality-of-Service Information
with a QoS ontology to provide a common agreement when performing a QoS-based trading. Their approach discusses two major ontologies: One is called “QoSupper ontology” which covers general terms such as “Measurement” or “Attribute”.A definition for such terms is also provided by the QoS-framework published bythe ISO [55] or the UML QoS-Profile from the OMG [99, section 8]. For a moredetailed view, a “QoS middle ontology” defines concrete QoS characteristics anda hierarchy of QoS categories. A similar hierarchy is also covered by the workof the ISO and the OMG [99, section 10]. A “QoS lower ontology” is foreseento include all application and domain specific details. Section 3.2 will discuss theQoS characteristics that are relevant for such an ontology.
3.1.2 The Role of the Retailer
The previous section has introduced three basic patterns of processing QoS in thefield of Web services. These can be abstracted for general application in an SOA: a)using a combined broker, b) using separate brokers or c) direct negotiation betweenservice importer and exporter. Based on these three main patterns, the processingof QoS information from the view of the retailer can be discussed. The role ofthe retailer is special because he acts as a service importer when importing theservices to form a composition and he acts as a service exporter when he providesthe composition to the consumer. All these patterns have in common that a serviceexporter provides his QoS parameters while the submission of QoS requirementsby the service importer is regarded as optional. The three main patterns are asfollows:
• Direct negotiation. The first pattern reflects the proposal of the TINA,where the QoS information is processed individually and decentrally. Inthis scenario, a service importer agrees with the exporter on a service levelagreement. In this agreement a requirement from the importer is optional.Regarding the QoS requirements, two different cases are possible:
– The retailer receives the requirements and then forms the composition,i.e. he selects the set of services that result in a composition that meetsthe given requirements.
– The retailer has formed a composition that meets internal QoS require-ments. Then the retailer advertises the composition for export includ-ing the corresponding QoS statements. Then a consumer can expresshis requirements to see whether these requirements are met by retaileror not.
This setup covers the optimisation of the QoS of the composition with re-spect to the QoS requirements of the consumer. The retailer performs theQoS-based selection which is a part of the trading process. Figure 3.1 sum-marises this setup.
39

3.1. Exchange of Quality-of-Service Information
Retailer 3rd PartyService Provider
Consumer
QoSRequirements
(optional)
QoSParameters
contacts other brokers
contacts other 3rdparty service providers
service advertisements
servicequery
service query
Retailerimports
exports
imports
exportsQoSParameters
QoSRequirements
(optional)
Broker
Figure 3.1: Flow of QoS information without involving a broker.
• Integrated broker. In the second pattern, a broker component is extendedto also process QoS information when trading services. In the field of Webservices, this setup represents the approaches which provide an extensionto existing UDDI repositories. Contrary to the first pattern, the broker pro-cesses the QoS parameters provided by a service exporter who advertiseshis service. When a trading process takes place, the broker can optionallyprocess QoS requirements by the service importer.
Since the retailer represents a service importer and exporter simultaneously,he first queries the broker when forming compositions, optionally with givenQoS requirements. At this point, the QoS-based trading can be performedby two parties:
– Retailer-sided. The retailer queries the broker for the individual ser-vices and receives a set of candidate services from which he must per-form the selection based on QoS criteria. In this case the trading pro-cess is split between the broker and the retailer.
– Broker-sided. The retailer submits a description of the composition tothe broker. Then, the broker can perform the trading process and theQoS-based selection of services. Then the broker would return a list ofselected services.
After the retailer has formed the composition, he can advertise the compo-sition as a new service to export to the broker with the resulting QoS pa-rameters. Then a consumer can query the broker to find appropriate servicesthat comply with given QoS requirements. This setup is represented in Fig-ure 3.1.
• Separate QoS-broker. In the third pattern, a dedicated broker performs the
40

3.1. Exchange of Quality-of-Service Information
Retailer 3rd PartyService Provider
Consumer
Brokeradvertise
query
query
service invocation service invocation
advertise
Retailerimports
exports
imports
exports
QoSRequirements
QoSParameters
QoSRequirements
QoSParameters
contacts other brokers
imports services from other 3rdparty service providers
Figure 3.2: Flow of QoS information involving a broker.
QoS-based selection of the trading process. From the research presented inthe previous section, there is no rule on when to extend an existing brokerfacility and when to establish dedicated structures to process QoS informa-tion for trading services. A motivation for establishing a separate brokerinfrastructure exists, if monitoring and QoS-based optimisation during therun-time are also required. Then, a service repository could focus on thediscovery part of the trading process while a QoS-broker can also monitorthe provided QoS to apply dynamic adaptations.
Figure 3.3 outlines such a setup with a dedicated broker. In this setup, theservice importer queries the general broker for the desired services and re-ceives a set of candidates. As a second step, the service importer queriesthe QoS of the candidates at the dedicated QoS-broker. Like in the previ-ous case, either the retailer performs the QoS-based selection or he submitsa description of the composition to the QoS-broker. In the latter case, theQoS-broker can entirely perform the trading process. After the retailer hasformed the composition, he can advertise the composition as a new serviceat the general broker. Then he submits the referring QoS parameters to theQoS-broker.
These three patterns outline the basic arrangements in a QoS-aware SOA. Ofcourse, other arrangements are possible. For example in a mixed configuration,the retailer accepts the direct negotiation with a consumer but queries a dedicatedQoS-repository to search for the QoS parameters of the service candidates. Thesemixed-variations were ignored because they would not lead to additional conclu-sions besides those that are drawn in the remainder of this section. The following
41

3.1. Exchange of Quality-of-Service Information
Retailer 3rd PartyService Provider
Consumer
GeneralBroker
advertise
query
query
Retailerimports
exports
imports
exports
DedicatedQoS Broker
query advertise
queryadvertise
service invocation service invocation
QoSRequirements
QoSParameters
QoSParameters
QoSRequirements
contacts other brokers
imports servicesfrom other 3rd party
service providers
Figure 3.3: Flow of QoS information involving dedicated brokers.
two characteristics are variable in these three processing patterns when performingthe QoS-based trading:
• Consumer-driven QoS-based trading. The first scenario, which describesthe direct negotiation, describes the case that the consumer submits QoS re-quirements. Then, the retailer performs the selection that also involves therequirements of the consumer. In the opposite case, which is the only casesupported when involving a broker, the retailer considers only own require-ments and advertises the composition as a service with the resulting QoSparameters.
In the case that QoS parameters are advertised at some party representing abroker – regardless of whether dedicated for processing QoS information ornot – and no direct negotiation is supported, then the consumer-driven QoS-based trading cannot be supported: The QoS requirements will be processedat the broker and will not arrive at the retailer.
• Retailer-driven trading. In the first scenario, which describes the directnegotiation, the retailer entirely performs the QoS-based trading. In the twoother processing patterns, either the broker or the retailer can perform thetrading. The problem was outlined in the first chapter: The broker wouldrequire information about the composition in order to perform the trading.From a technical viewpoint, the trading would perform in both cases in thesame way. However, from an organisational point of view two reasons could
42

3.1. Exchange of Quality-of-Service Information
prevent this setup:
1. Performing QoS-based selection to form compositions requires spe-cial logic that is able of finding solutions for the resulting combinato-rial problem. Because it is unclear whether existing and future brokertechnologies will actually support this functionality, the retailer wouldminimise his possibilities to find appropriate services.
2. If the retailer submits information about the business process to the bro-ker, he shares his intellectual property or information of some businessvalue. If broker and retailer do not belong to the same organisation,organisational constraints might prevent such a disclosure of informa-tion.
Based on this clarification, statements can be derived about how the given QoSconcepts relate to the retailer and the other roles. This model represents an ex-tended version of the model given in Figure 1.2 of the first chapter. The previouspart has clarified why the retailer represents the predestined party to perform theQoS-based selection. On the other side, several proposals exist that feature a QoSbroker – either a separate dedicated or extended existing brokers – for trading in-dividual services. As a conclusion, the retailer processes the QoS information ona macro-perspective; he processes the QoS-part of the trading in order to form thecomposition. A potential dedicated QoS-broker processes the QoS on a micro-perspective, because he processes individual queries. In summary, the characteris-tics of the retailer are defined as follows:
The retailer
- performs the QoS establishment of the composition,- features a QoS mechanism to support this establishment, and- is capable of processing QoS information to support the QoS es-
tablishment. The QoS information are the QoS requirements ofthe consumer and the QoS parameters of individual services pro-vided either by a broker or directly by 3rd party service providers.
- In case a broker exists that processes the QoS parameters, theretailer submits them when advertising the composition as a newservice.
The consumer, a broker and the 3rd party provider shall have the followingcharacteristics:
43
3.2. Quality-of-Service Characteristics
The client
- submits QoS requirements, and- receives QoS parameters about the offered composition.- In case a broker exists that processes the QoS parameters, the
QoS information is exchanged with the broker, otherwise theclient communicates directly with the retailer.
The 3rd party service provider
- submits QoS parameters.- In case a broker exists that processes the QoS parameters the
QoS information is submitted to the broker, otherwise directly tothe retailer.
The broker
- performs the QoS establishment of individual services,- features a QoS mechanism to support this establishment, and- is capable of processing QoS information to support the QoS
establishment. The QoS information represents the QoS require-ments of the client or the retailer, and the QoS parameters of in-dividual services from 3rd party service providers or aggregatedservices (taken as individual) from other retailers.
3.2 Quality-of-Service Characteristics
This section discusses the QoS characteristics in detail. It will explain which par-ticular QoS characteristics are relevant in an SOA. More specifically – becausethe topic of this thesis is QoS-based trading – the goal is to determine which QoScharacteristics are considered as selection criteria for the trading of services. Thefirst chapter stated that a requirement to the aggregation method is the indepen-dence from particular QoS characteristics. However, it is still necessary to identifythe relevant characteristics to determine which the trading must support. The QoSFramework published by the Information and Technology Section of the ISO [52]presents a comprehensive set of QoS characteristics grouped into various QoS cat-egories. This standard includes the following categories:
• Time-related. The first category mentioned in this standard covers all QoScharacteristics that use the time as measure, such as the execution time orthe time until the result of a service invocation arrives, which is the responsetime. A related characteristic is the delay. The delay denotes the time inwhich the request is transported over the network. In addition, the standard
44

3.2. Quality-of-Service Characteristics
mentions the notion of lifetime, which describes the time that a service re-mains available.
• Coherence. The coherence describes how well a system maintains relateddata over temporal or spatial distances. Data must be kept coherent if theservice actually provides various individual operations. In this case, the ex-changed data must kept coherent during the individual invocations. Spatialcoherence is required in a distributed system, if related data is distributedamong different computers within this system.
• Capacity. The capacity subsumes different QoS categories that describe ameasure for how much data can be processed within a given period. QoS cat-egories in this sense are for example data capacity, throughput, or process-ing capacity. Throughput denotes how much data can be processed within agiven amount of time.
• Integrity. The integrity describes aspects of correctness when processinginformation. It is related to the concept of accuracy which denotes howmuch a result meets the expectations of the requester.
• Safety. The safety subsumes QoS characteristics that describe to which de-gree the stability of an operation is ensured.
• Security. The security covers different aspects such as the protection of in-formation which also involves a mechanism for access control, or the abilityto authenticate users of a system.
• Reliability. The term “reliability” subsumes a set of very related QoS char-acteristics, namely availability, fault containment, fault tolerance, and main-tainability. For services, the availability represents a measure for how oftena service can be invoked while the reliability describes how often the resultof a service invocation is correct.
This list of categories represents a general set of QoS categories in distributedsystems. Thus, the question rises if all these are relevant for the application in anSOA, especially for the trading. The UML QoS-Profile of the OMG [99, section10] provides a narrowed set of common QoS categories. The authors of the UMLQoS profile suggest reusing these for particular QoS modelling efforts. The UMLQoS-Profile considers also the ISO QoS framework as the main reference for theselection of application-independent categories. Because the UML QoS-Profilewas published six years after the ISO framework, it also reflects, how the differentQoS categories have evolved. It considers the following QoS categories:
• Performance. The UML QoS-Profile does not feature the category “time-related” as mentioned in the ISO standard. It rather uses the performanceto provide a category that includes the time. Mentioned are: throughput, la-tency, efficiency, and demand. The latency denotes the time interval between
45
3.2. Quality-of-Service Characteristics
request and response. The efficiency indirectly denotes the consumption ofresources. The demand is a proposed measure for how many times a serviceis requested.
• Dependability. In the UML QoS-Profile, the category of dependability isrelated to the reliability in the ISO QoS framework. The dependability in-cludes also the availability.
• Security. Compared with the ISO standard, this category includes in theUML QoS-Profile the following aspects: the protection in terms of accessand protection against manipulation and the confidentiality of actors.
• Integrity. The integrity is used with the same meaning as presented in theISO standard.
• Coherence. Like in the case of the ISO QoS framework, the coherence inthis sense refers to the issue that in distributed systems, data might be locallydistributed and therefore must be kept coherent.
This list of QoS categories differs mainly from what the ISO standard proposesby subsuming time-dependent and capacity-dependent categories under the mainconcept of performance. Time and capacity are similar categories; their subsump-tion under performance makes sense. However, similar to the categories mentionedby the ISO standard, the UML QoS-Profile does not explicitly cover the applica-tion in an SOA. Moreover, not all these categories and mentioned characteristicsare relevant for the trading process. An importer can presume that a service is ca-pable of processing data coherently and of ensuring the integrity of data. Thus, thisthesis considers only the categories performance (time and capacity), dependabil-ity (reliability) and security as suitable for trading services from the ISO standardand the UML QoS-Profile.
3.2.1 Quality-of-Service Characteristics for Web Services
Regarding Web services, Menasce has presented different publications which dis-cuss QoS issues in Web services. In his work he mentions as the relevant char-acteristics response time, throughput, security and availability [90]. In furtherwork he also discusses the response time and the cost in compositions of Webservices in particular [91, 92]. Regarding the composition of Web services, Zenget al. have presented a framework for the QoS-aware composition of Web ser-vices [159]. Their work is closely related to this thesis and therefore it will bediscussed in more detail in future sections. Their discussion covers the QoS char-acteristics price, duration, reputation, success rate, and availability. The reputationis a characteristic which is not specifically mentioned by the ISO framework or theUML QoS-Profile. It represents a rating that is provided by an importer based onhis experience with using a service.
46

3.2. Quality-of-Service Characteristics
Patel et al. discussed the modelling of Web services and the creation of ser-vice descriptions which involved also a discussion about different QoS character-istics [105]. Their contribution focusses on a modelling structure for expressingthe QoS of a service. Their selection of QoS characteristics is divided into twocategories: The first category consists of the latency, which is used as a synonymfor response time, throughput, reliability, and cost. The other category is namedinternet-specific and consists of availability, security, accessibility and regulatory.The characteristic regulatory denotes a measure for how well the service complieswith given (organisational) regulations. In addition, Patel et al. define a separateQoS characteristic named task-specific which denotes how well the returned an-swer meets the expectations of the importer.
Section 3.1.2 has introduced different research work about processing QoS inan SOA: One part covers the QoS negotiation based on contracting approaches,another the extension of existing repositories with the ability to process QoS infor-mation. A third part discussed dedicated broker architectures. The contributionsfrom Ludwig et al. (WSLA, [84]) and Tosic et al. (WSOL, [133]) discuss the nego-tiation of QoS. They do not mention particular QoS categories or characteristics.The WSOI, based on the WSOL that Tosic et al. have also presented, focusses onthe response time, which measures the time from the submission of the requestuntil the return of the result when invoking a service [132]. A similar contributionby Ludwig also discusses how to ensure the negotiated QoS from the perspectiveof the service exporter [83]. Regarding the considered QoS characteristics, he dis-cusses those subsumed by the performance category in the UML QoS-Profile.
In the field of UDDI extensions, Ali et al. have introduced the UDDIe. Theygive no particular discussion about QoS characteristics but mention bandwidth asan example [2]. The bandwidth denotes how many requests a service can processwithin a given time and is a synonym for the throughput. Lee, who has also dis-cussed the approach to extend UDDI for processing QoS, discusses the cost, whichis a synonym for price as used by Zeng et al. [159], and the response time as the rel-evant characteristics for Web services [78]. Ran provides the most detailed discus-sion about relevant QoS categories when extending the UDDI specification [112].He introduces a QoS model for Web services that provides the following four maincategories:
• Run-time related. In the group of run-time related characteristics, Ran sub-sumes scalability, which describes a measure for transactions per second, andcapacity which denotes the number of concurrent requests. Moreover, Ranputs performance into this main category, which contains the characteris-tics response time, latency and throughput. According to his work, responsetime denotes the time to process a request. Latency covers the situation thata request is queued at the side of the provider. Throughput shows a strongrelation to scalability and capacity.
As a third sub-category, Ran introduces the reliability, which contains thecharacteristics mean time between failure (MTBF), mean time to failure
47

3.2. Quality-of-Service Characteristics
(MTTF) and mean time to transition (MTTT), of which Ran admits that theyshow a strong relation to the concept of availability. MTBF is usually used ifa failure denotes an exceptional state that can be recovered. MTTF refers toa failure that, in general, cannot be recovered. MTTT represents an unusualcharacteristic. It refers to the idea that an entity can show two general states:a good state and a bad state. Then, the MTTT denotes a measure about howoften a change between the two states occurs [112]. In addition to these threevalues, this category contains also the characteristics robustness, exceptionhandling and accuracy.
• Transaction supporting. With this category, Ran refers to the four mainproperties that represent the standard characteristics of a transaction, whichare atomicity, consistency, isolation and durability, often abbreviated withACID. Since the characteristics of this category are hard to quantify withnumerical measures, this work interprets them as non-functional character-istics.
• Configuration- and cost-related. This group of QoS characteristics relatesto organisational issues of the service and its development. These include“regulatory”, which denotes the compliance with (governmental) regula-tions, a degree for supporting technology standards, stability, which refersto a description of how often the provided functionality is updated, as wellas cost, and completeness. This characteristic denotes the completeness ofprovided functionality.
• Security. This category subsumes a set of standard security aspects whichinclude the provided authentication technique, the supported authorisationmechanism, the facilities to ensure confidentiality, the support accountabilityand auditability, the provided degree of data-encryption, and the providedcounter-measures to prevent repudiation after a service invocation.
Compared to the UML QoS-Profile, the set of security characteristics discussedby Ran is more comprehensive and more specific regarding the SOA. Another dif-ference is that the main category, named “run-time related”, subsumes also thecategory performance along with different other categories like throughput. Theappropriateness of the category for configuration-related QoS characteristics is ar-guable, because they partially cover functional aspects (e.g. the concept of com-pleteness) which might not fit into the scenario of trading services: Would a ser-vice importer query a broker with requirements such as the completeness of theprovided functionality? For this thesis this question is answered negative: Sec-tion 7.2.2 will explain how a presumed matchmaking of functional suitability cov-ers this point. As a conclusion, the characteristics found in Ran’s categories “trans-action supporting” and “configuration”, excluding the cost, are considered not rel-evant to the trading of services. In summary, the relevant QoS categories presentedby Ran are the run-time related, the cost and the security.
48

3.2. Quality-of-Service Characteristics
The third cluster of research work related to the QoS in an SOA is formed by theworks that propose dedicated brokers for the trading of services. Table 3.2 presentsan overview of the considered QoS characteristics in the field of research on bro-kers for trading Web services. Regarding the work of Maximilien and Singh [88],their list of QoS categories and characteristics provides more concepts than listed.They have been omitted, because they were discussed in the work by Ran. The list-ing has the purpose to identify the relevant QoS characteristics for the trading ofservices as identified by other researchers. In summary, these publications mentionvery similar QoS categories. Among the characteristics, the up time and availabil-ity can be considered equal. The same applies to the pair of MTBF and reliability,and the pair of timeliness and latency. If all QoS characteristics that were discussedin at least two of the five mentioned publications are considered relevant, then thelist contains: response time, cost, availability, reliability, and throughput.
Research Group QoS Characteristic
Wang et al., 2004 [136] Categories: performance, reliability, timeliness and se-curity, which each have one referring characteristicassigned.
Degwekar, et al., 2004 [115] Response time, cost, and availability.Maximilien, Response time, cost, latency, throughput,Singh, 2004 [88] capacity, MTBF, and up time.Yu, Lin, 2005 [157] Response time, cost, reliability, and availability.Serhani et al., 2005 [116] Response time, cost, latency, throughput, and availability.
Table 3.2: QoS characteristics in the domain of Web services.
3.2.2 Summary of Quality-of-Service Characteristics
The different fields of research and standards have revealed many similar cate-gories. From the research work mentioned above, the UML QoS-Profile, whichis based on the ISO QoS framework, the work of Ran and the five publicationsmentioned give a broad set of QoS categories. In addition, the previous sectionhas identified the set of commonly discussed QoS characteristics used for Web ser-vice brokers. The common QoS characteristics from these three areas are listed inTable 3.3.
This table mentions the set of common QoS categories that are considered forthe use of service trading: the throughput, the response time, the cost and theavailability. The UML QoS-Profile and the QoS model of Ran also mention the se-curity which can be considered for trading as well. This aspect has been discussedby Wang et al. in detail [136]. In addition to the identified set, Zeng et al. considerthe reputation as relevant for trading [159]. As defined by them, the reputationrepresents a measure for how well a service performs based on the experiences ofdifferent importers. For this thesis, the reputation is also considered as a measure
49

3.2. Quality-of-Service Characteristics
UML QoS-Profile Ran’s QoS Model Research on Web Services
throughput throughput throughputlatency (response time) response time response timeefficiency (cost) cost costavailability availability availabilityreliability reliability reliabilitysecurity security reputation
Table 3.3: Summary of QoS characteristics
to capture non-functional service selection criteria that are usually not expressedwith quantifiable measures. For example, services can be also selected by their or-ganisational affiliation, if a business would like to prefer selected partners, by thecountry from which services are provided, if trade agreements are relevant, or byan individual measure of how much a service provider is trusted. These examplesmake clear that the term reputation is dependent on the view of the user or the partythat assigns reputation values to service providers (cf. Kalepu et al. [69]). The def-inition of a measure that expresses reputation can involve many input parameters.For this work, it is assumed that depending on the different mentioned factors, thereputation results in a absolute value, which is free from a particular value range(contrary to the repsonse time) or unit.
50

Chapter 4
Aggregation of theQuality-of-Servicein Service Compositions
Prior to performing the QoS-based selection, a method that allows the aggregationof the QoS in a composition of services must exist. Based on the given QoS char-acteristics of the individual services, a statement must be derived that covers theQoS characteristics of the composition. Otherwise, a selection algorithm could notdetermine the result of choosing a particular candidate. In addition, if there arerequirements that the composition must meet, there has to be a method that provesif the assigned services will provide the required QoS characteristics.
As the first chapter has explained, such an aggregation must involve the struc-tural arrangement of the services in the composition. Thus, the first step of such amethod is a model that allows the description of the structure. For this model, twomain goals exist:
• Technology independence. The structural model should not rely on existinglanguages to describe compositions. Although Section 2.4.1 has indicatedthat WS-BPEL might play a more important role in the field of service com-positions than similar other proposals, such a structural model should not belimited to this particular proposal. On the other side, the existing composi-tion languages must be considered to determine the relevant structures thatoccur in service compositions.
• Focus on aggregation of QoS. The model must represent an abstractionfrom all technical details and focus only on the information that is neededfor aggregating the QoS characteristics. Composition models might includemore than information relevant for designing and running the composition.Examples are the names of interfaces, the order of exchanged messagesetc., which can be omitted for such a model.
51

4.1. The Business Process Execution Language
4.1 The Business Process Execution Language
WS-BPEL has gained most attention when it comes to the description of servicecompositions. This language allows description of abstract service compositions –or business processes – as well as concrete compositions with individual availableWeb services. The basic element in this language is a process that consists of sub-elements. A sub-element represents a description of a structural part of the process:which services are involved, what information is exchanged, how the execution canbe compensated in case the invocation is cancelled etc.
The structure of the process is important for the aggregation of the QoS andthus, where WS-BPEL is concerned, the structural sub-elements of the processelement are relevant. WS-BPEL supports two ways to describe the structure: Oneis by using the link and flow elements; these elements allow the definition of a di-rect precedence between two tasks or services. With the link element, the order ofinvocations can be described as a directed graph. The second option supports dif-ferent building blocks that allow the modeller to form a recursive graph to describethe structure of the composition. In such a structure, each building block has onein-going edge and one outgoing edge. Each building block defines an executionstructure (e.g. parallel, sequential etc.) and consists of further building blocks orindividual services. Within a building block, only one execution structure applies,for example, in a building block denoting a sequence, all enclosed elements areexecuted sequentially. In WS-BPEL, the building blocks are named “structuredactivities” and support the following execution structures [126, section 12]:
sequence Executes all enclosed elements in a sequence.
if Executes a selection of the enclosed elements according to aBoolean expression. Compared to the C programming language,this is similar to an if-then-else statement.
while Executes the enclosed element while a given expression holds.
repeatUntil Executes the enclosed element until a given expression holds.
pick Executes enclosed activities when a defined triggering conditionoccurs. Compared to the C programming language this is similarto a switch statement.
flow Executes the enclosed activities concurrently. Optionally the exe-cution structure of the enclosed elements can be altered by usingoptional link elements, which can be used to define precedence re-lations between the activities.
forEach Repeats the execution of the enclosed activities for a given num-ber of times. This element can either execute the given amount ofexecutions in parallel or in sequential manner.
In addition, the WS-BPEL also provides special elements for interrupting the
52

4.2. Workflow Patterns
execution for a given amount of time (the wait element) and for just doing nothing(the empty element), which is useful to put an execution on hold until an externalevent occurs. The elements to define arbitrary links among the tasks or servicesin the composition appear redundant to the building block elements. A modellercan design a sequential execution of services by either using the sequence elementor by using the flow element with the corresponding link constructs. A sequenceis a very basic structure that a modeller might use often. Thus, the use of sucha basic building block offers a convenient way to describe simple task or serviceexecutions. Another reason for the integration of these two basic ways is the factthat the predecessor of WS-BPEL, namely BPEL4WS, represents the result of themerge of the XLANG composition language by Microsoft and WSFL by IBM(cf. Section 2.1.2). When comparing these two languages, WSFL provides a flowelement with link elements only [80]. Contrary to that, XLANG does not have sucha flow element but only provides basic building blocks (namely sequence, switch,pick, all, while, empty) [129]. When the two languages were merged in order toform the BPEL4WS language, obviously the authors have decided to keep bothways for describing the composition structure.
Kiepuszewski et al. discuss these two different groups of structural modellingelements for modelling workflows [73]. They distinguish between structured work-flows, which is similar to what the XLANG represents, and arbitrary workflows,which have some standardised routing elements (or- and and-split and join opera-tors) and a defined beginning and ending activity each. Their work explains that thearbitrary workflows have the advantage that they offer a more intuitive and suitableway to model workflows to modellers. Structured workflows have the advantagethat less sophisticated verification mechanisms are needed and that they are eas-ier to implement. The authors mention some examples of workflow managementsystems being capable of processing only structured workflows for these reasons.
In addition, Kiepuszewski et al. discuss in their paper possible transformationsfrom arbitrary to structured workflows. A modeller can use such a transformationto start the modelling of a composition with more intuitive arbitrary workflowsand then he can transform the model into a structured workflow. The discussioncovers transformations based on the duplication of nodes which represent eithertasks or routing elements and the use of auxiliary variables to decide on additionalbranches. Their results show that not all structural occurrences found in an arbitraryworkflow can be transformed into a structured workflow.
4.2 Workflow Patterns
Section 2.1.2 has pointed out that the WS-BPEL represents a popular compositionlanguage in the area of Web services. Thus, the discussion in the previous sec-tion about the capabilities of WS-BPEL is useful to analyse the state-of-the-art incomposition languages. However, one requirement for the structural model is itsindependence from particular languages or standards. An analysis is required that
53

4.2. Workflow Patterns
discusses the structural abilities of different languages available for this purpose.Section 2.2.1 has already mentioned the work of van der Aalst on the commonstructural elements found in composition modelling languages [143]. His workrefers to a prior work by him and his colleagues about common patterns foundin workflow management systems named workflow patterns [146]. The followingpart introduces the workflow patterns and discusses which patterns are relevant fora structural model for the aggregation of QoS.
The workflow patterns were created to define abstract capabilities for the com-parison workflow management systems. They mainly describe the capability ofexecuting different workflow structures and the functional behaviour of these sys-tems. A main benefit of these patterns lies in the ability to compare workflow man-agement systems by their functional rather by their non-functional aspects (likeplatform requirements or usage of hardware resources). Considering the workflowpatterns offers the following advantages for this work:
• Technology independence. The workflow patterns are independent fromparticular technologies or composition languages. The workflow patternswere designed to provide a uniform approach for the comparison of work-flow management systems and their flow definition languages. Thus, the pat-terns can be regarded as a comprehensive description of the structural char-acteristics of different workflow management systems and flow languages.
• Matureness. The first version of the workflow patterns was published in2000 [145] and were revised since then in 2003 [146]. Also, different re-searchers and industrial efforts have taken up the patterns.1 Therefore, thework about the workflow patterns can be regarded as often-reviewed re-search.
• Service compositions. As pointed out in Section 2.3, the existing compo-sition languages have their roots in the modelling languages for workflows.As mentioned, a comparison of these languages based on the workflow pat-terns already exists [143], as well as a detailed analysis of the flow languageBPEL4WS [151]. In these works, the authors explain the strong similaritybetween characteristics of workflows and service compositions.
Regarding the second requirement, which is the focus on QoS aggregation, theworkflow patterns contain many elements that are not relevant for the aggregationof QoS. For example, the Pattern 19 “Cancel Case” describes the ability to cancela running process. The application of the QoS aggregation to perform QoS-basedselection takes place at the design time (cf. Chapter 7); it is about the planning ofthe composition. Consequently, the QoS aggregation is not concerned with capa-bilities such as cancelling a running composition and thus this workflow pattern is
1The research group working on the workflow patterns has published a com-prehensive overview about the impact and use of their patterns on the Internet athttp://is.tm.tue.nl/research/patterns/impact.htm.
54

4.2. Workflow Patterns
No. Workflow pattern Synonym(s) Rel. Abstraction
Basic control flow patterns1 Sequence Sequential routing Y Sequence2 Parallel split AND-split Y AND-split3 Synchronisation AND-join Y AND-join4 Exclusive choice XOR-split Y XOR-split5 Simple merge XOR-join Y General joinAdvanced branching and synchronisation patterns6 Multi-choice OR-split Y OR-split7 Synchronising merge Synchronising join Y OR-join8 Multi-merge Y AND-split
with AND-join9 Discriminator m-out-of-n, partial join Y m-out-of-nStructural patterns10 Arbitrary cycles Loop, iteration, cycle Y flow-link, loops11 Implicit termination Nothing to do anymore NPatterns involving multiple instances12 M.I. without synchronisation Y AND-split
with AND-join13 M.I. with a priori design time knowledge Y represented by
patterns 2-914 M.I. with a priori runtime knowledge N15 M.I. without a priori runtime knowledge N
State-based patterns16 Deferred choice External choice, Y XOR-split
deferred XOR-split17 Interlv’d parallel routing Unordered sequence Y Sequence18 Milestone Test arc, state condition, N
Withdraw messageCancellation patterns19 Cancel activity Withdraw activity (Y) Immediate End20 Cancel case Withdraw case N
Table 4.1: Workflow patterns [146] and their relevance for the QoS aggregation.
ignored in the discussion about QoS aggregation. Regarding the basic control flowpatterns and the advanced branching and synchronisation patterns, these are alsorelevant for a structural model to aggregate the QoS. From the section “structuralpatterns”, the arbitrary cycles are considered relevant. From that the remainingsections, starting with “Multiple Instances”, they require an additional discussion.
Table 4.1 summarises the described workflow patterns. In addition, the tablelists also the relevance of a pattern for the QoS aggregation as well as its proposedstructural abstraction. As a main rationale, only patterns are relevant that addressthe structure at design time. The identification for some patterns is trivial (e.g. forthe a sequence). For the parallel and conditional routing constructs, basic abstrac-tion is used: The interpretation of an AND-element is to involve all possible tasks,
55
4.2. Workflow Patterns
whereas the XOR-element involves exactly one possible task. The OR-elementinvolves less than all but more than one possible task. However, other patternsrequire some discussion about the relevance for composition:
• Multi-merge. This pattern describes a specific join operation of parallelexecutions in a workflow arriving at the joining point. At this point, for eachexecution thread arriving in parallel, the execution environment starts onefollowing separate thread with execution of the following activities. Thesepatterns can be simulated in the modelling phase by using AND-splits andAND-join operations for the QoS-aggregation.
• Arbitrary cycles. This pattern covers the ability to express precedence linksbetween tasks in the workflow that form a loop. It allows links that go outsidea building block, if a composition language provides the concept of buildingblocks. As Kiepuszewski et al. have pointed out, this pattern separates thestructured workflow models from the arbitrary workflows [73]. The simpleloop can be found among the structured activities of WS-BPEL (i.e. while,repeatUntil). However, the simple loop represents only a special case of whatis covered by this pattern. The support of arbitrary loops will be discussedin detail in Section 4.5.
• Implicit termination. The implicit termination pattern denotes that an en-gine is capable of terminating the flow, if no processable data is availableanymore. Whether an end is explicitly stated or ends implicitly does nothave an impact on the aggregation of QoS properties during design time.Therefore, this pattern is not taken into account.
• Patterns involving multiple instances. This set of patterns generally targetsthe run-time abilities of a workflow management system. Therefore, in themodelling phase, each workflow or each composition can be seen as oneunit for property aggregation. If at design time, the number of instances isalready known, this results in a parallel split (for the workflow patterns 12and 13) with an open end. If the number of instances is determined duringruntime (workflow patterns 14 and 15) the handling of QoS properties mustbe processed by the run-time environment of the composition and thereforeis not taken into account in the modelling process. The result of the QoSaggregation for this case would be a QoS statement covering one instance.
• Deferred choice. The difference between a deferred choice in workflowcontext and the XOR-split is that, in the deferred choice, the split is per-formed based on external input while the standard XOR-split relies on in-formation being part of the workflow. In the description of the workflowpatterns, the deferred choice is referred to as a “state based pattern”. Conse-quently, it is not regarded for having an impact on the modelling phase.
56
4.3. Structural Model of Service Compositions
• Interleaved parallel routing. This pattern describes that involved tasks aresequentially executed in an arbitrary order. In case of the aggregation ofQoS, this pattern is subsumed by the concept of a plain sequence. The up-coming Section 4.3 will explain why the order is not relevant for the QoSaggregation of sequential tasks.
• Milestone. In the case of service compositions, this pattern is not relevantbecause describes the ability of a workflow management system to triggeran external activity once a particular point in the workflow has been reached.Such a behaviour that does not affect the QoS of the workflow or of theservice composition itself. Furthermore this pattern is also not supported byany of the flow languages analysed in [143].
• Cancel activity. This pattern describes the functionality to stop the workflowexecution at a given time. Since this pattern can occur at any place in theworkflow, no specific routing element or structural pattern can be given. Apossible solution for the QoS aggregation emulates this behaviour with anXOR-split and a following link to the end of the workflow. The support ofsuch a pattern will be discussed in Section 4.5.1.
• Cancel case. This cancellation pattern describes the ability of workflowmanagement systems to cancel the execution of a workflow. Regarding theQoS aggregation at design time, this is regarded as exceptional behaviourand thus not considered relevant.
The abstraction results in three relevant sequential structural patterns: the triv-ial sequence, an unordered sequence, and a basic loop. For the parallel and condi-tional cases, the abstraction covers different split and join operations, which can besummarised mainly in AND-, OR-, and XOR-split and -join operations. The nextsection will discuss how these abstractions can be used to form a structural modelof the composition in order to perform the QoS aggregation.
4.3 Structural Model of Service Compositions
Based on the analysis of the workflow patterns in the previous section, a structuralmodel can be derived that provides the necessary structural elements for modellingservice compositions for the QoS aggregation. The approach transforms a descrip-tion of a composition into such a model. Then, an algorithm performs the aggrega-tion on this model. This approach for the aggregation has been already introducedin previous work (cf. Jaeger et al. [59, 63, 64]).
The introduced model has been build upon on structural patterns rather thana classification of QoS values. In the previous work, it has been explained thatclassification approaches for QoS characteristics are not helpful to establish an ag-gregation mechanism. Software can use the properties of different characteristicsto consider aspects such as the direction (i.e. either a larger or smaller value denotes
57

4.3. Structural Model of Service Compositions
better QoS), the definition (e.g. average, percentile, fixed value), or the value type(e.g. relative, absolute). However, QoS characteristics show many different prop-erties and thus cannot lead to a unified approach as the following points explain:
• A general differentiation between increasing or decreasing directions can beapplied for every QoS characteristic, because it is assumed that every QoScharacteristic provides the concept of better or worse. However, an aggre-gation rule for one dimension still can be different depending on, whetherrelative or absolute numerical values are processed.
• QoS characteristics might have a direction but show only discrete values.As a consequence, the aggregation requires a different algorithm than forcontinuous dimensions: Instead of a calculation particular rules must be per-formed.
• QoS characteristics might refer to a statistical definition – like the variance,the mean or percentiles. For example, considering percentiles, the aggrega-tion must cover specific definitions for aggregation rules covering parallelarrangements.
• Beyond the three mentioned points, QoS characteristics can have differentmeasures, making an aggregation also more complicated.
• The definition of QoS characteristics may vary depending on the environ-ment. Thus, a classification of QoS characteristics for generalisation cannotbe established. Instead, a software environment that performs the aggrega-tion must cover relevant QoS characteristics for a specific application caseand provide the exact definitions of the aggregation rules for the selectedcategories.
Algorithms to aggregate the QoS in compositions already exist. For example,Zeng et al. have discussed an algorithm which finds the shortest (or longest) pathin a graph in order to determine the maximum response time [159]. However, asthe five points mentioned above indicate, for the different properties that a QoScharacteristic can show, many different algorithms must be implemented in orderto cover the different kinds and facets.
The work of Puschner and Schedl about calculating maximum execution timesof computer programs [111] has already been mentioned as the work that inspiredthe idea of aggregating QoS in compositions. In their work, the authors presenttwo main approaches: one works on the building blocks of a structured model tocalculate execution times and the other is oriented to find a path in a graph-basedstructure. A particular graph-based approach by Puschner and Schedl expressesthe problem as an integer linear programming problem, which can be solved withexisting software tools. Besides, their work covers only the execution time andthus other QoS characteristics are not supported.
58

4.3. Structural Model of Service Compositions
For this work, an approach is preferred that defines aggregation methods for thebasic building blocks found in compositions – depending on the relevant QoS char-acteristics of the application case. For each of these structural elements – calledcomposition patterns in the remainder of this work – aggregation rules are definedfor each QoS characteristic. Then, an arrangement of composition patterns can beused to represent a model of an existing composition. Based on the aggregatedQoS statement for a particular composition pattern, an algorithm can aggregateeach pattern by aggregating sub-patterns until the entire composition is covered. Inaddition, such an aggregation method requires some basic assumptions to provideuseful QoS statements as a result (cf. Jaeger et al. [63]):
• Independence. It is assumed that the services in the composition do notdepend on each other regarding their successful execution. This assump-tion presumes that the result of the execution or the delivered QoS of oneservice does not affect the QoS characteristics of other services. Dependen-cies would occur, for example, if a computer would host multiple services ofthe composition and therefore have a common point potential failure whichwould affect QoS characteristics, such as the reliability, in a specific way.
• Trust. For the aggregation of QoS it is assumed that the given values of aservice are correct. Trusting the correctness of QoS information representsa separate issue from the algorithmic aggregation. For the discussion aboutthe aggregation, it is assumed that the QoS of individual services representsan already negotiated and accepted agreement between service importer andexporter.
• Uniformity. For the aggregation, it is assumed that the given values arecompatible to each other. All individual values must conform to a commongroup of measures. For example, it is assumed that a property describingthe response time uses compatible measures such as milliseconds, seconds,or minutes. Furthermore, it is assumed that all given values conform to thesame definition. For example, all services start and end from the same pointof measurements to define the response time, e.g. when the request has beensubmitted and the response has been delivered completely.
• Equipartition. The aggregation of QoS for selection of services to forma composition takes place at the design time. In this phase, it is assumedthat the execution environment executes services in conditional join and splitcases with equal probability. For example, if in the case of an XOR-split thecurrent flow chooses a service from a number of services, it is assumed thatthe execution of the service follows an uniform distribution. The coverageof other kinds of distributions represents a possible extension to the compo-sition model.
Based on the workflow patterns and these considerations, a model consistingof nine basic composition patterns can be derived. Figure 4.1 shows these patterns
59

4.3. Structural Model of Service Compositions
using a simple notation that indicates directed graphs. This notation uses rectangu-lar boxes to denote a routing element and it uses circles to denote a task. Arrowsdefine the precedence relations between the tasks and routing elements. From thesepatterns, two sequential patterns are defined (cf. Jaeger et al. [63]):
AND SPLIT
ANDJOIN
(...)
AND SPLIT
XORJOIN
(...)
XOR SPLIT
XORJOIN
(...)
OR SPLIT
ORJOIN
(...)
OR SPLIT
m/nJOIN
(...)
LOOPEND
(...)
CP4
CP6
CP3
CP7 CP8
CP1 CP2
SEQSTART
SEQEND
LOOPSTART
AND SPLIT
m/nJOIN
(...)
CP5
OR SPLIT
XORJOIN
(...)
CP9
Figure 4.1: Composition patterns.
• Sequence of service executions (CP1). A sequence can prescribe a spe-cific order in which an execution environment executes the services. Al-ternatively, the execution environment executes the services sequentially inan arbitrary order. For the aggregation model, the order of the executionsis not relevant. The aggregation rules for the sequence of service execu-tions, which will be introduced in a subsequent section, entirely operate onunordered sets, or represent an addition or multiplication of the individualvalues. Since a set contains elements without any applied order and the ad-dition and multiplication shows commutativity, such aggregation rules canbe also applied to any order of execution.
• Simple Loop (CP2). The execution of a service or a sub-arrangement ofservices and composition patterns is repeated for a certain amount of times.
For the parallel and conditional patterns, the relevant workflow patterns do notfit directly into a model for aggregation. The reason is that for the algorithmicaggregation of values, not only the split but also the join condition must be consid-ered. This can be shown by the following example: In the example, the minimumresponse time is subject for aggregation. If a flow splits into a number of parallelflows, three join structures could be possible:
60

4.3. Structural Model of Service Compositions
a) joining with synchronisation of all parallel flows or
b) joining with synchronisation of one flow, and
c) allowing joining of more than one flow but less than all flows.
Figure 4.2 shows an example of the three setups with each three services showing aminim execution of 3, 5 and 7 units. In case a), the minimum response time wouldbe the minimum response time of the greatest value (the slowest). In case b), thesmallest of the involved values represents the minimum response time possible.For the case c), the relevant value depends on the number of considered flows forsynchronisation: For example, if two flows are relevant for synchronisation, thesecond-smallest value denotes the minimum response time of this structure. Itmust be noted that this example presumes that after the synchronising flow hasarrived the other flows are ignored.
AND SPLIT
7 3
ANDJOIN
AND SPLIT
7 3
XORJOIN
AND SPLIT
7 3
2/3JOIN
5 5
a) b) c)
5
Figure 4.2: Example of join-relevant aggregation of response time.
In addition, another reason exists for combining different split and join pat-terns: A model that consists of composition patterns can be aggregated by a re-cursively working algorithm. Then, an algorithm must identify independent, self-contained atomic patterns in the composition. Consequently, each atomic structuremust show a defined start and end of service executions. In the first example, var-ious combinations between split and join operations are possible. However, onlya part of them make sense in combination. For example, an XOR-split cannotoccur in combination with an AND-join. The following relevant composition pat-terns were identified from the theoretically possible combinations (cf. Jaeger etal. [63, 59]:
• XOR-split followed by an XOR-join (CP3). In a parallel arrangement onlyone task is started. Thus, the synchronising operation synchronises only thestarted task.
• AND-split followed by an AND-join (CP4). From a parallel arrangementall tasks are started, and all tasks are required to finish for synchronisation.
61
4.3. Structural Model of Service Compositions
• AND-split followed by a m-out-of-n-join (CP5). From a parallel arrange-ment all n tasks are started, but less m < n tasks are required to finish forsynchronisation.
• AND-split followed by an XOR-join (CP6). From a parallel arrangementall n tasks are started, but just one task is required to finish for synchronisa-tion. This pattern has been introduced by Ladner [77] as was then publishedas an extension to the original model [63].
• OR-split followed by OR-join (CP7). In a parallel arrangement a subset ofthe available tasks is started, and all of the started tasks are required to finishfor synchronisation. For example, from four available services, the run-timeenvironment starts always three of them which must also finish successfully.
• OR-split followed by a m-out-of-n-join (CP8). In a parallel arrangementa subset of n tasks of all are started, and m < n tasks are required to finishfor synchronisation. For example, from four available services, the run-timeenvironment starts always three, of which two must finish successfully.
• OR-split followed by n XOR-join (CP9). In a parallel arrangement a sub-set of n tasks of all are started, and only one task is required to finish forsynchronisation. This pattern has also been introduced by Ladner [77] as anextension to the original model of composition patterns.
Based on these elements, a structural model of the composition can be createdthat meets the following characteristics:
1. The structural model is a directed graph consisting of nodes which representtasks and nodes which represent routing elements.
2. The arrangement of the nodes and routing elements is as such that the entiremodel can be collapsed into one node by applying the set of compositionpatterns as shown in Figure 4.1. This implies the following points:
• This graph must not contain loops except those matching the loop pat-tern.
• The routing elements must be used pair-wise as defined in Figure 4.1.
• The graph must start with a routing element that has only one or moreoutgoing paths and end with a corresponding routing element that hasonly one or more incoming paths.
• Within such pairs of routing elements, the number of outgoing paths ofa splitting or starting element must be equal to the number of incomingpaths of the corresponding joining or ending element.
62

4.3. Structural Model of Service Compositions
3. Besides “normal” tasks and services, empty tasks that do not perform anyfunctionality are possible. Empty tasks are necessary to form structures thatare not directly supported by the given nine patterns. The application ofthese tasks will be explained further in the upcoming Section 4.5. Emptytasks behave neutral in terms of the applied QoS characteristics, i.e. theirinvocation costs nothing, does not take any time etc.
4. For drawing such structures by using the patterns as shown in Figure 4.1,the sequential pattern elements will be simplified and thus, the starting andending element will not be shown. Moreover, empty tasks will not be drawnbut just represent a line between one starting routing element and the corre-sponding finishing routing element.
The above mentioned description defines a structural model that preserves theprecedence among tasks in a composition structure while conforming to the struc-tural elements represented by the composition patterns. However, for the aggrega-tion method, which will be introduced in the next section, the precedence relationsbetween the elements in a sequence do not have an impact on the aggregation ofthe QoS values. An order of the elements is not required for the aggregation, andthus, the enclosed elements of a sequence can be represented by a set. Since prece-dence relations do not exist between the elements of parallel structures, a set isan adequate representation structure for these elements as well. The result fromthese considerations is a data structure that represents the composition structure asfollows:
• A composition structure is represented by a set K1.
• The set K1 can contain tasks of the composition t1, . . . , ti or further sub-setsK2, . . . , Kj .
• Each set Kx has a special type assigned, namely one of the compositionpatterns CP1, . . . , CP9.
• Any set Kx can contain tasks or further sub-sets.
This model poses the requirement that a composition structure can be repre-sented functionally equivalent by the recursive structure of task-pattern-sets. Thislimitation prevents the direct application of this structural model to compositionmodels which allow the use of arbitrary links between the tasks or services. Theconcept of flow and link elements found in WS-BPEL represents an example forsuch structures. The limitations of such a structured model has been discussed byKiepuszewski et al. [73] and the upcoming Section 4.5 will give a further discus-sion on these limitations.
63

4.4. A Method for Quality-of-Service Aggregation
4.4 A Method for Quality-of-Service Aggregation
The basic approach for the aggregation is to step-wisely collapse a graph represent-ing the composition structure into a single node by alternately aggregating simplesequences and parallel service executions. Figure 4.3 outlines this method: An al-gorithm would identify composition patterns and subsequently perform the aggre-gation on the level of each pattern until one statement remains. Thus, the algorithmdoes not consider the entire graph at once from a global perspective, but rather onlylocal composition patterns.
AND SPLIT
ANDJOIN
AND SPLIT
m/nJOIN
XORJOIN
XOR SPLIT
AND
SPLIT
m/nJOIN
XORJOIN
XOR SPLIT
XORJOIN
XOR SPLIT
XORJOIN
XOR SPLIT
Figure 4.3: Collapsing the graph step by step.
This approach builds on the aggregation of different QoS characteristics foreach set Kx, which is defined to refer to a particular composition pattern. There-fore, for each characteristic and for each pattern type an aggregation rule must bedefined. A basic set of aggregation rules has already been discussed in previouswork (cf. Jaeger et al. [63, 64]. For this thesis, the discussion is extended andcovers the different QoS characteristics that were mentioned in Section 3.2.
In the following sub-sections, the aggregation of relevant QoS characteristicsis discussed and defined. For the definition, the following notation is used: k rep-resents the number of services that the considered pattern contains, l represents theassumed number of repetitions for the loop pattern, xi represents a given value foreach service with index i denoting a particular element, and K is the set containingall xi. For the case that a set K contains one more sub-sets, the method presumesthat these have been aggregated first and thus are represented in K by a single valueas well. The variable xa represents the aggregated value. In the previous work, nhas been used as the variable that refers to the individual services which collidedwith the “m-out-n-join”-constructs from the notation of the composition patterns.
This aggregation model requires two remarks: The first remark covers the looppattern and the second covers the OR-split patterns. For the case that the number of
64

4.4. A Method for Quality-of-Service Aggregation
loops will be determined at run-time, the model does not represent the loop patternsufficiently. For example in WS-BPEL, the condition of a loop statement is definedwith a Boolean expression (with a while-construct) and consequently the numberof loops can be determined at run-time only. However, an algorithm must knowthe number of occurring loops for the aggregation of QoS. Otherwise, the modelrepresents an estimation about the number of loops. Generally, the aggregation ruleas proposed for the loop case would fit well in monitoring the QoS for analysis.Nevertheless, it cannot serve as a decision support in the modelling process if theaggregation task does not know the number of loops at the design time.
To address the OR-splits, an aggregation model must know which paths aretaken into account for this split. To determine the upper and lower bound for QoSvalues all combinations of possible splits must be considered. The result is a set ofpossible combinations. For example, if a 2-out-of-5-OR-structure has the followingelements K = x1, x2, x3, x4, x5, then the possible combinations would be:
KC = x1, x2, x1, x3, x1, x4, . . . , x4, x5
In general, the resulting set KC contains all relevant combinations of the tasksdepending on the OR-split and -join semantics. Then, an aggregation function canevaluate the resulting QoS of individual combinations. To simplify the notationin the tables, a notation is defined that a function fC is applied to the relevantcombinations of elements represented by individual sets in KC :
f(fC(KC)) := f(fC(Ssub),∀Ssub ∈ KC
)where Ssub denotes an arbitrary combination in KC .The introduced model presumes that a transformation transforms the flow de-
scription of a composition into this model of composition patterns. UpcomingSection 4.5 will discuss such transformations further. Once such a representationexists, a selection process can perform the aggregation of QoS categories based onthe QoS of the individual tasks.
Regarding the related work, other ideas and proposals for patterns exist to de-scribe the structural arrangements of service compositions. Specifically for thecompositions of services, Yang et al. have proposed a set of structural patterns todefine the execution flow characteristics of a service composition [155]. Florescouet al. have developed an XML-based programming language to define executionstatements to form characteristics of Web services [33]. WS-BPEL [126] can beseen as a general purpose flow language which represents also a structural modelof a flow.
Besides the flow or workflow languages, the Object Management Group (OMG)has proposed a Unified Modelling Language (UML) which also provides elementsfor expressing a flow structure. The UML provides the activity diagram that ser-vices this purpose [100]. Activity diagrams contain also the concepts of sequences,parallel splits and joins. All these languages that were identified for describing
65

4.4. A Method for Quality-of-Service Aggregation
compositions have in common that they cover different purposes than the aggrega-tion of QoS. Such purposes can be, for example, the definition of a control flow inorder to parameterise an execution environment. The composition patterns insteadrepresent a set of structural elements for modelling compositions specifically de-signed for the aggregation of QoS values derived from the workflow patterns. Thenext sections will explain the aggregation for a selection of QoS characteristics,which were introduced in Section 3.2: throughput, response time, cost, availabilityand encryption grade.
4.4.1 Aggregation of Throughput
The throughput of a service denotes the amount of processable data per time unit.Usually, the throughput is given in requests per second and is interpreted as anincreasing dimension, which means that a higher value denotes a better quality.The throughput can also denote the processable amount of data within a giventime. However, the request per time matches better the characteristics of a serviceinvocation and is thus preferred over the data per time. Otherwise the question risesif all services with different functionality in the composition process the data in acomparable way. Then, a detailed discussion for each case is necessary.
In a sequence, the node with the lowest value assigned determines the through-put for the aggregated property. In a parallel arrangement, it is possible thatprocessable data splits among the parallel tasks. In this case, the aggregation ofthroughput would result in addition of the throughput values of the individual ser-vices. It is also possible that individual requests are split among the tasks. Thiswould result in an addition of the given values as well. However, such an arrange-ment presumes that all the parallel services provide the same functionality. If thescenario is to implement a business model, it can be presumed that such redundan-cies are not taken into account on the level of the business model. Thus, such aredundant arrangement can be considered on an optional basis.
For the aggregation of throughput in parallel cases, the set of starting servicesis considered relevant. Otherwise, the server will refuse additional requests, if thelimit of maximum possible requests is exceeded. Therefore, to ensure the success-ful execution of the composition, all services must be fully capable of accepting theoccurring invocations. The aggregation of throughput is shown in Table 4.2. Thegiven rules are based on the assumption that a service provider provides statementsabout the guaranteed minimum and maximum throughput.
4.4.2 Aggregation of Response Time
Contrary to the throughput, the response time is a decreasing dimension, meaningthat a lower value is preferred. As mentioned in Section 3.2, the response timeand latency or the execution time are used as synonyms. The response time of aservice can be defined as the sum of time to transfer the request and response overa network and the time for queuing the request on the provider side (latency), and
66

4.4. A Method for Quality-of-Service Aggregation
# Comp. Pattern Maximum Throughput Minimum Throughput
1 Sequence xa = minx1, . . . , xk xa = minx1, . . . , xk2 Loop xa = x xa = x
3 XOR-XOR xa = maxx1, . . . , xk xa = minx1, . . . , xk4 AND-AND xa = minx1, . . . , xk xa = minx1, . . . , xk5 AND-N/M xa = minx1, . . . , xk xa = minx1, . . . , xk6 AND-XOR xa = maxx1, . . . , xk xa = minx1, . . . , xk
7 OR-OR xa = max“min(KC)
”xa = minx1, . . . , xk
8 OR-N/M xa = max“min(KC)
”xa = minx1, . . . , xk
9 OR-XOR xa = maxx1, . . . , xk xa = minx1, . . . , xk
Table 4.2: Aggregation rules for throughput.
the time to process the request (cf. Ran, introduced in Section 3.2.1):
ttotal = ttransfer + tqueuing + tprocessing
The entire time needed to perform a task, i.e. ttotal, is considered for this work.Applying the method to the aggregation, a definition for lower and upper boundsis shown in Table 4.3. In a sequence and a loop, the time is determined by thesum of the values of each service invocation. In a sequential case, the definitionsfor lower and upper bounds are the same. Because the response time represents adecreasing measure, the largest value in a parallel arrangement of services denotesthe worst case. The nature of the response time also demonstrates that consideringthe same split operation (AND), different join operations result in different aggre-gation rules. To determine the minimum response time in the AND-AND case, thelargest value of all involved services denotes the overall minimum value. However,for the AND-XOR pattern, the smallest represents the relevant value.
4.4.3 Aggregation of Cost
The cost of a service represents a measure for the resources consumed by a serviceexecution. Therefore, the cost can be seen as a decreasing dimension, where alower value denotes better quality. For the cost, two main models are possible: Forexample, Tosic et al. mention two payment methods: a pay-per-use use model thatconsiders the number of service invocations and a subscription model that allowsconsumers to invoke a service on a flat-rate basis [133]. For the aggregation ofcost, it is important that all statements refer to the same payment model.
Table 4.4 shows the aggregation definitions for the upper and lower bounds ofthe cost. Contrary to the response time, an aggregation rule must take all startedservices into account, regardless of whether they are relevant for the join operationor not. To cover the OR-split statements, the function sum(. . .) denotes to add theelements in each of the sets in KC .
67

4.4. A Method for Quality-of-Service Aggregation
# Comp. Pattern Maximum Response Time Minimum Response Time
1 Sequence xa =Pk
i=1 xi xa =Pk
i=1 xi
2 Loop xa = lx xa = lx
3 XOR-XOR xa = maxx1, . . . , xk xa = minx1, . . . , xk4 AND-AND xa = maxx1, . . . , xk xa = maxx1, . . . , xk5 AND-N/M xa = maxx1, . . . , xk xa = minx1, . . . , xk6 AND-XOR xa = maxx1, . . . , xk xa = minx1, . . . , xk
7 OR-OR xa = maxx1, . . . , xk xa = min“max(KC)
”1
8 OR-N/M xa = maxx1, . . . , xk xa = min“max(KC)
”1
9 OR-XOR xa = maxx1, . . . , xk xa = minx1, . . . , xk1For example, considering three tasks out of five, the min of the 3rd quickest is relevant.
Table 4.3: Aggregation rules for the response time.
# Pattern Maximum Cost Minimum Cost
1 Sequence xa =Pk
i=1 xi xa =Pk
i=1 xi
2 Loop xa = lx xa = lx
3 XOR-XOR xa = maxx1, . . . , xk xa = minx1, . . . , xk4 AND-AND xa =
Pki=1 xi xa =
Pki=1 xi
5 AND-N/M xa =Pk
i=1 xi xa =Pk
i=1 xi
6 AND-XOR xa =Pk
i=1 xi xa =Pk
i=1 xi
7 OR-OR xa = max
sum(KC)
ffxa = min
sum(KC)
ff8 OR-N/M xa = max
sum(KC)
ffxa = min
sum(KC)
ff8 OR-XOR xa = max
sum(KC)
ffxa = min
sum(KC)
ff
Table 4.4: Aggregation rules for the cost.
4.4.4 Aggregation of Availability and Reliability
Also discussed in Section 3.2, the terms availability and reliability show similari-ties. The UML QoS-Profile discusses both the reliability and the availability. Theauthor Ran discusses the availability as a characteristic denoting whether a ser-vice is present and ready for immediate use (cf. Section 3.2.1). Then, the avail-ability is defined by the quotient of the available time divided by the total timeconsidered [112]. For this discussion, the following definition of availability forrepairable systems is considered:
A =MTTF
MTTF + MTTR
In this equation, MTTR denotes the mean time to repair and MTTF denotes
68

4.4. A Method for Quality-of-Service Aggregation
the mean to failure, defined as MTTF =∫∞0 R(t)dt. In this definition the func-
tion R(t) defines the probability that a system fails against the time.This concept of availability represents an increasing dimension and according
to this definition cannot, it exceed the value of 1. The availability is presented as aprobability, because a service exporter cannot predict whether a failure will happenwith the first or 1000th service invocation. As a consequence, for the aggregation,the values are also taken as probabilities. For a sequence, this means that the ag-gregated availability or reliability results from the multiplication of the individualvalues. In parallel cases, all invoked services are relevant for the availability, whilefor the reliability only the services required for the synchronising operation areconsidered. Table 4.5 shows the aggregation rules for the availability. To coverthe OR-split statements, the function prod(. . .) denotes to multiply the elements ineach of the sets in KC .
# Comp. Pattern Availability
1 Sequence xa =Qk
i=1 xi
2 Loop xa = xl
3 XOR-XOR xa = minx1, . . . , xk4 AND-AND xa =
Qki=1 xi
5 AND-N/M xa =Qk
i=1 xi
6 AND-1 xa =Qk
i=1 xi
7 OR-OR xa = max
prod(KC)
ff8 OR-N/M xa = max
prod(KC)
ff9 OR-N/M xa = max
prod(KC)
ffTable 4.5: Aggregation rules for the availability.
4.4.5 Aggregation of Reputation and Fidelity
Zeng et al. have defined a reputation based on the idea of a user-given ranking, likethe online store Amazon allows ranking of products or the auction platform ebayallows ranking of the users [159]. Furthermore, as mentioned in Section 3.2.2,the reputation can be also considered as a measure to capture non-functional ser-vice selection criteria that are usually not expressed with quantifiable measures.One reason why the reputation is considered for this thesis is its characteristic:The reputation represents an increasing dimension that might be an absolute value(contrary to the availability) but an aggregation rule cannot summarise the valuesin a sequential arrangement for example. Thus, it must be aggregated differently asdiscussed for the other QoS categories. Kalepu et al. have discussed the reputationin the sense of the fidelity concept in detail [69]. According to their discussion,
69

4.4. A Method for Quality-of-Service Aggregation
a general concept of reputation suffers from the fact that such a measure dependson the subjective evaluation of individual users. Such a metric would benefit froma comprehensive approach which eliminates subjective and counterproductive rat-ings.
The fidelity denotes a measure for the overall quality of a service execution.A formal, general definition of the fidelity is not given here, because the nature ofthe fidelity depends on many aspects, such as the purpose of the composition, theapplication domain, the nature of the output etc. Modelling and measuring the fi-delity has been discussed for workflow applications (cf. Cardoso et al. [17]). Com-pared with the reputation, the fidelity represents a more precisely defined measurewhereas the reputation asks for a plain judgement of individual consumers.
For the reputation, different aggregation rules are possible. For this thesis, theidea has been considered that the reputation represents the mean average of theranks given by individual users. This is also the interpretation of Zeng at al. [159].Consequently, the aggregation of reputation values should represent the average ofthe individual services. It is assumed that such an aggregation rule would also suitan aggregation of the fidelity. Other definitions can consider that the worst repu-tation value is relevant. For example in ebay, users tend to focus on the negativeratings while almost ignoring the positive ones. Thus, it is also possible to aggre-gate reputation by considering the worst values. Table 4.6 shows the aggregationrules based on the mean-value consideration.
4.4.6 Aggregation of Encryption Grade
The security can be interpreted in many different ways, as the UML QoS-Profilehas explained. Most of the characteristics show a binary nature: Either the servicesupports a security characteristic (for example, an authentication method, facilitiesto ensure confidentiality etc., as discussed by Ran [112]), or the service does not.The aggregation of these binary characteristics does not require much conventionthat would require a particular aggregation method: If a security characteristic isrequired, each of the involved service candidates must provide this characteristic.
The only characteristic that can be described with numerical values is a mea-sure that determines the length of a key that is used for encryption. Encryptionalgorithms use a key either to encrypt data or to create an electronic signature. Asa rule of thumb, the longer an encryption key is the more difficult it is to break theencryption or to damage the signature. Consequently, this characteristic shows anincreasing direction where a larger size denotes better quality.
For the aggregation of the encryption level in sequential patterns, the weakestkey is considered significant. In the parallel case, the encryption level is a non-functional characteristic, which must be fulfilled by all significant parallel nodesin the same manner. However, if the node does not fulfil a demanded level ofencryption, the execution would be worthless. Thus, this dimension is discrete andthe aggregation based on, for example, the average of involved services cannot beapplied. The aggregation for the encryption is listed in Table 4.6.
70

4.5. Support of Un-Structured Models
# Comp. Pattern Reputation Encryption Grade
1 Sequence xa = 1k
Pki=1 xi xa = minx1, . . . , xk
2 Loop xa = x xa = x
3 XOR-XOR xa = 1k
Pki=1 xi xa = minx1, . . . , xk
4 AND-AND xa = 1k
Pki=1 xi xa = minx1, . . . , xk
5 AND-N/M xa = 1k
Pki=1 xi xa = minx1, . . . , xk
6 AND-1 xa = 1k
Pki=1 xi xa = minx1, . . . , xk
7 OR-OR xa = 1k
Pki=1 xi xa = minx1, . . . , xk
8 OR-N/M xa = 1k
Pki=1 xi xa = minx1, . . . , xk
9 OR-1 xa = 1k
Pki=1 xi xa = minx1, . . . , xk
Table 4.6: Aggregation rules for the mean reputation and the encryption level.
4.5 Support of Un-Structured Models
The structural model that is used by the aggregation method is not capable of ex-pressing all possible structures of control flows. As mentioned in Section 4.2, thestructural model considered by the aggregation method is equivalent to a structuredworkflow model (SWM), discussed by Kiepuszewski et al. [73]. However, flowstructures are possible that do not conform to SWMs. Kiepuszewski et al. namethem arbitrary workflow models and they define the following characteristics forthem:
1. An arbitrary workflow consists of sets of process elements (i.e. nodes ina graph) and sets of transitions between process elements (i.e. edges in agraph). Two types of process elements exist: tasks and a set of routing ele-ments which are similar to the composition patterns.
2. Regarding the routing elements that split the flow, AND- and OR-splits areconsidered. The AND-split has the same semantic as introduced for the com-position patterns and the OR-split has the same semantic as the introducedXOR-split.
3. Regarding the routing elements that join paths, AND- and OR-joins are con-sidered analogously. The OR-join has a different semantic compared withthe XOR-join: For each incoming path, the routing element starts one in-stance of the following flow. The AND-join has the same semantic as theAND-join of the composition patterns.
4. Similarly to the composition patterns, process elements that do not have in-coming paths represent initial items and process elements that do not haveoutgoing paths represent final items.
71

4.5. Support of Un-Structured Models
5. Furthermore, Kiepuszewski et al. consider the following additional assump-tions: For example, all initial activities are supposed to start concurrently,and the workflow ends when all ending process elements have been reached,following an “until there is nothing else to do”-idea.
The main characteristic of an arbitrary workflow model is that the process el-ements that split and join different paths can be arranged with fewer restrictionscompared with an SWM. Considering WS-BPEL as an example, the flow and linkelements allow forming structures that cannot be expressed as an SWM. Contraryto these two elements, WS-BPEL also includes elements named structured activi-ties that comply with an SWM. Besides WS-BPEL, the workflow patterns by vander Aalst et al. indicate that the arbitrary models are considered in the workflowdomain, for example, as indicated by the arbitrary loop pattern. The advantage ofallowing such arbitrary links between tasks and routing elements is obviously a bet-ter expressiveness in terms of which structural arrangements can be modelled. Thedownside of allowing such arbitrary models is that an invalid structural model canlead to deadlocking situations when the workflow or the composition is executed.
The arguments used in discussion about arbitrary workflows versus SWMs isrelated to the classic discussion on the use of go to-statements in program code.The discussion has influenced the design of programming languages, because ar-bitrary jumps in a program flow were considered “harmful” (cf. Djikstra [23] andKnuth [74]): Allowing go to-statements would tempt programmers to write un-structured, error-prone and hard-to-verify program code. Moreover, many caseswere identified for which programmers use go to-statements, but could have usedmore appropriate structures to express an algorithm (e.g. a while-statement). Knuthdrew the conclusion that it depends on individual application cases whether go to-statements are useful and offer advantages or they can be omitted by more appropri-ate programming constructs [74]. The same considerations apply when discussingadvantages of SWMs over arbitrary workflow models.
This section will discuss examples that require the use of arbitrary workflowmodels. In the following, three main example cases of arbitrary workflows arepresented that do not conform to an SWM: 1) a splitting or joining routing ele-ment does not have a corresponding closing element, 2) arbitrary loops or go to-statements and 3) nested patterns where the flow from one pattern is directed insideanother pattern.
4.5.1 Open Elements
The first case occurs if routing elements are not used in pairs or if correspondingrouting elements do not form pairs in terms of the number of outgoing and incom-ing paths. The graph (a) shown in Figure 4.4 represents such a constellation: AnAND-split element has two outgoing paths and no corresponding join element isprovided. In a similar case, the open AND-split has a number of outgoing paths,but a corresponding AND-join element has less incoming paths. Because of the
72

4.5. Support of Un-Structured Models
missing joining element or path in this example, the pattern-wise aggregation can-not be performed.
It must be noted that the diagram (b) shown in Figure 4.4 has the same patternof an open AND-split. In this case the solution would be to add the two missingjoining elements. This modification is possible, because a part of the definition forarbitrary workflows presumes that all final activities must end, in order to deter-mine the end of the entire flow. Thus, adding the corresponding AND-splits wouldnot change the operational behaviour. Obviously, the problem of open AND-splitsoccurs if this element is placed within another parallel element. In addition, theproblem can occur with open parallel joining elements in the way that the compo-sition starts at different at once. For these cases it is assumed that all starting nodeswill be invoked at the same time. A corresponding example is shown in graph (c)of Figure 4.4.
AND SPLIT
AND SPLIT
ANDJOIN
AND SPLIT
AND SPLIT
1
2
3 75
4 6
(a) (b)
AND SPLIT
AND SPLIT
1
2
3 7
5
4
6
ANDJOIN
ANDJOIN
AND SPLIT
AND JOIN
ANDJOIN
(c)
Figure 4.4: Examples of open parallel structures.
4.5.2 Arbitrary Loops
In a second case, loops are used in an unstructured manner. Such loops can pointfrom inside of one pattern element into another pattern element. The diagram (a)shown in Figure 4.5 has a loop coming from a parallel structure pointing backto a place outside this structure. The pattern-wise aggregation cannot take placebecause of the open AND-split and the open XOR-join structure.
Contrary to that, a loop that occurs inside another pattern still conforms to anSWM. The graph (b) in Figure 4.5 shows such a structure. A possible transforma-tion into a structured model can be obtained by replacing the split and join routingelements with the loop pattern. This case shows that a loop only becomes prob-lematic for structured models if the enclosing pattern is left.
73

4.5. Support of Un-Structured Models
AND SPLIT
AND SPLIT
ANDJOIN
XOR JOIN
AND SPLIT
XOR JOIN
(a) (b)
LOOPEND
LOOPSTART
Figure 4.5: Examples of loops.
4.5.3 Nested Patterns
As the third case, a path can leave “its” pattern and point to a joining element ofanother pattern. Figure 4.6 shows an example of such a structure with three models(a), (b) and (c). The example given in (a) has been discussed by Kiepuszewski etal. [73] and by van der Aalst [144] and it serves as the classic case when it comesto the discussion of expressiveness among workflow or composition languages.All splitting and joining routing elements have a corresponding counterpart and allelements have two outgoing or incoming paths respectively.
The graph (b) also represents a special case, which Kiepuszewski et al. discussas a specific overlapping structure. The graph (c) gives also an example for anoccurring deadlock: The main two paths are never followed at the same time butboth are required when the flow arrives at the lower AND-join elements. As aresult, this structure results in a deadlocking situation. In all three cases, a pattern-wise aggregation cannot be performed, because every pair of AND-split and -joinelements shows a dependency to an element outside of the pattern.
4.5.4 Transformations to Structured Workflow Models
The three cases introduced above represent structural arrangements that cannot bemodelled with SWMs. As a consequence, the proposed aggregation model cannotbe applied. Kiepuszewski et al. [73] have proposed transformations that convert ar-bitrary workflows into equivalent SWMs in order to cope with this problem. Theirapproach is to utilise node duplication and the use of auxiliary variables to form ad-ditional conditional branches. With node duplication, the invocation of tasks in thecomposition is duplicated. The authors have shown the equivalence of an arbitraryworkflow to a corresponding SWM by using a technique named bi-simulation. Byapplying the bi-simulation technique, the equivalence of two graphs can be deter-mined by a node-wise comparison of the possible states. Kiepuszewski et al. have
74

4.5. Support of Un-Structured Models
AND SPLIT
XORJOIN
XOR SPLIT
XORJOIN
AND SPLIT
XORJOIN
AND SPLIT
ANDJOIN
XORJOIN
AND SPLIT
ANDJOIN
XOR SPLIT
(b) (c)
AND SPLIT
ANDJOIN
AND SPLIT
ANDJOIN
(a)
Figure 4.6: Examples of nested patterns.
shown the following:
• A transformation is always possible if an arbitrary workflow model doesnot contain any tasks executed in parallel. For this case, only splits are al-lowed that branch into exactly one flow. The equivalent structure of thecomposition patterns is the combination of XOR-split and -join elements.Transformations can also applied to structural models that contain an arbi-trary loop.
• A transformation is not always possible if a model contains a parallel splitor join element without its corresponding element or that contains nestedstructures. The authors explain that only models that contain parallel struc-tures and that overlap in a predefined way (as shown in graph (b) of Fig-ure 4.6), or do not merge at some point (as shown in graph (b) of Figure 4.4)can be transformed into an SWM.
Transforming Parallel Cases to Structured Workflow Models
Kiepuszewski et al. have distinguished six sub-cases of parallel flows. For eachit was discussed whether a transformation to an SWM is possible or not. Fromthese six cases, they have identified four which allow deadlocking flows. Suchstructures cannot be transformed into an SWM until this deadlock potential hasbeen eliminated. The remaining two cases are named parallel exits (cf. Figure 4.4(a)), and a synchronised entry into a parallel structure (cf. Figure 4.4 (c)). Forthese two structures, Kiepuszewski et al. have shown that no transformations intoan SWM are possible.
The case of open parallel structures and the case of arbitrary loops representsuch parallel exits or synchronised entries. They can be modelled as a nested ar-rangement of parallel structures. For the case of the open parallel structures, it is
75

4.5. Support of Un-Structured Models
assumed that all starting tasks start at the same time. For the ending tasks, it is as-sumed that all need to end in order to finish the entire composition. Then, an AND-split or an AND-join respectively can be added as it is shown in Figure 4.7 (a). Theresult is a composition structure that shows nested parallel routing elements. Thisnested structure is still not compatible with the proposed aggregation method andthus, the aggregation cannot be performed.
In the case of occurring loops, a loop structure can be unrolled. This is alsonamed “loop unwinding”. By loop unrolling, the looped part of the execution flowis written repeatedly for the amount of loops. Of course, this also presumes thatthe amount of loops is known at design time or at least a maximum number ofloops can be guessed. In the previous section, it was explained that knowing thenumber of occurring loops in advance is necessary to perform the QoS aggregationin general. Therefore, only this case is considered for the aggregation model. Ifthe number of loops is known, then the loop can be unrolled: The repeated partis added to the graph as shown in 4.7 (b). The loop case can also be seen as avariant of the case of nested parallel routing elements. And as a consequence, theaggregation cannot be applied as well.
AND SPLIT
AND SPLIT
ANDJOIN
(a)
AND SPLIT
AND SPLIT
ANDJOIN
XOR JOIN
(b)
AND SPLIT
AND SPLIT
ANDJOIN
ANDJOIN
AND SPLIT
AND SPLIT
ANDJOIN
XOR JOIN
AND SPLIT
AND SPLIT
ANDJOIN
ANDJOIN
(...)
Figure 4.7: Open parallel and arbitrary loop structures and possible transforma-tions.
Kiepuszewski et al. discuss the classical example of nested parallel elements,which is shown again in graph (a) of the Figure 4.8: In this graph, two pairs ofsequential tasks are executed in parallel. In addition, after the task 1 has beenfinished it synchronises with the first task of the other path only. For this case,Kiepuszewski et al. have proven that it is not possible to transform the arbitraryworkflow into an SWM with equivalent functional behaviour, because the parallelpaths have inter-relating dependencies.
It must be noted that conditional branches do not result in this difficulty: Thecase shown in graph (b), without parallel but with conditional branches, can be
76

4.5. Support of Un-Structured Models
AND SPLIT
3 4
ANDJOIN
AND SPLIT
ANDJOIN
21
AND SPLIT
3 4
XORJOIN
XOR SPLIT
ANDJOIN
21
XOR SPLIT
3 4
ANDJOIN
AND SPLIT
XORJOIN
21
XOR SPLIT
3 4
XORJOIN
XOR SPLIT
XORJOIN
21
(a) (b) (c) (d)
XOR SPLIT
3 XORJOIN
XOR SPLIT
21
3*
XORJOIN
4
Figure 4.8: Structures that contain nested parallelism.
transformed into a structured model using node duplication: The first XOR-splitdefines that only one of the outgoing paths is started. Thus, the first XOR-joinafter task 1 always has only one possible incoming path. Then, the middle XOR-join could be dropped and to the XOR-split element, a corresponding XOR-joinelement with a duplicated node 3 can be added. Because the given aggregationrules consider only the selection of a minimum or a maximum value, the additionalnode will not change the result of the aggregated QoS as compared with a manualinspection of the QoS, which would involve the paths (1,3), (2,3), (2,4).
The example shown in graph (c) represents a case which would result in adeadlock, because the AND-join routing element would wait for both incomingpaths, but only one of them would have been started before. A similar exampleis given by graph (d) where the given structure can result in a deadlock: It couldhappen that the right path does not arrive at the bottom AND-join element. Bothexamples do represent valid workflow models. However, their execution can resultin erratic behaviour. Both examples also show the disadvantage of using arbitrarystructures: It is possible that deadlocking flows can be defined while structuredmodels prevent any irregular behaviour.
Transforming Parallel Cases to Non-Equivalent SWMs
The goal of the discussion given by Kiepuszewski et al. is to provide transfor-mations that result in functional equivalence compared with the original arbitraryworkflows. This is a different goal from what is required for the aggregationmethod: For the aggregation, structural models are required that result in suit-able QoS statements referring to the original arbitrary model. Thus, not the func-tional equivalence is relevant for transformations between arbitrary workflows andSWMs. The proposed transformation focusses on the main example given in Fig-ure 4.8(a), because of its relevance for loop-unrolling and open parallel structures.
The proposed transformation is outlined in Figure 4.9 with two examples (a)
77
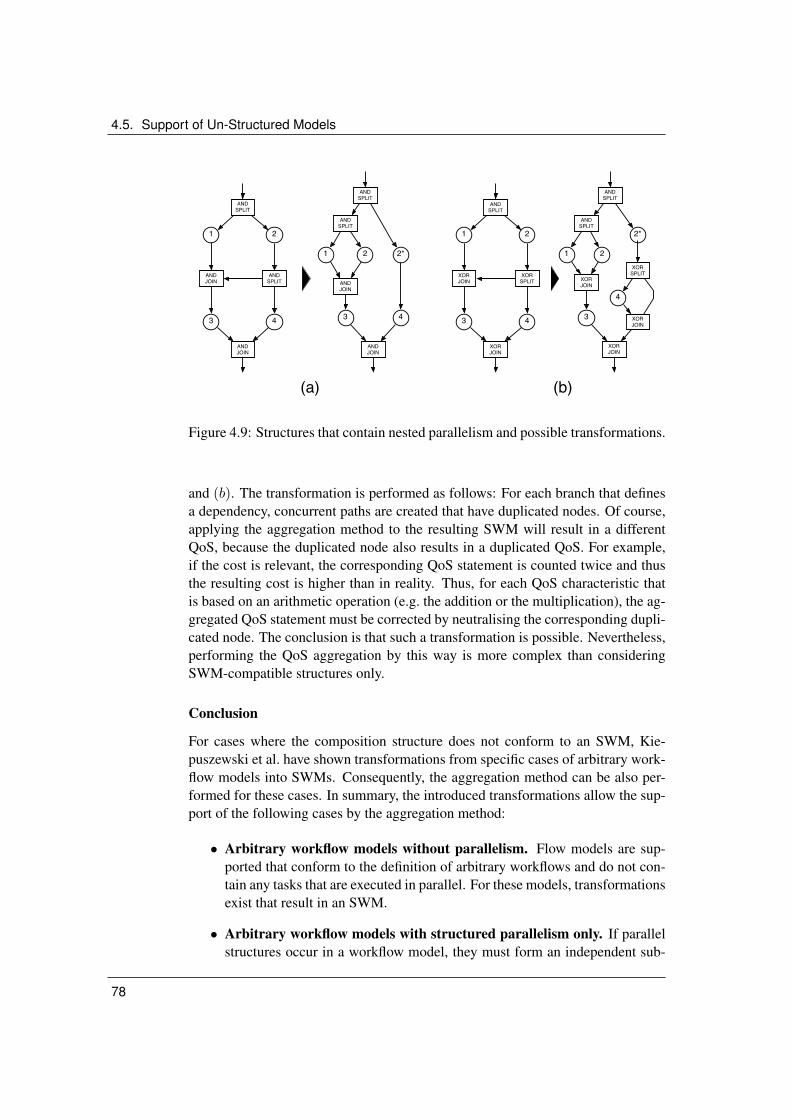
4.5. Support of Un-Structured Models
AND SPLIT
3 4
ANDJOIN
AND SPLIT
ANDJOIN
21
XOR SPLIT
3 4
XORJOIN
AND SPLIT
XORJOIN
21
3 4
ANDJOIN
AND SPLIT
ANDJOIN
21
(a) (b)
2*
3
4
XORJOIN
AND SPLIT
XORJOIN
21
2*
XOR SPLIT
XORJOIN
AND SPLIT
AND SPLIT
Figure 4.9: Structures that contain nested parallelism and possible transformations.
and (b). The transformation is performed as follows: For each branch that definesa dependency, concurrent paths are created that have duplicated nodes. Of course,applying the aggregation method to the resulting SWM will result in a differentQoS, because the duplicated node also results in a duplicated QoS. For example,if the cost is relevant, the corresponding QoS statement is counted twice and thusthe resulting cost is higher than in reality. Thus, for each QoS characteristic thatis based on an arithmetic operation (e.g. the addition or the multiplication), the ag-gregated QoS statement must be corrected by neutralising the corresponding dupli-cated node. The conclusion is that such a transformation is possible. Nevertheless,performing the QoS aggregation by this way is more complex than consideringSWM-compatible structures only.
Conclusion
For cases where the composition structure does not conform to an SWM, Kie-puszewski et al. have shown transformations from specific cases of arbitrary work-flow models into SWMs. Consequently, the aggregation method can be also per-formed for these cases. In summary, the introduced transformations allow the sup-port of the following cases by the aggregation method:
• Arbitrary workflow models without parallelism. Flow models are sup-ported that conform to the definition of arbitrary workflows and do not con-tain any tasks that are executed in parallel. For these models, transformationsexist that result in an SWM.
• Arbitrary workflow models with structured parallelism only. If parallelstructures occur in a workflow model, they must form an independent sub-
78

4.6. Related Methods for Quality-of-Service Aggregation
part that conforms to the definition of an SWM. For these models, transfor-mations can be also applied to achieve a model that can be entirely reducedinto one statement.
• Arbitrary workflow models with special cases of unstructured paral-lelism. Special cases of parallel flows that do not conform to SWMs can betransformed into an SWM. The work of Kiepuszewski et al. has discussedsuch special cases of unstructured parallelism and showed correspondingtransformations [73].
Regarding the remaining structures, in particular the nested parallelism, a trans-formation is possible that would result in a functionally different SWM. In addi-tion, the aggregation method would also require a modification to process the QoSon the resulting model. Such a method raises the efforts to perform the aggrega-tion method. The decision that the aggregation method only covers SWMs and theabove mentioned three cases of arbitrary workflow models represents a compro-mise between support of possible flow models and feasible QoS aggregation.
4.6 Related Methods for Quality-of-Service Aggregation
The work of Puschner and Schedl was already mentioned. Besides their own ap-proach, the authors mention also a couple of related research efforts in the fieldof software development for real-time environments [111]. Contributions to thisfield either presume a structured model like SWMs to allow the computation ofresponse times or propose specific approaches that cover the response time and ameasure for reliability. Thus, these approaches were not regarded as feasible as afoundation for an aggregation method that covers different QoS characteristics inservice compositions.
Lee discusses the problem of QoS-based selection to form compositions [78].To achieve QoS statements for the composition, he proposes aggregating cost andresponse time by the addition of individual values. This approach does not result inwrong statements. However, a structure-aware model leads to a more appropriatestatement that will be closer to the delivered QoS during run-time. For example,only one of the values in parallel XOR-structures is relevant instead of the addedtotal. An addition of all the response time values presumes that all tasks in the com-position will be executed in a sequential manner. Thus the proposed aggregationby forming a sum is limited to covering this case. Yu and Lin [158] also consider asequential structure, which includes either a sequence of tasks or, as they mention,a service composition that shows a sequence of invocations that is considered to berelevant for the composition. As explained for the aggregation method by Lee, theresulting QoS statements might not be as close to the run-time QoS as the valuesobtained by the pattern-based aggregation for parallel structures.
Zeng et al. present a framework that covers many aspects of forming compo-sitions while considering the QoS as selection criteria [159]. In their work, they
79

4.6. Related Methods for Quality-of-Service Aggregation
use a more detailed method than the aggregation proposed by Lee. They discussa set of QoS characteristics, but they also make clear that their approach is notlimited to these. Their aggregation method specifically considers the execution du-ration, which is equivalent to the response time mentioned in this thesis. In theirapproach, an algorithm identifies a critical path that shows the longest time for thegiven setup. Then, the addition of the individual QoS values is taken as the resultfor the overall execution of the composition. For the other QoS characteristics, theproposal is to consider the QoS values of the tasks that belong to the critical path.For example, to aggregate values for availability, the product of the tasks of thecritical path is relevant. This approach is justified with the assumption that taskswhich do not belong to the critical path will also not affect the resulting QoS duringrun-time.
Although this method might deliver appropriate results, an example can begiven where the pattern-based aggregation will lead to a more precise aggregatedstatement. This example is shown in Figure 4.10: An arrangement of four tasksis given from which only one will be invoked at a time (the XOR-split). In thisarrangement, a critical path algorithm considering the execution or response timewould identify the path with task 2. Consequently, the resulting availability forthis statement is 0.98. If it is assumed that the other paths will be taken with areasonable frequency, the resulting availability will be lower than 0.98. Thus, theproposal to consider the average mean results in a statement which is more likelyto reflect the QoS during run-time.
XORJOIN
XOR SPLIT
3
1
2
4
exec time: 170availability: 0.99
exec time: 210availability: 0.98
exec time: 40availability: 0.90
exec time: 100availability: 0.95
Figure 4.10: Example for the aggregation based on a critical path.
A possible extension to the proposed aggregation method by Zeng et al. wouldbe to apply the critical path algorithm not only to the execution or response timebut also to the other QoS characteristics. Based on the critical path found for eachQoS characteristic, the product or the sum of the individual values will also lead tosimilar results as the pattern-based aggregation does. However, this approach leads
80

4.7. Aggregation for Quality-of-Service Monitoring
to the problem that, for each considered QoS characteristic, an algorithm must bedesigned that identifies the critical path. This is considered to be more complexthan the definition of aggregation rules for structured patterns.
Cardoso discusses the aggregation of QoS in the context of workflows [15].He proposes a structured model as well and accordingly the aggregation methodis based on defined sets of structural patterns. Their contribution also includesthe probability of invocations in conditional parallel structures, which is similarto the monitoring approach discussed in the previous section. The approach ofCardoso does not cover the m-out-of-n-joins (and splits) as mentioned among theworkflow patterns by van der Aalst et al. By using only AND- and XOR-elements,the semantics of the m-out-of-n joins can be simulated as van der Aalst et al. haveshown [146]. However, this equivalent structure, achieved by using the simplerrouting elements, represents an arbitrary workflow model and cannot be covered bythe aggregation method that presumes an SWM. Thus, these additional structureswere added to cover also these patterns. Then, the resulting QoS statement for thecomposition will be more precise.
4.7 Aggregation for Quality-of-Service Monitoring
The pattern-based aggregation method can be also applied to values that resultfrom monitoring the QoS of the composition during run-time. With monitoringfunctionality, a retailer can capture the resulting QoS when the particular servicesare invoked. For this monitoring process, a centralised, mediator-based structure ispresumed. Different setups of compositions are ignored for this discussion, suchas the brokered composition or a composition in a peer-to-peer environment asdescribed by Hull et al. [48]. The research conducted in the field of monitoringworkflows is also called workflow history management. Koksal et al. discussed themotivations for monitoring workflows, and among the main reasons the followingapply as motivation in the field of service compositions [75]:
• Recovery and Balancing. Changes in the delivered QoS are inherent char-acteristics of open distributed systems [35]. Service importers want to detectQoS violations during the run-time and establish appropriate recovery activ-ities. For example, a service invocation might take longer than guaranteedand then compensation activities must be established. From the perspec-tive of the service exporter, another motivation for monitoring the QoS is toensure different QoS parameters negotiated with different exporters. For ex-ample, a service exporter must prioritise between different service importersin case of shortages.
• QoS Analysis. If metrics about the response are captured, it is possible tocheck whether services are delivered with the desired QoS or not. However,monitoring the QoS only applies to metrics that can be directly derived fromthe execution, such as response time or availability. For example, capturing
81

4.7. Aggregation for Quality-of-Service Monitoring
the cost during the execution depends on the payment method (flat-rate vs.per-request).
The response time of the invocation of individual services can be used toanalyse the performance. Then, the main performance bottlenecks of thecomposition can be identified. Regarding other QoS characteristics, themonitored invocation frequency of particular tasks in conditional branchescan lead to a more precise aggregation of other QoS characteristics, such asthe availability.
• Controlling. The intended application of service compositions is the reali-sation of an entire business process or parts of it. Financial controllers canbenefit from up-to-date information about the progress or running instancesof the composition. By the aggregation of the cost it can be determined, howmany resources were consumed and how many resources might be consumedwithin a given time.
To establish recovery tasks when errors occur during the execution or to checkthe delivered QoS of individual services, the aggregation of QoS values is not re-quired. However, to analyse the performance of the composition, and to predictfuture characteristics for controlling purposes, the proposed aggregation of QoSvalues can be performed to deliver a more accurate estimation of the deliveredQoS.
In order to capture the delivered QoS in a Web service environment, differentapproaches that share the mentioned motivations already exist. Then managementinfrastructure WSOI developed by Tosic et al. provides the monitoring of the QoSand that facilitates the exchange of services in case of unfavourable QoS [132].This contribution targets the first motivation mentioned for monitoring. Techni-cally, the functionality is achieved with an additional management tier on the sideof the service exporter. A retailer can use such a facility to adapt the QoS param-eters delivered to the consumer. Erradi and Maheshwari propose a system withsimilar objectives, but contrary to the work of Tosic et al., they promote a separatebroker-oriented infrastructure that can cover services of different exporters [28].This approach results in a new role independent from the retailer and the 3rd partyservice provider. Dogdu and Mamidenna specifically discuss such an independentbroker component that performs the invocation instead of the service importer [25].With such an arrangement, this component can specifically monitor the QoS andperform balancing among the pending requests, to provide an efficient schedulingof invocations.
Baresi et al. have also discussed the monitoring of the QoS in service com-positions [5]. They propose an infrastructure consisting of software componentsthat a retailer would use. In addition, they provide modules that 3rd party serviceproviders can integrate into their service infrastructure in order to stay compatiblewith the monitoring environment of the retailer.
82

4.7. Aggregation for Quality-of-Service Monitoring
4.7.1 Aggregation of Mean Values
The difference between the aggregation during the modelling or the design timeand run-time lies in the nature of the computed values: The QoS aggregation dur-ing design time provides proper upper and lower limits of a QoS characteristic,like cost or response time. For QoS categories that require a mean-oriented aggre-gation, the aggregation performed at design time represents an estimation. How-ever, to properly calculate mean values from the given individual QoS statements,the aggregation rule must know the distribution of task executions in conditionalbranches in advance.
During run-time, monitoring facilities can also capture the distribution of ser-vice executions in branching structures. Based on monitoring data, an aggregationalgorithm can consider the invocation occurrences to apply a weight to the indi-vidual values. Then, the aggregation would result in an extrapolation of values inparallel structures. For the given aggregation rules in Table 4.7, the weighted meanfor parallel patterns is considered. The definition distinguishes between the weightof each value in the split operation gi and the weight of each value in the join op-eration hi, where the index i refers to the individual service. The aggregation rulesfor mean response time and mean cost are given in Table 4.7. To cover the OR-splitstatements, the function sum(. . .) denotes to add the elements of the enclosed set,if this set contains the values. Or it denotes to result in individual sums from theenclosed set of sets (in the case of sum(KC)).
The aggregation of mean response time represents a special case: An appro-priate approximation for all parallel patterns except the XOR-XOR combinationcannot be given. The following example explains the reason: A parallel AND-AND arrangement contains three services. In this case, the distribution for the splitand join condition does not matter. It is assumed that all the services execute eitherin 3 or in 7 seconds – each by a probability of 50%. The aggregation for this par-allel arrangement would result in the value 5. Considering the setup, it is likely (ata probability of 0, 875%) that at least one of the services would need 7 seconds, sothe mean for the aggregation should result in a value closer to 7 than the value 5.
This example shows that for characteristics that have aggregation rules depend-ing on the join operation (as the response time), an aggregation method must takethe resulting distribution of the provided QoS into account or as an alternative, itmust capture the delivered QoS directly. This applies to all parallel arrangementswith a synchronising join involving more than one service. The average mean ofthe given mean values would lead to a useless calculation. Thus, the proposed ag-gregation rules can only refer to the upper and lower limits of response time. Inaddition, the weighted mean must be interpreted as a statistical measure and thusthe aggregation does not make sense for just covering very few executions.
83

4.7. Aggregation for Quality-of-Service Monitoring
# Pattern Mean Response Time Mean Cost
1 Sequence xa =Pk
i=1 xi xa =Pk
i=1 xi
2 Loop xa = lx xa = lx
3 XOR-XOR xa = 1k
Pki=1 gixi xa =
Pki=1 gixi
4 AND-AND (see text) xa =Pk
i=1 xi
5 AND-N/M (see text) xa =Pk
i=1 xi
6 AND-1 (see text) xa =Pk
i=1 xi
7 OR-OR (see text) xa = 1|KC |
sum“sum(KC)
”8 OR-N/M (see text) xa = 1
|KC |sum
“sum(KC)
”9 OR-1 (see text) xa = 1
|KC |sum
“sum(KC)
”Table 4.7: Aggregation rules for the mean response time and the mean cost.
84

Chapter 5
Quality-of-Service-basedSelection of Services
The introduction in Chapter 1 has presented the abstract parts of service tradingas specified by the RM-ODP. Performing these parts subsequently narrows downthe set of available services in order to identify the optimal selection of servicesto perform the tasks of the composition. According to the trading specification,these parts are as follows: 1) a keyword-based search among the available servicesfor a rough pre-filtering, 2) a matchmaking process identifying services that matchthe required functionality to perform the according tasks, 3) a selection processthat assigns one candidate for each task in accordance with the selection criteria,i.e. non-functional or QoS requirements, and 4) the application specific of tradingpolicies.
This chapter will discuss the third step of these four. It will discuss the selec-tion process from a combinatorial point of view; the discussion will focus on theabstract functionality of this process rather than refer to specific technologies. Inthe process, the QoS serves as selection criteria and the resulting problem is namedthe “QoS-based selection”.
In Section 5.1, an introduction to the selection problem is presented. Based onthe given description of this problem, a problem model will be defined in the subse-quent Section 5.2. The problem model provides the basis to discuss several aspectsof the selection problem: a) it enables the comparison with other known combina-torial problems (Section 5.3), b) it is used for the discussion about computationalefforts to solve the problem, given in Section 5.3.5, and c) it is the basis for theexplanation of different heuristics when applied to the problem. The application ofthe heuristics will be discussed in Section 5.4 of this chapter.
5.1 Introduction to the Selection Problem
The trading specification provides the foundation for discussion on QoS-based se-lection in this work. As one of the main presuppositions defined by this specifica-
85

5.1. Introduction to the Selection Problem
tion, it is presumed that the matchmaking process identifies functionally suitablecandidates and that this step results in more than one candidate for a particulartask. Otherwise, if the matchmaking has determined only one candidate for a task,the selection is trivial and the only one identified service is assigned. Furthermore,it is assumed that each task requires a different functionality and thus, the servicecandidates each represent a candidate for a particular task.
If more than one candidate is available to be assigned to perform a particulartask, a selection must be made among them. As explained in Section 3.1.2, the re-tailer sets different – at least more than one – QoS requirements that serve as selec-tion criteria applied to the set of candidates. Two basic kinds of QoS requirementsare possible: Either the retailer sets one or more constraints that refer to a specificQoS characteristic, or the retailer identifies one or more QoS characteristics thatare subject to optimisation. Chapter 3 has identified different QoS characteristicsrelevant for the application in service compositions, which are therefore relevantfor the QoS-based selection. These characteristics are the throughput, the responsetime, the cost, the reliability, the availability, security aspects and the reputation ofa service provider.
To explain the nature of the selection problem, the first chapter has presenteda simple example (cf. Section 1.3) of a composition that arranges two tasks inparallel. In this example the optimisation of response time and cost representedthe selection criteria. The given example has suggested that a problem with theselection arises in parallel structures with two or more selection criteria. However,a composition that arranges all involved tasks in a sequence can also result in acombinatorial problem when the QoS-based selection is applied: As an example, asequence of tasks can be considered. For each task, more than one candidate exists.The optimisation goal is to achieve the lowest response time of the composition.In addition, a constraint on the cost is set, denoting that the assignment of servicesmust not exceed a given cost limit.
The problem can be formulated as follows: a represents the number of tasksand bi represents the number of candidates referring to a particular task denoted byindex i. Then, an integer programming formulation is as follows:
minimise tagg =a∑
i=1
bi∑j=1
pijtij
while keeping climit ≥a∑
i=1
bi∑j=1
pijcij
and 1 =bi∑
j=1
pij ∀i ∈ 1, . . . , a, pij ∈ 0, 1
In this formula, tij represents the given response time of a candidate and cij
the cost. The variable pij denotes whether a candidate is selected or not. These
86

5.1. Introduction to the Selection Problem
equations were discussed by Lee [78] and also by Yu and Lin [158]. In addition,these equations are a common representation of the Multiple Choice KnapsackProblem (MCKP), which is a popular optimisation problem. Section 5.3.1 willdiscuss the family of knapsack problems in further detail. Since the problem for-mulation represents a standard integer linear programming problem, Lee proposessolving instances of the problem with the help of available off-the-shelf tools forinteger linear programming [78]. Yu and Lin propose performing the selection inaccordance with the given description based on an algorithm by Pisinger for theMCKP which also builds on this integer programming formulation [158]. Withoutformal proof, the described variant of the selection problem can be transformedinto an MCKP. Thus, the selection problem could be reduced to an MCKP and asolution algorithm for MCKP can be successfully applied to the selection problem.Figure 5.1 outlines this relation.
MCKP Selection Problem(so far)
⊇
Figure 5.1: Relation between the MCKP and the selection problem.
However, when it comes to QoS characteristics like the reliability or the avail-ability, the problem formulation does not result in a linear system of equations. Theaggregation rules given in Section 4.4 define a multiplication of the values and theproblem cannot be solved with linear programming techniques. Thus, Zeng et al.,who also propose solving the selection problem with integer programming meth-ods, transform the non-linear equation, resulting from constraints on availability orreputation for example, into a linear one [159], i.e. that the used variables have anexponent of 1. Applied to a sequential execution of services, an equation coveringthe availability is:
minimise alimit =a∏
i=1
bi∏j=1
apij
ij
Identical to the equations given before, aij denotes the availability of a givenservice and pij denotes whether a candidate is chosen or not. Then, the logarithmfunction is applied in the following manner:
ln(alimit) =a∑
i=1
ln( bi∏
j=1
apij
ij
)
ln(alimit) =a∑
i=1
bi∑j=1
pij ln(aij)
87

5.1. Introduction to the Selection Problem
and 1 =bi∑
j=1
pij ∀i ∈ 1, . . . , a, pij ∈ 0, 1
This is a linear equation again and thus can be considered with a integer program-ming approach. Thus, the transformation as proposed by Zeng et al. makes itpossible to consider QoS characteristics that would normally result in a non-linearequation. Lee [78] and Zeng et al. [159] have also discussed the hardness of theproblem in terms of its required effort to solve. The hardness will be discussedfurther in Section 5.3.5. As for the application to the selection problem, both Lee’sand Zeng et al.’s approaches propose using the IBM Optimization Solutions andLibrary (OSL) which is a software tool for solving integer programming problems.As a conclusion, non-linear optimisation and constraint statements resulting fromQoS characteristics that require a multiplication for their aggregation can also betransformed into linear statements and thus be reduced to the linear formulation ofthe MCKP. Figure 5.2 outlines this relation.
MCKPSelection Problem
(so far)⊇
Int. Lin. Non-Int. Lin.
⊇
Figure 5.2: Relation between the MCKP and the integer linear and non-linear vari-ant of the selection problem.
However, the approach by Lee, Zeng et al., and Yu and Lin is to presume thata composition can be represented by a sequential arrangement of relevant tasks.Nevertheless, a composition can also contain parallel structures. In Section 4.6of the previous chapter, an example has explained that the approach to consider asingle critical service leads to a problem when considering different QoS charac-teristics. To discuss the impact on the problem formulation, Figure 5.3 shows anexample of a possible composition structure.
The composition structure shown in this figure contains two parallel arrange-ments. The first defines that one of the parallel task is executed while the secondarrangement defines that all tasks are executed in parallel. The solution proposedby the mentioned works is to determine the critical path of the execution. Zeng etal. for example, propose considering the response time as the relevant QoS charac-teristic to identify the relevant services that form the critical path. Then, as for theQoS, its aggregation can be performed with one aggregation rule resulting in a lin-ear or non-linear equation. However, the example makes clear that a more preciseformulation is possible. Regarding the first parallel statement, only one servicewill be invoked at a time, but all are considered relevant. Consequently, a simplemultiplication of the value would predict a worse availability that actually deliv-
88

5.1. Introduction to the Selection Problem
XORJOIN
XOR SPLIT
4
2
31 ANDJOIN
AND SPLIT
8
6
75 9
Figure 5.3: Composition structure that contains parallelism.
ered. For this structure, the assignment that results in the average is consideredrelevant.1 Besides statements about response time, cost or other QoS categories,covering the aggregation of the availability of the first parallel structure results in:
ln(alimit1) =13
∑i=2,3,4
bi∑j=1
pij ln(aij)
with 1 =∑
i=2,3,4
bi∑j=1
pij
Then, the remaining availability values could be expressed with a single multi-plication. To provide a more structured form, a detailed expression for the secondparallel structure and the sequential arrangement would be as follows:
ln(alimit2) =∑
i=6,7,8
bi∑j=1
pij ln(aij)
with 1 =bi∑
j=1
pij ∀i ∈ 6, 7, 8, pij ∈ 0, 1
ln(alimit3) =∑
i=1,5,9
bi∑j=1
pij ln(aij)
with 1 =bi∑
j=1
pij ∀i ∈ 1, 5, 9, pij ∈ 0, 1
These equations do not define a global constraint, and therefore the followingequation must be added in order to express a constraint on the availability thatcovers the entire composition:
1As explained in Section 4.3, for the model it is assumed that the services are invoked with equalprobabilities. If necessary, the model could be extended with individual invocation probabilitieswhich would result in a weighted average.
89

5.1. Introduction to the Selection Problem
maximise ln(alimit) = ln(alimit1) + ln(alimit2) + ln(alimit3)
This case demonstrates that a more precise problem formulation, with the goalto express a problem instance as a integer programming problem, depends on thegiven composition structure. If the selection problem is transferred into this for-mulation, then this problem formulation does not conform to the MCKP anymore.Figure 5.4 depicts this relation. In this figure, the selection problem is dividedinto four variants resulting from whether a sequential structure is considered andwhether the problem involves non-linear statements which require a transforma-tion.
Int. Pr. Problem Selection Problem
MCKPSequential
Selection Problem⊇
Int. Lin. Non-Int. Lin.
⊇
⊇⊇
Figure 5.4: Relation between the MCKP and the selection problem involving thenumber of constraints.
The conclusion is that for each problem instance a new set of equations mustbe formed. Thus, the approach of this thesis is to express a problem model whichcaptures the structural differences with their implications of the aggregation ofdifferent QoS categories. Moreover, if multiple criteria are considered for a com-bined goal function, the different criteria would require particular weights in orderto provide significant solutions. The setting of appropriate weight factors becomeseven more important, if non-linear QoS characteristics require a transformationinvolving a logarithmic operation. Then a weight must also compensate the non-linear operation applied to the QoS values. Because of this characteristic, differentheuristics are discussed as an alternative to the approach of using integer linearprogramming. To summarise the discussion above and what has been presented inprevious chapters, the problem model must capture the following characteristics ofa service composition and possible instances of selection problems:
• Multiple Optimisation Criteria. The problem model must allow express-ing multiple optimisation criteria. For example, a retailer can define two ormore QoS characteristics at once that are subject for optimisation.
90

5.2. The Problem Model
• Multiple Constraint Criteria. In a similar manner, multiple constraint cri-teria must be possible, i.e. a retailer can define more than one QoS charac-teristic as a constraint criterion.
• Given Setup of Tasks and Candidates. A preceding matchmaking processwill result in a set of candidates for each task.
• Composition Structure. As the example of this section has shown, theaggregation of the composition depends on the arrangement of the giventasks and services. Thus, a problem model must also express these in orderto correctly aggregate the given QoS values.
The different characteristics indicate that a selection problem can also involvemore than one constraint and more than one optimisation goal. This aspect hasbeen ignored in the previous discussion. Consequently, Figure 5.5 also identifiesthe case of one constraint and one optimisation goal as the special case that offersthe transformability to the MCKP.
Int. Pr. Problem Selection Problem
MCKP
SequentialSelection Problem
⊇
Int. Lin Non-Int. Lin.
⊇⊇⊇
Seq. Selection Problemwith 1 Constraint and 1 Goal
Figure 5.5: Summary of relations between the MCKP and the selection problem.
5.2 The Problem Model
Based on the requirements on the problem model from the previous section, thissection will introduce a model that allows expressing given instances of a selectionproblem. Regarding the setup of the given composition case, this model containsthe following elements:
• Tasks. The model must contain a set of tasks T = t1, t2, . . . , ta where thenumber a represents the total number of tasks in the composition.
91

5.2. The Problem Model
• Candidates. The output of the matchmaking process is a set of (service)candidates S = s1, s2, . . . , sb where the variable b represents the numberof all candidates. It is presumed that a task potentially requires a differenttype of functionality when compared to other tasks. Consequently, availableservices will provide a particular functionality and thus may not be suitableto perform different tasks. If the case occurs that a service can serve twodifferent types of functionality, a candidate identified for one and anothertask is counted twice.
An entire set containing all candidates does not express the described condi-tions. Therefore, the model is extended in the following way: The outcomeof a discovery process results in a set of candidate-sets U, each holding theset of candidates Si for a particular task ti ∈ T.
U = S1, S2, . . . , SaSi = si1, si2, . . . , sibi
i = 1, . . . , a
in this definition, bi denotes the number of candidates found for a particulartask.
• QoS characteristics. For identifying different QoS characteristics, which isnecessary when their values are used in optimisation statements, a numberfrom 1 to q is used, with q denoting the total number of QoS characteristics.
• QoS vector. If different QoS characteristics are considered, different QoSvalues are assigned to the candidate services. Because more than one QoSvalue can be assigned for each candidate, a vector is used to represent a can-didate. This QoS-vector holds the different QoS values denoted by the indexn, n = 1, . . . , q. The index q represents the different QoS characteristicsthat are taken into account. The result is a vector
~sij =
sij1sij2
.
.
.sijq
with index i = 1, . . . , a denoting the corresponding task and index j =1, . . . , bi denoting the number of the according candidate at task i. Thisresembles the indices as used in the previous section. In summary, the set Urepresents a set of sets of vectors.
92

5.2. The Problem Model
5.2.1 The Selection Criteria
The selection of candidates involves the application of selection criteria. QoS char-acteristics can serve as criteria in an optimisation function. If one or more QoScharacteristics are relevant for optimisation, the corresponding value of the QoSvector is subject to an optimisation function. This function depends on the direc-tion of the dimension. For characteristics with a decreasing dimension, meaningthat a lower value denotes a better QoS, such as response time or cost, the functionmust minimise the aggregated value. For categories with an increasing dimension,the function must maximise the value. Considering the aggregation rules that werepresented in the previous chapter, a general formulation of optimisation goals isdefined. The optimisation statement expresses either a minimisation of maximisa-tion of the resulting QoS value, aggregated by function fn, n ∈ 1, . . . , q wheren denotes the considered QoS characteristic:
minimise|maximise(f(Un)) Un = s11np11, . . . , sabnpab
with pij =
1 if selected, and0 otherwise.
By using this notation, it is assumed that a resulting 0 represents a neutralelement with respect to the aggregation function. For aggregation functions thatmultiply the given values, the neutral element would be the value 1. The previoussection has given an example that has used the indices i and j in the same manner.
In addition to the optimisation criteria, one or more QoS categories can berelevant for expressing a constraint on the composition. Depending on the directionof the considered QoS characteristic with index n, the constraint denotes an upperor lower bound for the resulting aggregated value:
cn > |cn <(f(Un)) Un = s11np11, . . . , sabnpab
with pij =
1 if selected, and0 otherwise.
In this definition, the neutral element has the same characteristics as givenabove with respect to the considered aggregation operation and to the use of theindices.
5.2.2 Modelling the Structure
In addition to the modelled sets of tasks and candidates, the discussion has sug-gested that the structure of the given composition is also relevant for the properaggregation of different QoS characteristics. Thus, the problem model must in-volve a model of the composition structure based on the composition patterns asintroduced in the previous chapter. The structural model is based on the modelused for the aggregation as introduced in Section 4.3. It is defined as follows:
93

5.2. The Problem Model
• A composition structure is represented by a set K1.
• The set K1 can contain tasks of the composition t1, . . . , ta or further sub-setsK2, . . . , Kj .
• The aggregation method has explained that the precedence relations betweenthe elements in a sequence are not relevant for the aggregation of the QoSvalues. Since, order of the elements is not required for the aggregation, theenclosed elements of a sequence can be represented by a set Kx. Becauseprecedence relations do not exist between the elements of parallel structures,a set is an adequate representation structure for these elements as well.
Consequently, each set Kx has a special type assigned, namely one of thecomposition patterns CP1, . . . , CP9.
• In general, any set Kx can contain tasks or sub-sets.
For a formulation of a given selection problem, it is required that the composi-tion is expressed by using the model as defined above based on the composition pat-terns. Moreover, since the selection problem focusses on the QoS in a composition,not required information, such as the precedence relation of tasks in a sequence,is not covered by this model. If a composition shows elements that not conformto the definition the above proposed model, the composition must be transformedfirst as discussed in the Section 4.5. The definitions of the composition structuretogether with the considered QoS characteristics also imply the application of theaggregation rules as introduced in the previous chapter.
5.2.3 Problem Model Summary
Incorporating all the previously discussed aspects of the selection problem, thisproblem can be defined by its following elements:
• T represents the set o tasks t1, . . . , ta, with “a” tasks in total.
• U represents the set of candidate sets S1, . . . , Sa, each containing the candi-dates assigned to a particular task. Each candidate is represented by vectorof elements that consists of the considered QoS values.
• WO represents the set of optimisation goal functions, which can containnone, one or more optimisation statements.
• WC represents the set of constraint statements, which can contain none, oneor more optimisation statements.
• A data structure Kx that represents the composition structure containing theelements of the structural configuration as required for processing the QoSof the involved services.
94

5.2. The Problem Model
• A valid solution is a list that contains one candidate for each task whichcan be expressed as a tuple L, L = (~s1, . . . , ~sa). This tuple represents aselection of service candidates for which a) the aggregated QoS complieswith the constraint statements of WC and b) the aggregated QoS representsthe optimal solution defined by goal functions in WO.
A valid solution can be also expressed as the an assignment of the integervariables pij , when the problem is formulated as an integer linear optimisa-tion problem.
This problem formulation does not presume the use of integer linear statementsto express an integer programming problem. Of course, their expression for a givenproblem instance based on this model is possible. Such a formulation can be pro-vided in the same manner as the aggregation rules are given in Section 4.4: foreach pair of QoS characteristic and structural pattern, a statement is derived. How-ever, as the previous section has shown, each given instance of a selection problemresults in a different set of equations for expressing constraints and optimisationstatements. Moreover, the application of transformation involving a logarithmicoperation require the setting of appropriate weight factors.
This model does not capture any dependencies between the given QoS values.Such dependencies can occur if different QoS characteristics form a trade-off cou-ple. A common trade-off couple is response time and cost where a shorter responsetime, i.e. a better quality, usually results in a higher cost. As for the QoS character-istics discussed in the previous chapter, the cost can form a trade-off couple withany of the remaining characteristics. A possible trade-off relation is not consideredrelevant for the discussion of the model. Instead, algorithms that attempt to solvea given selection problem can take advantage of such a dependency on an optionalbasis.
5.2.4 Aggregation of Multiple Optimisation Criteria
Different QoS characteristics can be considered at once for optimisation. Then, anaggregated goal function is required that allows to consider the different optimisa-tion statements WO. When an algorithm tries to solve the problem, this results inthe comparison of different QoS vectors that represent the aggregated QoS of thecomposition resulting from a particular assignment. For this comparison, the Sim-ple Additive Weighting (SAW, [49]) method is proposed, which was introduced inthe context of Multiple Criteria Decision Making (MCDM). The SAW approachnormalises the individual value ranges from different QoS characteristics to valueranges of values between 0 and 1. For applying the SAW, a QoS vector with in-dividual QoS values sijn is considered, where n represents a QoS characteristic.Then, each value sijn is replaced by the normalised value νijn :
95

5.3. Relations to Other Combinatorial Problems
νijn =
max(si1n ,...,sibin
)−sijn
max(si1n ,...,sibin)−min(si1n ,...,sibin
) for decreasing QoS char., and
sijn−min(si1n ,...,sibin)
max(si1n ,...,sibin)−min(si1n ,...,sibin
) for increasing QoS char.,
The internal si1n , . . . , sibinrefers to all values from the considered QoS vectors
referring to the relevant QoS characteristic n. As an example, the following QoSvectors are given: 200
50.99
2506
0.98
1508
0.95
2204
0.955
This could represent the three QoS characteristics response time, cost and avail-
ability. However, the meaning of the values is not relevant for the application of theSAW. Performing the SAW method replaces every value with a normalised one: 0.5
0.751.0
0.00.5
0.75
1.00.00.0
0.31.0
0.125
Based on the normalised values, a score σj can be applied to each candi-
date [49], defined as:
σj =1q
q∑n=1
wnνijn
The variable q represents the amount of considered QoS categories. The weightwn is applied to a particular QoS characteristic by the user’s preference and couldbe omitted. The result of this procedure is a score for each candidate service orQoS vector. The result denotes the better QoS vector when two QoS vectors arecompared. In the example, the resulting scores are in the same order: 0.75, 0.42,0.33, and 0.52. Thus, presuming a neutral weighting, the candidate or aggregatedQoS associated with the first QoS vector is considered as the best overall QoS.
5.3 Relations to Other Combinatorial Problems
If exactly one QoS characteristic is relevant for the optimisation, a selection algo-rithm must choose the candidate that provides the optimal value for each task. Theeffort for this operation is equivalent to a sort operation and therefore this speciali-sation of the selection problem can be regarded trivial. If more than one QoS char-acteristic is relevant for optimisation or for expressing a constraint, the selectioncan be regarded as a combinatorial problem. This problem has similarities withthe knapsack problem, to a specific kind of a project scheduling problem (PSP),the QoS-based routing of packets in the Internet and the QoS-based scheduling ofqueries in the field of database systems. The upcoming subsection will explaintheir differences to the selection problem.
96
5.3. Relations to Other Combinatorial Problems
5.3.1 The Knapsack Problem
At the beginning, this chapter has already mentioned the relation of the selectionproblem with a member of the family of knapsack problems named multiple choiceknapsack problem (MCKP). In the following, this relation will be explained inmore detail. The core knapsack problem is about selecting a subset of availableitems for putting them into a knapsack. This problem is based on the simplerproblem named “subset sum”. The subset sum problem is quickly explained: Con-sidering a set of elements (numbers) s1, s2, . . . , sb ∈ N and a number c ∈ N, thegoal is to find a selection of elements that represents a subset I ⊆ 1, 2, . . . , b thatfulfils: ∑
∀i∈Isi = c
The knapsack problem represents an optimisation variant of the subset sumproblem. In this problem, each element has two dimensions, a weight si1 and avalue si2 . Instead of the sum that must be identified, the knapsack problem hasgot a weight capacity with the goal to select a set of elements while respecting thegiven weight limit c. Considering the weight only, this represents a trivial problem:A solution can be found by sorting all elements by their weight. Then, starting withthe lightest elements, they are added to the selection until the weight is reached.The problem becomes hard if the additional goal is to maximise the value v of theselected elements s12 , s22 , . . . , si2 . Then, the knapsack problem is about:
maximise v =∑i∈S
si2
while keeping c ≥∑i∈S
si1
In other words, the problem is about maximising the value of taken items whilethe weight capability of the knapsack does not allow taking all items. Based on thisproblem statement, the literature distinguishes the fractional knapsack problem andthe 0/1- or binary knapsack problem. The difference between both is that the 0/1-knapsack problem defines that splitting the elements is not allowed. Otherwise, analgorithm could sort all items by their value density si1/si2 and begin to pack theknapsack starting with the highest value density. Then, if the algorithm meets theelement that would exceed the given limit, only a fraction of this element is takenthat still fits into the knapsack.
A further variant of the 0/1-knapsack problem is the Multiple Choice KnapsackProblem (MCKP). In this problem, the items for selection are sorted into a ∈ Nclasses and associated to each class is a set of items Si which has got bi = |Si|number of elements. The goal of the MCKP is to select exactly one item of eachset while keeping the constraints and maximise or minimise the optimisation goals.A model for problem would be as follows:
97

5.3. Relations to Other Combinatorial Problems
maximise vagg =a∑
i=1
bi∑j=1
pijtij
while keeping climit ≥a∑
i=1
bi∑j=1
pijcij
and 1 =bi∑
j=1
pij ∀i ∈ 1, . . . , a, pij ∈ 0, 1
These are the same equations as given at the beginning of this chapter, where it wasalso mentioned that Lee [78] and Yu et al. [158] have already discussed the MCKPin the context of the QoS-based selection of services to form compositions. Theonly difference is that mostly the MCKP considers a value that is about to be max-imised while the selection problem as discussed by Lee and Tao et al. considers atime measure which is considered for minimisation. The difference between eitherminimising or maximising a value is considered as irrelevant when discussing thecombinatorial issue.
To involve multiple constraints, the problem can be modelled as a MultipleDimension Knapsack Problem (MKP), where – literally spoken – the knapsack hasmore than one limiting dimension. Such limiting dimensions could be the volumeand weight of a knapsack and can be denoted by an index 1, . . . , q. This representsalso a specific variant of the 0/1-knapsack problem. Then, the constraint to holdcan be expressed as:
a∑i=1
bi∑j=1
pijsijn ≤ cn ∀n ∈ 1, . . . , q
pij ∈ 0, 1 identifies the selected elements/candidates.
This combination between the MKP and the MCKP is known in the literature asMultiple Choice Multiple Dimension Knapsack Problem (MMKP). In Figure 5.6this relation is outlined. Contrary to previous figures, the distinction between in-teger programming statements and non-linear statements that must be transformeddifferently is not depicted.
The following discussion will explain why the structure of the selection prob-lem cannot be ignored and consequently the application of algorithms for theMCKP does not necessarily solve the selection problem: The example given inFigure 5.3 has shown that the parallel structures require a different model than theMCKP. From the interpretation of the problem formulation as given in the litera-ture (e.g. Dudzinski and Walukiewicz [26], or Pisinger [108]), the MCKP coversonly the scenario of an (unordered) sequence of service executions. A composi-tion consisting of services all arranged into a parallel AND-split with AND-join
98

5.3. Relations to Other Combinatorial Problems
Selection Problem
SequentialSelection Problem
Seq. Selection Problemwith Mult. Constraint and 1 Goal
Int. Pr. Problem
MMKP
MCKP⊇
⊇
⊇
Seq. Selection Problemwith 1 Constraint and 1 Goal
Figure 5.6: Relation between the MCKP, the MMKP and the selection problem.
arrangement is not covered. A solution denoting a selection of services found fora parallel arrangement would be different than for an unordered sequence. More-over, as the example has explained, a given selection problem would result in aset of varying integer programming statements which puts the equivalence of theselection problem to the MCKP into question. This issue allows the assumptionthat the selection problem is at least as hard as the MCKP. However, consideringthe structural arrangements and different QoS characteristics, it requires a differ-ent problem model. Therefore, algorithms for finding or guessing solutions to aMCKP will not result in the same level of performance when applied to the selec-tion problem.
To discuss the difference, a popular solution algorithm to the MCKP will beconsidered: A strategy for solving knapsack problems is known in literature as dy-namic programming. The idea of dynamic programming is that a problem adheresto a basic principle of optimality which has been introduced by the mathematicianBellmann. This principle describes that the optimal solution to a problem can berepresented by the combination of the optimal solutions to its sub-problems. If thedetermined partial solutions overlap and are stored, an algorithm can save effortsfrom the overlapping partial solutions.
The solution approach for applying the dynamic programming algorithm tothe (basic) 0/1-knapsack problem is as follows: For a knapsack with given sizeconstraint c, there is a selection I ⊆ s1, . . . , sm that fulfils the constraint criteria.Then, for each element, si ∈ I holds that a partial problem with a smaller knapsackc′ = c− si1 has the solution I− si. In this case, si1 represents the weight and si2
the value of the element. Based on this idea, an algorithm can determine the valuev for a given set and sub-value as follows [114]:
f(si, c′) =
0 if i = 0
f(si−1, c′) if i > 0, si1 ≥ c′
max
f(si−1, c′), f(si−1, c
′ − si1) + si2
else
99

5.3. Relations to Other Combinatorial Problems
By this definition, an algorithm can be derived. Such an algorithm operates ona numbered set of elements and starts with the elements with index i, showing thefollowing behaviour:
• The first statement covers that no element is available for putting into theknapsack. Then, a value of zero is returned.
• The second statement covers that an element exists but the weight of the cur-rent element is larger than the remaining volume allows. Then, the functionis invoked recursively with the previous element.
• In all other cases, the function chooses the maximum resulting value of eitherconsidering the actual element – and adding the value – or skipping the actualelement. In both cases, the function is invoked with the previous element.
Based on this procedure, the algorithm creates a two dimensional array [0..i, 0..c].For each pair of item and weight (i, c′), the algorithms computes the value accord-ing to this definition. The effort to create the array is just i by c′ resulting in theworst-case effort of O(n2) added to the effort needed to perform the calculation ofv for each table entry. The entry that shows the highest value v represents the solu-tion. Such an approach results in a so-called pseudo-polynomial effort: Countingthe computational steps results in a polynomial effort, while ignoring the effort toprocess the calculation of a table entry. As a consequence, for small values of i andc′, such an algorithm usually shows acceptable performance.
In order to apply the dynamic programming approach to the MCKP, this algo-rithm must be modified to take at least one element of each class. The algorithmmust class-wisely process the selection of candidates. The basic structure of thedefinition remains valid. However, it applies only to the selection of elementsbelonging to a particular class i. Dudzinski and Wolukiewicz have proposed a dy-namic programming algorithm for a MCKP [26]. At first, for a partial MCKP witha partial constraint cpt can be formulated as follows:
maximise vi(cpt) =a∑
i=1
bi∑j=1
pijtij
while keeping cpt ≥a∑
i=1
bi∑j=1
pijcij
and 1 =bi∑
j=1
pij ∀i ∈ 1, . . . , a, pij ∈ 0, 1
v0(cpt) = 0 for cpt ≥ 0
vi(cpt) = −∞ for
cpt ≤ 0 and i > 0, or
cpt < 0 and i = 0
100

5.3. Relations to Other Combinatorial Problems
then
vi(cpt) = max∀j,j=1,...,bi
tj + vi−1(cpt − cj)
By this definition, a partial MCKP is defined in the same way as an entire
MCKP. For performing this algorithm, this definition also provides a statement thatcovers the iteration through the classes: If the algorithm reaches the class with theidentifier “zero” but the constraint cpt is greater or equal zero – the knapsack hassome space left – then the resulting value is set to zero. If the resulting constraintcpt is below zero, then the algorithm has encountered a class where all elementswould violate the constraint. Thus, in this case, the resulting value is set to aninfinite negative value denoting an invalid solution.
An algorithm based on this definition iterates through all elements of a class. Itstarts with the last class. If all elements of this class were tested, it proceeds withthe previous class. The algorithm would calculate an array entry for each element.Since the creation of the array still results in a quadratic effort, this represents apseudo-polynomial algorithm as well.
Applying this algorithm to a given selection problem can result in non-optimalsolutions, because – besides the idea that it does not consider the compositionstructure – it presumes the same type of definition for aggregation of the QoSvalues (addition and subtraction) regardless of the required aggregation method,depending on the structure. Moreover, the structural requirements require the eval-uation of several classes at once (for example, in a parallel arrangement), whichcannot be performed with a recursive approach. A simple example clarifies thisissue, considering a selection problem instance with the following characteristics:
• T = t1, t2, t3
• U =
S1 =~s11 =
(15
), ~s12 =
(22
) ,
S2 =~s21 =
(64
), ~s22 =
(71
) ,
S2 =~s31 =
(25
), ~s32 =
(31
) ,
The upper value of each candidate can be seen as the response time and thelower the cost.
• WO = (min(f(Si2)) ∀ Si ∈ U) which means that the cost, the sec-ond value, is about to be minimised. it must be noted that in the domainof knapsack problems, such an optimisation criterion is named “negativevalue”. Accordingly, the recursive definition requires a function that seeksthe minimum instead of the maximum.
101

5.3. Relations to Other Combinatorial Problems
• WC = (c = 10 ≥ f(Si1)) ∀ Si ∈ U) which represents a constraintstatement about the response time, the first value, not being allowed to ex-ceed the value of 10.
• G represents the graph consisting of pattern elements and tasks. The graphconsists of one parallel pattern element which holds all the three tasks. Thestructure of this graph is depicted in Figure 5.7
ANDJOIN
AND SPLIT
3
1
2
time: 1cost: 5
time: 2cost: 2
time: 6cost: 4
time: 7cost: 1
time: 2cost: 5
time: 3cost: 1
Figure 5.7: Graphical representation of the example selection problem (with can-didates in rectangular boxes).
According to the definition of the algorithm for the MCKP, the algorithm wouldcreate a two-dimensional array which has c-number columns and has
∑an=1 |Sn|
rows. Because the algorithm needs to keep the weight resulting from the selection,each entry consists of a tuple of (cost, time). The algorithm fills out the table start-ing from i = 1 and j = 0 and ends with i = 6 and j = 10 following the previouslygiven definitions. If the algorithm encounters an already computed value vij , thisis adopted from the table. Because the MCKP defines that one task needs to betaken from each group, a solution is found only in the rows that represent the lastgroup involving a selection from the other group. Since the goal is to find the low-est cost while not exceeding the response time of 10 units, the tuple for i = 6 andj = 10 represents the optimal result. The combination resulting from this selectionis (s11, s21, s31).
With this result, it is clear that such an algorithm does not find the optimalsolution, because it ignores the parallel structure in which the tasks are arranged.The optimal selection for this example would be the candidates (s12, s22, s32) witha cost of 6 units and a response time of 7 units. In the example, the maximumvalue is relevant for the response time in a parallel arrangement. Of course, thedefinition of the recursive max. . . could be modified to cover the parallel case.Consequently, sequential arrangements would not be possible. To solve this issue,the definition could be conditionally adapted depending on whether a parallel struc-ture or a sequential structure needs to be processed. However, this would not cover
102

5.3. Relations to Other Combinatorial Problems
i\j 0 1 2 3 4 5 6 7 8 9 10
1 −∞ (5,1) (5,1) (5,1) (5,1) (5,1) (5,1) (5,1) (5,1) (5,1) (5,1)2 −∞ (5,1) (5,1) (2,2) (2,2) (2,2) (2,2) (2,2) (2,2) (2,2) (2,2)
3 −∞ −∞ −∞ −∞ −∞ −∞ −∞ (9,7) (6,8) (3,9) (3,9)4 −∞ −∞ −∞ −∞ −∞ −∞ −∞ (9,7) (6,8) (6,8) (6,8)
5 −∞ −∞ −∞ −∞ −∞ −∞ −∞ −∞ −∞ (14,9) (13,10)6 −∞ −∞ −∞ −∞ −∞ −∞ −∞ −∞ −∞ −∞ (10,10)
Table 5.1: Array values resulting from dynamic programming approach.
the case that parallel and sequential structures would occur in the same probleminstance.
The conclusion is that an algorithm known to find an optimal solution to anyMCKP, if a solution exists, does not guarantee finding an optimal solution to agiven selection problem. Thus, the MCKP is different from the selection problem.It can be assumed that the principle of optimality does not apply to the selectionproblem as it is modelled in this work. The structural characteristic of the selectionproblem requires considering a selection of tasks at once for a decision. Thus, split-ting the problem into sub-problems by classes or tasks does not cover the structuralcharacteristic of the given composition case.
5.3.2 The Project Scheduling Problem
If multiple QoS characteristics are subject to the optimisation or if they are con-sidered to form a constraint, the selection problem is similar to a Resource Con-strained Project Scheduling Problem (RCPSP). A project scheduling problem oc-curs when resources (usually humans) must be distributed to jobs of a project. Themost common optimisation goal of the basic RCPSP is to reduce the duration ofthe project while spending as few resources as possible. Two types of RCPSPs aredistinguished: One is named Single Mode RCPSP and the other is known as Multi-Mode RCPSP (MRCPSP). The single mode RCPSP only deals with fixed valuesfor the duration and the cost of a task. In an MM-RCPSP, a job can be done byusing different modes which vary in cost and duration. Therefore, an MM-RCPSPis primarily considered as relevant in comparison to the selection problem. In ad-dition to its mode, an RCPSP can be classified by a couple of other characteristics.Based on an overview about RCPSPs by Yang et al. a selection problem seen asRCPSP has the following characteristics [153]:
• Objective. Objectives are distinguished by being regular or irregular. Reg-ular objectives do not interfere with the goal to minimise the duration of theproject, while irregular objectives allow following another objective – forexample to equalise the consumed resources among involved parties [153].
103

5.3. Relations to Other Combinatorial Problems
Applied to the selection problem, the RCPSP has a non-regular objective be-cause depending on the considered QoS categories and the applied weight; aworse duration can be considered better if, for example, the cost is reducedaccordingly. The objective can be defined as an optimisation function, asgiven in Section 5.2.1.
• Precedence Relation. Two types of precedence relations are discussed inthe literature. Either a task can be started with a specified time window aftera preceding task has finished or a succeeding task can start any time afterthe preceding task has finished. Regarding a composition of services, thecommon case is that a task is started immediately after the preceding taskfinished.
The constraint for the precedence in service compositions can be defined asfollows: αibi+1 is the start time of a candidates sibi+1 ∈ Si of task i, i =1, . . . , n, and ωibi
the finish time of a candidate sibi∈ Si−1 for the preceding
task i− 1. Then, the precedence constraint is:
αibi+1qibi+1 ≥ ωibiqibi
with qibi+1, qibi
1 if selected0 otherwise
Between two tasks, a time delay might occur, because an execution environ-ment cannot execute a task at exactly the same moment when another taskhas finished. However, this technical issue is ignored in this discussion.
• Preemption. If preemption is allowed, the execution of a task can be sus-pended in order to execute another task in the meantime. This is useful ifsome resources are only available within a specific period and other taskscan be suspended then. Since the invocation of services in the context ofa composition usually is an atomic operation, preemption is not consideredpossible.
• Resource requirements per period. In the domain of project scheduling,using resources at different times can result in different costs. For example,performing a task at night results in higher payments for night shifts. Forcomputer systems, a similar idea can be applied: The execution of a servicegets more expensive at peak hours. However, since currently no such exam-ple exists in the domain of electronic services, this aspect is ignored in thefurther discussion.
• Trade-offs. In the context of RCPSPs, the trade-off is characterised by twocriteria, where an optimisation of the one means a change to the worse forthe other. An algorithm must find a counterbalanced solution. A usual trade-off pair is formed by time and cost, whereas the cost and the time should bekept both as low as possible. Possible trade-off couples can be formed forthe selection problem of cost vs. one of the other mentioned categories, in
104

5.3. Relations to Other Combinatorial Problems
the sense that a higher quality results in a higher cost. However, a trade-offcouple could be also time vs. availability, for example for a provider, whereservices usually execute very quickly but may fail.
These points show that the selection problem can be transformed into an RCPSPthat resembles the precedence relations by the execution graph and does not allowpreemption. The relation between the two problems is outlined in Figure 5.8: With-out giving a formal proof, the given description explains that the selection problemcan be reduced to an RCPSP. A large number of heuristics are already availablefor RCPSPs [153]. Not every approach can be applied to the selection problem:RCPSPs and service compositions cover the execution order of tasks differently.In compositions, the order is in most cases pre-defined by a flow description, whilethe tasks of a project are subject to precedence relations, which may allow to pusha particular task for- or backwards in order to optimise the utilisation of resources.
Selection Problem
PSPRCPSP
SMPSP
⊇RCPSP without Preemption
Figure 5.8: Relation between the RCPSP and the selection problem.
5.3.3 Query Planning based on Quality-of-Service
The work of Naumann and Leser discusses the optimisation of queries to a federa-tion of data sources by using the QoS as criteria [95]. The authors have introducedan approach to optimise the QoS of a set of queries by two steps: First, data sourcesare sorted out which would result in a bad QoS in any case. Then, different com-binations of querying data sources, which provide the same required information,are compared in terms of their resulting QoS.
The basic setup is as follows: A mediator serves as a front-end to users. Themediator represents a similar role as the retailer for the selection of services; amediator wraps different data sources for the end-user. These data sources caneither provide similar or different data and are all described with QoS characteris-tics. Accordingly, a query by the user (user query, UQ) submitted to the mediatoris translated into queries to the wrapped data sources (wrapper queries, WQ). Thegeneral approach is to define such translations between UQs and WQs with QueryCorrespondence Assertions (QCA). Because the available data sources can provide
105

5.3. Relations to Other Combinatorial Problems
overlapping or similar data sets, a user query can result in different possible QCAsand combinations of them. Then, each set of QCAs, which completely answersthe UQ, can be ranked based on the aggregated QoS provided by the involved datasources.
The result of their approach is the identification of query plans that provide theoptimal QoS. Naumann and Leser present a set of QoS characteristics which aretailored to the application of database systems. This set includes characteristicswhich have been also discussed in Chapter 3 (e.g. response time, availability orcost). Other characteristics hardly fit into the domain of services, which are “ease-of-understanding” or “completeness”. The completeness denotes the level of howwell a data source meets the information required for a possible UQ. Nevertheless,for a discussion of the combinatorial problem, the interpretation of the numericalvalues does not have any impact on the hardness of the problem.
The combinatorial issue with this approach is the evaluation of possible queryplans, meaning that valid sets of QCAs must be determined. Naumann and Leserexplain that the theoretical effort to determine all resulting possible WQs is NP -complete [95]. The number of possible queries to evaluate is reduced by groupingWQ to the building blocks which refers to the concept of QCAs. Still, the numberof possible QCA-sets answering a UQ rises exponentially with a rising numbers ofQCAs.
To cope with this problem, the authors propose a three-staged approach. In thefirst stage, an algorithm sorts out data sources that offer a generally bad quality.In the second stage, Leser has discussed an algorithm that efficiently identifiesonly those QCA-sets that would also answer the UQ [79]. In the third stage, acomparison algorithm determines the QoS of all remaining queries and applies aranking that allows the identification of the optimal QCA-set.
Comparing this approach with the selection problem reveals that the basic prin-ciple of the both is the same: First, a query or execution plan is determined andthen the QoS for this plan is aggregated. At third, the resulting QoS is put intoa ranking to identify which execution plan results in the optimal QoS. For both,the combinatorial problem lies in the generation of valid query or execution plans.However, the query optimisation is different in two points and these make clearthat the selection problem requires a different approach:
• Overlapping Data Sources. The algorithm that determines valid sets ofQCAs considers the case, for example, that a data source can deliver thesame information as two other data sources. This results in two differentQCAs and thus the algorithm evaluates one data source against two com-posed others. The selection problem as discussed here does not consider thiscase, because it is presumed that the decision about this would have beentaken in the matchmaking process of the composition (cf. Section 7.2).
• Parallel Queries. The mediator is allowed to execute different queries to thedata sources resulting from a QCA set entirely in parallel. As for the MCKP
106

5.3. Relations to Other Combinatorial Problems
which essentially handles all services executed sequentially, this would meanthat all services are executed in parallel. Considering that this problem couldbe expressed as a integer programming problem, if the relevant QoS charac-teristics allow, then, the problem expression would cover only one structuralcase, namely the parallel arrangement. In other words, the problem modelgiven for the QoS-based query planning by Leser and Naumann does notcapture any specific structural arrangements as they occur in service compo-sitions.
If an instance of a selection problem arranges all tasks in an AND-AND par-allel pattern, then this instance can be transformed into the problem of finding theoptimal query set. In accordance with this special case, Figure 5.9 shows the re-duction relation between the two problems. However, it must be noted that theQoS-based query planning involves also the identification of feasible query sets inadvance. Thus, the selection can be reduced only to a part of the problem which isdescribed by Naumann and Leser.
Selection Problem
Selection Problemwith 1 Parallel Structure
QoS-based Evaluation of Queries ⊇
Figure 5.9: Relation between the QoS-based evaluation of queries and the selectionproblem.
5.3.4 Routing in the Internet based on Quality-of-Service
Routing in the Internet today has the goal to identify feasible paths for sendingpackets among different networks from one location to another. The routing isperformed by routers that implement a routing algorithm. The routing in the Inter-net follows in most cases a best-effort strategy, meaning that every router tries todeliver the best service possible according to a single metric. As metrics, routingalgorithms can consider the cost for transferring the data or the number of routersto pass, which is considered as the number of hops. The resulting algorithmic is-sue is to identify the shortest path in a graph where nodes represent routers andthe edges represent their connection, weighted according to the considered metric.This routing scheme has proven its reliability in the past. However, it does notaddress the demands of QoS-dependent services, such as telephone applications orvideo broadcasts over the Internet. Such applications require a routing mechanismthat is capable of ensuring a particular QoS level. For example, broadcasting videodata requires a constant amount of bandwidth on all connections between involved
107

5.3. Relations to Other Combinatorial Problems
routers in order to transmit a continuous amount of data. Otherwise, the user willexperience interruptions when watching the video and will likely reject the service.
The Internet Engineering Task Force (IETF) has published a document that dis-cusses a general framework for the QoS-based routing (cf. RFC number 2386 [20]).This documents defines the following primary goals: a) enhancing the standardrouting process by providing mechanisms to ensure the given requirements withrespect to different QoS characteristics, b) utilising the given resources more ef-ficiently, and c) recognising QoS violations and establishing compensation activi-ties. The QoS-based routing plays a complementary role to (signalling) protocolsthat offer resource reservation in order to express demands for a particular QoSlevel. While resource reservation covers static agreements between sender andreceiver, QoS-based routing dynamically determines feasible paths in order to pro-vide the requested QoS.
Therefore, the combinatorial issue of QoS-based routing is to identify a feasiblepath in a graph with involving multiple QoS constraints. In this field, the literaturedistinguishes between additive QoS, where the individual values are added, andmultiplicative QoS, where the aggregation of values is performed by a multipli-cation [139]. A QoS characteristic that is neither additive nor multiplicative butrequires identifying the lowest value is named concave, e.g. as for the bandwidth.Wang and Crowcroft present a proof that finding feasible paths is NP -completewhen either two additive or two multiplicative constraints are considered [137].In addition, they proof that a combination of one additive and multiplicative con-straint is NP -complete as well. If the application of the logarithmic function tomultiplicative constraint statements is considered as discussed at the beginningof this chapter, such constraints become also additive, which was pointed out byYang [139].
In addition, Wang and Crowcroft discuss the routing problem with one addi-tive constraint in conjunction with the concave bandwidth [137]. For this con-stellation, the authors propose an algorithm with quadratic worst-case effort thatfinds the optimal solution. As Yang also has pointed out, an algorithm can covernon-additive characteristics as the bandwidth by first sorting out unfeasible pathsin a pre-processing step. Then, the algorithm must optimise for only one QoSconstraint for which well-known finding-shortest-path algorithms can be applied.Thus, the problem issue with QoS-based routing in IP network is similar to theQoS-based selection of services: A combinatorial problem arises if multiple QoScharacteristics must be considered at once. However, the problem of multi-criteriaQoS-based routing shows different aspects when considering the following points:
• Sequences Only. One obvious difference lies in the considered structure forIP networks. Contrary to a composition, at the beginning the relation be-tween the nodes does not require a direction and thus no precedence relationamong the involved nodes is given. The algorithm has the goal to identifyprecedence statements between the nodes that resemble a routing path. Theprecedence relations of the selection problem are defined by a graph. Con-
108

5.3. Relations to Other Combinatorial Problems
sequently, the graph is a part of the problem formulation and not part of thesolution as with the QoS-based routing.
Moreover, if such a routing path is found, each involved node has exactlyone incoming path and one outgoing path, meaning that a solution is notallowed to show any parallel forking and joining elements. In other words,the considered structure for the routing does not cover the structure of servicecompositions.
• Different Number of Hops. Like the MCKP, the QoS-based selection re-quires that the number of selected services stays constant because of the pre-defined number of tasks. The number of selected routers can vary dependingon the given QoS. An algorithm that attempts to solve a given MCKP orQoS-based selection can presume from the beginning that, from certain setsof services, at least one must be selected; an algorithm that identifies optimalpaths among the router candidates cannot make such presumptions.
As stated for the QoS-based query planning, the problem of the QoS-basedrouting does not match the selection problem regarding the problem model andsolution strategies.
5.3.5 Computational Complexity
Considering the model introduced in Section 5.2.3, the possible combinations re-sult from the Cartesian product of the candidate sets in U:
S1 × . . .× Sa
This product results in a set of a-tuples where the number of elements repre-sents the number of possible combinations:
|S1 × . . .× Sa| = |S1| · . . . · |Sa| =a∏
i=1
|Si|
This indicates the resulting exponential effort for a rising number of tasks if analgorithm potentially evaluates all possible combinations. Thus, the computationalcomplexity of the naive algorithm can be formulated using the big-O notation asO(mn) where n represents the number of tasks and m denotes the maximal numberof candidates for a task.
The exponentially rising number of combinations poses the question whetheran algorithm is required to evaluate all combinations to find the optimal solution.The resulting consequence would be that the selection problem requires an algo-rithm that always shows an exponentially rising effort. For business processesof 25 tasks with five candidates each, the resulting number of combinations is525 ∼ 9 · 1013. Processes of 25 tasks seem to be exceptionally large. However, ifthe structure must be transformed before, using the node duplication technique asdiscussed in Section 4.5 of the previous chapter, such sizes are likely to occur.
109

5.3. Relations to Other Combinatorial Problems
NP-Hardness of the Selection Problem
For this discussion, the concept of a polynomial reduction between encoding alpha-bets associated with a problem is used (cf. Garey and Johnson [37, section 2.5]).Let two languages LA and LB represent the encoding schemes of the two prob-lems A and B. If language LA can be transformed into LB then each instance of aproblem A can also be expressed as a problem instance of B. The conclusion froma possible reduction is then that problems of LB are at least as hard as problemsof LA. The concept of the polynomial reduction requires that a transformationbetween the two languages can be achieved by an additional machine which alsoperforms within a polynomial bounded amount of time. Problems with a poly-nomial upper bound show the characteristic that combining them in sequence willresult in a new problem with a polynomial upper bound as well. Thus, if a languageLA associated with a polynomial problem A can be transformed with polynomialeffort into LB , B is a problem requiring at least polynomial worst case effort.
This relation applies also to problems that can be solved by a non-deterministictouring machine in a polynomial bounded amount of time, so-called NP -problems.Because of this argumentation it can be determined if a problem is NP -hard, mean-ing at least as hard as another NP -problem. A language LB is named NP -hard,if
LA ≤p LB for LA ∈ NP
where the relation ≤p denotes that LA transforms polynomial to LB and NPdenotes the class of NP -hard problems.
The polynomial transformability between the knapsack problem and an MCKPhas been discussed by Pisinger [108, pages 107-108]. Any knapsack problem rep-resents a special case of an MCKP: Every knapsack problem instance can be trans-formed into an MCKP instance by setting the number of elements within one classto bi = 1. This can be easily understood by considering the formulation given forthe MCKP in the previous Section 5.3.1. If bi = 1 then the inner sum becomesobsolete and the selection variable will be pij = 1 in all cases. As a result, theMCKP-compliant formulation of the instance is equal to the formulation of theknapsack problem. And regarding the knapsack problem, a proof exists that it isa NP -hard problem (cf. Garey and Johnson [37, section A6]). A transformationfrom an MCKP problem formulation to the formulation of the selection problemcan be given in the following way 5.2:
• The set of classes is modelled as T = t1, . . . , ta where a denotes thenumber of items.
• Each Si representing the elements of a class in the MCKP sense is put intothe set U.
• The value of each item vij is set to one element of the referring candidate
110

5.3. Relations to Other Combinatorial Problems
vector ~sij , and the weight cij is analogously set to the other element:
~sij =(
vij
cij
)
• The set WO of optimisation functions contains for the MCKP case just onestatement (|WO| = 1):
WO =
f(U1) =a∑
i=1
∑~sij∈Si
pij~sij1
• The set WC of constraint functions also contains for the MCKP case just onestatement (|WC | = 1):
WC =
c2 ≥a∑
i=1
∑~sij∈Si
pij~sij2
• The structure Kx that arranges all task nodes arbitrarily in a sequence.
• The solution is a selection which conforms to the optimisation function givenby WO and the constraint given by WC , which is the same integer program-ming formulation as for the MCKP (cf. Section 5.3.1).
It is obvious that this transformation can be performed with polynomial boundedeffort. Then, any instance of an MCKP can be transformed into an instance thatconforms to the presented model of the selection problem. Contrary to the Fig-ure 5.1 presented at the beginning of this chapter, the selection problem outlinedin this figure denotes all variants that were discussed so far. The conclusion of thereducibility of the MCKP to the selection problem is that the selection problem isNP -hard. The resulting direction of the reduction is depicted in Figure 5.10. Dueto this discussion, it becomes clear that the given model of the selection problemgeneralises the MCKP with regard to two aspects: First, it covers not only se-quences but also parallel, conditional or combined structures. In addition, it coversmultiple optimisation or constraint criteria.
MCKP SelectionProblem
⊆
Figure 5.10: Reduction of the MCKP to the selection problem.
111

5.4. Heuristic Algorithms
5.4 Heuristic Algorithms
In the selection process, an available candidate is assigned to each task. The sim-plest approach represents an algorithm with a greedy behaviour which evaluatesthe assignment from a local perspective: Such an algorithm determines each as-signment for each task individually and thus ignores possible assignments of othertasks in combination. However, the previous discussion has pointed out that suchan approach would not result in the optimal solution. The question is how muchworse such an approach would be when compared to an algorithm that always findsthe optimal solution.
Building onto the analogies between the combinatorial problems and the se-lection problem as explained in the previous section, the approach of this work isto discuss and evaluate the application of heuristics. In the following subsections,different approaches are explained and compared. A representation in pseudo-codenotation of the discussed algorithms is given. The presentation of the algorithmsin pseudo-code provides a more transparent discussion about the resulting compu-tational complexity. The used pseudo-code notation requires some remarks:
• The inputs and outputs of the algorithms are given only in a schematic way:For each algorithm, the relevant data from a selection problem formulationaccording to the model is given. An implementation would require particularinput and output parameters of potential operations, which are omitted if theydo not improve understanding of the algorithm.
• The variable a represents the number of tasks; the counters i, j have the samemeaning as used in the preceding discussion.
• The initialisation of variables as required in most programming languages isomitted for the same reason as with the input and output parameters.
• Variables are not typed. Thus, integer or floating point numbers and otherdata types share a common notation.
5.4.1 Greedy-based Selection
For a greedy selection, a value vij computed by function fsaw(~sij) represents theselection criteria. This function can implement the SAW method to assign a scorefor each candidate sij ∈ S. The QoS characteristics relevant for the SAW cal-culation are denoted by the optimisation statements denoted by fn ∈ WO. Thealgorithm starts with calculating the value for each candidate. Then it assigns thecandidate with the highest value for each task. Thus, the graph G is not considered.The algorithm is described in listing 1.
The effort for this algorithm is O(n) + O(n log n) + O(n) = O(n log n). Thealgorithm shows two for-loops which would indicate a quadratic effort, but infact, the algorithm just iterates through all candidates. Assuming that b denotes the
112

5.4. Heuristic Algorithms
Data: T, U, WO, WC
Result: array of candidates l[ ], |l[ ]| = abegin
foreach Si ∈ U do1
foreach ~sij ∈ Si do2
v[i][j]← fsaw(~sij , Si)3
endendl[i]← ~sij , ~sij | fv(sij) == max(v[i][1], . . . , v[i][j])4
end
Algorithm 1: Greedy heuristic applied to the selection problem.
number of candidates, the effort is linear depending on the input size. The effort forthe sort operation is added and the effort for assigning the candidates is consideredlinear. The sort results in the significant effort of O(n log n). For this greedy im-plementation, the use of a sort algorithm with the worst-case effort of O(n log n)is assumed. Such algorithms usually require extra memory to achieve this logarith-mic class of effort, otherwise the worst case effort of common sorting algorithms isO(n2). The best case effort is Ω(n log n) as well, because the algorithm performsthe sort in any case.
The clear downside of this approach is that it is not possible to consider aglobal constraint while optimising the overall QoS. As an alternative, a greedy-based algorithm can also support one constraint criteria without optimising for theQoS. The algorithm starts sorting the candidates not by the score but by the relevantconstraint criteria denoted by a function in cn ∈ W. Then, the algorithm assigns,for each task, the candidate that offers the best value of the constraint criteria.If a solution exists that complies with the constraint, it is found with this step.Clearly, this approach does not optimise the overall QoS of the compositions. Inthe remainder of this work, the two resulting QoS optimising algorithms will benamed “Greedy” and the single-constraint aware algorithm “Constraint”.
5.4.2 Discarding Subsets
This algorithm represents a backtracking-based approach. It uses a search treewhich consists of nodes, each representing a possible pair of a candidate and atask. Each level of the tree holds pairs of a particular task only, resulting in a treehaving the same number of levels as tasks. Each path, starting from the root andending at a leaf, represents a possible assignment of candidates. The advantage ofthis algorithm, in comparison to a straight global selection, lies in the idea to cutsub-trees representing unfavourable combinations to save computational efforts.
Such an approach normally identifies the optimal solution and therefore cannot
113

5.4. Heuristic Algorithms
be regarded as a heuristic. When applied to the selection problem, as described thiswork, this approach results in a heuristic, because the cutting rule must be basedon an estimation. The reason is explained as follows: Considering the time, thecutting rule is clear. If a complete combination has already been determined thatshows a lower (better) time as the partial combination processed at some moment,the algorithm cuts the corresponding sub-tree. Each additional candidate wouldworsen the time in any case.
Contrary to that, for categories where the aggregation calculates the arithmeticmean, a rule cannot determine whether the QoS gets worse or better. The reputationand the availability represent examples for such a QoS characteristic. Applied tothe selection problem, the discarding subsets algorithm considers two cutting rules:
1. A partially evaluated combination already violates a constraint. Thus, thealgorithm cuts the sub-tree.
2. The algorithm compares the aggregated QoS of the partial combination withthe aggregated QoS of already processed complete combinations. However,for this comparison the QoS categories involving a mean-based aggregationare ignored. This strategy does not find the optimal result necessarily, be-cause the cutting rule represents an estimation.
The algorithm operates on a tree structure, which results from the structure Kx
that can contain tasks and further substructures. It performs the following steps asgiven in the listing 2. The listing includes functions which represent the followingfunctionality: fcon tests a proposed solution to determine whether the requiredconstraints hold or not, fagg aggregates the QoS resulting from a proposed solution,and fsaw performs a SAW-based comparison (cf. Section 5.2.4) with a numberas an output: If the number is greater than zero, the right argument represents abetter QoS, otherwise vice versa. It must be noted that the comparison could bebased either on one aggregated QoS characteristic or on many; either way this doesnot require a modification to the algorithm. The same applies to the check if aconstraint is violated or not: This check can involve either one or more constraints.
The worst-case effort of this approach is the same as for the brute-force strategyto evaluate all possible combinations, thus O(mn). The best-case effort occurs ifthe first combination found represents the optimal combination and all other sub-trees are cut. Then, the algorithm walks through all levels of the tree and evaluatesat least all tasks of the current level of the tree. The resulting effort for this wouldbe n resulting in the effort class of Ω(n2): On each task level, the algorithm wouldevaluate combinations resulting from applying other candidates. The number oftask-candidate-pairs could be represented by a 2-dimensional matrix.
114

5.4. Heuristic Algorithms
Data: T, U, WO, WC , Kx
Result: array of candidates l[ ], |l[ ]| = ainitialisation: pos← 0discarding( Kx, test[ ], pos)begin
if | test[ ] | == a then1
if | l[ ] | == 0 then2
if fcon( test[ ] ) then3
l[ ]← test[ ]4
endelse
y ← fagg( l[ ] )5
x← fagg( test[ ] )6
z ← fsaw( y, x )7
if z > 0 then8
l[ ]← test[ ]9
endreturn10
endendforeach element ∈ Kx do11
if element == ti, ti ∈ T then12
foreach sij ∈ Si do13
test[ ]← test[ ] + sij14
y ← fagg( l[ ] )15
x← fagg( test[ ] )16
z ← fsaw( y, x )17
if z > 0 then18
if fcon( test[ ] ) then19
discarding( Kx, test[ ], pos + 1 )20
elsereturn21
endend
endelse
discarding( Kx, test[ ], pos + 1)22
endend
end
Algorithm 2: Discarding heuristic applied to the selection problem.
115

5.4. Heuristic Algorithms
5.4.3 Bottom-Up Approximation
Looking at the similarity of the selection problem to RCPSPs, it turned out thatseveral approaches for solving RCPSPs work on a precedence model which doesnot allow the application to the selection problem. The resulting problem is that asolution space is created which allows the rearrangement of tasks. The resultingbounding rules cannot be applied efficiently to the selection problem.
In previous research work, the application of an heuristic algorithm for solvinga RCPSPs, which was introduced by Yang et al. [153], was discussed (cf. Jaegeret al. [61]. The approach presumes that constraint and optimisation criteria form atrade-off couple, i.e. the quicker a task is performed the more it will cost. More-over, it supports only one constraint criteria. It will first sort the candidates bythe constraint criteria. Then it will improve the QoS of individual tasks by replac-ing the original candidate with the candidate that offers the next worse constraintvalue. Considering the trade-off relation, the idea is that the QoS is improved byworsening the constraint value until it reaches the limit.
The algorithm is given in the listing 3. At first, it sorts the candidates by the(one) constraint QoS characteristic. In other words, it performs a constraint-basedselection. Then, it assigns, for each task, the candidate with the next worse con-straint. A proposed solution is kept, if the constraint still is not violated (cf. line10). Figure 5.11 outlines how this algorithm proceeds, based on the tasks andcandidates of the example given in Section 5.3.1.
3
1
2
time: 1cost: 5
time: 2cost: 2
time: 6cost: 4
time: 7cost: 1
time: 2cost: 5
time: 3cost: 1
1
2
34
5
6
tasks candidatesconstraint-best
candidatesconstraint-2nd-best
Figure 5.11: Example processing order of bottomup heuristic.
The algorithm tries to improve the QoS until it has gone through all tasks anddid not find any improvement, when the counter z has reached the number of tasks(cf. line 13). Then, the algorithm stops the approximation to the optimum. Thus,it does not necessarily find the optimal solution: It might have approached a lo-cal maximum in this case. Theoretically, the algorithm has a worst case effort ofO(m · n), resulting in the effort class O(n2). In this case, it might evaluate allcombinations denoted by the two-dimensional matrix. The best case effort is at
116

5.4. Heuristic Algorithms
Data: T, U, WO, WC
Result: array of candidates l[ ], |l[ ]| = abegin
m← 01
foreach Si ∈ U do2
candi[ ]← fsort(y, Si)3
l[i]← candi[m]4
endrepeat
m← m + 15
for i = 0 to a dotest[ i ]← candi[ m ]6
y ← fagg( l[ ] )7
x← fagg( test[ ] )8
x← fsaw( y, x )9
if x > 0 ∧ fc( test[ ] ) then10
l[ ]← test[ ]11
z ← 012
elsez ← z + 113
endend
until z == a
end
Algorithm 3: Bottomup heuristic applied to the selection problem.
Ω(n log n), because it at least performs a constraint-selection, which is basically agreedy algorithm.
5.4.4 Pattern-wise Selection
To address the particular problem occurring in parallel arrangements as explainedat the beginning of this chapter, a selection algorithm is proposed that takes ad-vantage of the fact that the composition can be modelled by using the compositionpatterns. As explained before, the parallel cases in a composition are one aspectof the selection problem. Thus, the proposed heuristic algorithm evaluates possi-ble combinations for each identified parallel pattern. This algorithm has alreadybeen introduced in previous work about the use of QoS when composing services(cf. Grønmo and Jaeger [39]).
A pseudo-code implementation of the algorithm is given in the listing 4. Thisalgorithm acts from a pattern-perspective. It walks recursively into the structure
117

5.4. Heuristic Algorithms
and identifies pattern elements that do not contain any sub-patterns (cf. line 5).For all tasks within this element, all sets of candidate assignments are evaluated.If the optimal solution for a particular pattern is determined (cf. line 8), the algo-rithm walks one level upwards to evaluate the assignment within the super-pattern.The aggregated QoS of contained sub-patterns is taken as a fixed value (cf. lines5 to 7). The pattern-wise optimisation and aggregation are performed until theentire composition is covered and one aggregated QoS is returned. For determin-ing the optimal solution, the listing mentions the function doGlobalSearch whichperforms a naive evaluation of all possible combinations.
Data: T, U, WO, WC , Kx
Result: array of candidates l[ ], |l[ ]| = apattern( Kx, WO, WC )begin
m = |E|1
foreach Ky ∈ Kx do2
if fsym(e) == ti, ti ∈ T then3
U′ ← Si4
elsexk ← pattern( Ky, WO, WC )5
S′k ← xk6
U′ ← S′k7
endendl[ ]← doGlobalSearch(T, U′, WO, WC)8
end
Algorithm 4: Pattern heuristic applied to the selection problem.
Since this algorithm operates on each pattern element, this approach cannotguarantee to meet global constraints. Furthermore, the fact that the algorithm takespreviously aggregated sub-patterns as fixed values also decreases the potential foroptimisation for these cases. Thus, this algorithm can only be regarded as heuristic.The main motivation for the algorithm lies in the assumption that the number oftasks within a pattern element will grow more slowly with an increasing total num-ber of tasks. It is assumed that larger compositions will rather likely contain morepattern elements. Therefore, the algorithm might scale better than a brute-forceapproach, which will be analysed in an evaluation presented in the next chapter.
However, the resulting worst-case effort for this algorithm is O(mn) as well.The example given in Figure 5.3 of Section 5.1 shows a composition of nine tasks:Assuming that for each task 5 candidates have been found, the number of com-binations that the algorithm will evaluate is 53 + 53 + 53 = 375 vs. all possiblecombinations which is 59 = 1, 953, 125. The effort is basically reduced to the
118

5.4. Heuristic Algorithms
sub-element containing the highest number of tasks: O(mnsub−max), which hasnot effect on the worst case effort.
The best case for this algorithm occurs, if each pattern element consists of a sin-gle task. The pattern-wise selection would perform a comparison of the candidatesby their overall QoS and assign the resulting best candidate. Then, the theoreti-cally lowest effort possible is equivalent to a sort operation which is consideredO(n log n).
5.4.5 Comparison of the Algorithms
Table 5.2 lists the basic attributes of the proposed heuristic algorithms from theprevious section. These basic attributes are: whether it supports one or many globalconstraints, the best and worst case computational complexity and if it always findsthe optimal solution.
Algorithm Supports Effort Effort GuarateesName Constraint Best case Worst case Optimum
Greedy Selection No Ω(n log n) O(n log n) noConstraint Selection Yes, 1 Ω(n log n) O(n log n) noDiscarding Subsets Yes, ≥ 1 Ω(n2) O(mn) noBottom-Up Approx. Yes, ≥ 1 Ω(n log n) O(m · n) noPattern-wise Selection No Ω(n log n) O(mn) no
Table 5.2: Summary of introduced heuristic algorithms.
119

5.4. Heuristic Algorithms
120
Chapter 6
Evaluation
The model of the selection problem and the algorithms as given in the previouschapters provide the basis for an implementation that simulates the QoS-based se-lection by the heuristic algorithms. Based on the simulation software and its setup,different simulation campaigns are introduced. These campaigns are designed toevaluate particular aspects of the simulated QoS-based selection. The campaignswill give the opportunity to explore the strengths and weaknesses of the consideredheuristics under special conditions.
To determine the simulation parameters, related research work and publica-tions in the field of service compositions are considered sources for common valueranges of the involved QoS characteristics, as well as sources for the setup of thesimulated example compositions. Based on a summary of the related work, thischapter will explain how the basic parameters for the simulation are set. At theend, the results from the simulation campaigns will be presented and discussed.
6.1 Simulation Model
The basic idea of the simulation is to generate problem instances of the previouslypresented problem and then let the implementation of the heuristic algorithms solvethese instances. In this simulation, a solution is an assignment of the chosen candi-dates to the tasks. The simulation will capture the time taken to compute a solutionand the aggregated QoS resulting from the assignment. While best and worst caseefforts of the proposed heuristic algorithms are given in Section 5.4.5, a simulationof real world conditions reveals the typical required effort. In order to evaluatethe implemented algorithms under different influences, “the” simulation consistsof several elements:
• Campaigns. The entire simulation is divided into simulation campaigns.Each campaign investigates the influence of a particular parameter on theperformance of the algorithms. For example, a simulation campaign testshow the performance of the algorithms develops, if the number of tasks isincreased while the other parameters are kept constant.
121
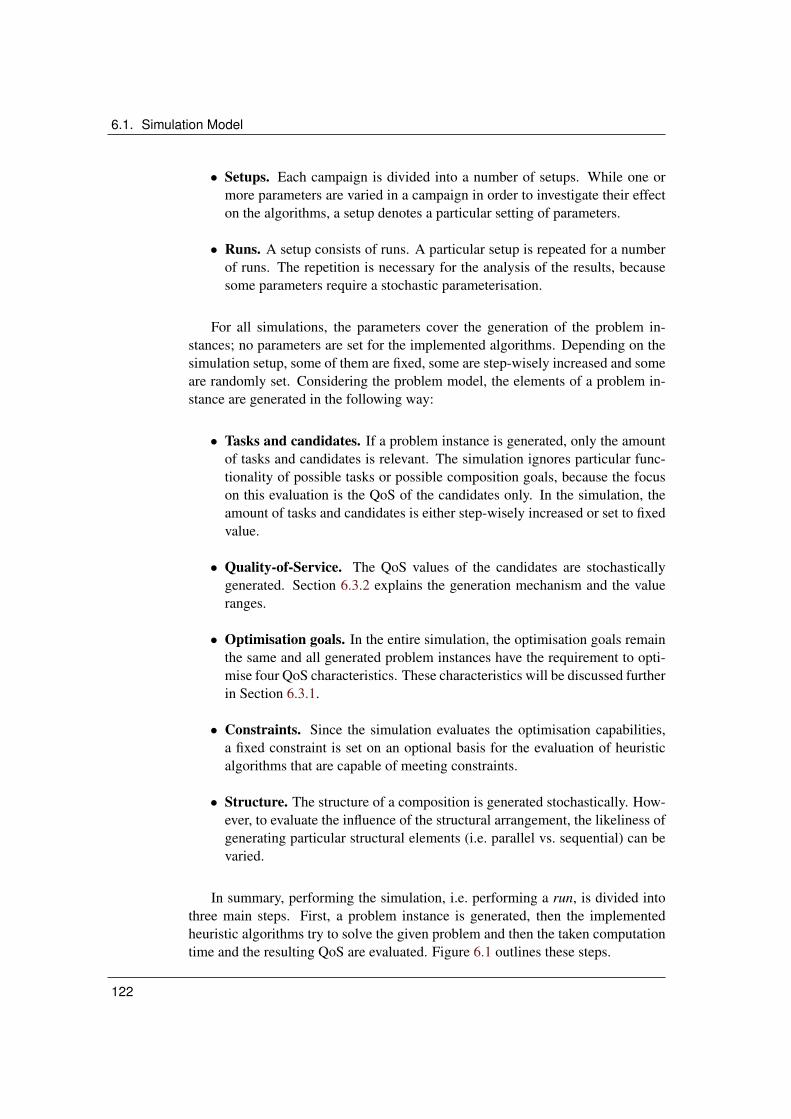
6.1. Simulation Model
• Setups. Each campaign is divided into a number of setups. While one ormore parameters are varied in a campaign in order to investigate their effecton the algorithms, a setup denotes a particular setting of parameters.
• Runs. A setup consists of runs. A particular setup is repeated for a numberof runs. The repetition is necessary for the analysis of the results, becausesome parameters require a stochastic parameterisation.
For all simulations, the parameters cover the generation of the problem in-stances; no parameters are set for the implemented algorithms. Depending on thesimulation setup, some of them are fixed, some are step-wisely increased and someare randomly set. Considering the problem model, the elements of a problem in-stance are generated in the following way:
• Tasks and candidates. If a problem instance is generated, only the amountof tasks and candidates is relevant. The simulation ignores particular func-tionality of possible tasks or possible composition goals, because the focuson this evaluation is the QoS of the candidates only. In the simulation, theamount of tasks and candidates is either step-wisely increased or set to fixedvalue.
• Quality-of-Service. The QoS values of the candidates are stochasticallygenerated. Section 6.3.2 explains the generation mechanism and the valueranges.
• Optimisation goals. In the entire simulation, the optimisation goals remainthe same and all generated problem instances have the requirement to opti-mise four QoS characteristics. These characteristics will be discussed furtherin Section 6.3.1.
• Constraints. Since the simulation evaluates the optimisation capabilities,a fixed constraint is set on an optional basis for the evaluation of heuristicalgorithms that are capable of meeting constraints.
• Structure. The structure of a composition is generated stochastically. How-ever, to evaluate the influence of the structural arrangement, the likeliness ofgenerating particular structural elements (i.e. parallel vs. sequential) can bevaried.
In summary, performing the simulation, i.e. performing a run, is divided intothree main steps. First, a problem instance is generated, then the implementedheuristic algorithms try to solve the given problem and then the taken computationtime and the resulting QoS are evaluated. Figure 6.1 outlines these steps.
122

6.2. Evaluation Methods and Metrics
generate problem instance, depending
on setup
probleminstance
time and chosen
candidates
run heuristic algorithms to solve
given instance
evaluateresults
Figure 6.1: Main steps of performing a simulation run.
6.2 Evaluation Methods and Metrics
Besides capturing the computation time of the algorithms, the simulation also com-pares the aggregated QoS of the composition resulting from the task-candidate as-signments. A comparison makes sense, because the proposed heuristics do notguarantee finding the optimal solution. Then, a quantitative analysis of the result-ing QoS shows how much worse a heuristic algorithm is as compared to others. Aquantitative statement is achieved by computing a score for the resulting QoS ofeach selection method. For this score the SAW method is used, which has beenintroduced in the previous chapter (cf. Section 5.2.4). By this method, one se-lection method serves as a reference and resulting scores for the other methodsindicate their relative QoS improvement or relative loss. For example, if the re-sults in the upcoming sections will present a QoS ratio of 1.20 this means that amethod has resulted in a “20%” better QoS when compared to the reference selec-tion. For this comparison, the different QoS categories are aggregated consideringequal weights. In summary, the concept of performance covers two measures:the computation time of the performed algorithm and resulting aggregated qualitycompared to a reference method.
The simulation implements the presented simulation model and performs theintroduced heuristics on randomly generated problem instances. In order to com-pute a QoS ratio independent from a heuristic method, the simulation providesadditional methods to provide references to an optimal solution and to a non-optimised result:
• Constraint-based. This method implements the simple case of optimisingwith regard to a single QoS characteristic. The algorithm shows a greedybehaviour: For each individual task, it chooses the candidate offering the bestQoS with respect to the considered constraint characteristic. This algorithmcan be used to meet a constraint based on a single QoS characteristic whileignoring other characteristics for optimisation.
• Random selection. By this selection, a candidate is randomly assigned to atask. Thus, this method completely ignores the QoS. It simulates the case in
123

6.2. Evaluation Methods and Metrics
which the candidates are chosen by other criteria, such as by their organisa-tional affiliation or by a first-found policy.
• Global search. The global selection evaluates all possible combinations andthen determines the best resulting assignment. This method shows the worstresult in terms of its computation time. However, it determines the bestQoS result possible. Therefore, this method serves as a reference for howclosely the heuristic algorithms approach the optimal result. This method canoptimise different QoS values and it can additionally consider constraints.
In addition to these methods, the discarding subsets method has been imple-mented in two ways: One variant optimises for different QoS categories and an-other can take one or more constraints into account. In summary, considering theselection methods for reference and the heuristics as mentioned in the previouschapter, the software simulation implements the following methods:
Algorithm, constraint capability
Constraint (yes) Random (no)Global Constraint (yes) Global Optimisation (no)Discarding Constraint (yes) Discarding Optimisation (no)Bottom-Up Approach (yes) Pattern-based Selection (no)
Local (no)
6.2.1 Statistical Measures
As mentioned in the previous section, the simulation software captures two mainmeasures of each run: the score of the aggregated QoS relative to a reference QoS,the QoS ratio, and the computation time. The result of the simulation will be sets ofsamples that represent a population of these two values (QoS ratio and computationtime) for each selection method. Because this work cannot list all the generatedand captured data of all campaigns, the results of each campaign are presented inthe following way: For each campaign, diagrams will show the average QoS andcomputation time of each selection method captured for each setup.
In addition to the diagrams, a table will list the results for one particular setupthat represents a typical output of other setups within a campaign. For example, if acampaign tests for different setups with an increasing numbers of tasks, a separatetable will present the results of one setup with a particular number of tasks. Thetables will present following statistical measures derived from the captured data:1
• Arithmetic mean. The arithmetic mean is interpreted as the average of aset of values. The used definition for the arithmetic mean x is as follows:x = 1
n
∑ni=1 xi
1The definitions that follow represent basic knowledge in the field of statistics; the Handbook ofMathematics by Bronstein et al. serves as a reference [13].
124

6.3. Parameters and Implementation
• Standard deviation. Besides the arithmetic mean, the standard deviationis a measure for how far or how close the individual values occur aroundthe arithmetic mean. For this work, the following definition for the standard
deviation s is considered: s =√
1n
∑ni=1(xi − x)2 with xi representing an
individual sample, n the count, and x the arithmetic mean of the samples.
In addition, the simulator performs a simple test to determine if the samplesare distributed around the given arithmetic mean. For this test, the softwaredetermines the percentage of the samples contained in 1|s|, 2|s| and 3|s| ofthe mean. If the distribution show a similarity to the percentage of 66%, 95%and 99% for 1s, 2s and 3s around the mean, this indicates that the distribu-tion is shows a concentration around the given mean value. For the interpre-tation of the results, this test provides an indication about the performancebehaviour of a selection method. A method can either show a performancewhich oscillates around an average, or it can show a split performance. i.e. itperforms either very badly or very well.
• 95%-Confidence interval. It is assumed that the measured computationtimes and the resulting QoS represent a population parameter with a specificdistribution. Thus, the calculated arithmetic mean covers only the capturedpart of the entire population.
The confidence interval denotes an interval in which the arithmetic meanof the entire population resides subject to a probability of correctly capturedsamples. In this simulation sciences, the considered probability is set at 95%.The denotes that 5% of the values are taken as wrong values resulting fromerrors in the simulation setup or the method to capture the results. Differentdefinitions for the confidence interval exist. These depend on the count ofsamples. Because the setup will be designed to contain between 50 and 1000runs, the following definition of the confidence interval is used:[
x− z(1− α
2
) s√n
;x + z(1− α
2
) s√n
]The variable α represents the likeliness of failure. For a 95%-confidenceinterval the assumed failure is 5%. The term z(x) refers to the quantile ofthe normal distribution. The other variables refer to the same definition aspreviously given.
6.3 Parameters and Implementation
One of the first parameters to set for the simulation is the size of a typical composi-tion structure. The Gartner Group has presented a study about the average numberof services found in companies and enterprises. This gives a rough overview aboutthe dimensions to consider [107]. According to this study, small companies deploy
125

6.3. Parameters and Implementation
about 25 services on average while very large enterprises deploy a total amount ofmore than 1000 services. In such very large enterprises, more than 100 clients ac-cess these services on a daily average. This study has also revealed that the servicesin very large enterprises are usually invoked among all units but entirely within theorganisation. From these numbers, no concrete estimation is possible. It is possibleto estimate that, on average, a client accesses 10 services which indicates roughlythe size of possible compositions. The number of 1000 services represents a direc-tion for how many services may be considered by a broker. However, assumptionsabout how many services candidates result for each task cannot be made.
Besides the numbers from this analysis, scientific publications provide indica-tions about possible sizes of service compositions. Van der Aalst et al. describethe application of workflow modelling techniques to the process of granting a loanfor a Danish bank company. In their example, 8 tasks are identified that togetherform a complete business process [147]. The evaluations of workflow managementfacilities of Heinis et al. [44] and Cranford et al. [19] mention workflows that usu-ally consist of up to 25 individual tasks or activities. Regarding the typical sizeof workflows or business processes, medium sized compositions can have aboutten tasks, while large compositions can be around 25 tasks in size. It must bealso considered that a composition might require a transformation before it can beprocessed by the aggregation method. Section 4.5 has mentioned these transforma-tions, which involve the duplication of nodes. Consequently, the resulting numberof tasks to process by selection algorithms might be larger than the number foundin the original business process.
6.3.1 Quality-of-Service Parameters
Regarding the response time, measurements of the invocation of Web services canbe considered because Web services represent the most popular SOA implementa-tion today. Tosic et al. have introduced an infrastructure to evaluate the provision ofpolicy-aware Web services [132], which also provides a quantitative measurementof Web service invocation times. In their work, they have performed experimentsto execute Web services while providing an adaptive solution to cover dynamicchanges in the given QoS. Their experiments show that a standard setup in a localnetwork resulted in a lowest response time of about 150 milliseconds of plain testWeb services. Therefore, for this work a value of 150 milliseconds is regarded asthe lower end of response time values.
Gillmann et al. have evaluated in their work the typical duration of activitiesin a workflow. The workflow scenario represents a realistic application of servicecompositions. According to their evaluation, automatic (non-interactive) activitiestake from around 2 to 12 seconds [38]. Chandrasekaran et al. have introduceda simulation environment for processes based on Web service compositions [18].Their measurements show which parts of the service invocation take which amountof time: the queuing of the request, its processing or the transfer over the network.According to their measurements, the service invocations range between 400 mil-
126

6.3. Parameters and Implementation
liseconds and 2.6 seconds.Regarding the availability of services, the work of Gillmann et al. considers
a typical downtime in the area of 20 minutes each day in their evaluation [38].2
This would result in an availability of 0, 985%. Kenyon presents in his book avery detailed discussion about typical availability rates in service architectures [72,p. 411]. The data is summarised in Table 6.1. Based on these values, it can beconcluded that an availability value close to 99% represents a lower limit for thebusiness minded provision of services. Values above the high-availability can beignored from Table 6.1, because for most cases it can be assumed that the underly-ing software platform, computer hardware and network connection provide a loweravailability.
. .System class Availability Yearly Downtime Daily Downtime
. .Unmanaged 90.00000% 876.00 h 2.40 hManaged 99.00000% 87.60 h 14.40 hWell-Managed 99.90000% 8.76 h 1.44 mFault-Tolerant 99.99000% 52.56 m 8.64 sHigh-Availability 99.99900% 5.26 m 863.99 ms...
......
...
Ultra-Availability 99.99999% 3.15 s 8.64 ms
Table 6.1: Availability rates and resulting downtimes by Kenyon [72, p. 411].
Regarding the cost and the reputation, an evaluation of existing work would notresult in any benefit for this simulation: Cost and reputation are individually set.Moreover, their definitions can vary as explained in Section 4.4.3. For example,the cost depends on the payment model or the considered currency. An amount ofa particular currency could require a transformation into another. Regarding thereputation any scale used for setting scores can be considered. For this work, forboth categories arbitrary absolute values within a reasonable range are considered.The value ranges of the other values – i.e. the response time, number of tasksand candidates, and availability – are based on the previously given discussion ofexisting literature. Table 6.2 summarises the value ranges for the parameters of thesimulation.
6.3.2 Implementation
The simulation software generates arbitrary problem instances which includes struc-tures and QoS values of the candidates to apply each of the different selectionmethods. The software considers the four QoS characteristics as described in the
2It must be noted that this number represents a simplified assumption of their failure model asexplained in [38]. However, for the use in this work such a statement is regarded as sufficient to getan impression about typical dimensions.
127
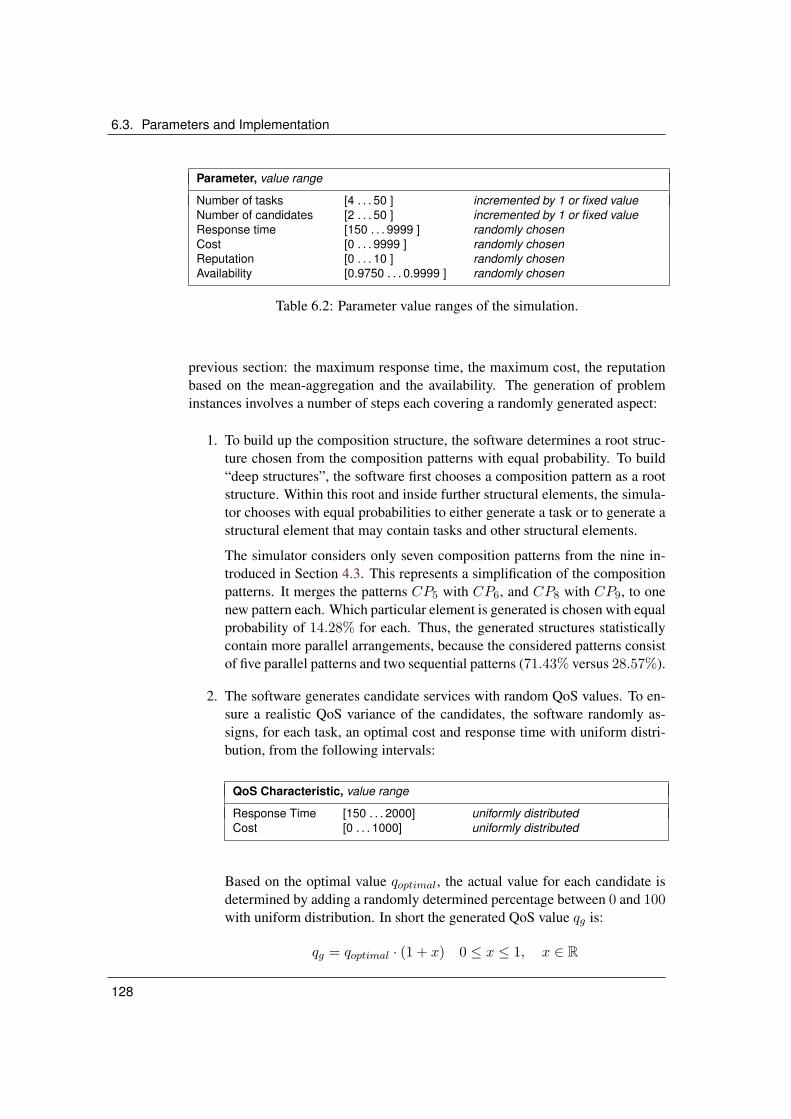
6.3. Parameters and Implementation
Parameter, value range
Number of tasks [4 . . . 50 ] incremented by 1 or fixed valueNumber of candidates [2 . . . 50 ] incremented by 1 or fixed valueResponse time [150 . . . 9999 ] randomly chosenCost [0 . . . 9999 ] randomly chosenReputation [0 . . . 10 ] randomly chosenAvailability [0.9750 . . . 0.9999 ] randomly chosen
Table 6.2: Parameter value ranges of the simulation.
previous section: the maximum response time, the maximum cost, the reputationbased on the mean-aggregation and the availability. The generation of probleminstances involves a number of steps each covering a randomly generated aspect:
1. To build up the composition structure, the software determines a root struc-ture chosen from the composition patterns with equal probability. To build“deep structures”, the software first chooses a composition pattern as a rootstructure. Within this root and inside further structural elements, the simula-tor chooses with equal probabilities to either generate a task or to generate astructural element that may contain tasks and other structural elements.
The simulator considers only seven composition patterns from the nine in-troduced in Section 4.3. This represents a simplification of the compositionpatterns. It merges the patterns CP5 with CP6, and CP8 with CP9, to onenew pattern each. Which particular element is generated is chosen with equalprobability of 14.28% for each. Thus, the generated structures statisticallycontain more parallel arrangements, because the considered patterns consistof five parallel patterns and two sequential patterns (71.43% versus 28.57%).
2. The software generates candidate services with random QoS values. To en-sure a realistic QoS variance of the candidates, the software randomly as-signs, for each task, an optimal cost and response time with uniform distri-bution, from the following intervals:
QoS Characteristic, value range
Response Time [150 . . . 2000] uniformly distributedCost [0 . . . 1000] uniformly distributed
Based on the optimal value qoptimal, the actual value for each candidate isdetermined by adding a randomly determined percentage between 0 and 100with uniform distribution. In short the generated QoS value qg is:
qg = qoptimal · (1 + x) 0 ≤ x ≤ 1, x ∈ R
128

6.3. Parameters and Implementation
To form a trade-off couple between the response time and cost, the two areset as follows: The value x1 added to the optimal response time is taken tocalculate the value x2 added to the optimal cost, with x1 + x2 = 1. Thus,the better the response time is, the worse the cost and vice versa.
3. Contrary to the previous characteristics, the software does not generate anoptimal value for generating the reputation values. The reputation is gener-ated by taking a base value of 5 and adding a value 0, . . . , 10 ∈ N, which ischosen with uniform distribution, to this base value. Regarding the availabil-ity, the algorithm considers the interval [0.975 . . . 0.999] as given in Table 6.2and chooses, with uniform distribution, a value between these two borders.
4. After the structure and candidate QoS values have been determined, a con-straint is determined by running the constraint selection first. In the simu-lation campaigns, the cost is the considered constraint characteristic. Theaggregated value is increased by a set percentage (for example by 20%) andthen taken as the constraint that has to be met by the other selection methods.
After the creation of the problem instance, the software performs the selectionmethods on this setup. For each run, the software captures the resulting aggregatedQoS and the computation time in microseconds. The computation is the time thatan algorithm needs to determine the solution, based on a given problem instance.Thus, the generation of the instance including the candidates with their QoS valuesis not captured by the measurements.
6.3.3 Technical Details
Since the computation times are captured to compare the computational efforts ofthe particular selection methods, the absolute performance of the used hard- andsoftware platform is generally irrelevant for the validity of the results. However,it was necessary to ensure that the simulation host computer kept its conditionthroughout all the campaigns and that no other processes running in parallel affectthe measurements. Consequently, only operating system and a software run-timeenvironment was installed on the host computer, keeping it clean at “factory set-tings”.
The simulation software is a custom implementation and no external software,libraries and tools were integrated. All selection methods ran in the same environ-ment under the same conditions working on the same data structure in the com-puter’s main memory. Java was chosen as the implementation language for thesimulation software because of its availability on many platforms. Thus, for thedistribution of the software, it is ensured that it will be able to run on differenthardware platforms and operating systems. Since Java 2 Standard Edition (J2SE)5.0, the API provides the operation System.nanoTime(), which offers a more pre-cise time measurement as the operation System.currentTimeMillis() provided byprevious versions of the Java platform as the only operation of this kind. It turned
129

6.4. Simulation Campaigns and their Results
out that measurements in the magnitude of milliseconds did not capture the com-putation time from the random, constraint and local selection methods. Therefore,the version 5.0 of the J2SE is the required run-time environment for the simulationsoftware. Setting the parameters to create the problem instances involved the gen-eration of random numbers. Accordingly, the pseudo-random number generatorimplementation of the class java.util.Random (with default seed) was used for thispurpose.
The entire simulation was performed on the same computer keeping the samesoftware platform. As a computer, standard PC hardware with the Windows 2000operating system was used. The operating system was kept at its default state,meaning that no additional driver software was installed and no settings were madeto additionally configure the computer. As a consequence, the computer did notmaintain any network connection and ran in standard 680 by 480 graphics modewith 16 colors. The only software that was installed is the Java virtual machine tolet the computer run the simulation software. Further technical specifications aboutthe computer are given in the Appendix A.
6.4 Simulation Campaigns and their Results
In the following, different simulation campaigns are described in which influenceof a particular parameter on the resulting performance of the algorithms is investi-gated. For example, it is obvious that a rising number of tasks will result in a risingcomputational effort. However, regarding a raising number of candidates with afixed number of tasks, one can guess that the algorithms scale differently becauseof different upper bounds of complexity. Another question is how much potentialfor optimisation exists for a given problem instance, since this potential dependson the variance of the provided candidate QoS. To cover these considerations, thefollowing different simulation campaigns have been designed that allow the evalu-ation of different performance factors:
Simulation campaigns, short description
C1 Increasing number of tasks without constraintC2 Increasing number of tasks with constraintC3 Increasing number of service candidates with a fixed number of tasksC4 Volatility of the QoS among the candidatesC5 Parallel vs. sequential composition structures
In the following sections, these campaigns are discussed and their results areanalysed. Regarding the simulation setup, two general issues have been set thatapply to all campaigns. The number of conducted runs per setup was set to 200times. From preliminary tests, it turned out that for this number of runs it is ensuredthat a campaign will result in similar statistical results when run again. Becausethe “exponential” selection methods are indeed very time-consuming to simulate,
130

6.4. Simulation Campaigns and their Results
the software skips a method if the average time has exceeded a certain limit. Forthe campaigns, the simulator has skipped a method if its average computation timein a run has exceeded 500 seconds.
6.4.1 Increasing Number of Tasks without Constraint (C1)
As a start, this simulation campaign has the goal to test the resulting performancewith an increasing number of tasks. For this campaign, the number of candidatesis kept constant. Regarding the setup of the QoS, this campaign does not set anyconstraints but it considers the four QoS characteristics for optimisation. As ex-plained in the previous section, the response time and cost will form a trade-offcouple, meaning that optimising one generally results in making the other worse.
The reference method for comparing the resulting QoS will be set to the con-straint-based selection. Although there is no constraint to meet, this method opti-mises for just one QoS characteristic and thus serves as a simple QoS optimisationapproach. Because, contrary to the local and pattern optimisation, the bottomupoptimisation considers also constraints, this method will be skipped for this cam-paign and explored in the next one. In summary, this campaign uses the followingsetup:
C1 Parameters and Setup, values
Number of tasks [4 . . . 50], each setup incrementing by 1Number of candidates 5, constantCandidate QoS as given in Table 6.2, randomly set,
uniformly distributedConstraint no constraint setInvolved methods constraint, random, global, discarding,
local and patternReference method constraint
Expectations
This campaign will evaluate how the different heuristics perform when faced withthe problem of optimising for different QoS characteristics while two of them forma trade-off couple. A constraint is not considered. Generally, this campaign willevaluate how well the heuristics optimise a given setup when compared with thethree reference methods.
Results
The results of this simulation campaign are shown in Figures 6.2 and 6.3. In ad-dition, Table 6.3 shows the results of the setup with 12 tasks. Figure 6.2 showsthe average resulting aggregated QoS performing the selection methods relative tothe constraint selection. Figure 6.3 shows the average computation times of thedifferent selection methods for problem instances with increasing number of tasks;
131

6.4. Simulation Campaigns and their Results
0.95
1.00
1.05
1.10
1.15
1.20
1.25
1.30
5 10 15 20 25 30 35 40 45 50
qos
ratio
(con
stra
int =
1)
number of tasks
ConstraintRandom
GlobalDiscarding
LocalPattern
Figure 6.2: Relative QoS to constraintselection (C1, with 5 candidates).
1 10
100 1000
10000 100000 1e+06 1e+07 1e+08 1e+09
5 10 15 20 25 30 35 40 45 50
time
in m
icros
econ
ds
number of tasks
ConstraintRandom
GlobalDiscarding
LocalPattern
Figure 6.3: Computation times of selec-tion methods (C1, with 5 candidates).
this diagram has a logarithmic scale on its y-axis. Table 6.3 lists the arithmeticmean, the standard deviation and the confidence interval. Based on the standarddeviation, the table shows how many percent of the samples are within one, two orthree standard deviations around the mean.
Average Standard % % %Method Mean x Deviation s in 1s in 2s in 3s 95%-Conf.
Overall QoS relative to constraint selection
Constraint 1.0 0.0 0.0 0.0 0.0 ± 0.0Random 0.9808 0.0937 76.50 96.00 98.50 ± 0.0110Glob O. 1.2463 0.0988 73.00 94.00 99.50 ± 0.0116Disc O. 1.2398 0.1022 72.00 93.00 100.00 ± 0.0120Local 1.2110 0.1068 73.00 95.50 99.00 ± 0.0125Pattern 1.2303 0.1019 71.00 94.00 99.50 ± 0.0120Computation duration, in microseconds
Constraint 23 51 98.50 98.50 98.50 ± 6.0040Random 8 1 23.50 69.00 95.00 ± 0.1177Glob O. 831,559,679 211,098,114 69.00 95.00 100.0 ± 24,485,178Disc O. 285,281,163 184,650,968 21.00 84.00 87.00 ± 21,738,258Local 48 46 98.50 98.50 98.50 ± 5.4154Pattern 263,332 2,098,027 98.50 98.50 99.00 ± 246,992
Table 6.3: QoS and times, setup with 12 tasks in C1.
Both the pattern and the local method show a resulting average QoS perfor-mance that is very close to the algorithm that always finds the optimal solution.In all runs, the pattern method shows the better resulting QoS when compared tothe local method. The gap between the pattern method and the local method isrelatively small. The discarding method shows almost the same QoS performanceas the global method.
132

6.4. Simulation Campaigns and their Results
Regarding the computing duration, the constraint, random and local methodsshow a slow increase – as expected. The results for the pattern method show that,with a growing number of tasks, its computation exceeds the given time limit andthus was skipped after the setup with 25 tasks. However, its computation timesclimb slower than the times of the global or the discarding method. Compared tothe global method, the pattern method performs significantly better: The averagecomputation time for a setup of 12 tasks is less than 0.1% of the average computa-tion time for the global selection.
The histogram of the computation times in Figure 6.4 explains the behaviourof the pattern method more closely. For more than 40% out of the 200 samples,the algorithm executes faster than 0.001 seconds. However, for 7% of the samplesthe algorithm takes more than 0.1 seconds for execution. This shows the volatilityof the required computational efforts by this method. For comparison, Figure 6.5shows the histogram of the computation duration of the global method. Althoughthe values are larger than those resulting from the pattern method, they do not showthat large variance.
0
20
40
60
80
100
120
140
102 103 104 105 106 107 108 109 1010
occu
rrenc
es
time in microseconds
Figure 6.4: Histogram of computationtimes of the pattern method (C1, setupwith 12 tasks).
0
20
40
60
80
100
120
140
102 103 104 105 106 107 108 109 1010
occu
rrenc
es
time in microseconds
Figure 6.5: Histogram of computationtimes of the global method (C1, setupwith 12 tasks).
Interpretation
This campaign has evaluated the performance of the three heuristics, the discard-ing, local and pattern methods. The results allow the following interpretation aboutthese three:
• Discarding. This method results in almost the same QoS performance as theglobal method that always finds the optimal solution. However, this cam-paign shows that the bounding ability of this heuristic cannot save enoughefforts to show a substantial difference. The results show that for largernumber of tasks, the bounding saves more than 50% of the computational
133

6.4. Simulation Campaigns and their Results
effort, but the effort still rises exponentially. Accordingly, its computationalperformance can be regarded as poor.
Looking at the results for very small composition sizes, the discarding methodtakes even longer time than the global method. Obviously, the discardingmethod cannot save more time by bounding sub-trees than it consumes morefor testing for bounding after each step.
• Local. The locally optimising method shows a QoS performance that comesvery close to the pattern, global and discarding methods. From the generateddata of this campaign, which is not entirely presented here, the local methodshowed that in about 95% of the runs, this selection method results a mini-mum QoS of about 15% worse than the average of the optimal solution. Asexpected, it performs with a negligible computational effort.
• Pattern. The results from this campaign, especially the histogram shown inFigure 6.4, allow the conclusion that the algorithm strongly depends on thegiven structure of the composition. The computational effort grows expo-nentially for the evaluation of the combinations within a pattern. If a patternconsists of many tasks to evaluate, the number of possible combinations risesexponentially. The simulation has shown that these cases occur and they re-sult in an extremely large computational effort. Compared with the two otherheuristics tested here, this method shows a QoS performance between the lo-cal and the discarding methods.
6.4.2 Increasing Number of Tasks with One Constraint (C2)
This simulation campaign has the goal to test the resulting performance with anincreasing number of tasks. For this campaign, the number of candidates per taskis kept constant. The particular QoS characteristics are generated using a normaldistribution. Consequently, each of the values within the range is possible withequal probabilities. For the constraint, one QoS characteristic is chosen. Then, therequired constraint value is set to 20% above the best value possible. The referencemethod for comparing the resulting QoS will be set to the constraint-based selec-tion. In summary, this campaign uses the following setup:
C2 Parameters and Setup, values
Number of tasks [4 . . . 50], each setup incrementing by 1Number of candidates 5, constantCandidate QoS as given in Table 6.2, randomly set,
with uniform distributionConstraint 1 characteristic, 20% worse than best possible for
constraint-aware methodsInvolved methods constraint, random, global, discarding
and bottomupReference method constraint
134

6.4. Simulation Campaigns and their Results
Expectations
The expectations are similar as in the previous campaign except that this campaigninvolves a constraint and thus, instead of the local and pattern heuristics, the focuslies on the discarding and bottomup heuristics. The anticipated result is a quantita-tive evaluation about how well each of the algorithms scales with a rising numberof tasks and if the resulting QoS of particular algorithms will decrease. Obviously,a larger composition structure will include a higher number of branches, whichcould result in more potential to optimise. On the other hand, a larger number oftasks will reduce the optimisation level, because the QoS increase of a particulartask will be relatively low compared to the aggregated QoS of the entire composi-tion.
Simulation Results
The results of this campaign are shown in Figures 6.6 and 6.7. In addition, Ta-ble 6.4 shows the results of the setup with 12 tasks.Figure 6.6 shows the averageresulting aggregated QoS performing the selection methods, relative to the con-straint selection. Figure 6.7 shows the average computation times of the differ-ent selection methods for problem instances with increasing number of tasks. Itmust be noted that its y-axis has a logarithmic scale. Table 6.4 lists the arithmeticmean, the standard deviation and the corresponding confidence intervals. Based onthe standard deviation, the table shows also how many percent of the samples arewithin one, two or three standard deviations around the mean.
0.95
1.00
1.05
1.10
1.15
1.20
1.25
1.30
5 10 15 20 25 30 35 40 45 50
qos
ratio
(con
stra
int =
1)
number of tasks
ConstraintRandom
GlobalDiscardingBottumup
Figure 6.6: Relative QoS to constraintselection (C2, with 5 candidates).
1 10
100 1000
10000 100000 1e+06 1e+07 1e+08 1e+09
5 10 15 20 25 30 35 40 45 50
time
in m
icros
econ
ds
number of tasks
ConstraintRandom
GlobalDiscardingBottumup
Figure 6.7: Computation times (C2 with5 candidates).
The results show that the exponentially time-bounded methods indeed show asteep increase in the computational duration. Compared to these, the quadratic bot-tomup method shows a relatively slow increase. Table 6.4 shows that the discardingmethod has a high volatility regarding its duration, while the global seems to op-erate on constant level. In fact, the confidence intervals show that the given mean
135

6.4. Simulation Campaigns and their Results
Average Standard % % %Method Mean x Deviation s in 1s in 2s in 3s 95%-Conf.
Overall QoS relative to constraint selection
Constraint 1.0 0.0 0.0 0.0 0.0 ± 0.0Random 0.9808 0.0937 76.50 97.50 98.50 ± 0.0110Glob Co. 1.2154 0.0899 73.00 94.50 99.00 ± 0.0105Disc Co. 1.2089 0.0934 72.00 94.00 99.00 ± 0.0110Bottomup 1.0655 0.0603 83.00 96.00 98.00 ± 0.0070Computation duration, in microseconds
Constraint 23 51 98.50 98.50 98.50 ± 6.0040Random 8 1 23.50 69.00 95.00 ± 0.1177Glob Co. 750,982,559 207,036,882 68.00 95.00 100.00 ± 24,373,668Disc Co. 309,828,060 176,015,663 19.50 81.50 84.50 ± 20,721,656Bottomup 268 98 84.00 94.00 95.00 ± 11.537
Table 6.4: QoS and times, setup with 12 tasks in C2.
value for the duration is not representative and the occurring values are widelyspread. To examine this behaviour further, Figure 6.8 shows a histogram of thecomputation times for the discarding method. Each bar shows the time in mi-croseconds. It must be noted that the x-axis in this diagram has a logarithmic scale.From this histogram it can be seen that about 50% of the runs perform faster than100 seconds while the average is at 309 seconds due to some runs with require ahigh effort.
The bottomup method shows a relatively large standard deviation and confi-dence interval of its duration. Also when observing the complete results, which arenot listed, the confidence interval decreases from 1/10th of the mean (at 12 tasks)to 1/20th of the mean (at 40 tasks). To provide additional insights on the resultingpopulation, the histogram of duration from the bottomup method is given in Fig-ure 6.9. The histogram shows an accumulation around the average. However, insome cases the values are three times larger. The computation times of the randomand constraint selection are relatively low and therefore is ignored in the furtherdiscussion.
Regarding the resulting QoS, the global and the discarding selection are on thesame level, indicating that the discarding method results in almost the same QoSas the global selection. The bottomup method shows a decreasing level of perfor-mance with a rising number of tasks when compared to the constraint selection.The 95%-confidence interval values, as given in the table, indicate that the averageclosely represents the actual performance of the selection methods.
Interpretation
Comparing the constraint selection and the global selection reveals that, on av-erage, the overall QoS can be improved by about 25% − 30% when considering
136

6.4. Simulation Campaigns and their Results
0
20
40
60
80
100
120
140
101 102 103 104 105 106 107 108 109
occu
rrenc
es
time in microseconds
Figure 6.8: Histogram of computationtimes of the discarding method (C2, with12 tasks).
0
20
40
60
80
100
120
140
0 100 200 300 400 500 600 700 800
occu
rrenc
es
time in microseconds
Figure 6.9: Histogram of computationtimes of the bottomup method (C2, with12 tasks).
the setup of QoS values as expected. The global and discarding methods show anexponentially rising computational effort with a larger number of candidates andtherefore can be regarded as unfeasible. The results allow the following interpreta-tion about the two evaluated heuristics:
• Discarding. The selection by discarding subsets results in the best QoS pos-sible, while still meeting the constraint for the setups. The heuristic aspect ofthe discarding subset algorithm, as discussed in Section 5.4.2, is very small;rather this method resulted in almost the same QoS as an algorithm that isguaranteed to always find the optimal solution.
Regarding the computational duration, this selection method has an unattrac-tive scaling. Obviously the time performance is highly volatile and seems todepend strongly on the generated example problem instances: In one thirdof the cases, this method solves the problem within a negligible effort whilein 15% of the cases, the duration is about 100-times as high. A future simu-lation campaign with the focus on different structures should to examine thisaspect further.
• Bottomup. The bottomup selection results in the second worst QoS, com-pared to the other heuristics. The results for the QoS values show thatthe bottomup method reaches about one third of the optimal performanceachieved by the global selection. However, it meets the constraint and showsa low computational effort and scales well with a rising number of tasks. Thebottomup method shows feasible efforts even for larger composition struc-tures.
In summary, this campaign has confirmed that the branch-and-based approachis not guaranteed to save computational efforts in special cases. But it resulted
137

6.4. Simulation Campaigns and their Results
in almost the best QoS possible. The bottomup method behaves in the oppositeway: It has low computational requirements combined with a relatively low QoSperformance.
6.4.3 Increasing Number of Service Candidates (C3)
For this campaign, the number of tasks in a problem instance is kept constant foreach test run. Like for the previous campaign, the particular QoS categories aregenerated using a normal distribution - thus this means that each of the valueswithin the range are chosen with equal probabilities. A constraint is considered forthis campaign by the constraint-aware methods.
C3 Parameters and Setup, valuesNumber of tasks 8, constantNumber of candidates [2 . . . 50]Candidate QoS as given in Table 6.2, uniform distributionConstraint 20% worse cost than best possible for constraint-
aware methodsInvolved methods constraint, random, global (two), discarding (two),
bottomup, local and patternReference method constraint
Expectations
The expected result is a quantitative analysis of how well each of the algorithmscales with a rising number of candidates. Compared with the rising number oftasks, increasing the number of candidates results in an effort bounded by a poly-nomial, because the number of tasks is kept constant. For the calculation of theworst-case effort, the number of tasks goes into the exponent of a time-boundingfunction, as explained in Section 5.3.5. For this campaign, the exponent is kept at8. Therefore, the worst-case effort for this setup results in the class of O(n8) wheren represents the number of candidates. A statement is expected on how the poly-nomial computational efforts will compare to the setup of the first two campaignswith an exponentially bounded effort.
Results
Figures 6.10 and 6.11 show the average aggregated QoS performing the selectionmethods relative to the constraint selection. Figures 6.12 and 6.13 show the aver-age computation times of the involved selection methods. In addition, Table 6.5shows the results of the setup with 11 candidates, because this setup still involvesthe global and discarding selection methods. For setups with more than 11 can-didates, the global selection was skipped. The table lists the arithmetic mean, thestandard deviation and the corresponding confidence intervals. Based on the stan-dard deviation, the table shows how many percent of the samples are within one,
138

6.4. Simulation Campaigns and their Results
two or three standard deviations around the mean.
1.00
1.10
1.20
1.30
1.40
1.50
1.60
1.70
5 10 15 20 25 30 35 40 45 50
qos
ratio
(con
stra
int =
1)
number of candidates
ConstraintRandom
GlobalDiscarding
LocalPattern
Figure 6.10: Relative QoS to constraintselection of optimisation-only methods(C3).
1.00
1.10
1.20
1.30
1.40
1.50
1.60
1.70
5 10 15 20 25 30 35 40 45 50
qos
ratio
(con
stra
int =
1)
number of candidates
ConstraintRandom
Global ConstrDisc Constr
Bootomup
Figure 6.11: Relative QoS to constraintselection of constraint-aware methods(C3).
1 10
100 1000
10000 100000 1e+06 1e+07 1e+08 1e+09
5 10 15 20 25 30 35 40 45 50
time
in m
icros
econ
ds
number of candidates
ConstraintRandom
GlobalDiscarding
LocalPattern
Figure 6.12: Computation duration ofoptimisation-only methods (C3).
1 10
100 1000
10000 100000 1e+06 1e+07 1e+08 1e+09
5 10 15 20 25 30 35 40 45 50
time
in m
icros
econ
ds
number of candidates
ConstraintRandom
Global ConstrDisc Constr
Bottomup
Figure 6.13: Computation duration ofconstraint-aware methods (C3).
Regarding the QoS performance, all methods show an increase with a risingnumber of candidates when compared to the constraint selection. The previouscampaigns have shown that an increasing number of tasks resulted in a decreasingbehaviour of the QoS performance, compared with the constraint selection. In thiscampaign, all methods have shown an improving QoS performance for a risingnumber of candidates when compared to the constraint selection. The results alsoshow a rather steep slope at the beginning, which seems to lower for larger numberof candidates.
Regarding the computational efforts, the results show a similar developmentthan in the previous two campaigns. The constraint, the random and local selectionshow at seldom runs a computation time of about 400 microseconds. In general
139

6.4. Simulation Campaigns and their Results
Average Standard % % %Method Mean x Deviation s in 1s in 2s in 3s 95%-Conf.
Overall QoS relative to constraint selection
Constraint 1.0 0.0 0.0 0.0 0.0 ± 0.0Random 0.9715 0.1028 70.00 97.00 98.50 ± 0.0121Glob O. 1.4114 0.1403 75.50 94.50 98.50 ± 0.0165Glob Co. 1.3304 0.1339 75.00 93.50 99.50 ± 0.0157Disc O. 1.4074 0.1404 75.00 95.00 98.50 ± 0.0165Disc Co. 1.3243 0.1331 74.50 94.00 99.50 ± 0.0156Local 1.3801 0.1448 75.00 95.00 98.00 ± 0.0170Bottomup 1.1062 0.1050 83.50 96.50 98.00 ± 0.0123Pattern 1.4005 0.1407 74.00 95.00 98.00 ± 0.0165Computation duration, in microseconds
Constraint 24 44 98.50 98.50 98.50 ± 5.1799Random 8 28 99.50 99.50 99.50 ± 3.2963Glob O. 544,394,247 125,620,708 68.00 93.00 100.0 ± 14,788,850Glob Co. 454,826,580 122,039,371 67.00 94.00 100.0 ± 14,367,230Disc O. 103,781,595 220,063,566 87.00 92.50 94.00 ± 30,498,693Disc Co. 147,531,815 250,731,490 81.00 89.00 95.00 ± 34,748,973Local 67 54 96.50 97.00 97.00 ± 6.3572Bottomup 304 54 85.50 94.00 94.50 ± 12.125Pattern 3,687,662 27,872,646 98.00 99.00 99.00 ± 3,281,341
Table 6.5: QoS and times, setup with 11 candidates in C3.
these three methods showed a rather continuous computation duration within onesetup which usually varies for a couple of microseconds. However, for a few runs,the results show an abnormality. A histogram of computation times by the localmethod shown in Figure 6.14 shows that most values are within the range of fewmicroseconds. It can be assumed that these captured “break-out” times resultedfrom temporary anomalies of the testing platform. The referring histogram in Fig-ure 6.15 shows that the captured values are widely distributed. Furthermore, thehistogram shows the pattern of an discrete distribution. It must be noted that they-axis of this histogram has a logarithmic scale.
Interpretation
Although the worst case effort of the algorithms is polynomial bounded, the com-putation time of the algorithms increases as fast as for the previous two campaigns.Since the number of possible combinations rose by n8, the computation time forthe first five setups rose quicker than for the setups with rising number of tasksand a fixed number of 8 candidates. The results show that even for relatively lowcomposition sizes the global method results in an intolerable effort. Regarding theinvolved heuristics, the following conclusions can be drawn:
• Discarding. Like in the previous campaigns, this heuristic results in a QoS
140

6.4. Simulation Campaigns and their Results
0
20
40
60
80
100
120
140
40 45 50 55 60 65 70
occu
rrenc
es
time in microseconds
Figure 6.14: Histogram of computationtimes for the local method (C3, 11 can-didates).
0
20
40
60
80
100
120
140
101 102 103 104 105 106 107 108 109
occu
rrenc
es
time in microseconds
Figure 6.15: Histogram of computationtimes for the pattern method (C3, 11candidates).
performance that is similar to the global selection. However, the quicklyrising duration makes clear that its application is unfeasible.
• Local. The local method shows a resulting QoS that is very close to theglobal method. Considering the resulting QoS from the pattern method, thisapproach offers similar QoS performance while showing negligible compu-tational efforts.
An interesting phenomenon is the rising QoS performance with a highernumber of candidates when compared to the constraint selection. With arising number of tasks (as performed in the previous campaign), the resultsshowed a decreasing performance: The impact when optimising a singlecritical task becomes relatively small with a larger total number of tasks. Afixed number of tasks provides a constant optimisation impact when improv-ing a single critical task. In addition, a higher number of candidates seemsto result in a higher potential to improve the QoS.
• Bottomup. The bottomup method confirms its good computational perfor-mance. Regarding the QoS performance, the improvements are clearly notas good as for the other heuristic methods; it seems to achieve 1/3 of theperformance of the other methods.
• Pattern. The pattern selection results in a QoS performance that is higherthan that of the local selection, but not as good as that of the discardingselection. Like in previous campaigns, the pattern method shows an unfeasi-ble effort with a rising number of candidates, even when considering that itperforms by magnitudes quicker than the discarding selection. In addition,this method shows an increasing QoS performance with a rising number ofcandidates as well, confirming the assumption that the optimisation potentialgenerally improves regardless of the considered method.
141

6.4. Simulation Campaigns and their Results
The pattern method showed also a distribution of captured computation timesthat looks similar to a discrete distribution (cf. Figure 6.15). It can be as-sumed that the computation times are directly dependent on the randomlygenerated number of tasks found within a single pattern. Considering thebars given in Figure 6.15, the rightmost could result from compositionswhere a pattern with 8 tasks was generated, the second-right results froma pattern with 7 tasks etc.
6.4.4 Volatility of the Quality-of-Service (C4)
For this campaign, the number of tasks and candidates of a problem instance iskept constant for each test run. Like for the previous campaign, the particular QoScategories are generated using an uniform distribution. In addition, the volatilityof the QoS values of the candidates is varied: The goal is to test setups in whichthe QoS values show large differences among the candidates. In contrast to this,the obtained results will be compared to setups in which the QoS values among thecandidates remain almost the same.
To create the variation among the generated QoS values, an additional factor,the variance factor qv, is included when the QoS of the candidates is generated.Based on the QoS generation explained in the previous Section 6.3, the generatedQoS value is:
qg = qoptimal · (1 + qvx) x = 0, . . . , 1
For the simulation, the different setups were performed with different values ofqv starting from 0.1 and incremented by about 0.16 for 50 times. The Table 6.6shows examples for generated QoS values at different values of qv. It must benoted that each set of 10 example candidates refers to a different task with differentbest QoS value. This campaign is different from the previous campaigns, becausethe simulator repeated the simulation test setup at different levels of qv, and notdifferent amounts of candidates or tasks.
qv = 0.1 qv = 1.0 qv = 4.01762.0 264.0 5.0 0.998 1844.0 1085.0 5.0 0.991 4564.0 1185.0 17.0 0.9881742.0 267.0 5.0 0.999 1523.0 1232.0 6.0 0.998 2072.0 2949.0 12.0 0.9951709.0 272.0 5.0 0.998 2312.0 0872.0 6.0 0.993 1648.0 3249.0 7.0 0.9561753.0 265.0 5.0 0.999 2330.0 0864.0 10.0 0.997 1477.0 3370.0 5.0 0.9541742.0 267.0 5.0 0.997 1491.0 1247.0 8.0 0.981 1990.0 3007.0 17.0 0.9291714.0 271.0 5.0 0.998 2028.0 1001.0 5.0 0.976 2345.0 2755.0 18.0 0.9951710.0 272.0 5.0 0.999 1940.0 1042.0 5.0 0.999 1107.0 3632.0 13.0 0.9301804.0 257.0 5.0 0.997 2045.0 0994.0 9.0 0.981 4210.0 1436.0 13.0 0.9781769.0 263.0 5.0 0.998 1668.0 1166.0 7.0 0.996 2648.0 2541.0 11.0 0.9051704.0 273.0 5.0 0.999 2307.0 0874.0 9.0 0.990 4310.0 1365.0 13.0 0.900
Table 6.6: Examples of generated QoS values at different qv.
142

6.4. Simulation Campaigns and their Results
C4 Parameters and Setup, valuesNumber of tasks 8, constantNumber of candidates 5, constantCandidate QoS value range altered by qv, from 0.1 to 8, by incre-
ments of 0.16, uniform distributionConstraint 20% worse cost than best possible for constraint-
aware methodsInvolved methods constraint, random, global (two), discarding (two),
bottomup, local and patternReference method constraint and random selection
Expectations
The expected result for this campaign differs much from the other. The expectationis to evaluate changes in the QoS performance of an algorithm if the volatility of thegenerated QoS increases. Moreover, the selection methods are expected to showindividual changes in their QoS performance: A heuristic method might resultin poor performance compared to the optimal solution if the setup offers a highoptimisation potential.
Results
Figure 6.16 shows the average resulting aggregated QoS performing the selectionmethods that are capable of optimisation only (e.g. the local method) relative tothe constraint selection. In the case that no constraint must be hold, the constraintselection just optimises for one QoS characteristic. Figure 6.17 shows the same forthe constraint-aware selection methods (e.g. the bottomup method) with a givenconstraint. In addition to the these diagrams, Figures 6.18 and 6.18 show the QoSratio relative to the random selection. In the same manner, Figures 6.20 and 6.21show the average computation times. It must be noted that the y-axis has a log-arithmic scale in both figures. Table 6.7 lists the arithmetic mean, the standarddeviation s and the corresponding confidence intervals for the setup with qv = 2.Based on the standard deviation, the table shows how many percent of the samplesare within one, two or three standard deviations around the mean.
The results in Figures 6.20 and 6.21 show that an increasing qv results in aslight decrease of the computation time for the methods based on a branch-and-bound approach. These methods also show a strong volatility of the computationtime (cf. Table 6.7). However, except from the discarding methods, the variationof the qv does not appear to have an impact on the times. The pattern methodshows an intense oscillation around a fixed level. In comparison, the values givenby Table 6.7 show a high deviation and a high confidence interval, indicating thatthe given average values are highly volatile. The level of typical computation timesof the pattern selection appears to be two magnitudes lower than the correspondinglevels of the discarding and global selection.
The results regarding the QoS performance show that most selection methods
143
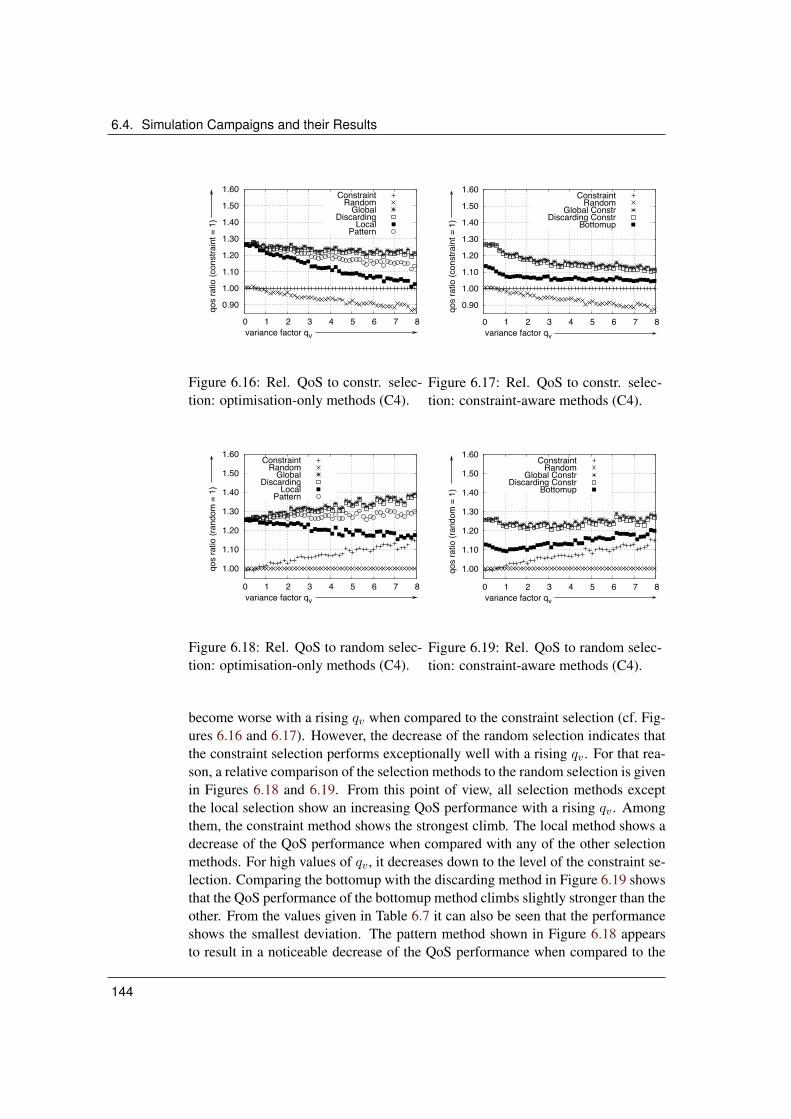
6.4. Simulation Campaigns and their Results
0.90
1.00
1.10
1.20
1.30
1.40
1.50
1.60
0 1 2 3 4 5 6 7 8
qos
ratio
(con
stra
int =
1)
variance factor qv
ConstraintRandom
GlobalDiscarding
LocalPattern
Figure 6.16: Rel. QoS to constr. selec-tion: optimisation-only methods (C4).
0.90
1.00
1.10
1.20
1.30
1.40
1.50
1.60
0 1 2 3 4 5 6 7 8
qos
ratio
(con
stra
int =
1)
variance factor qv
ConstraintRandom
Global ConstrDiscarding Constr
Bottomup
Figure 6.17: Rel. QoS to constr. selec-tion: constraint-aware methods (C4).
1.00
1.10
1.20
1.30
1.40
1.50
1.60
0 1 2 3 4 5 6 7 8
qos
ratio
(ran
dom
= 1
)
variance factor qv
ConstraintRandom
GlobalDiscarding
LocalPattern
Figure 6.18: Rel. QoS to random selec-tion: optimisation-only methods (C4).
1.00
1.10
1.20
1.30
1.40
1.50
1.60
0 1 2 3 4 5 6 7 8
qos
ratio
(ran
dom
= 1
)
variance factor qv
ConstraintRandom
Global ConstrDiscarding Constr
Bottomup
Figure 6.19: Rel. QoS to random selec-tion: constraint-aware methods (C4).
become worse with a rising qv when compared to the constraint selection (cf. Fig-ures 6.16 and 6.17). However, the decrease of the random selection indicates thatthe constraint selection performs exceptionally well with a rising qv. For that rea-son, a relative comparison of the selection methods to the random selection is givenin Figures 6.18 and 6.19. From this point of view, all selection methods exceptthe local selection show an increasing QoS performance with a rising qv. Amongthem, the constraint method shows the strongest climb. The local method shows adecrease of the QoS performance when compared with any of the other selectionmethods. For high values of qv, it decreases down to the level of the constraint se-lection. Comparing the bottomup with the discarding method in Figure 6.19 showsthat the QoS performance of the bottomup method climbs slightly stronger than theother. From the values given in Table 6.7 it can also be seen that the performanceshows the smallest deviation. The pattern method shown in Figure 6.18 appearsto result in a noticeable decrease of the QoS performance when compared to the
144

6.4. Simulation Campaigns and their Results
1 10
100 1000
10000 100000 1e+06 1e+07
0 1 2 3 4 5 6 7 8
time
/ micr
osec
onds
variance factor qv
ConstraintRandom
Global
DiscardingLocal
Pattern
Figure 6.20: Computation duration:optimisation-only methods (C4).
1 10
100 1000
10000 100000 1e+06 1e+07
0 1 2 3 4 5 6 7 8
time
/ micr
osec
onds
variance factor qv
ConstraintRandom
Global Constr
Disc ConstrBottomup
Figure 6.21: Computation duration:constraint-aware methods (C4).
global and discarding selection.
Interpretation
Compared to the random selection, the global methods (the optimising only and theconstraint aware) show a rising QoS performance when the variance of the QoSvalues increases among the candidates. This allows the conclusion that a highervariance creates a higher potential for optimisation. Considering only one QoScharacteristic, the QoS optimisation potential rises even stronger when comparedto the global selection.
• Discarding. The discarding selection results in small savings regarding thecomputational efforts for small values of qv and larger savings for a highervalue of qv, when compared to the global selection. Obviously, this methodis able to skip combinations more efficiently the more the QoS is varied.
• Local. For small values of qv, the local method shows a high QoS perfor-mance when considering the global selection as reference. For high valuesof qv, the local selection shows no difference in the overall QoS when com-pared to the constraint selection, which optimises only by one characteristic.
The simulations also show that optimising one QoS category, which is doneby the constraint selection, has almost no effect on the overall QoS for lowvalues of qv. However, it must be noted that a constraint regarding one QoScategory can be taken into consideration.
• Bottomup. Regarding the computation times, the bottomup method con-firms the impression of the previous campaigns. It results in low efforts andkeeps constant throughout the different setups. It shows a relatively low QoSperformance, like in other campaigns. However, it must be noted that com-
145

6.4. Simulation Campaigns and their Results
Average Standard % % %Method Mean x Deviation s in 1s in 2s in 3s 95%-Conf.
Overall QoS relative to constraint selection
Constraint 1.0 0.0 0.0 0.0 0.0 ± 0.0Random 0.9720 0.1052 76.00 97.00 98.50 ± 0.0123Glob O. 1.2458 0.1053 72.50 95.50 98.50 ± 0.0124Glob Co. 1.1826 0.0940 75.00 95.50 98.50 ± 0.0110Disc. O. 1.2427 0.1072 73.00 94.50 98.50 ± 0.0126Disc. Co. 1.1768 0.0933 74.50 95.50 98.50 ± 0.0109Local 1.1914 0.1207 74.00 95.50 98.50 ± 0.0142Bottomup 1.0691 0.0787 91.50 96.00 98.00 ± 0.0092Pattern 1.2266 0.1132 70.50 95.50 98.50 ± 0.0133Computation duration, in microseconds
Constraint 17 33 99.00 99.00 99.00 ± 3.8849Radom 7 0.0 0.0 0.0 0.0 ± 0.0Glob O. 968,646 225,758 65.50 95.50 100.0 ± 26,577Glob Co. 810,440 217,805 66.00 95.00 100.0 ± 25,641Disc. O. 680,862 721,339 83.50 94.50 98.50 ± 84,920Disc. Co. 592,478 642,166 80.50 96.50 98.00 ± 75,599Local 34 47 98.00 98.00 98.00 ± 5.5331Bottomup 159 88 92.50 93.00 93.00 ± 10.359Pattern 9,488 42,495 97.00 97.00 99.00 ± 5,002.7
Table 6.7: QoS and times, setup with qv = 2 in C4.
pared to the other selection methods, except the constraint selection, it keepsan acceptable level.
• Pattern. The pattern selection shows a smaller decrease of the QoS perfor-mance for larger values of qv when compared to the local selection. Thesmall gap between this and the local selection that was noticed in the pre-vious campaigns becomes larger with a higher variance among the offeredQoS. This campaign has also confirmed the volatile behaviour of the patternheuristic regarding its computational efforts.
6.4.5 Parallel vs. Sequential Composition Structures (C5)
As mentioned in the introduction on the QoS-based selection in Section 5.1, aspecific characteristic of the selection problem lies in determining the combinationof candidates in the parallel arrangements. This campaign will vary the structuralelements used for the problem instances to evaluate the performance of the differentalgorithms with an increasing number of parallel arrangements.
The first setup starts with all-sequential structures. For the subsequent setups,the simulator generates parallel patterns with increasing probability. A probabilityvalue of 20% means that there is a 20% probability that a parallel pattern is cre-ated, and an 80% probability that a sequential only is created. The last setup is
146

6.4. Simulation Campaigns and their Results
performed at a probability value of 100%. In this case, the generated structuresconsist entirely of parallel patterns.
C5 Parameter / Setup (Value)Number of tasks 8, constantNumber of candidates 5, constantCandidate QoS as given in Table 6.2, uniformly distributedConstraint 20 % worse cost than best possible for constraint-
aware methodsInvolved methods constraint, random, global (two), discarding (two),
bottomup, local and patternReference method constraintStructure starting with sequential structures with rising proba-
bility of parallel structures, incrementing each setupby 2%
Expectations
The expected result from this campaign is a qualitative statement about how theQoS and computational performance of the selection methods depend on the struc-ture of the composition. For example, for all-sequential structures, an algorithmmight perform very fast when compared to parallel structures. Regarding the QoSperformance, this campaign will show if any of the proposed heuristics will per-form worse or better with a rising ratio of parallel patterns.
Results
The results regarding the QoS performance are shown in Figures 6.22 and 6.23.The computation times are given in Figures 6.24 and 6.25. In all figures, the dashedlines indicate the probability value that was applied in the four previous campaigns.In addition, Table 6.8 shows the results of the setup with a probability value of100%.
The global selection and the three heuristics show an increase of the QoS per-formance with a rising number of parallel structures. Because the global selectionresults in the optimal solution, this indicates that the potential for the optimisationof the QoS increases with the ratio of parallel structures. As a qualitative statement,the local and the pattern selection show similar improvements while the pattern se-lection results in approx. 3 − 4% better QoS performance compared to the localmethod. Like the global selection, the discarding selection shows a steeper increaseof the QoS performance when compared to the two other heuristics.
Regarding the computation time, all three selection methods show similar re-sults as in the previous campaign. The discarding selection requires for sequentialstructures almost the same efforts as the global method. For all parallel structuresit performs almost three times as fast. It must be noted that after a 100% proba-bility of generating parallel structures, no further improvements can be achieved.Therefore, the values for the 100% probability represent a maximum of the indi-
147

6.4. Simulation Campaigns and their Results
0.95
1.00
1.05
1.10
1.15
1.20
1.25
1.30
0 20 40 60 80 100
qos
ratio
(con
stra
int =
1)
parallel probability %
ConstraintRandom
GlobalDiscarding
LocalPattern
Figure 6.22: Relative QoS to constr.selection: optimisation-only methods(C5).
0.95
1.00
1.05
1.10
1.15
1.20
1.25
1.30
0 20 40 60 80 100
qos
ratio
(con
stra
int =
1)
parallel probability %
ConstraintRandom
Global ConstrDisc Constr
Bottomup
Figure 6.23: Relative QoS to constr. se-lection: constraint-aware methods (C5).
1 10
100 1000
10000 100000 1e+06 1e+07
0 20 40 60 80 100
time
/ micr
osec
onds
parallel probability %
ConstraintRandom
GlobalDiscarding
LocalPattern
Figure 6.24: Computation duration:optimisation-only methods (C5).
1 10
100 1000
10000 100000 1e+06 1e+07
0 20 40 60 80 100
time
/ micr
osec
onds
parallel probability %
ConstraintRandom
GlobalDiscarding
Bottomup
Figure 6.25: Computation duration:constraint-aware methods (C5).
cated direction. Like in the previous campaign, the pattern selection shows a largervolatility of its computational duration than the other selection methods.
Interpretation
The results show generally the larger potential for QoS optimisation if a composi-tion structure contains parallel structures. Moreover, the three heuristics, the dis-carding, local and pattern selection, show also QoS performance improvementswith a larger ratio of parallel structures. The constraint and the random selectionshow constant QoS performance. Therefore, such methods do not appear to per-form well with parallel structures when compared to the other methods.
The computation time stays almost constant for all methods, except for thediscarding selection, which shows poor time performance for sequential structureswhile its performance improves for a rising ratio of parallel structures. As in previ-
148

6.5. Evaluation Conclusions
Average Standard % % %Method Mean x Deviation s in 1s in 2s in 3s 95%-Conf.
Overall QoS relative to constraint selection
Constraint 1.0 0.0 0.0 0.0 0.0 ± 0.0Random 0.9799 0.1005 67.50 96.00 99.50 ± 0.0118Global O. 1.2705 0.1209 71.00 92.50 99.50 ± 0.0142Global Co. 1.2212 0.1169 71.00 97.00 100.00 ± 0.0137Disc. O. 1.2619 0.1261 71.00 93.00 99.00 ± 0.014Disc. Co. 1.2127 0.1184 70.00 97.50 100.00 ± 0.013Local 1.2300 0.1278 73.00 95.50 99.90 ± 0.015Bottomup 1.0843 0.0868 88.50 95.00 97.50 ± 0.010Pattern 1.2545 0.1225 71.00 92.00 99.50 ± 0.014Computation duration, in microseconds
Constraint 16 28 99.50 99.50 99.50 ± 3.296Random 7 0.0 0.0 0.0 0.0 ± 0.0Global O. 787,800 182,108 66.00 96.50 100.00 ± 21,438Global Co. 675,092 170,954 65.50 97.50 100.00 ± 20,125Disc. O. 232,417 348,351 85.50 94.00 98.00 ± 41,010Disc. Co. 261,742 406,588 86.50 93.00 98.00 ± 47,866Local 28 2 64.50 95.50 98.50 ± 0.235Bottomup 137 70 96.50 97.00 97.00 ± 8.240Pattern 13,902 1,407,168 95.50 98.50 98.50 7,864
Table 6.8: QoS and times, setup with a parallel probability of 100% in C5.
ous campaigns, the pattern selection shows a highly oscillating computation time,indicating a strong dependency on the composition structure.
6.5 Evaluation Conclusions
The first three campaigns have tested the heuristics with a rising number of tasksand candidates. As discussed in the previous chapter, the global selection results inquickly rising computation times. These results confirm that the straight-forwardevaluation of all candidates represents an intolerable approach. The campaignsalso show that an increasing number of candidates is not preferable to an increasingnumber of tasks for the global selection under the simulation conditions. Althoughan increasing number of candidates results in efforts that can be bounded by apolynomial, the results show that only small compositions can be solved in feasibletime by such brute-force approaches.
The campaign that increases the deviation of the QoS values demonstrates thatthe more the QoS values differ among the candidates, the more increases the po-tential to improve the overall QoS. This potential is identified by the global, dis-carding, bottomup and pattern methods when compared to the random selection,which ignores the QoS. However, the heuristic local selection shows a decreasingperformance which has indicated that this method performs worse the stronger the
149

6.5. Evaluation Conclusions
QoS values among the candidates vary. In contrast, the heuristics reveal a goodperformance close to the optimal solution in cases where the QoS of candidatesshow relatively low differences.
The campaign that tests for the performance differences when either process-ing parallel or sequential structures demonstrates that, with a rising ratio of parallelstructures, the optimal QoS identified by the global selection increases. Contraryto the preceding campaign, all the heuristics show a slight increase of the QoSperformance when the ratio of parallel structures rises. Accordingly, the structuralarrangement of the composition has in impact on the QoS performance of the dif-ferent methods. However, all methods show a similar level of improvement and nomethod reveals a particular weakness or strength in this campaign.
Referring to the four evaluated heuristics, the following conclusions can bedrawn:
• Discarding. The discarding selection method can be considered unfeasi-ble. It performed about two to three times faster in comparison to the globalmethod, however it still showed an exponentially increasing effort for thegiven problem instances. Obviously, the given setup of QoS values andcomposition structures do not allow the algorithm to bound sub-trees veryoften. Regarding the QoS performance, the discarding selection resulted inthe same QoS as the global selection in the tests.
• Local. The local heuristic represents a simple approach that consumes al-most no computational efforts. The required efforts are in the same range asthe constraint or the random selection. Considering that an assignment mustbe performed in any case, the efforts for the local selection are negligible.The campaigns have shown that this method usually resulted in more than4/5 of the full QoS optimisation potential when considering the interval be-tween the optimal solution and the QoS-ignoring result. Further tests haveshown that this method becomes noticeably weaker the more the QoS valuesdiffer among of the candidates.
• Bottomup. The bottomup selection has shown a negligible computationaleffort. This method scales well with both a rising number of candidates andtasks. However, the QoS performance can be regarded as weak when com-pared to the local or pattern selection. In the campaigns, it reached about1/2 to 2/3 of the QoS optimisation potential, referring to the interval be-tween optimal and QoS-ignoring solution. Moreover, its QoS performancedecreases for a rising number of tasks. However, this approach is capable ofconsidering constraints. Thus, it has an advantage over the local and patternselection.
• Pattern. Compared with the bottomup and the local methods, the patternselection showed the best QoS performance. However, a small fraction ofthe performed runs has resulted in an unfeasible computational effort that
150

6.5. Evaluation Conclusions
makes the application of this method difficult. As discussed in the previouschapter, the algorithm performs badly if a structural pattern contains a largenumber of tasks. Although this constellation can be regarded as unlikely, therandom setups have encountered these at significant amount of times. As aconclusion for future work, the pattern method could be combined with alocal approach: Then, a combined algorithm can switch to a faster algorithmif a composition structure is identified to produce high efforts, e.g. a singlepattern that contains a relatively high number of tasks.
In summary, the campaigns have shown that the heuristic have a good perfor-mance under special conditions. As for other cases, the following basic trade-offcouples apply: If an heuristic performs quickly, its QoS performance is poor. If analgorithm shows a good QoS performance, it shows an unfeasible worst-case ef-fort. As an inspiration for future work, a hybrid heuristic might be able to combinethe good elements of the tested approaches. For example, such an heuristic couldchoose an appropriate strategy based on key parameters determined for a particularproblem instance.
151

6.5. Evaluation Conclusions
152

Chapter 7
Developing Service Compositions
As Chapter 2 has explained, different modelling languages exist: Some of them fo-cus on modelling business processes and ignore specific SOA technologies, whileothers are specifically designed to cover specific technical platforms, for exampleWeb services. In addition, Chapter 2 has defined a relation between business pro-cess models, composition models and a service composition. The developmentprocess of a service composition must cover the entire chain – from processing abusiness process model as an input, up to the output of an execution descriptionthat allows the service provider to run the composition.
Since the development of composition starts with a model of a process, the lit-erature discusses methods and solutions that take advantage of the proposed ModelDriven Architecture (MDA) introduced by the Object Management Group (OMG).The OMG represents a non-profit standardisation organisation with the goal of de-veloping object-oriented technologies. Briefly explained, the MDA proposal bun-dles a set of standards to facilitate the software development with the focus onmodelling languages and modelling tools. In an MDA-based development effort,not writing source code but expressing models represent the centre developmenteffort. It is desired that the source code is automatically generated from a set ofmodels that cover the structure and the behaviour of the software. In the contextof service compositions, the MDA provides an infrastructure that allows directlytaking a model of the business process as the starting point for the development ofa composition of services that facilitate the process. Many software vendors andinitiatives support this approach with available integrated development environ-ments (IDEs). Examples are the software development tools of Borland, as wellas EclipseUML, which is based on the Eclipse open source project; IBM offersa suite named WebSphere portfolio that supports the entire chain of developmentfrom business process modelling to a service with monitoring facilities [85].1
This chapter will introduce the basic elements that such a development process
1Borland provides the Together Suite which covers general software development efforts includ-ing the composition of Web services. A development environment that has a direct focus on therealisation of business processes from IBM is the WebSphere Integration Developer.
153

7.1. Introduction to the Model Driven Architecture
must involve; however, it will not cover and discuss specific development processmethodologies such as the popular waterfall methodology or newer use-case-drivenor extreme programming approaches. It will focus on the issues of trading whendeveloping compositions. Because the MDA is not a part of this focus area, thischapter tries to avoid details about the MDA. It will not present a complete view onthe MDA and concepts like the model hierarchy, for example, are ignored in thisdiscussion.
The goal is to give the reader an orientation about the development of compo-sitions and to explain how processing QoS will enhance the output of the develop-ment process. The remainder of this chapter will start with a brief introduction tothe MDA and introduces service-composition-related applications from the litera-ture. Subsequent to that, the main steps in the development of compositions willbe discussed; this work is partially based on previously published research workabout building compositions of Web services (cf. Grønmo and Jaeger [39], [40]).
7.1 Introduction to the Model Driven Architecture
The general objective of the MDA is to separate the specification of the systemfunctionality from specific platform technology [96]. Figure 7.1 shows the basicseparation of different categories for models that occur in this architecture. Theseparation is the result of an abstraction that separates the technical details in amodel from the functional aspects of a system. Accordingly, one kind of modelis proposed that does not refer to any technical specific artefacts. Such a model isnamed Platform Independent Model (PIM). Based on the PIM, a Platform SpecificModel (PSM) is foreseen. Besides a PIM and a PSM, the development can option-ally involve a model of the domain concepts that describe the actors and entitiesfound in the application domain. Such a model can provide a view on the systemthat is independent from any functional or computational details.
The MDA approach anticipates that developers start to design their softwarewith a PIM that does not cover any technology-specific aspects. When this modelis finished, it represents the basis for deriving a PSM. Therefore, the choice for aspecific technology is deferred until the PSM is created. The authors of the MDAanticipate that these transformations happen automatically and thus let the devel-oper focus on modelling the functionality rather than writing code. Consequently,the model becomes an asset of the development process. With the adoption of theMDA, three main advantages are anticipated by the OMG [96]:
• The same system functionality, once modelled, can be reused for differenttarget platforms. This flexibility is often required, because the IT landscapein businesses consists of many heterogeneous platforms and software sys-tems as already explained in Section 2.4.
• A separate model of the system functionality allows a more efficient vali-dation. If the model is free from technical details, there is less to consider
154
7.1. Introduction to the Model Driven Architecture
for validation tools. Moreover, the software specification and developmentwill likely result in different models at different levels of abstraction. Withdefined transformations between the different levels of abstraction, tools canensure the consistency between these models.
• The creation of the system can be guaranteed to be free from technical arte-facts that a specific technology would imply. Thus, a platform-independentmodel offers a better foundation for the desired functionality.
Model of Business Process / Workflow
Abstraction
Platform IndependentComponent View (PIM)
Model of the Domain(optional)
Computation Independent Business Model
Model of ServiceComposition
Platform SpecificView (PSM)
Figure 7.1: Separation of the models in the MDA (based on OMG’s MDA docu-ment [96, section 2.3]).
Besides the MDA proposal, the OMG has also standardised several relatedtechnologies. The Meta Object Facility (MOF, [98]) represents the most funda-mental standard. It defines how to specify modelling languages. Usually, a soft-ware developer is not concerned with the MOF. Instead, it is a standard used bymodelling language designers and tool manufacturers. A well-known modellinglanguage is the Unified Modelling Language (UML, [100]). Software developersuse the UML to express models of software systems or parts of a software system.And as mentioned in Section 2.1.2, a part of the UML, the activity diagram, is alsoconsidered for modelling business processes.
The main research challenge in the field of the MDA is the model transfor-mation technology that transforms PIMs into PSMs. Furthermore transformationshould provide the generation of source code or execution descriptions from PSMs.Source code or similar descriptions can be seen as textual models in this context.Several software products and tools using the UML and the MDA are already avail-able for the creation of business processes. However, the goal that has not beenreached so far is a fully automated tool chain. The vision is that software engineerscan focus on the business process model and automated transformations providethe generation of the source code.
155

7.1. Introduction to the Model Driven Architecture
PSM 1
PSM 2
PSM n
PIM 1
PIM 2
PIM n
(...)
(...)
Business Process Model (System Functionality)
+ Profile of Service (QoS) Aspects
+ Profile ofSecurity Aspects
Model of Middleware(e.g. Web Services)
Model ofImplementationLanguage (e.g. Java)
Model of Implem.Environment(e.g. Axis)
Target Platform(Source Code or Interface Desc)
Abstraction
System Detail
Figure 7.2: The evolution of the models in the MDA (based on Bezivin et al. [9]).
In the context of MDA, a problem is that a single modelling language doesnot cover all the aspects needed to create models of the entire problem domain.This applies especially to the topic of this work, the creation of business processeswith service compositions. Chapter 2 has already introduced several modellinglanguages, which are at different levels of abstraction. Some languages focus onmodelling abstract business processes and some languages involve Web servicestandards which refers to PIMs. An ideal MDA environment would support thetransformation of models between different levels of abstraction and it would en-sure the consistency between them. Besides the transformation issues, several fur-ther aspects should be covered like security, QoS or organisational constraints. Thisresults in different views on the system. To cover this problem, current researchefforts evaluate how to mark up models with aspects based on extensions, namedUML profiles. UML profiles allow extending the modelling concepts found in theUML.
Figure 7.2 outlines different levels of abstraction, with possible examples ofPIMs and PSMs. This figure has been presented by Bezivin et al. [9]. It showsthat a model of the business process is assigned to the group of PIMs. Additions tothis model, such as the specification of QoS aspects or security constraints, resultin a less abstract PIM. A model that directly refers to a specific component or SOAtechnology represents a PSM. A further specialisation, in the sense of being less
156

7.1. Introduction to the Model Driven Architecture
abstract, is the coverage of specific SOA platforms. Then, possible transformationsresult in further detailed models up to the source code or interface descriptions.
7.1.1 Model Driven Development of Web Service Compositions
The adoption of the MDA to develop service compositions or business processeshas been already covered by research work. In the following, three research effortsare introduced, which have applied the MDA for the creation of business processeswith SOA technologies. These three efforts are considered to be representativefor this field and to reflect the state-of-the-art. The first cited work covers theaspects of supporting Web services in an MDA-based development. The secondeffort plays in the same field but focusses more on how the transformations willbe created. The third work covers the consistency between the models of differentlevels of abstraction. These three research works also demonstrate the feasibilityof adopting the MDA to develop service compositions in order to develop businessprocesses.
• Web service compositions in UML (Skogan et al. [120]) The authors pro-pose UML activity models to design a Web service composition. UsingMDA techniques, an UML activity diagram can be transformed into differentWeb service composition languages. Based on the activity models, the gen-eration of executable models using the composition languages BPEL4WSand WorkSCo is described. WorkSCo is part of a framework for realisingworkflows with services.
UML activity diagrams are used as platform independent composition mod-els. The contribution of the authors lies in the special coverage of the Webservices technology. It proposes the integration of WSDL descriptions intoan UML diagram in order to generate the interface description for the result-ing composition, which is also seen as a new service. Most other approachespresume that the WSDL file can or must be – depending on the applica-tion scenario – generated by an UML class diagram in order to complete thecomposition model. Generally, the authors propose to integrate existing Webservices. Thus their WSDL descriptions can be reused.
• B2B Applications in the context of MDA (Bezivin et al. [9]). The work ofBezivin et al. covers the transformation of UML models into two target plat-forms: One is the Microsoft .NET framework and the other is a BPEL4WSexecution environment for Web service compositions. As an intermediatestep for the generation of BPEL4WS descriptions, the output of WSDL isprovided. Further contributions covers the transformation originating fromdifferent PIMs to a Java-based Web service environment without the inter-mediate step of a composition model in BPEL4WS [8]. The research groupof Bezivin et al. have put a special emphasis on the development of a ded-icated transformation language that they name Atlas Transformation Lan-
157

7.2. Model-Driven Development of Service Compositions
guage (ATL, [7]). The language allows definitions for transformation rulesbetween the abstract elements of a PIM and the abstract elements of a PSM.
• The medini platform (Kath et al. [70]). The foundation of this research ef-fort is the modelling environment named medini. Medini provides a set oftools to establish a tool chain for MDA-based software development. In ad-dition, it features a model repository that stores the software models, whichare seen as an asset of the development process. The tools provide verifica-tion functionality to ensure the consistency of the models at different levelsof abstraction. The medini architecture consists of three tiers: the modellingtools, the model repositories and the transformation tools. To ensure in-teroperability with other development software, the elements of the mediniplatform are designed to conform to the MOF standards for open interfacesand model repositories.
One application of the medini platform is the transformation of EDOC mod-els to PSMs that target a CORBA middleware environment. EDOC standsfor Enterprise Distributed Object Computing and represents a profile for theUML that covers the modelling of distributed enterprise systems. A transfor-mation tool is capable of performing a transformation from EDOC modelsto PSMs suited for the CORBA Component Model (CCM, [97]). Anothertransformation tool covers the generation of interface descriptions of Webservices. In addition to the service interface descriptions, medini also pro-vides support for behaviour models that resemble a process. The behaviourmodels are EDOC choreographies on the PIM-side and BPEL4WS descrip-tions on the PSM-side.
7.2 Model-Driven Development of Service Compositions
The previous sections have explained that the MDA proposal by the OMG andthe related research work provide methods and technologies that cover the specificcharacteristics of developing service compositions. The forthcoming sections willoutline at what point in a model-driven development effort the trading of services,especially the QoS-based selection will take place. The trading identifies servicesin order to integrate them into the composition. As briefly explained in Section 1.1,it covers two main parts: One part represents the functional matchmaking of avail-able candidate services and the other facilitates a selection among potential servicecandidates in order to optimise the resulting QoS of the composition.
However, this discussion does not cover the roles, the behaviour and the collab-oration of actors who might participate in such a development process. Thus, thisdiscussion cannot serve as a development methodology. The goal in this discus-sion is to identify at which points the trading and especially the processing of QoSenhances the output of intermediate steps in the development process. Moreover,the upcoming sections will also explain which facilities are required to perform
158

7.2. Model-Driven Development of Service Compositions
the trading and to process QoS information. As explained in the introduction, it isassumed that the retailer of the composition also represents the modeller and thedeveloper of the composition. As introduced in the Section 1.1, he acts also asthe service importer when contacting other service brokers and 3rd party serviceproviders.
3. Trading: Selection 4. Deploying and Publishing
2. Trading: Matchmaking1. Modelling
Composition Model (PIM)with Tasks
Composition Model (PSM) with selected
Services
Export Executable
Specification
Design the Composition
Discovery and Matchmaking
Service Selection
Activity Model Description or Document
Desciption of Candidate Services
Executable Specification, Descriptions
Figure 7.3: Main steps of developing service compositions.
Figure 7.3 outlines the tasks of an abstract development process that consists offour main steps. This figure and all the following use elements related to the flowchart notation: The trapezoid-shaped boxes indicate an activity. Activities candirectly follow each other or have documents (descriptions) or models as an outputor input. Documents are represented by a rectangular box that has a wave-shapedlower bound, and models are represented by ovals. Relations between subsequentactivities, as well as input and output directions, are shown with arrows.
The first step covers the modelling of an abstract composition consisting oftasks. It can be left open whether this model is part of the development or representsan externally provided process model. Besides, it must be noted that the flow ofinformation will not be elaborated in this work because this represents the maincontribution of the research works presented in Section 7.1.1 and in Section 2.4.1.Very briefly, the particular steps are as follows:
• 1. Modelling. As a first step, either the retailer or any other party definesa new service composition by creating a PIM that defines the control flowbetween the tasks. Then, the retailer annotates the tasks with descriptions toidentify the functional requirements. In addition to the functional descrip-tion, the retailer determines the required QoS for each of the identified tasksand for the entire composition. Adding the functional description and defin-
159

7.2. Model-Driven Development of Service Compositions
ing the QoS requirements can be done in parallel since they do not dependon each other. The outcome of the first step is an abstract composition model(a PIM) that contains all the required information for the discovery and se-lection of services.
• 2. Trading: matchmaking of functionality. The second step covers thefirst part of the trading, which is the discovery of suitable services. This partof trading is usually based on matchmaking between the functional descrip-tions of services and the functional requirements. MDA techniques trans-formed the interface descriptions from the model and the task annotationsinto a textual description. This description can serve as an input for an auto-mated search and matchmaking process evaluating services offered by otherretailers or service brokers. The outcome of this step is a list of candidateservices for each task.
• 3. Trading: QoS-based selection. In this step, the set of candidate servicesundergo a selection, which is based on the QoS requirements. This repre-sents the second part of trading. QoS requirements can be used in two ways:Either requirements can represent a global constraint that the resulting com-position must meet or QoS categories can be used as optimisation criteria.The QoS-based selection will result in a ranked list of candidates for eachtask. Then, the retailer can choose a concrete service for each task and addsthe corresponding description to a new software model. The resulting modelis a PSM. Depending on the anticipated level of detail, this description caninclude interface descriptions, functional descriptions as well as QoS state-ments.
• 4. Assembly, deployment and publishing. In the fourth and last step, thePSM is used to generate different descriptions: a) a document describingthe interface to advertise the composition for future trading processes, b)an executable flow description to deploy the composition in an executionenvironment and c) a description defining the offered QoS of the entire com-position.
7.2.1 Modelling the Composition
The goal of the first step is to provide the necessary information for the subsequenttrading processes. This means that the modeller defines the requirements resultingfrom the needed tasks. Based on these requirements, services must be found thatfulfil them. A detailed model of the first step is given in Figure 7.4. The develop-ment starts with an abstract model of the business process. Chapter 2 has alreadydiscussed possible languages for this purpose. Depending on the organisationalcircumstances, either the modeller of the composition performs the modelling oran existing business process model is taken as the basis of the composition model.In the Web service domain, the case is possible that a modeller receives a model
160

7.2. Model-Driven Development of Service Compositions
expressed in the EPC notation of a business process. Then, based on the EPC de-scription, an UML activity diagram must be created to continue the development inthe MDA environment. Depending on the available facilities, the modeller can takeadvantage of existing transformations. Such transformations convert the existingmodel into a new one using a modelling language of the development environment(cf. Kath et al. [70]).
Importing Relevant Domain Models
Designing the Composition
Modelling Functional
Requirements
Determining relevant QoS Categories
Compoposition Model (PIM x)
Modelling QoS Requirements
Activity Model
Compoposition Model (PIM y)
Merge Models(optionally)
Compoposition Model (PIM z)
Business Process Model (optional input)
Figure 7.4: First step: modelling the composition.
To deliver the requirement descriptions for the trading, the existing model mustbe enhanced. Depending on the kind of requirements, this can cover the functionaldescriptions of the tasks or statements about the required QoS. The functional de-scription can include a description of the interface or a description of the behaviourof the service. The state-of-the-art focuses on the interface description where twomain approaches exists: In one approach, the interface is described on a syntacticlevel and in the other description of the semantics of the service elements can alsobe used for this purpose. Examples for a syntactic description are interface de-scriptions using the WSDL for Web services or the Interface Definition Language(IDL) in a CORBA environment.
The general problem with interface descriptions is that labels and data typesused do not provide an unambiguous definition of the interpretation of these el-ements. To make such implicit information explicit, the common approach is toprovide a semantic description of the service. A semantic description means thatthe described elements are linked to concepts that have a defined interpretation.Such a set of interpretations is named ontology; this ontology is subsumed by theconcept of the domain model on top of the PIM in a MDA as presented in Sec-tion 7.1. Then, adding such a description provides a more precise definition ofthe task or service. This represents the main motivation for expressing the desiredfunctionality with a semantic description.
To create a semantic description of the interfaces, the designer must first iden-
161

7.2. Model-Driven Development of Service Compositions
tify appropriate ontologies (domain models) that provide a definition of the con-cepts required to describe the service semantically. In the domain of Web services,such domain models are usually represented in textual descriptions using ontol-ogy languages, e.g. the Web Ontology Language (OWL, [89]). In the case thatthe MDA environment does not directly support the used language of the domainmodel, automated transformations can help to convert these into the required rep-resentation. In order to apply this technique to develop compositions of Web ser-vices, Djuric has the corresponding transformation methods for importing OWLontologies into UML models [24].
A basic solution for the semantic description of the behaviour is the referenceto a service type. Such a service type can be referenced to a standardised tax-onomies of services. As an example, the United Nations Standard Products andServices Code (UNSPSC, [110]) provides such a directory. Using this directory,the modeller describes a service with an unambiguous key that refers to an abstractservice functionality. More sophisticated approaches aim at describing conditionsthat must hold before, during, and after the invocation of the service. Sycara etal. have discussed the matchmaking of services involving statements about condi-tions [125]. Other research efforts have discussed the required interaction wheninvoking interface. The approach is to model patterns of interaction with processalgebra or state machines. Then, a matchmaking between the patterns of offeredservices and the patterns of requested services can identify a compatibility on thelevel of possible interactions (cf. Bordeaux et al. [82], and Wombacher et al. [152]).
Besides domain models and the modelling facilities an MDA environmentmight provide, some dedicated proposals exist for the semantic descriptions. Thecurrently most popular are OWL Services (OWL-S, [130]), the Web Service Mod-elling Ontology (WSMO, [32]) and the semantic extension to Web service interfacedefinitions (WSDL-S, [119]). All these proposals involve Web service standards asthis represents the currently most popular implementation of an SOA. In the recentpast, a unification effort has started and an interest group at the W3C discussesthe three proposals.2 The advantage for the modeller of the composition is thatthese semantic description languages cover the specific characteristics of a service.The UML for example, is intended for the general design of software systems andthus, less suitable for modelling the semantics of a service. Moreover, researchwork about existing trading facilities, which will be introduced in the next section,is also based on these three proposals. However, using these languages results inadditional effort regarding their integration in an MDA environment. Either trans-formations must exist to import and export the dedicated semantic description ofservices [41] or specific modelling tools must be integrated into the MDA environ-ment.
In addition to the interface description, the modeller must determine the re-quirements on the QoS. The process begins with the selection of the relevant QoS
2This is the Semantic Web Services Interest Group hosted by the W3C. This group has the primarygoal to share findings and activities about semantic description of Web services [12].
162

7.2. Model-Driven Development of Service Compositions
characteristics. This depends on the nature of the given requirements as well aswhich characteristics are supported by trading facilities and the service providers.As Chapter 3 has explained, the modeller can query other retailers and brokers inorder to identify the characteristics that can be used to specify the requirements.An additional problem is the definition of the measures; one approach is to refer toa commonly agreed definition of the relevant QoS characteristics, for example aspublished by standard bodies. This particular issue has been discussed in Chapter 3and was also mentioned as one of the prerequisites to perform the aggregation inthe beginning of Chapter 4.
Currently, there is no de-facto standard present for representing QoS charac-teristics in the Web service domain as well as in other component middleware.When using UML in an MDA-based environment, the representation of QoS re-quirements in the model can follow the UML QoS-Profile [99]. This UML profiledefines a set of QoS categories with their interpretation and their notation. It al-lows the modeller to express QoS statements as annotations in UML models. SinceUML is a graphical language, the UML QoS-Profile represents a preferred choicefor use in a MDA environment (cf. Grønmo and Jaeger [39]).
Figure 7.5 summarises the considered aspects of service description in a simplehierarchy. The basic separation identifies a functional and a non-functional part. Inthe field of non-functional descriptions, this hierarchy distinguishes between QoSand non-QoS. For non-QoS characteristics different definitions exist; for this work,it is assumed that they do not represent numeric measures, such as the country fromwhere the service is provided (cf. the beginning of Chapter 3). The functional parthas two main sub-parts, one covers the behaviour and another the interface.
The outcome is a composition model that contains all the needed semantic andsyntactic description of the interface for performing service discovery. Thus, itprovides the necessary information for the next step. An additional outcome isa model that covers also QoS requirements. This represents the required inputfor the third step in the development, the selection of services. Optionally, thesetwo aspects can merge into one model. However, this represents a methodologicalconsideration that is not the focus of this discussion. Besides, it is open whetherthe requirements are expressed in a graphical model or in a textual description.Since the MDA anticipates the use of transformations to convert between both, itis presumed that the graphical representation provided by an MDA environmentrepresents the preferred interface for the composition modeller.
7.2.2 Trading: Matchmaking
The second step covers the discovery of services. The discovery of services is atrading process that preceeds the selection of services. The discovery has the goalto identify services that meet the functional demands. The idea is to deliver a set ofservices that would generally fulfil the desired task regardless of any non-functionalpreference. The identification process is based on matchmaking descriptions of in-terface and service functionality. To perform the matchmaking, it is assumed that a
163

7.2. Model-Driven Development of Service Compositions
Service Description
Functional
Non-Functional
Interface
Behaviour
QoS
Non-QoS
Syntactic
Semantic
e.g. service category
e.g. cost,execution time
e.g. security,country
e.g. data types
e.g. interpre-tation of inputs
Categorisation
Conditions and Effects
e.g. rule-based expressions
Figure 7.5: Proposed taxonomy of service descriptions.
service broker has access to the syntactic and optionally to the semantic descriptionof the service and its elements. The necessary description can be derived from themodel that the previous step has produced. Grønmo et al. have presented transfor-mations from composition models into a semantic description language for Webservices [41]. The authors explain how semantic service descriptions modelled inan UML model can be extracted to generate a description document compliant toOWL-S in order to discover Web services.
The generated documents represent semantic descriptions of requested tasksfor which candidate services must be identified. The subsequent discovery processinvolves querying brokers to identify these candidates. For this step, syntacticand semantic interface descriptions are used. A matchmaking process comparesthe interface signature between the required tasks and available candidates. Asmentioned in the previous section, such a description does not sufficiently describethe functionality. In any case, matchmaking must consider the syntactic (interface)description. If a service does not match the required interface on the syntacticlevel, it would be regarded as incompatible anyway. Thus, the matchmaking ofthe semantic description represents always an addition to the matchmaking of thesyntactic description.
The goal of the semantic matchmaking is to identify the relation between arequested and an offered entity, which are described by concepts defined in anontology. A matchmaking process can identify three main relations between theconcept representing the required entity and the concept representing the offeredentity (cf. Jaeger et al. [65, 66]):
• No Match. The matchmaking process cannot identify any relation betweenboth concepts. This can have many reasons. Most likely the two concepts
164

7.2. Model-Driven Development of Service Compositions
are indeed different. Another problem that is inherent to the matching is thatthe ontology used by one semantic description does show any relation to theontology used by the other. In this case, the two concepts could match inreality. However, a match cannot be determined by the software.
• One Concept Subsumes the Other. If one concept subsumes the other, thematchmaking process has identified that one concept denotes a more generalentity than the other does. This is similar to what can be found in objecthierarchies of object oriented programming languages: From two classes,one can represent a super-class of the other representing a more general type.
Since most services are implemented by using object-oriented programminglanguages, previous research work has explained that the general subsump-tion relation must consider the direction of the subsumption relation betweenservice importer and exporter [65]: For the syntactic convention in program-ming languages, the contravariance must hold. In common object-orientedprogramming languages, the sub-class relation represents a contravariancebecause a subclass provides all characteristics of its super-class plus addi-tional one.
Ensuring the contravariance means that an interface is defined to expect atype that shows all needed characteristics for the operation, even if the ser-vice importer invokes the service with a more special type. This directionis applied vice versa to the returned types: The service exporter can returna type that shows the same characteristics as required by the importer re-quires or a more special one. This ensures that the returned type providesall required characteristics and does not violate any requirements. Other re-search work has also discussed that with reverse subsumption relations, amatched service could still be used. In this case, the partially matched ser-vices can be used with additional services that together ensure that the givenfunctional requirements are met (cf. the plug-in case described by Li andHorrocks [81]).
• Match. The matchmaking process identifies that the concept representingthe offered entity is equivalent with the concept representing the requiredentity. Of course, this represents the desired result of a matchmaking pro-cess.
In the field of Web services, available proposals cover the mentioned descrip-tion languages OWL-S, WSMO and WSDL-S. For the OWL-S language, severalworks have introduced matchmaking algorithms [66, 65, 81, 106], as well as exten-sions to trading infrastructure namely the UDDI discovery services [1, 103, 124].Mainly these works focus on the semantic description of the parameter types andmatching service categories (i.e. WSDL-S), while the semantic description of theservice behaviour is partially covered by expressing conditions based on rule ex-pressions (in OWL-S and WSMO).
165

7.2. Model-Driven Development of Service Compositions
Search and Matchmaking
Description of matched Services
Manual Investigation
Description of Service
Candidates
Activity Description/Document
Semantic Descriptions
of Tasks
Figure 7.6: Second step: matchmaking.
However, if a matchmaking algorithm identifies clear matches for all the as-pects, a seamless interoperation of the involved candidates cannot be guaranteed.To cope with this issue, further reasoning is necessary. The matchmaking of syntac-tic and semantic interface descriptions will improve the precision of the discovery,but it will not remove the need for manual investigation of the discovered servicesto assure the compatibility. Otherwise, the accurate interoperation of the servicein the composition cannot be guaranteed. Figure 7.6 summarises this step: Basedon the semantic descriptions of the required tasks, a matchmaking process triesto identify service candidates. The state of the research shows that these servicecandidates must undergo an additional review in order to ensure their functionalsuitability. The anticipated outcome of this step is at least one service candidateper task.
7.2.3 Trading: Quality-of-Service-based Selection of Candidates
In this step, the selection of the services takes place; the goal of this step is toidentify the best selection among the candidate services for the tasks of the compo-sition with respect to selection criteria. This work considers the QoS as selectioncriteria. Because this step represents the main topic of this work, it was coveredin the previous chapters. This section will just discuss the basic activities of thisdevelopment step, as outlined in Figure 7.7.
Based on the identified set of candidates from the previous step, the QoS ofthe candidates must be processed. Either the QoS of each candidate is part of theavailable descriptions, or the QoS must be retrieved from the service providers.Depending on what has been defined in the first step, the QoS requirements candeal with two aspects which were also parts of the problem model for the QoS-based selection: constraints and optimisation goals. A constraint requirement can,for example, cover statements like the maximum response time of the entire com-position. The other aspect covers optimisation criteria. An example is to reducethe amount of resources for executing the composition.
The selection process determines the best possible selection of services de-pending on the requirements and the offered QoS of the considered candidates.The simplest approach that was discussed in this thesis for performing the selection
166

7.2. Model-Driven Development of Service Compositions
Composition Model (PSM) with Selected Services
Import QoS and Description of Selected Serv
Retrieve QoS offered
Description of Selected Services
Sets of appr. Services with Offered QoS
Description of Candidate Services
Activity Model Description/Document
QoS Req. of Abstract
Composition
QoS-based Selection
Figure 7.7: Third step: QoS-based selection of candidates.
operates on a local perspective: Such an algorithm selects a candidate by compar-ing the QoS among all candidates for a particular task and chooses the candidatethat provides the best QoS. This case represents the state-of-the-art of availablebroker implementations and trading functionality. The previous chapters have alsoexplained that a better QoS is obtained with an algorithm that considers the entirecomposition or sub-parts of the composition, rather than optimising the QoS foreach task in isolation. Thus, the QoS-based selection takes place at this stage inthe development process.
After the QoS-based selection has been performed, the modeller can add theQoS of the selected services to form a new version of the model – a platform-specific model of the composition. Based on the QoS of the individual services, analgorithm can compute a resulting QoS statement for the composition by using theaggregation method that was introduced in Chapter 4. The selection process mightnot only choose the optimal service among the candidates, it can also determinethe ranking of the available candidates based on the relevant criteria. Dependingon the return policies, the process can result in more than one ranked service foreach task. Choosing more than one service for each task could increase the relia-bility of service executions by providing a redundant arrangement (cf. Jaeger andLadner [58, 59]). The outcome of this step is the generated platform-specific modelinvolving the chosen services. This model can be enhanced by importing the of-fered QoS values of each chosen service and the aggregated QoS for the resultingcomposition.
7.2.4 Advertisement and Deployment
The fourth step builds upon the output of the previous phases, which are the as-signment of at least one service to the tasks, their semantic description and theQoS resulting from the assignment. The modeller can import all information for
167

7.2. Model-Driven Development of Service Compositions
DeployComposed
Service
QoS Offeredof Composition
Executable Specification of
Composition
Create Executable Specification
of Composition
Create Interface Description of Composition
Interface Description of Composition
Create QoS Offered of
Composition
Create Semantic Description of Composition
Semantic Description of Composition
Activity Model Description/Document
Composition Model (PSM) with Selected Services
Service Brokers(optionally with
Interface, Semantic, QoS Descriptions)
Figure 7.8: Fourth step: advertisement and deployment.
the particular models onto one unifying model by using software transformations.This step has the goal to create the necessary information to advertise the compo-sition as a new service. Another goal is to generate an executable specification inorder to perform the composition.
Figure 7.8 outlines the general activities of this step: Based on the exist-ing PSM and optional additional descriptions, four main descriptions are created.Since they do not depend on each other, these activities can be performed in arbi-trary order or in parallel. These descriptions are the following:
• Interface Description. Based on the design of the composition, the overallinput and output parameters can be defined and exported. If the interfacedescription uses a standardised description format, the composition can beadvertised and executed as a service for the consumers. In the field of Webservices this would also cover a WSDL description. An example for theMDA-based generation of WSDL files from service compositions has beenintroduced by Grønmo et al. [42].
• QoS Description. The previous step has already mentioned that, based onthe QoS of the involved services, the QoS of the overall composition can beaggregated. Such a description can use the same languages which the 3rdparty providers use for their service advertisements.
• Semantic Description. A semantic description of the service interface canbe derived from the semantic descriptions of each task as created in the
168

7.2. Model-Driven Development of Service Compositions
first step of the development. The part that covers the behaviour of the ser-vice must involve additional modelling because the composition represents afunctionality that was not available before. Thus, this part cannot be derivedfrom the description of the involved services.
Regarding the semantic description of the interfaces, Grønmo et al. havealready discussed an approach based on transformations between UML andOWL Services [41].
• Executable Specification. Automated transformations can create an exe-cutable specification from the control specification expressed in the PSM.Runtime environments can use this executable specification to invoke theavailable services in the defined order. Such a specification could use WS-BPEL or BEPL4WS in order to define compositions of Web services. Kath etal. [70] and Skogan et al. [120] have explained the generation of BPEL4WSdescriptions to execute compositions of Web services. Examples of run-time environments that are capable of BPEL4WS are the IBM WebSphereServer [85] or the Oracle BPEL Server [117].
Finally, the composed service composition can be deployed and published. Thegenerated descriptions can be passed to service brokers in order to advertise theservice. At the end, the retailer can offer the service ready for the invocation byconsumers.
7.2.5 Development as an Iterative Process
Like other design and creation processes in the engineering and computer sciences,the creation of the composition is an iterative and heuristic process that assumes theability to go back and forth to the different activities. The heuristic nature is as suchthat by undergoing these procedures in iterations, the result becomes better witheach iteration. Different reasons exists for why the development process requiresan iterative procedure, among them are the following:
• No matched services. It can happen that the matchmaking process does notidentify suitable service candidates. In this case, the retailer has two options:The development process can be interrupted and the required service can beimplemented. Alternatively, he can modify the composition design in orderto adapt the required services to the available services that were previouslyexcluded. Then, the modeller must redesign the composition.
• Discovery as inspiration. During the matchmaking and reengineering pro-cess, the retailer can discover that his abstract composition is not the optimaldesign. Most likely, the retailer can experience this situation during the as-sessment of suitable service candidates. For example, a new kind of servicemight inspire the composition modeller to restructure the existing tasks ofthe composition. Then, the development starts over with the redesign of thecomposition as well.
169

7.2. Model-Driven Development of Service Compositions
• Too restrictive QoS. The selection can reveal that the matched candidatescannot satisfy the requested QoS. Alternatively, some of the selected candi-dates do not provide any statements about the considered QoS characteris-tics. In both cases, the result is that no services that meet the QoS require-ments are available. In the first case, the retailer needs to adjust the state-ment of the corresponding QoS characteristic, if loosening the requirementsis possible. Then, the selection process can be performed again among thecandidate services. If the retailer cannot weaken the requirements or aban-don any QoS characteristic, the situation is similar to the first point: Either anew service is created or the functionality of the tasks is adapted.
• Too many candidates. Contrary to the previous scenarios, the selectionprocess might reveal that too many services meet the QoS requirements. Ofcourse, this case does not represent a problem. However, the retailer can takethis as an opportunity to improve the QoS. Obviously, the candidate serviceswould allow even stronger requirements and a better QoS can be achieved.The retailer can perform the activities of the first step again to re-define theQoS requirements. Then, the retailer can repeat the selection of the thirdstep.
The above-mentioned issues occur during the development of the composi-tion. Monitoring and analysing the composition during the run-time can also leadfurther iterations of the development process. At run-time, a composition can bemonitored to measure the resulting QoS. The QoS at run-time can differ from theadvertised QoS. Thus, the retailer might consider measuring the execution withrespect to the relevant QoS criteria. The goal of such an analysis is to identifypotential weak or critical services in the composition. The retailer has three mainoptions when a weak or critical service is revealed:
• Replacing. He can replace the particular service with other identified candi-dates that were ranked lower than the chosen service. However, the servicewas originally sorted out by a selection process. Consequently, this modifi-cation results in a worse QoS prediction for the composition.
• Acquiring new services. As an alternative, the discovery must be repeatedand the “bad” service must be excluded. The modeller can perform a newattempt a new service discovery to find services that were previously notavailable.
• Redesigning the composition. Like for the iteration in the developmentprocess, the modeller can try to redesign or rearrange the required function-ality to avoid the problem of insufficient QoS. In this case, a new iteration ofthe development process is started.
The retailer will continuously need to optimise the composition in order toapproach the optimal setup. One reason is the general volatility of the QoS, which
170

7.2. Model-Driven Development of Service Compositions
is a characteristic of distributed systems. Another reason is that new services willappear, as well as other services will disappear. To guarantee a constant QoS levelof the entire composition, a new selection must take place when the QoS of theinvolved services changes. To ensure that new, possibly QoS-improving servicesare utilised, the process steps from performing the discovery can be repeated at aregular basis. Figure 7.9 outlines the relations of the main steps with the run-timepart. In this figure, the activity with the grey border represents the selection. Thediagram shows that the selection is performed each time the set of involved servicesor their QoS has changed. A repeated selection always requires the activities of thefourth step.
4: Deploying and Publishing
2: Trading: Matchmaking
1: Modelling
No ServicesFound
Inspiration
Too RestrictiveQoS Constraints
Too ManyCandidates
Critical Service /Possible ImprovementsIdentified
Regular Updateof Available Services
Service withWeak QoS Identifed
Runtime: Monitoring
3: Trading: Selection
Figure 7.9: The iterative development process.
171

7.2. Model-Driven Development of Service Compositions
172

Chapter 8
Conclusions
The application of heuristic algorithms to the problem of the QoS-based selectionwhen forming service compositions was explained and analysed. In addition, theimplementation of a simulation in order to analyse the performance of the con-sidered algorithms was presented. The results from conducted simulations allowquantitative statements about the feasibility of the heuristic algorithms when com-pared to algorithms that guarantee to solve the problem in an optimal way.
The concept of QoS as preference criteria for the service selection covers manyaspects. The definition from the ISO 9004 standard [127] on services and qualityallows many possible application scenarios. To sharpen the focus of this work, thescenario of realising business processes was presented as the main application case.The motivation for this application case lies in the presented commonalities of busi-ness processes with the characteristics of service compositions (cf. Section 2.4).
The application scenario influenced the direction of the discussion on QoS indistributed systems (cf. Chapter 3). Thus, also particular QoS issues in the fieldof SOAs and Web services were presented. For the subsequent QoS-aggregation,existing research works on QoS issues in these fields were also assessed. Then, auniform approach for aggregating the QoS was defined and explained for process-ing the QoS of individual services in compositions. The approach presumes thatthe composition can be described by using a specific structural model. Based onthe structural model and the corresponding aggregation rules, the presented methodcan determine the resulting QoS of service compositions. This functionality repre-sents the foundation for the QoS-based selection of service candidates.
After this first part, which presented the necessary foundations, an analysis ofthe QoS-based selection problem was given which resulted in a problem model.This model enabled an analysis on the relations to other combinatorial problems.The considered problems were the multiple choice knapsack problem, the resource-constrained project scheduling problem, the QoS-based query planning for queriesto database systems, and the QoS-based routing in computer networks. In addi-tion, the problem model served also as the foundation for a discussion about thehardness of the QoS-based selection problem. It was shown that the presented
173
problem model for the QoS-based selection describes a problem that is NP -hard.The NP -hardness is shown by reducing the multiple choice knapsack problem tothe selection problem (cf. Section 5.3.5). In addition, the comparison with theMCKP has revealed that the approaches as presented in the related work based onthe MCKP do not cover all aspects of the QoS-based selection problem.
This represents the motivation to evaluate heuristic algorithms for the selectionproblem as an alternative to algorithms that guarantee to find the optimal solution.A selection of heuristic algorithms was explained and their advantages and disad-vantages were discussed. To provide quantitative results, an evaluation of theseheuristics was also presented (cf. Chapter 6). The evaluation was performed bysoftware that simulates the application of these heuristics on randomly generatedproblem instances. The goal of the simulation was to capture two aspects of the per-formance of the heuristics: Their QoS performance and their computational timeperformance. Based on the quantitative results, also the weaknesses and strengthsof the heuristics were revealed and discussed. In summary, the evaluation revealedthe following insights about the heuristic algorithms:
• The discarding heuristic showed an unattractive consumption of the compu-tation time under real-world conditions. This shows that a branch-and-boundstrategy is not able to efficiently save computational efforts. However, thisapproach results in the almost optimal QoS for the composition.
• The bottomup heuristic required very few computational efforts. However,the resulting QoS reaches only 1/3 to 1/2 of the best QoS possible in thedifferent simulation campaigns. Thus, its application must take a clear QoSpenalty into account.
• The local heuristic, which implemented a greedy strategy to solve the givenproblem, resulted in very attractive QoS (about 4/5 of the optimal) whilerequiring low computational efforts. However, it is not able to consider con-straints. Moreover, it showed weaknesses for problem instances with verydiverse QoS offers.
• The pattern-based heuristic showed a QoS performance between the localand discarding heuristic. However, it scales unattractive with larger probleminstances under real-world conditions. Although, it consumes only a fractionof computation time when compared to the discarding method, it requiresunattractive computation times for problem instances with a larger numberof candidates or tasks.
The presentation about the abstract development process at the end has clarifiedthe role of the QoS-based selection when creating compositions of services. By ex-plaining this development process it was made clear at which points in the processthe QoS-based selection must take place. Moreover, the development process hasalso explained the motivation for the following preconditions for the QoS-basedselection:
174

8.1. Summary of Main Contributions
• Functional compatibility. For the application of the QoS-based selection,the considered candidates have been proven functionally compatible to thetasks. Besides the practical benefit of this step, the advantage is that sortingout service candidates in advance results in fewer candidates to evaluate.
• Uniformity of QoS characteristics. The other main presumption is the uni-formity of the QoS characteristics: The retailer who performs the selectionprocess must have the same understanding of the considered QoS character-istics as the service providers who offer their candidates with QoS promises.Chapter 3 has also discussed related research work that considers this prob-lem. Since the focus of this thesis lies on the combinatorial aspect of theproblem, the QoS uniformity among the involved parties was not further dis-cussed.
8.1 Summary of Main Contributions
The previous section has summarised the main contribution of this work which isthe discussion and evaluation of the heuristic algorithms. Thus, it directly cov-ers the problem statement given in the first chapter. Besides the evaluation re-sults about the heuristic approaches, the following scientific contributions werepresented:
• Assessment about the QoS in service compositions. The first part of thisthesis has provided a survey about the existing research work and clarifiedrelevant QoS concepts for the use in service compositions. The outcomeis an assessment about relevant QoS characteristics, as given in Section 3and an assessment about the resulting value dimensions when the relevantcharacteristics are applied in the field of services and service compositionsto determine the simulation parameters (cf. Section 6.3.1).
Moreover, Chapter 7 has explained the issues of aggregating QoS and per-forming the QoS-based selection in a development process for building ser-vice compositions.
• An aggregation model. The next contribution is a structural model an amethod that enables the aggregation of QoS in service compositions, basedon the QoS of individual tasks or candidates. Besides the application ofthis model to perform the QoS-based selection, this approach has been alsoapplied in related work about improving the QoS by applying redundant ser-vices structures [58, 59]. The proposed approach presumes that the compo-sition can be expressed by using this structural model. This thesis has dis-cussed the expressiveness and limitation of this structural model. Based onan analysis of the identified limitations, the application of existing transfor-mations (cf. Kiepuszewski et al. [73]) was proposed to cover not conformingcompositions with this structural model.
175

8.2. Outlook and Future Work
• The problem model. Besides the structural model to perform the aggre-gation, another model describes the selection problem itself. The problemmodel uses the structural model of the aggregation method to describe thestructure of the occurring problem instances. In addition, the rules of the ag-gregation model were used to derive statements that express constraints andoptimisation goals.
The problem model provides the foundation for three aspects: 1) a clarifi-cation of the characteristics of the problem and its relation to existing prob-lem models, 2) a discussion about the effort to solve the problem and 3) ablueprint for the implementation of the simulation in order to achieve thequantitative results.
• Development of the simulation. The presented performance evaluation re-quired the implementation of a simulation. Existing works about QoS in ser-vice compositions were assessed in order to determine the parameterisationof the setup. The results from performed simulations made clear that a vari-ation of different parameters results also in a variation of the performance.Thus, the assessment of existing work was necessary to deliver a realisticsimulation setup that would result in realistic performance evaluations.
The structural model and the problem model were also the foundation for theanalysis about the related work in the field of QoS aggregation (cf. Section 4.6) andin the field of QoS-based selection (cf. Section 5.1). The problem model servedas a reference to show the differences to existing related work about the QoS-based selection that has considered the multiple choice knapsack problem as theappropriate problem model.
8.2 Outlook and Future Work
Because the definition of services and their composition by the ISO 9000 and 9004standards [128, 127] is considered for this work, the discussed combinatorial prob-lem can be applied outside an SOA and Web service infrastructures as well. Thegiven discussion can be transferred to other domains. A possible application wouldbe the production of goods where a product is comprised of different sub-productsand services of different suppliers. For example, the production of a car representssuch a scenario. The involved sub-products and services are applied in a certainorder, and require a time to perform. Products cost a particular amount of moneyand everything operates at a certain level of reliability. The optimisation of quan-tifiable measures as presented in this work is also relevant for other domains whichhave the goal to implement a process.
Besides other potential applications of QoS-based selection in the industry,the simulations have shown in general that the optimisation of the QoS providessignificant advantages in terms of cost, response time, and availability: The eval-uation of the (QoS-ignoring) random and global selection methods have resulted
176

8.2. Outlook and Future Work
in quantitative statements about the improvements when the QoS is optimised. Allconsidered measures represent relevant objectives for optimisation in today’s ITinfrastructures when it comes to saving money and efforts (or the amount of work)and to provide systems that are more reliable.
This work has also mentioned that QoS-aware development tools are currentlynot widely used. Besides research prototype work (for example, presented byGrønmo and Jaeger [39]), no commercial product was identified that provides thesupport for the QoS of services when developing service compositions. The imple-mented simulator represents a solution that has proven to be capable of processingthe QoS of service candidates, performing the aggregation and has demonstratedthe application of different selection algorithms. This implementation serves asproof of concept for the proposed QoS-based selection. It can be further devel-oped for the integration into software packages to create service compositions inthe sense of the SOA. This thesis proposes how the discussed approaches find theirway into software products, service brokers or development environments in orderto create compositions as discussed in Chapter 7.
Besides the application in the software industry, the main contributions of thisthesis also enable different opportunities for further research work. Possible areasof further research based on this work are:
• Developing more heuristics. Along with the given analysis of the fourheuristics, a combined heuristic approach can be derived from further re-search in the field of related combinatorial problems. The result could bea hybrid approach as mentioned in Section 6.5. For example, the QoS per-formance of the pattern selection can be combined with the computationalperformance of the local selection by applying the local selection for the rarecases that pose difficulties to the pattern selection.
• Designing campaigns. Besides the evaluation of additional heuristics, dif-ferent simulation campaigns can be also considered in order to explore moreaspects of the heuristics. For example, a different setup could vary how manytasks a structural element contains on average.
• Other approaches. Besides the heuristics, another research opportunitywould be the creation of an algorithm that derives the appropriate set of inte-ger programming formulations according to a given instance of the selectionproblem. Such an algorithm could be based on defined transformations thattransform each pair of QoS characteristic and composition pattern into a cor-responding formula. Then, software tools for integer programming solvingcould be applied and the performance of such an approach can be comparedwith the performance of the heuristics.
• Optimisation Prediction. Based on the simulation results and the problemmodel, a functionality can be established that predicts the optimisation po-tential of a given composition setup. The goal of this function is to quickly
177

8.2. Outlook and Future Work
predict the QoS optimisation potential. Based on this prediction, a QoS-based broker can decide whether to run a time-consuming selection algo-rithm or to prefer a heuristic algorithm.
178

Appendix A
Specification of theHard- and Software Platform
The entire simulation presented in this work was performed on standard PC hard-ware running a Microsoft Windows 2000 operating system. Table A.1 lists thedetailed specifications of the computer.
CPU Intel Pentium IV CPU2.4GHz, 512KB level-2 cache, 533MHz FSB(family 15, model 2, stepping 9)
Hardware Intel i865 chipset with integrated graphics controller512 MB DDR333 main memory, 40GB hard disk
OS Microsoft Windows 2000(version 5.0.2195, service pack 4, build 2195)performance setting “optimised for applications”
Java VM Sun’s Java HotSpot Client VM 1.5.0 06-b05default settings (i.e. for heap sizes)
Table A.1: Specification of the host system.
Apart from the technical specifications, the performance of the simulation hostplatform is also interesting in order to compare the results with future or externalresearch. An official Java benchmark does not exist. However, different (research)groups have developed and published software that performs typical scientific cal-culations and captures the computational performance.
Among these efforts, “SciMark 2.0” has been chosen to measure the perfor-mance of the computer used for the simulation runs. SciMark was developed byRoldan Pozo, and Bruce Miller at the National Institute of Standards and Tech-nology (NIST). The software is freely available at http://math.nist.gov/scimark2/.Running the benchmark tool in the command line of the host system resulted in thefollowing output:
179

SciMark 2.0aComposite Score: 187.41090663144433FFT (1024): 83.56844871970135SOR (100x100): 322.88120458089793Monte Carlo : 24.54603686755795Sparse matmult (N=1000, nz=5000): 127.85017738323931LU (100x100): 378.20866560582505java.vendor: Sun Microsystems Inc.java.version: 1.5.0_06os.arch: x86os.name: Windows 2000os.version: 5.0
The captured composite score of 187 compares well with the given results fromother computers available on the home page of SciMark: Different other PentiumIV-based machines at 2.4Ghz clock rate resulted in the score of 187 as well.
180

Appendix B
List of Abbreviations
BPEL4WS Business Process Execution Language for Web ServicesBPMI Business Process Management InitiativeBPML Business Process Modelling LanguageBPMN Business Process Modelling NotationBPSS Business Process Specification SchemaCPA Collaboration Protocol AgreementCPP Collaboration Protocol ProfileCPU Central Processing UnitCORBA Common Object Request Broker ArchitectureCCM CORBA Component ModelebXML Electronic Business using eXtensible Markup LanguageEDOC Enterprise Distributed Object ComputingEPC Event-driven Process ChainXML Extensible Markup LanguageHTTP Hypertext Transfer ProtocolIDE Integrated Development EnvironmentIDL Interface Definition LanguageISO International Organization for StandardizationIETF Internet Engineering Task ForceISO-OSI ISO Open System Interconnection ModelJ2SE Java 2 Standard EditionMDA Model-Driven ArchitectureMTBF Mean Time Between FailureMTTT Mean Time to TransitionMOF Meta Object FacilityMCDM Multiple Criteria Decision MakingMCKP Multiple-Choice Knapsack Problem
181

MKP Multiple-Dimension Knapsack ProblemMMKP Multiple-Dimension Multiple-Choice Knapsack ProblemOMG Object Management GroupOASIS Organization for the Advancement of Structured Information StandardsOWL-S OWL ServicesPC Problem CarrierPIM Platform Independent ModelPSM Platform Specific ModelQoS Quality of ServiceRM-ODP Reference Model for Open Distributed ProcessingRCPSP Resource Constrained Project Scheduling ProblemSLA Service Level AgreementSOA Service-Oriented ArchitectureSAW Simple Additive WeightingSWM Structured Workflow ModelTINA Telecommunications Information Networking ArchitectureW3C The World Wide Web ConsortiumTINA-C TINA ConsortiumUML Unified Modelling LanguageUN/CEFACT United Nations Centre for Trade Facilitation and Electronic BusinessUNSPSC United Nations Standard Products and Services CodeUDDI Universal Description, Discovery, and IntegrationOS Operating SystemOWL Web Ontology LanguageVM Virtual MachineWSCI Web Service Choreography InterfaceWSLA Web Service Level Agreement LanguageWSMO Web Service Modelling OntologyWSOI Web Service Offerings InfrastructureWSOL Web Service Offerings LanguageWSDL-S Web Service SemanticsWS-BPEL Web Services Business Process Execution LanguageWS-I Web Services-InteroperabilityWSDL Web Services Description LanguageWSFL Web Services Flow LanguageWfMC Workflow Management CoalitionWorkSCo Workflow with Separation of ConcernsXPDL XML Processing Description LanguageYAWL Yet Another Workflow Language
182

183

184

Bibliography
[1] Rama Akkiraju, Richard Goodwin,Prashant Doshi, and Sascha Roeder. AMethod for Semantically Enhancingthe Service Discovery Capabilities ofUDDI. In Proceedings of the Workshopon Information Integration on the Web,pages 87–92, August 2003.
[2] Ali Shaikh Ali, Omer F. Rana, RashidAl-Ali, and David W. Walker. UDDIe:An Extended Registry for Web Services.In Proceedings of the 2003 Symposiumon Applications and the Internet Work-shops (SAINT’03 Workshops), page 85,Orlando, Florida, USA, January 2003.IEEE Press.
[3] Cristina Aurrecoechea, Andrew T. Camp-bell, and Linda Hauw. ”a survey of qos ar-chitectures”. Multimedia Systems, SpecialSection on Quality of Service Architec-tures for Multimedia Systems, 6(3):138–151, May 1998.
[4] Sean Baker and Simon Dobson. Compar-ing Service-Oriented and Distributed Ob-ject Architectures. In Proceedings of theInternational Symposium on DistributedObjects and Applications (DOA’05), AgiaNapa, Cyprus, November 2005. SpringerPress.
[5] Luciano Baresi, Sam Guinea, and Pier-luigi Plebani. WS-Policy for ServiceMonitoring. In 6th VLDB Workshopon Technologies for E-Services (TES’05),volume LNCS 3811. Springer Press,September 2005.
[6] Boualem Benatallah, Marlon Dumas,Marie-Christine Fauvet, F. A. Rabhi, andQuan Z. Sheng. Overview of SomePatterns for Architecting and ManagingComposite Web Services. In ACM SIGe-com Exchanges, pages 9–16. ACM Press,August 2002.
[7] Jean Bezivin, Gregoire Dupe, FredericJouault, Gilles Pitette, and Jamal EddineRougui. First experiments with the atlmodel transformation language: Trans-forming xslt into xquery. In 2nd OOP-SLA Workshop on Generative Techniquesin the context of Model Driven Architec-ture, Anaheim, California, USA, 2003.
[8] Jean Bezivin, Slimane Hammoudi, Deni-valdo Lopes, and Frederic Jouault. Ap-plying mda approach for web service plat-form. In Proceedings of the Eighth IEEEInternational Enterprise Distributed Ob-ject Computing Conference (EDOC’04),pages 58–70, Monterey, California, USA,September 2004. IEEE Press.
[9] Jean Bezivin, Slimane Hammoudi, Deni-valdo Lopes, and Frederic Jouault. B2BApplications, BPEL4WS, Web Servicesand dotNET in the Context of MDA. InProceedings of the International Confer-ence on Enterprise Integration and Mod-elling Technology (ICEIMT’04), Toronto,Canada, October 2004. Springer Press.
[10] Gregory Alan Bolcer and Gail Kaiser.SWAP: Leveraging the Web to ManageWorkflow. In IEEE Internet Comput-ing, pages 85–88. IEEE Press, January-February 1999.
[11] David Booth, Hugo Haas, Francis Mc-Cabe, Eric Newcomer, Michael Cham-pion, Chris Ferris, and David Or-chard. Web Services Architecture.http://www.w3c.org/TR/ws-arch/, Febru-ary 2004.
[12] Carine Bournez and Hugo Haas. Seman-tic Web Services Interest Group Char-ter. http://www.w3.org/2003/10/swsig-charter, October 2003.
[13] Ilja N. Bronstein, Konstantin A. Se-mendjajew, Gerhard Musiol, and HeinerMuhlig. Taschenbuch der Mathematik.
185

Bibliography
Harri Deutsch Verlag, Frankfurt am Main,Germany, 4. edition, 1999.
[14] David Burdett and Nickolas Kavantzas(Eds.). WS Choreography ModelOverview, W3C Working Draft 24March 2004. Technical report, W3C,http://www.w3.org/TR/ws-chor-model/,2004.
[15] Jorge Cardoso. Quality of Service and Se-mantic Composition of Workflows. PhDthesis, Department of Computer Sci-ence, University of Georgia, Athens, GA(USA), 2002.
[16] Jorge Cardoso, Amit Sheth, and KrysKochut. Implementing QoS Managementfor Workflow Systems. Technical report,LSDIS Lab, Computer Science, Univer-sity of Georgia, Athens, GA – USA, 2002.
[17] Jorge Cardoso, Amit Sheth, and JohnMiller. Workflow Quality of Ser-vice. In Proceedings of Interna-tional Conference on Enterprise Inte-gration and Modeling Technology andInternational Enterprise Modeling Con-ference (ICEIMT/IEMC’02), Valencia,Spain, April 2002. Kluwer AcademicPublishers.
[18] Senthilanand Chandrasekaran, Gregory S.Silver, John A. Miller, Jorge Cardoso,and Amit P. Sheth. XML-based Model-ing and Simulation: Web Service Tech-nologies and their Synergy with Simula-tion. In Jane L. Snowdon and John M.Charnes, editors, Proceedings of the 34thWinter Simulation Conference: Explor-ing New Frontiers, pages 606–615, SanDiego, California, USA, December 2002.ACM Press.
[19] Jonathan Cranford, Ravi Mukkamala, andVijayalakshmi Atluri. Modeling andevaluation of distributed workflow algo-rithms. In Proceedings of the WorldMulticonference on Systemics, Cybernet-ics and Informatics: Information SystemsDevelopment (ISAS-SCI), pages 183–188,Orlando, Florida, USA, July 2001. IIIS.
[20] Eric Crawley, Raj Nair, Bala Rajagopalan,and Hal Sandick. A Framework for QoS-based Routing in the Internet. Informa-tional RFC 2386, Internet EngineeringTask Force (IETF), 1998.
[21] Thomas H. Davenport. Process Inno-vation. Harvard Business School Press,Boston, MA, USA, 1992.
[22] Remco M. Dijkman and Marlon Du-mas. Service-Oriented Design: A Multi-Viewpoint Approach. International Jour-nal of Cooperative Information Systems(IJCIS), 13(4):337–368, 2004.
[23] Edsger W. Dijkstra. Go To StatementConsidered Harmful. Communications ofthe ACM, 11(3):147–148, March 1968.
[24] Dragan Djuric. MDA-based OntologyInfrastructure. Computer Science Infor-mation Systems (ComSIS), 1(1), February2004.
[25] Erdogan Dogdu and Venkata Mamidenna.Efficient Scheduling Strategies for WebServices-based E-Business Transactions.In 6th VLDB Workshop on Technologiesfor E-Services (TES’05), volume LNCS3811, pages 113–125. Springer Press,September 2005.
[26] Krzysztof Dudzinski and StanislawWalukiewicz. Exact Methods for theKnapsack Problem and its Generalisa-tions. European Journal of OperationsResearch, 28(2):3–21, 1987.
[27] Lill Kristiansen (Ed.). TINA-C De-liverable: Service Architecture, Ver-sion 5.0. TINA consortium website:http://www.tinac.com/, June 1997.
[28] Abdelkarim Erradi and Piyush Mahesh-wari. wsBus: QoS-aware Middlewarefor Reliable Web Services Interactions.In Proceedings of the 2005 IEEE Inter-national Conference on e-Technology, e-Commerce and e-Service (EEE’05), pages634–639, Hong Kong, China, March2005. IEEE Press.
[29] Assaf Arkin et al. Business Process Mod-eling Language (BPML). Technical Re-port Version 1.0, BPMI.org, 2002.
[30] Assaf Arkin et al. Web Service Choreog-raphy Interface (WSCI) 1.0. Technical re-port, W3C, http://www.w3.org/TR/wsci,2002.
[31] Tony Andrews et al. Business Process Ex-ecution Language for Web Services Ver-sion 1.1. Technical report, BEA Systems,IBM Corp., Microsoft Corp., http://www-106.ibm.com/developerworks/webser-vices/library/ws-bpel/, 2003.
186

Bibliography
[32] Cristina Feier and John Domingue. D3.1WSMO Primer. WSMO Final Draft,DERI International, April 2005.
[33] Daniela Florescu, Andreas Gruenhagen,and Donald Kossmann. XL: an XMLProgramming Language for Web ServiceSpecification and Composition. In Pro-ceedings of the 11th international con-ference on World Wide Web (WWW’02),pages 65–76. ACM Press, May 2002.
[34] Helmut Frank, Norbert Gronau, and Her-mann Krallman. Systemanalyse im Un-ternehmen. 3. Edition. Oldenbourg Ver-lag, Munchen, Germany, October 2000.
[35] Svend Frølund and Jari Koistinen. Qualityof Service Aware Distributed Object Sys-tems. In Proceedings in 5th USENIX Con-ference on Object-Oriented Technologiesand Systems (COOTS’99), pages 69–84,San Diego, California, USA, May 1999.USENIX.
[36] Dinesh Ganesarajah and Emil Lupu.Workflow-based Composition of Web-services: A Business Model or a Pro-gramming Paradigm? In Proceed-ings of 6th International Enterprise Dis-tributed Object Computing Conference(EDOC’02), pages 273–284, Lausanne,Switzerland, September 2002. IEEE CSPress.
[37] Michael R. Garey and David S. Johnson.Computers and Intractability A Guide tothe Theory of NP-Completeness. W. H.Freeman and Company, New York, NY,USA, 1979.
[38] Michael Gillmann, Gerhard Weikum, andWolfgang Wonner. Workflow Manage-ment with Service Quality Guarantees. InProceedings of the 2002 ACM SIGMODInternational Conference on Managementof Data, pages 228–239, Madison, Wis-consin, USA, June 2002. ACM Press.
[39] Roy Grønmo and Michael C. Jaeger.Model-Driven Methodology for BuildingQoS-Optimised Web Service Composi-tions. In Proceedings of the 5th IFIPInternational Conference on DistributedApplications and Interoperable Systems(DAIS’05), pages 68–82, Athens, Greece,May 2005. Springer Press.
[40] Roy Grønmo and Michael C Jaeger.Model-Driven Semantic Web Service
Composition. In The 12th ASIA-PACIFIC Software Engineering Confer-ence (APSEC’05), pages 79–86, Taipei,Taiwan, December 2005. IEEE CS Press.
[41] Roy Grønmo, Michael C Jaeger, andHjørdis Hoff. Transformations be-tween UML and OWL-S. In Euro-pean Conference on Model Driven Archi-tecture – Foundations and Applications(ECMDA’05), volume 3748 of LNCS,pages 269–283, Nuremberg, Germany,November 2005. Springer Press.
[42] Roy Grønmo, David Skogan, Ida Sol-heim, and Jon Oldevik. Model-DrivenWeb Service Development. Interna-tional Journal of Web Services Research(JWSR), 1(4), Oct-Dec 2004.
[43] Michael Hammer and James Champy.A Manifesto for Business Revolution.Harper Business, 1993.
[44] Thomas Heinis, Cesare Pautasso, andGustavo Alonso. Design and evalua-tion of an autonomic workflow engine.In Proceedings of the Second Interna-tional Conference on Autonomic Com-puting (ICAC’05), pages 27–38, Seat-tle, Washington, USA, June 2005. IEEEPress.
[45] David Hollingsworth. The Workflow Ref-erence Model. Technical Report TC00-1003, Workflow Management Coalition,Lighthouse Point, Florida, USA, 1995.
[46] David Hollingsworth. The Work-flow Reference Model 10 Years On.(extracted from “Workflow Handbook2004”), Workflow Management Coali-tion, Lighthouse Point, Florida, USA,February 2004.
[47] Michael N. Huhns and Munindar P. Singh.Service-oriented computing: Key con-cepts and principles. IEEE InternetComputing, January and February:75–81,2005.
[48] Richard Hull, Michael Benedikt, Vas-silis Christophides, and Jianwan Su. E-Services: A Look Behind the Curtain. InProceedings of the 22nd ACM SIGACT-SIGMOD-SIGART Symposium on Prin-ciples of Database Systems (PODS’03),pages 1–14, San Diego, California, USA,June 2003. ACM Press.
187

Bibliography
[49] Ching-Lai Hwang and K. Paul Yoon, edi-tors. Multiple Attribute Decision Making:Methods and Applications, volume 186 ofLecture Notes in Economics and Mathe-matical Systems. Springer Press, March1981.
[50] ISO/IEC. ITU.TS RecommendationX.902 — ISO/IEC 10746-1: Open Dis-tributed Processing Reference Model -Part 1: Overview, August 1996.
[51] ISO/IEC. ITU.TS RecommendationX.902 — ISO/IEC 10746-2: Open Dis-tributed Processing Reference Model -Part 2: Foundations, August 1996.
[52] ISO/IEC. ISO/ITU-T RecommendationX.641 — ISO/IEC 13236: InformationTechnology - Quality of Service - Frame-work, 1997.
[53] ISO/IEC. ITU.TS RecommendationX.950 — ISO/IEC 13235-1: TradingFunction: Specification, August 1997.
[54] ISO/IEC. CD 15935 Information Tech-nology: Open Distributed Processing -Reference Model - Quality of Service.(CD Ballot), October 1998.
[55] ISO/IEC. ITU-T Recommendation X.641— ISO/IEC 13236: Information Tech-nology - Quality of Service: Framework,1998.
[56] ISO/IEC. ISO/IEC 15909-1: High-levelPetri nets – Part 1: Concepts, Definitionsand Graphical Notation. Published Stan-dard, December 2004.
[57] ITU-T. ITU-T Recommendation X.200— ISO/IEC 7498-1: Open Systems Inter-connection – Basic Reference Model: TheBasic Model, July 1994.
[58] Michael C. Jaeger and Hendrik Lad-ner. Improving the QoS of WS Com-positions based on Redundant Services.In The 2005 International Conferenceon Next Generation Web Services Prac-tices (NWeSP’05), pages 189–194, Seoul,South-Korea, August 2005. IEEE CSPress.
[59] Michael C. Jaeger and Hendrik Ladner.A Model for the Aggregation of QoS inWS Compositions Involving RedundantServices. Journal of Digital InformationManagement, 4(1):44–49, March 2006.
[60] Michael C. Jaeger and Gero Muhl. SoftReal-Time Aspects for Service-OrientedArchitectures. In Proceedings of theIEEE Joint Conference on E-CommerceTechnology (CEC’06) and EnterpriseComputing, E-Commerce and E-Services(EEE’06), pages 22–29, San Francisco,California, USA, June 2006. IEEE Press.
[61] Michael C. Jaeger, Gero Muhl, and Se-bastian Golze. QoS-aware Compositionof Web Services: An Evaluation of Se-lection Algorithms. In Proceedings ofthe Confederated International Confer-ences CoopIS, DOA, and ODBASE 2005(OTM’05), volume 3760 of LNCS, pages646–661, Agia Napa, Cyprus, November2005. Springer Press.
[62] Michael C. Jaeger and Gregor Rojec-Goldmann. SENECA – Simulation of Al-gorithms for the Selection of Web Ser-vices for Compositions. In 6th VLDBWorkshop on Technologies for E-Services(TES’05), volume 3811 of LNCS, pages84–97, Trondheim, Norway, September2005. Springer Press.
[63] Michael C. Jaeger, Gregor Rojec-Goldmann, and Gero Muhl. QoSAggregation for Service Compositionusing Workflow Patterns. In Proceedingsof the 8th International Enterprise Dis-tributed Object Computing Conference(EDOC’04), pages 149–159, Monterey,California, USA, September 2004. IEEEPress.
[64] Michael C. Jaeger, Gregor Rojec-Goldmann, and Gero Muhl. QoSAggregation in Web Service Compo-sitions. In Proceedings of the 2005IEEE International Conference on e-Technology, e-Commerce and e-Service(EEE’05), pages 181–185, Hong Kong,China, March 2005. IEEE Press.
[65] Michael C. Jaeger, Gregor Rojec-Goldmann, Gero Muhl, ChristophLiebetruth, and Kurt Geihs. RankedMatching for Service Descriptions usingOWL-S. In Kommunikation in verteil-ten Systemen (KiVS 2005), InformatikAktuell, pages 91–102, Kaiserslautern,Germany, February 2005. Springer Press.
[66] Michael C. Jaeger and Stefan Tang.Ranked Matching for Service Descrip-tions using DAML-S. In Proceedings
188

Bibliography
of CAiSE’04 Workshops, pages 217–228,Riga, Latvia, June 2004. Riga TechnicalUniversity.
[67] Gerrit K. Janssens, Jan Verelst, and BartWeyn. Techniques for modelling work-flows and their support of reuse. InBusiness Process Management – Models,Techniques, and Empirical Studies, vol-ume 1806 of LNCS, pages 1–15, Berlin,Germany, February 2000. Springer Press.
[68] Jeff Johnson, Teresa L. Roberts, WilliamVerplank, David C. Smith, Charles Irby,Marian Beard, and Kevin Mackey. TheXerox Star: A Retrospective. Computer,22(9):11–26,28–29, September 1989.
[69] Sravanthi Kalepu, Shonali Krish-naswamy, and Seng Wai Loke. Reputa-tion = f(user ranking, compliance, verity).In Proceedings of the IEEE InternationalConference on Web Services (ICWS’04),pages 200–207, San Diego, California,USA, July 2004. IEEE CS Press.
[70] Olaf Kath, Andrei Blazarenas, MarcBorn, Klaus-Peter Eckert, Motoshisa Fun-abashi, and Chiaki Hirai. Towards Ex-ecutable Models: Transforming EDOCBehavior Models to CORBA and BPEL.In Proceedings of the 8th InternationalEnterprise Distributed Object ComputingConference (EDOC’04), pages 267–274,Monterey, California, USA, September2004. IEEE Press.
[71] Gerhard Keller, Markus Nuttgens, andAugust-Wilhelm Scheer. SemantischeProzeßmodellierung auf der GrundlageEreignisgesteuerter Prozeßketten (EPK).Veroffentlichungen des Instituts furWirtschaftsinformatik (IWi) 89, Uni-versitat des Saarlandes, Saarbrucken,Germany, 1992.
[72] Tony Kenyon. Data Networks: Routing,Seurity, and Performance Optimization.Digital Press, 1. edition, June 15th 2002.
[73] Bartek Kiepuszewski, Arthur H. M. terHofstede, and Christoph Bussler. OnStructured Workflow Modelling. In Pro-ceedings of the 12th International Con-ference on Advanced Information SystemsEngineering (CAiSE’00), volume 1789 ofLNCS, pages 431–445, Stockholm, Swe-den, June 2000. Springer Press.
[74] Donald E. Knuth. Structured Program-ming with go to Statements. ACM Com-puting Surveys, 6(4):261–301, December1974.
[75] Pinar Koksal, Sena Nural Arpinar, andAsuman Digac. Workflow History Man-agement. SIGMOD Record, 27(1):67–75,1998.
[76] Lea Kutvonen. Trading Services in OpenDistributed Environments. PhD thesis,Department of Computer Science, Uni-versity of Helsinki, Helsinki, Finland,1998.
[77] Hendrik Ladner. Methoden zur Opti-mierung der Dienstgute von Web Ser-vice Kompositionen. diploma thesis,Berlin University of Technology, Facultyof Electrical Engineering and ComputerScience, October 2005.
[78] Juhnyoung Lee. Matching Algorithmsfor Composing Business Process Solu-tions with Web Services. In Proceed-ings of the 4th International Conferenceon E-Commerce and Web Technologies(ECWEB’03), pages 393–402, Prague,Czechoslovakia, October 2003. SpringerPress.
[79] Ulf Leser. Combining HeterogeneousData Sources through Query Corre-spondence Assertions. In FereidoonSadri, editor, CIKM’98 First Workshopon Web Information and Data Manage-ment (WIDM’98), pages 29–32, Bathesda,Maryland, USA, November 1998. ACMPress.
[80] Frank Leymann. Web Services FlowLanguage (WSFL 1.0). Technical report,IBM Software Group, http://www-4.ibm.com/software/solutions/webser-vices/pdf/WSFL.pdf, 2001.
[81] Lei Li and Ian Horrocks. A SoftwareFramework For Matchmaking Based onSemantic Web Technology. In Proceed-ings of the 12th International Conferenceon World Wide Web (WWW’03), pages331–339. ACM Press, May 2003.
[82] Lucas Bordeaux and Gwen Salaun andDaniela Berardi and Massimo Mecella.When are two web services compatible?In Revised Selected Papers of the 5thInternational Workshop on Technologies
189

Bibliography
for E-Services (TES’04), volume 3324 ofLNCS, pages 15–28, Toronto, Canada,August 2004. Springer Press.
[83] Heiko Ludwig. Web Services QoS: Exter-nal SLAs and Internal Policies Or: Howdo we deliver what we promise? KeynoteSpeech at the WISE Workshop on WebServices Quality, December 2003.
[84] Heiko Ludwig, Alexander Keller, AsitDan, Richard P. King, and RichardFranck. Web Service Level Agree-ment (WSLA) Language Specification.http://www.research.ibm.com/wsla/WSLASpecV1-20030128.pdf, January 2003.
[85] Ed Lynch and Chandra Venkatapathy.Sustaining your Advantage with BusinessProcess Integration based on Service Ori-ented Architecture. White Paper, October2005.
[86] Dirk E. Mahling, Noel Craven, andW. Bruce Croft. From Office Automationto Intelligent Workflow Systems. IEEEIntelligent Systems, 10(3):41–47, June1995.
[87] Mike Marin, Justin Brunt, WojciechZurek, Tim Stephenson, Sasa Bojanic,and Gangadhar Gouri. Workflow Pro-cess Definition Interface – XML ProcessDefinition Langauge, Version 1.0. Tech-nical Report WFMC-TC-1025, WorkflowManagement Coalition, Lighthouse Point,Florida, USA, October 2002.
[88] E. Michael Maximilien and Munindar P.Singh. A Framework and Ontology forDynamic Web Services Selection. InIEEE Internet Computing, pages 84–93.IEEE Press, September-October 2004.
[89] Deborah L. McGuinness and Frankvan Harmelen. OWL Web Ontol-ogy Language Overview. Technical re-port, W3C, http://www.w3.org/TR/owl-features/, 2004.
[90] Daniel A. Menasce. QoS Issues in WebServices. In IEEE Internet Comput-ing, pages 72–75. IEEE Press, November-December 2002.
[91] Daniel A. Menasce. Composing WebServices:A QoS View. In IEEE Inter-net Computing, pages 88–90. IEEE Press,November–December 2004.
[92] Daniel A. Menasce. Response-TimeAnalysis of Composite Web Services. InIEEE Internet Computing, pages 90–92.IEEE Press, January–February 2004.
[93] Microsoft. Enterprise UDDI Services: AnIntroduction to Evaluating, Planning, De-ploying, and Operating UDDI Services,February 2003.
[94] Klara Nahrstedt and Jonathan M. Smith.The QoS Broker. IEEE MultiMedia,2,(1):53–67, Spring 1995.
[95] Felix Naumann, Ulf Leser, and Jo-hann Christoph Freytag. Quality-drivenintegration of heterogenous informationsystems. In Proceedings of 25th Inter-national Conference on Very Large DataBases (VLDB’99), pages 447–458, Ed-inburgh, September 1999. Morgan Kauf-mann.
[96] Object Management Group (OMG).Model Driven Architecture. ormsc/2001-07-01, August 2001.
[97] Object Management Group (OMG).CORBA Components. OMG formaldocument/02-06-65, 2002.
[98] Object Management Group (OMG). MetaObject Factility Specification. OMG for-mal document/2002-04-03, April 2002.
[99] Object Management Group (OMG).UML Profile for Modelling Quality ofService and Fault Tolerance Character-istics and Mechanisms. ptc/2004-06-01,June 2004.
[100] Object Management Group (OMG). Uni-fied Modeling Language: Superstructure.OMG formal document/05-07-04, August2005.
[101] Chun Ouyang, Marlon Dumas, StephanBreutel, and Arthur H.M. ter Hofstede.Translating Standard Process Models toBPEL. In Proceedings of the 18th In-ternational Conference on Advanced In-formation Systems Engineering, Luxem-bourg, June 2006. Springer Press.
[102] Massimo Paolucci, Takahiro Kawamura,Terry R. Payne, and Katia Sycara. Im-porting the Semantic Web in UDDI. InRevised Papers from the InternationalWorkshop on Web Services, E-Business,and the Semantic Web, pages 225–236,Toronto, Canada, May 2002. SpringerPress.
190

Bibliography
[103] Massimo Paolucci, Takahiro Kawamura,Terry R. Payne, and Katia Sycara. Seman-tic Matching of Web Service Capabilities.In Proceedings of 1st International Se-mantic Web Conference. (ISWC’02), vol-ume 2342 of LNCS, pages 333–347, Sar-dinia, Italy, June 2002. Springer Press.
[104] Mike P. Papazoglou. Service-OrientedComputing: Concepts, Characteristicsand Directions. In Proceedings ofthe Fourth International Conference onWeb Information Systems Engineering(WISE’03), pages 3–12, Roma, Italy, De-cember 2003. IEEE CS Press.
[105] Chintan Patel, Kaustubh Supekar, and Yu-gyung Lee. Provisioning Resilient, Adap-tive Web Services-based Workflow: A Se-mantic Modeling Approach. In Proceed-ings of the IEEE International Conferenceon Web Services (ICWS’04), pages 480–487, San Diego, California, USA, July2004. IEEE CS Press.
[106] Terry R. Payne, Massimo Paolucci, andKatia Sycara. Advertising and MatchingDAML-S Service Descriptions. In Posi-tion Papers for SWWS’01, pages 76–78,Stanford, USA, July 2001. Stanford Uni-versity.
[107] Massimo Pezzini. SOA Beyond Hypeand Disillusionment – A Strategic Per-spective. Key Note given at the SOA Days2005 Technology Conference, September2005.
[108] David Pisinger. Algorithms for KnapsackProblems. PhD thesis, Dept. of Com-puter Science, University of Copenhagen,Copenhagen, Denmark, February 1995.
[109] IONA Technologies PLC. Ar-tix: the Extensible Enterprise Ser-vice Bus (ESB). product website,http://www.iona.com/products/artix/,2005.
[110] United Nations Development Programme.United Nations Standard Products andServices Code. organisation website,http://www.unspsc.org/, 2005.
[111] Peter Puschner and Anton Schedl. Com-puting Maximum Task Execution Times- A Graph-Based Approach. Journalof Real-Time Systems, 13(1):67–91, July1997.
[112] Shuping Ran. A Model for Web ServicesDiscovery with QoS. SIGecom Exch.,4(1):1–10, 2003.
[113] Akhil Sahai, Anna Durante, and VijayMachiraju. Towards Automated SLAManagement for Web Services. TechnicalReport HPL-2001-310, Software Tech-nology Laboratory, HP Laboratories PaloAlto, Palo Alto, California, USA, 2002.
[114] Uwe Schoning. Theoretische Informatik- kurz gefasst. Spektrum AkademischerVerlag, Heidelberg, Germany, 3. edition,1999.
[115] Seema Degwekar and Stanley Y. W. Suand and Herman Lam. Constraint spec-ification and processing in web servicespublication and discover. In Proceedingsof the IEEE International Conference onWeb Services (ICWS’04), pages 210–217,San Diego, California, USA, June 2004.IEEE CS Press.
[116] Mohamed A. Serhani, Rachida Dssouli,Houari Sahraoui, Abdelghani Benharref,and M. E. Badidi. QoS Integration inValue Added Web Services. In Proceed-ings of the Second International Confer-ence on Innovations in Informal Technol-ogy (IIT’05), September 2005.
[117] Dave Shaffer and Brian Dayton. Or-chestrating Web Services: The Case fora BPEL Server. Technical report, Ora-cle Corporation, Redwood Shores, Cali-fornia, USA, June 2004.
[118] Robert Shapiro, Mike Marin, JustinBrunt, Wojciech Zurek, Tim Stephenson,Sasa Bojanic, and Gangadhar Gouri. Pro-cess Definition Interface – XML ProcessDefinition Language, Version 2.0. Tech-nical Report WFMC-TC-1025, WorkflowManagement Coalition, Lighthouse Point,Florida, USA, October 2005.
[119] Kaarthik Sivashanmugam, Kunal Verma,Amit P. Sheth, and John A. Miller. AddingSemantics to Web Services Standards. InProceedings of the International Confer-ence on Web Services (ICWS ’03), pages395–401, Las Vegas, Nevada, USA, June2003. CSREA Press.
[120] David Skogan, Roy Grønmo, and IdaSolheim. Web Service Composition inUML. In Proceedings of the 8th IEEE
191

Bibliography
Intl Enterprise Distributed Object Com-puting Conf (EDOC’04), pages 47–57,Monterey, California, USA, September2004. IEEE Press.
[121] Howard Smith and Peter Fingar. Busi-ness Process Fusion Is Inevitable. Busi-ness Process Trends, Columns and Arti-cles, March 2004.
[122] Howard Smith and Peter Fingar. Work-flow is just a Pi Process. Business Pro-cess Trends, Columns and Articles, Jan-uary 2004.
[123] Naveen Srinivasan, Massimo Paolucci,and Katia Sycara. Adding OWL-S toUDDI, Implementation and Throughput.In Proceedings of Semantic Web Serviceand Web Process Composition 2004, SanDiego, California, USA, July 2004.
[124] Katia Sycara, Massimo Paolucci, JulienSoudry, and Naveen Srinivasan. DynamicDiscovery and Coordination of Agent-Based Semantic Web Services. IEEE In-ternet Computing, 8(3):66–73, May, June2004.
[125] Katia Sycara, Seth Widoff, MatthiasKlusch, and Jianguo Lu. LARKS: Dy-namic Matchmaking Among Heteroge-neous Software Agents in Cyberspace.Autonomous Agents and Multi-Agent Sys-tems, 5(2):173–203, 2002.
[126] OASIS WS-BPEL TC. WS-BPEL Speci-fication Editors Draft. http://www.oasis-open.org/committees/download.php/12791/wsbpel-specification-draft-May-20-2005.html, December 2005.
[127] Technical Committee ISO/TC 176, Qual-ity Management and Quality Assurance.Quality Managemant and Quality SystemElements; Part 2: Guidelines for Services,1991.
[128] Technical Committee ISO/TC 176, Qual-ity Management and Quality Assurance.Quality Management and Quality Assur-ance Standards; Part 1: Guidelines for Se-lection and Use, 1994.
[129] Satish Thatte. XLANG - Web Ser-vices for Business Process Design.http://www.gotdotnet.com/team/xmlwsspecs/xlang-c/default.htm, 2001.
[130] The OWL Services Coalition. OWL-S: Semantic Markup for Web Services.
Technical report, The DARPA AgentMarkup Language (DAML) Program,http://www.daml.org/services/, 2004.
[131] Min Tian, A. Gramm, Hartmut Ritter, andJochen H. Schiller. Efficient Selectionand Monitoring of QoS-aware Web ser-vices with the WS-QoS Framework. InThe 2004 IEEE/WIC/ACM InternationalConference on Web Intelligence (WI’04),pages 152–158, Beijing, China, Septem-ber 2004. IEEE Press.
[132] Vladimir Tosic, Wei Ma, BernardPagurek, and Babak Esfandiari. WebService Offerings Infrastructure (WSOI)– A Management Infrastructure for XMLWeb Services. In Proceedings of theIEEE/IFIP Network Operations andManagement Symposium (NOMS’04),pages 817–830, Seoul, South Korea,April 2004. IEEE Press.
[133] Vladimir Tosic, Kruti Patel, and BernardPagurek. WSOL – Web Service OfferingsLanguage. In Proceedings of the Work-shop on Web Services, e-Business, andthe Semantic Web - WES (at CAiSE’02),volume 2512 of LNCS, pages 57–67,Toronto, Canada, May 2002. SpringerPress.
[134] David Trastour, Claudio Bartolini, andChris Preist. A Semantic Web Approachto Service Description for Matchmakingof Services. In Proceedings of the 11thinternational conference on World WideWeb (WWW’02), pages 89–98, Honolulu,USA, May 2002. ACM Press.
[135] UDDI Spec Technical Committee. UDDIVersion 3.0.1. http://uddi.org/pubs/uddi-v3.0.1-20031014.pdf, 2003.
[136] Guijun Wang, Alice Chen, ChangzhouWang, Casey Fung, and Stephen Uczekaj.Integrated Quality of Service (QoS) Man-agement in Service-Oriented EnterpriseArchitectures. In Proceedings of the 8thInternational Enterprise Distributed Ob-ject Computing Conference (EDOC’04),pages 21–32, Monterey, California, USA,September 2004. IEEE Press.
[137] Zheng Wang and Jon Crowcroft. Qualityof Service Routing for Supporting Multi-media Applications . IEEE Journal of Se-lected Areas in Communications (JSAC),14(7):1228–1234, September 1996.
192

Bibliography
[138] Gerhard Weikum. Towards GuaranteedQuality and Dependability of InformationSystems. In 8th GI Fachtagung: Daten-banksysteme in Buero, Technik und Wis-senschaft, pages 379–409, Freiburg, Ger-many, March 1999. Springer Press.
[139] Wen-Lin Yang. Optimal and heuris-tic algorithms for quality-of-service rout-ing with multiple constraints. Perfor-mance Evaluation, 57(3):261–278, Jan-uary 2004.
[140] Stephen A. White. Business ProcessModeling Notation (BPMN). TechnicalReport Working Draft (1.0), BPMI.org,August 2003.
[141] Wil M. P. van der Aalst. Why workflow isNOT just a Pi-Process. Online Edition atBPTrends, BPMI.org, February 2004.
[142] Wil M.P. van der Aalst. Workflow Ver-ification: Finding Control-Flow ErrorsUsing Petri-Net-Based Techniques. InBusiness Process Management – Mod-els, Techniques, and Empirical Studies,volume 1806 of LNCS, pages 161–183,Berlin, Heidelberg, New York, February2000. Springer Press.
[143] Wil M.P. van der Aalst. Don’t go with theflow: Web services composition standardsexposed. Jan/Feb 2003 Issue of IEEE In-telligent Systems, pages 72–76, January2003.
[144] Wil M.P. van der Aalst. Pi calculus ver-sus petri nets: let us eat humble pie ratherthan further inflate the pi hype. BPTrends,3(5):1-11, May 2005.
[145] Wil M.P. van der Aalst and Arthur H.M.ter Hofstede and Bartek Kiepuszewskiand Alistair P. Barros. Advanced Work-flow Patterns. In 7th International Con-ference on Cooperative Information Sys-tems (CoopIS’00), volume 1901 of LNCS,pages 18–29, Berlin, Germany, 2000.Springer Press.
[146] Wil M.P. van der Aalst and ArthurH.M. ter Hofstede and Bartek Kie-puszewski and Alistair P. Barros. Work-flow Patterns. Distributed and ParallelDatabases, 14(1):5–51, 2003.
[147] Wil M.P. van der Aalst and Jens B.Jørgensen and Kristian B. Lassen. Let’sGo All the Way: From Requirements
Via Colored Workflow Nets to a BPELImplementation of a New Bank System.In Proceedings of the Confederated In-ternational Conferences CoopIS, DOA,and ODBASE 2005 (OTM’05), volume3760 of LNCS, pages 22–39, Agia Napa,Cyprus, November 2005. Springer Press.
[148] Wil M.P. van der Aalst and Kees M. vanHee and G. J. Houben. Modelling Work-flow Management Systems with high-level Petri Nets. In G. De Michelis and C.Ellis and G. Memmi, editor, Proceedingsof the second Workshop on Computer-Supported Cooperative Work, Petri netsand related formalisms, pages 31–50,1994.
[149] Wil M.P. van der Aalst and Lach-lan Aldred and Marlon Dumas andArthur H.M. ter Hofstede. Designand implementation of the YAWLsystem. Technical Report FIT-TR-2003-07, Centre for IT Innovation, QUT,http://www.tm.tue.nl/it/research/patterns,2004.
[150] Wil M.P. van der Aalst and Marlon Du-mas and Arthur H.M. ter Hofstede andPetia Wohed. Pattern Based Analysis ofBPML (and WSCI). FIT Technical ReportFIT-TR-2002-05, Queensland Universityof Technology, Brisbane, Australia, 2002.
[151] Petia Wohed, Wil M.P. van der Aalst,Marlon Dumas, and Arthur H.M. terHofstede. Pattern Based Analysis ofBPEL4WS. Technical Report FIT-TR-2002-04, QUT, Queensland University ofTechnology, Queensland, Australia, 2002.
[152] Andreas Wombacher, Peter Fankhauser,Bendick Mahleko, and Erich Neuhold.Matchmaking for business processesbased on choreographies. InternationalJournal of Web Services Research,1(4):14–32, October-December 2004.
[153] Bibo Yang, Joseph Geunes, andWilliam J. O’Brien. Resource Con-strained Project Scheduling; Past Workand New Directions. Technical ReportResearch Report 2001-6, Departmentof Industrial and Systems Engineering,University of Florida, 2001.
[154] Jian Yang. Web Service Componenti-zation. Communications of the ACM,46(10), October 2003.
193
Bibliography
[155] Jian Yang, Mike P-Papazoglou, andWillem-Jan van den Heuvel. Tacklingthe Challenges of Service Composition inE-Marketplaces. In Proceedings of the12th International Workshop on ResearchIssues in Data Engineering (RIDE’02),pages 125–133. IEEE, February 2002.
[156] Martin Yates, Wataru Takita, RickardJansson, Laurence Demounem, and HarmMulder. TINA-C Deliverable: TINABusiness Model and Reference Points.http://www.tinac.com/, May 1997.
[157] Tao Yu and Kwei-Jay Lin. A Broker-Based Framework for QoS-Aware WebService Composition. In Proceedingsof the 2005 IEEE International Confer-ence on e-Technology, e-Commerce, ande-Services (EEE’05), pages 22–29, HongKong, China, March 2005. IEEE Press.
[158] Tao Yu and Kwei-Jay Lin. Service Se-lection Algorithms for Web Services withEnd-to-End QoS Constraints. In Proceed-ings of the 2005 IEEE International Con-ference on e-Technology, e-Commerceand e-Service (EEE’05), pages 129–136,Hong Kong, China, March 2005. IEEEPress.
[159] Liangzhao Zeng, Boualem Benatallah,Anne H.H. Ngu, Marlon Dumas, JayantKalagnanam, and Henry Chang. QoS-Aware Middleware for Web ServicesComposition. IEEE Transactions on Soft-ware Transactions, 30(5):311–327, May2004.
194

Nachwort
Die Anfertigung einer Dissertation scheint die Charakteristik aufzuweisen, dasssich der Autor in die Arbeit sturzt, dazu tendiert, gesellschaftliche Aktivitaten zureduzieren, und sich im permanenten Stresszustand befindet, weil der Eindruckbesteht, dass die unerfreulichen Einsichten wahrend der Anfertigung uberwiegen.Umso mehr danke ich Paola dafur, dass sie mir mit einem Mittelweg aus Kon-frontation und Verstandnis begegnete und mich dazu ermahnte, mich wahrend derArbeit in einem vertretbaren Modus zu bewegen. Um die Ausmaße zu verdeut-lichen, mochte ich erwahnen, dass mein Verhalten eine befreundete Sprachlehrerininspirierte, eine Figur zu erfinden: Stefan, ein Statistiker, un secchione, der denganzen Tag aufgeregt uber Zahlenreihen sitzt. Er ist verlobt mit einer Italienerin,die gerne kocht . . . (vgl. Langenscheidt Sprachkalender Italienisch 2008).
Ich hatte das besondere Gluck, dass mir Unterstutzung nicht nur aus einer, son-dern aus zwei Arbeitsgruppen (FLP und BKS) zuteil wurde. Vielen Dank daher anChunyan, Malte, Sebastian B., Steffen, Sebastian G., Jens, Michael A., Narcisse,Helge, Matthias und Tina. Wer die Zwischenstande meiner Arbeit gesehen odervorgetragen bekommen hat, wird sicherlich bestatigen, dass die Diskussionen undAnregungen mit und von meinen Kolleginnen und Kollegen fur mich sehr hilfreichwaren. Ganz besonderer Dank gebuhrt naturlich Gero Muhl, der mich mit großerInitiative und seinen humorvollen Darstellungen unterstutzt und motiviert hat. Inahnlicher Form muss ich mich bei James und Gregor fur deren außergewohnlicheHilfsbereitschaft bedanken. Gerhard, Michael P. und Annelie danke ich fur Ratund Tat in der Mathematik und im Englischen.
Bernd Mahr danke ich fur die Betreuung meiner Dissertation; Kollegen schrie-ben zu einem ahnlichem Anlass: “. . . zu deren Entstehung . . . Bernd mit seinergroßen Begabung in sokratischer Hebammentechnik hilfreich beigetragen hat.”Treffender kann ich es nicht formulieren. Ich mochte mich an dieser Stelle auch beiHerrn Tolksdorf bedanken, der sich bereit erklarte, die Rolle des zweiten Gutachterszu ubernehmen. Ebenfalls bedanke ich mich bei Herrn Heiss, der den Vorsitz imAusschuss ubernommen hat. Last but not least, mochte Kurt Geihs meinen Dankaussprechen – bei ihm als Mitarbeiter am Lehrstuhl fur verteilte Systeme an derTU Berlin hat alles angefangen.
Berlin, Dezember 2006.
195

(the end)
196