optimising pre-implementation managerial...
TRANSCRIPT

OPTIMISING PRE-IMPLEMENTATION MANAGERIAL COMMUNICATION
TO OVERCOME END-USER RESISTANCE TO SYSTEM ADOPTION:
A COMPARATIVE STUDY OF
BRITISH, GERMAN AND JAPANESE END-USERS’ CULTURAL PERCEPTIONS
A study submitted in partial fulfilment
of the requirements for the degree of
Master of Arts in Multilingual Information Management
at
THE UNIVERSITY OF SHEFFIELD
by
MIRYAM PRASETYO
September 2012
2
Abstract
Background. End-user resistance has been recognised as one of the major causes of
large-scale information systems (IS) implementation failures. Whilst diverse
resistance mitigation strategies have been suggested to practitioners, the literature
reveals a lack of research into the impact of culture on end-users’ perception of such
strategies.
Aims. The study was to determine what pre-implementation managerial
communication strategies are effective in the different cultural contexts of the UK,
Germany and Japan to promote a new IS and reduce end-users’ resistance to the
system’s adoption in organisations. More specifically, hypotheses about whether, and
if yes, how British, German and Japanese end-users perceive the same managerial
communications differently, were to be tested.
Methods. English, German and Japanese language versions of an otherwise identical
scenario-based, closed-question online questionnaire were developed and piloted
with two native speakers per language. Via convenience sampling, 70 British, 67
German and 72 Japanese respondents were recruited, the majority of which was
female, 18-35 years old and without leadership experience. The average between-
sample differences were analysed using descriptive statistics as well as ANOVA and
Bonferroni post-hoc hypothesis tests.
Results. Overall, British, German and Japanese respondents’ perception of
managerial communications were significantly different at the 0.05 level between all
sample—sample combinations and for all tested communicational variables (i.e.,
content, manner, style, direction and addressal) for the majority of scenarios. The
main hypothesis H1, addressing whether British, German and Japanese end-users
perceived the same managerial communications differently, was fully supported. The
sub-hypotheses H2-H5, which addressed how their perception differed, were partially
supported, confirming 1-2 in 3 predicted relationships between any two samples.
Conclusions. It is concluded that managers’ pre-implementation communications
during IS introduction are indeed perceived differently by British, German and
Japanese end-users. This indicates a clear need for more integrated culture—IS
research. Future work could recruit random samples of the same or other countries,
using the same or a revised version of the questionnaire.
Registration number: 110145938
3
Table of Contents
Abstract ............................................................................................................................... 2
List of Figures/Tables ......................................................................................................... 7
Acknowledgements ........................................................................................................... 10
Chapter 1: Introduction .................................................................................................... 11
1.1 Research Background ............................................................................................ 11
1.2 Research Focus: Aim and Objectives .................................................................... 12
1.3 Structure of the Dissertation .................................................................................. 14
Chapter 2: Literature Review ........................................................................................... 15
2.1 Introduction ........................................................................................................... 15
2.2 Driving Forces Behind End-User Resistance ........................................................ 16
2.2.1 Definition of Resistance ................................................................................... 16
2.2.2 Drivers of End-User Resistance ....................................................................... 17
2.3 Critical Success Factors of Managerial Pre-Implementation, Pro-System
Communication ..................................................................................................... 21
2.3.1 Definition of Communication and Its Link to Resistance ................................ 21
2.3.2 Critical Success Factors of Managerial Pre-Implementation
Communication ................................................................................................ 23
2.4 British, German and Japanese Cultural Variations of the Critical Success
Factors of Managerial Pro-System Communication ............................................. 26
2.4.1 Definition of Culture and Its Link to Communication ..................................... 26
2.4.2 Selection of Cultural Studies for this Research ................................................ 28
2.4.3 Hypothetical British, German and Japanese Cultural Variations of the
Critical Success Factors of Managerial Communication ................................. 30
2.5 Conclusion and Empirical Research Framework .................................................. 37
Chapter 3: Research Methods .......................................................................................... 40
3.1 Introduction ........................................................................................................... 40
4
3.2 Research Strategy, Sample Selection, Data Collection Technique and
Instrument Design ................................................................................................. 40
3.2.1 Research Strategy ............................................................................................. 42
3.2.2 Sample Selection .............................................................................................. 44
3.2.3 Data Collection Technique ............................................................................... 45
3.2.4 Instrument Design and Pilot ............................................................................. 46
3.3 Research Ethics ..................................................................................................... 47
3.4 Framework for Data Analysis ............................................................................... 47
3.5 Limitations and Potential Problems ...................................................................... 48
Chapter 4: Research Findings .......................................................................................... 50
4.1 Introduction ........................................................................................................... 50
4.2 Culturally Preferred Content of Managerial Communications (H2a-c) .................. 52
4.3 Culturally Preferred Manner of Managerial Communications (H3-5) ................... 54
4.4 Conclusion: Culturally Different Perception of Managerial
Communications (H1) ............................................................................................ 61
Chapter 5: Discussion ...................................................................................................... 64
5.1 Introduction ........................................................................................................... 64
5.2 Synthesis of Consistencies in Empirical and Literature Findings ......................... 64
5.3 Discussion of Inconsistencies in Empirical and Literature Findings .................... 66
5.3.1 Reason 1: Sample Make-up .............................................................................. 67
5.3.2 Reason 2: Insecure Job Market ......................................................................... 70
5.3.3 Reason 3: Question or Scenario Situation ........................................................ 73
5.4 Conclusion and Recommendations to Managers for Optimising their Pre-
Implementation, Pro-System Communications ..................................................... 74
Chapter 6: Conclusion ...................................................................................................... 76
6.1 Introduction ........................................................................................................... 76
6.2 Research Objectives Revisited: Concluding Overview of Findings ..................... 77
6.3 Contribution to Knowledge and Suggestions for Future Research ....................... 78
5
Bibliography ...................................................................................................................... 80
Appendix I – Ethics Approval: Ethics Application Form ................................................. 96
Appendix II – Ethics Approval: Information Sheet and Consent Form (provided
as the questionnaire’s first page) ..................................................................................... 103
II.A English Language Version .................................................................................. 103
II.B German Language Version .................................................................................. 105
II.C Japanese Language Version ................................................................................ 106
Appendix III – Questionnaire.......................................................................................... 109
III.A English Language Version .................................................................................. 109
Page 1: ........................................................................................................................ 109
Page 2: ........................................................................................................................ 110
Page 3: ........................................................................................................................ 111
Page 4: ........................................................................................................................ 112
Page 5: ........................................................................................................................ 113
Page 6: ........................................................................................................................ 114
III.B German Language Version .................................................................................. 118
Page 1: ........................................................................................................................ 118
Page 2: ........................................................................................................................ 120
Page 3: ........................................................................................................................ 121
Page 4: ........................................................................................................................ 122
Page 5: ........................................................................................................................ 123
Page 6: ........................................................................................................................ 124
III.C Japanese Language Version ................................................................................ 129
Page 1: ........................................................................................................................ 129
Page 2: ........................................................................................................................ 131
Page 3: ........................................................................................................................ 131
Page 4: ........................................................................................................................ 132

6
Page 5: ........................................................................................................................ 133
Page 6: ........................................................................................................................ 134
Appendix IV – Collated Questionnaire Results Spreadsheet .......................................... 138
Appendix V – ANOVA Tables ....................................................................................... 145
Appendix VI – Confirmation of Address, Employment Destination and Access to
Dissertation Forms .......................................................................................................... 152
7
List of Figures/Tables
Figures
2.1 Resistance 17
2.2 Perception and resistance 19
2.3 Communication, perception and resistance 22
2.4 Integrated managerial communications plan 25
2.5 Communication, cultural perception and resistance 27
2.6 Hofstede (1984)’s uncertainty avoidance, (reversed) power distance and
(reversed) individualism versus collectivism dimensions, used to infer the
culturally preferred content of communication (H2a-c) 30
2.7 Hofstede (1984)’s uncertainty avoidance and Hall (1976)’s context of
communication dimensions, used to infer the culturally preferred style of
communication (H3) 32
2.8 Hofstede (1984)’s power distance, Trompenaars & Hampden-Turner
(1993)’s neutral versus affective and Hall (1976)’s context of
communication dimensions, used to infer the culturally preferred direction
of communication (H4) 34
2.9 Hofstede (1984)’s individualism versus collectivism and Trompenaars &
Hampden-Turner (1993)’s individualism versus communitarianism
dimensions, used to infer the culturally preferred addressal of
communication (H5) 36
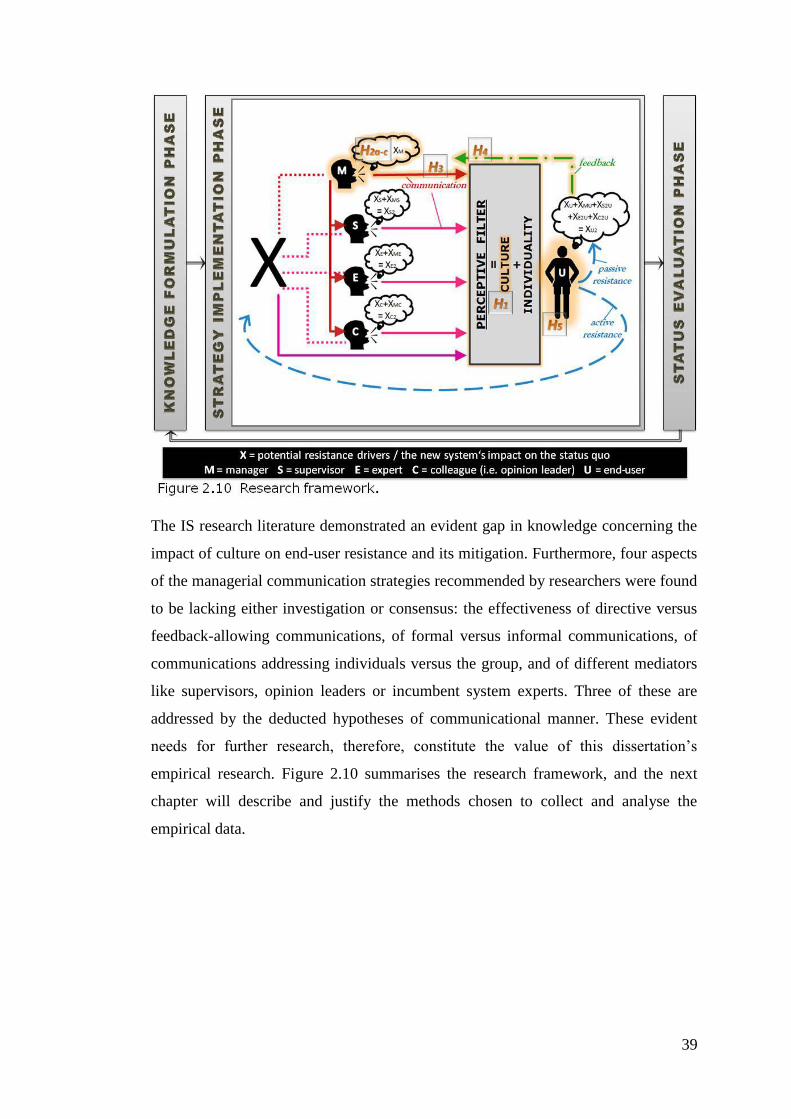
2.10 Research framework 39
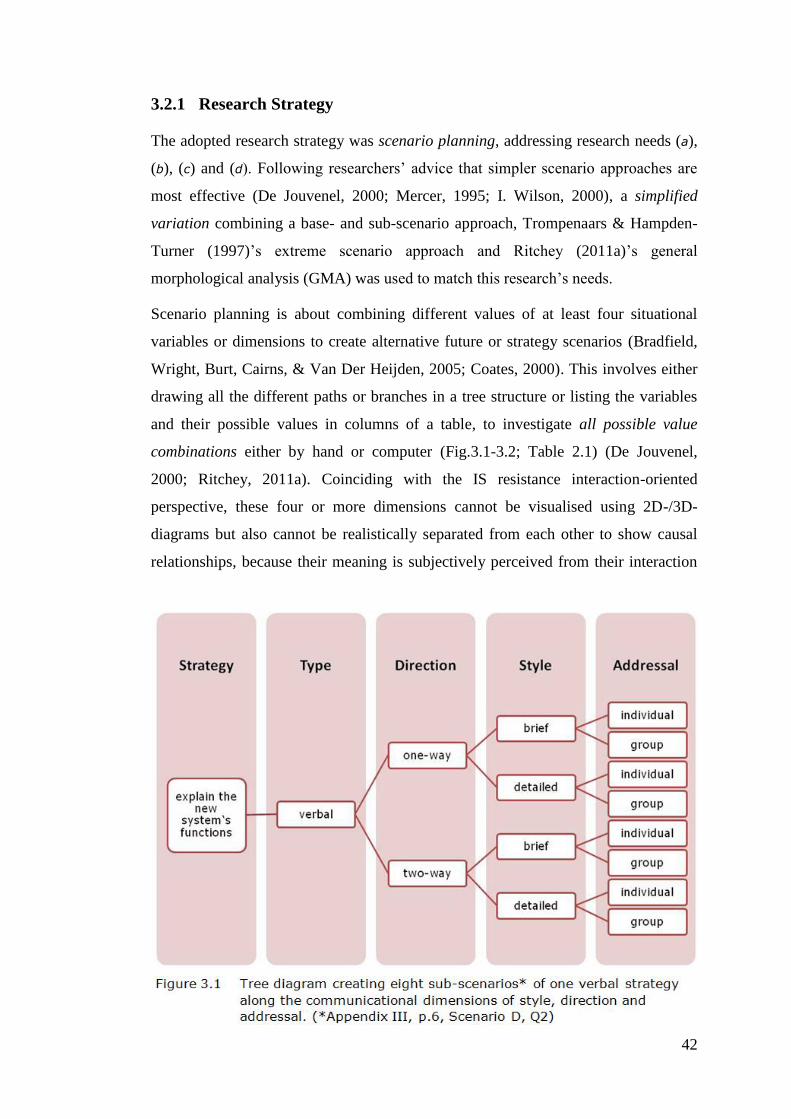
3.1 Tree diagram creating eight sub-scenarios of one verbal strategy along the
communicational dimensions of style, direction and addressal 42
3.2 Tree diagram creating eight sub-scenarios of one action strategy along the
communicational dimensions of style, direction and addressal 43
4.1 Number of respondents by nationality 50
4.2 Percentage of respondents by gender and nationality 51
4.3 Number of respondents by age group and nationality 51
8
4.4 Percentage of respondents by leadership experience and nationality 51
4.5 Percentage of votes given to the three different Contents of certainty,
control and belonging by national sample (H2a-c) 53
4.6 Sample mean scores for the three different Manners of Style, Direction
and Addressal by verbal- and action-type communicational scenario (H3-5)
55
4.7 Number of respondents (bars) and mean scores (circled figures) showing
the positive—negative ratings for the eight verbal-type sub-scenarios of
combined Manner (H3-5) 56
4.8 Number of respondents (bars) and mean scores (circled figures) showing
the positive—negative ratings for the eight action-type sub-scenarios of
combined Manner (H3-5) 57
4.9 Sample mean scores for Style by type of communicational scenario and on
average (H3) 58
4.10 Sample mean scores for Direction by type of communicational scenario
and on average (H4) 59
4.11 Sample mean scores for Addressal by type of communicational scenario
and on average (H5) 60
5.1 Inconsistent empirical and literature findings 67
5.2 British, German and Japanese original (left) and actual (right) scores on
the five cultural dimensions incorporated into H2-5 68
5.3 German and Japanese original (left) and actual (right) scores on Hofstede
(1984)’s three cultural dimensions incorporated into H2b-c 69
5.4 Original (left) and actual scores by leadership experience (middle) and age
group (right) on Trompenaars & Hampden-Turner (1993)’s neutral vesus
affective dimension 71
5.5 Average number of votes British respondents gave to the certainty- and
control-content communications by leadership experience (left) and age
group (right) 72
6.1 Research question and objectives 76
9
Tables
2.1 Resistance mitigation strategies and their communicational dimensions 38
4.1 Null and alternative hypotheses H1-5 and supported parts 62
4.2 Significant between-sample differences at the 0.05 level by
communicational dimension 63
IV Collated questionnaire results spreadsheet 138
V.1 SPSS output for a one-way ANOVA and Bonferroni post-hoc test of
communicational Content 145
V.2 SPSS output for a one-way ANOVA and Bonferroni post-hoc test of
communicational Manner 145
V.3 SPSS output for a one-way ANOVA and Bonferroni post-hoc test of
communicational Style 148
V.4 SPSS output for a one-way ANOVA and Bonferroni post-hoc test of
communicational Direction 149
V.5 SPSS output for a one-way ANOVA and Bonferroni post-hoc test of
communicational Addressal 150
10
Acknowledgements
I would like to express my deep gratitude to several individuals without whom this
dissertation project would not have been possible.
First, I wish to acknowledge the help provided by Dr Angela Lin, my dissertation
supervisor. Her constructive suggestions during the planning and development of this
research work are very much appreciated.
I would also like to express my great appreciation to my friend Imogen Wood.
Without her emotional support and encouragement I would not have been able to
overcome several times of struggle.
My special thanks are extended to those individuals who have volunteered to pilot
the questionnaire for their valuable comments and suggestions. I am also particularly
grateful for the assistance given by my friends and family in distributing the
questionnaire.
Finally, I wish to thank my parents for their support throughout my study.
11
Chapter 1: Introduction
1.1 Research Background
According to the Office for National Statistics (2010, 2011a, 2012), an increasing
number of organisations adopt large-scale information systems (IS), in an effort to
optimise their employees’ decision making and productivity (Hinton, 2006).
However, with a failure rate of up to 70 percent (Turban & Volonino, 2010, p. 535),
it is evident that not many of them succeed. For example, in order to better its
emergency call response rate, the London Ambulance Service (LAS) as one of the
largest ambulance services worldwide (LAS, 2012) has repeatedly replaced its old IS
with new computer-aided ambulance dispatch (CAD) systems since 1992 (Beynon-
Davies, 1999; Walber, 2003), but never succeeded on first attempt (Guardian
Government Computing, 2012; Hitchcock, 2011).
Since information systems or networks consist of procedures which connect
technology and people (Cashmore, 1991), changing the current IS with the
introduction of a new large-scale IS often is resisted by system end-users for the
disadvantages the change entails – e.g., a loss in power resulting from having to learn
new skills and routines and share information across departments (Alvarez, 2008;
Kwahk & Kim, 2007; Markus, 1983; Robson, 2006). End-user resistance has
therefore been identified as one of the major causes of large-scale IS implementation
failures (Butler Group, 2004; Hirschheim & Newman, 1988; Kim, 2011).
To mitigate resistance, researchers have suggested diverse strategies to practitioners.
In spite of the growing number of implementation attempts, however, the current IS
research literature is still lacking in five major areas:
First, the majority of studies ignore the system’s interaction within the socio-
political organisational context (Aladwani, 2001; Martinko, Henry, & Zmud,
1996). They thus do not adequately explain the drivers behind end-user
resistance, treating it as a ‘black box’ (Klaus & Blanton, 2010; Lapointe &
Rivard, 2005; Selander & Henfridsson, 2011).
Second, the few (Venkatesh, Davis, & Morris, 2007) studies which do
investigate the system’s contextual meaning and provide recommendations
12
for mitigating end-user resistance, lack practical detail. For instance, the
often-recommended strategy of communicating the new system’s benefits
could be implemented face-to-face or in written form, addressing end-users
en masse or individually, etc. Indeed, some contradicting suggestions have
been made: Whilst Klaus et al. (2007) recommend top-down, closed
communication, Elie-Dit-Cosaque et al. (2011) suggest feedback
encouraging, open communication.
Third, research has found that the nature of resistance differs depending on
the stage of the implementation process, evolving from weaker individual
resistance attitudes and behaviours to stronger, mutually reinforcing group
resistance. Whilst this makes managerial communication most significant
during pre-implementation, this stage has been studied the least (Lapointe &
Rivard, 2005; Meissonier & Houzé, 2010; Nach & Lejeune, 2010).
Fourth, Kim & Kankanhalli (2009) point out that most IS researchers draw
their findings from qualitative case studies. This indicates a clear need for
comparative, quantitative research.
Fifth, nearly all IS researchers present their conclusions as if applicable
universally across cultures. This shortcoming has been acknowledged only
relatively recently and by only few IS researchers, who argue that different
cultures have different resistance drivers and perceive resistance mitigating
strategies differently due to, e.g., different tolerance levels for uncertainty (C.
M. Elie-Dit-Cosaque & Straub, 2011) or different acceptance levels for
expressing emotions (Beaudry & Pinsonneault, 2010).
1.2 Research Focus: Aim and Objectives
This research seeks to address the above knowledge gaps by assuming the more
complex contextual (so-called interaction-oriented) perspective and – deductively
and quantitatively – investigating the resistance mitigating strategies suggested by
researchers in more depth and from different cultural contexts. It focuses on non-
/verbal communicational strategies and on the pre-implementation stage; and, to
maximise the potential for resistance reactions, the empirical research focuses on
13
large-scale IS and on the communication of general (not technical project)
managers of the more strategic top, to end-users of the more operational bottom of
the hierarchy (F. M. Wilson, 2004). Moreover, the national cultural contexts of the
UK, Germany and Japan have been selected for the researcher’s in-group experience
gained through her high language proficiency and long-term stays in these countries,
which is necessary for designing valid empirical research that anticipates any
potential problems associated with culturally unique concepts (Burr, 2003; Watkins
& Gnoth, 2011). The comparative cultural studies selected are that of Hofstede
(1984), Hall (1976) and Trompenaars & Hampden-Turner (1993) (for a justification
see 2.4.2).
The overall aim is therefore to determine what pre-implementation managerial
communication strategies are effective in different cultural contexts to promote a
new information system and reduce end-users’ resistance to the system’s adoption in
organisations. The research objectives are:
(1) To identify the driving forces behind end-user resistance.
(2) To identify the factors critical to successful managerial pre-implementation,
pro-system communication.
(3) To explore the potential variations of the critical success factors identified in
the different national cultures of the UK, Germany and Japan, using findings
from comparative cultural studies.
(4) To investigate British, German and Japanese end-users’ attitudes towards
different managerial pre-implementation communications.
(5) To provide recommendations to managers for optimising their pre-
implementation communication strategy in organisations in the UK, Germany
and Japan.
In order to provide an in-depth literature review that does not exceed the project’s
given time frame, its scope will be limited to English language sources of the IS and
culture research fields, complemented by some communicational studies but not by
management research studies. Furthermore, since the researcher does not have access
to random samples of the three chosen national populations, the empirical findings of
this research will be restricted in their generalisability. Nevertheless, the researcher
14
hopes her research to be valuable to practitioners and researchers by pioneering an
attempt to fill the knowledge gaps identified above in one integrated study.
1.3 Structure of the Dissertation
This dissertation has six chapters. (This) Chapter 1 provides the context and rationale
of this research and specifies its aim and objectives. Chapter 2 provides the
hypotheses for the empirical research, deducted from an in-depth literature review
addressing objectives 1-3. Chapter 3 describes and justifies the chosen methodology
and Chapter 4 describes and analyses the results of the empirical research targeting
objective 4. Chapter 5 answers objective 5 by discussing these empirical findings in
context of the literature to provide practical recommendations to managers. Finally,
Chapter 6 provides an overall conclusion by revisiting the original research aim and
objectives and making suggestions for future work.
15
Chapter 2: Literature Review
2.1 Introduction
The previous chapter has identified a clear need for quantitative research into how
the pre-implementation communication strategies aimed at mitigating end-user
resistance are perceived differently in different cultural contexts. In preparation for
such empirical research, this chapter seeks to deduct some hypotheses by integrating
relevant findings from the (English-language) IS resistance and comparative cultural
research literatures, in order to achieve objectives
(1) To identify the driving forces behind end-user resistance,
(2) To identify the factors critical to successful managerial pre-implementation,
pro-system communication,
and
(3) To explore the potential variations of the critical success factors identified in
the different national cultures of the UK, Germany and Japan, using findings
from comparative cultural studies.
This chapter is structured as follows: First, the term ‘resistance’ is defined and the
drivers of end-user resistance are identified. Second, the term ‘communication’ is
defined, its link to resistance is indicated and the critical success factors of
managerial pre-implementation communication are identified. Third, the term
‘culture’ is defined and its link to communication is indicated. After having justified
the selection of cultural studies, hypotheses about the British, German and Japanese
cultural variations of these critical success factors of managerial communication are
made. Finally, these findings are summarised and the need for additional empirical
research is indicated.
16
2.2 Driving Forces Behind End-User Resistance
2.2.1 Definition of Resistance
User resistance is defined as the attitudinal (Ferneley & Sobreperez, 2006) or
“behavioral expression of a user’s opposition” to an information system (IS)’s
introduction (Klaus & Blanton, 2010, p.627). It is also understood as a user’s means
of coping with the conflict embedded in this imposed situation (C. M. Elie-Dit-
Cosaque & Straub, 2011; Meissonier & Houzé, 2010). Whilst it can emerge before,
during and/or after system implementation (Hirschheim & Newman, 1988), as time
progresses it evolves from individual-level to group-level resistance, i.e. from a
compilation of individuals’ independent attitudes and behaviours to their
convergence into more powerful group actions (Lapointe & Rivard, 2005, 2007).
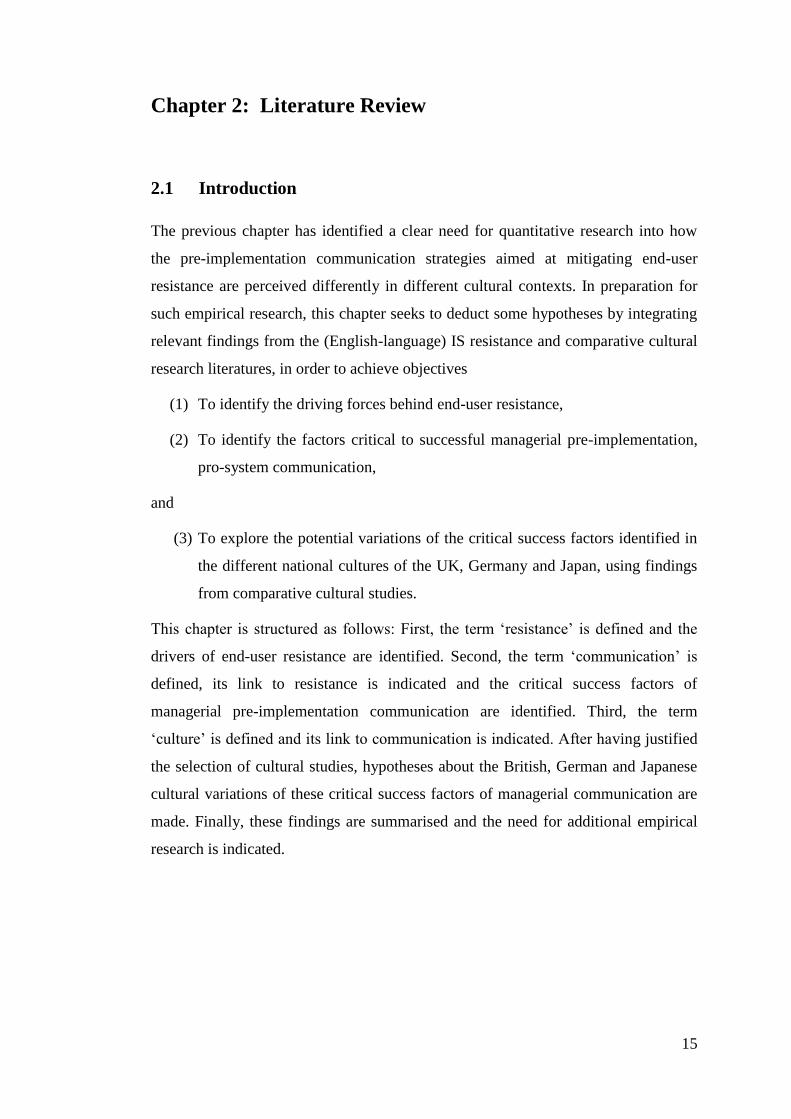
Resistance ranges from active to passive attitudes and behaviours (Marakas &
Hornik, 1996). Active resistance focuses on solving the problem by altering the
situation itself (Beaudry & Pinsonneault, 2005; C. Elie-Dit-Cosaque et al., 2011;
Nach & Lejeune, 2010). It includes both overt and covert actions and ranges from
constructive to destructive behaviours: e.g., from cooperative actions of (overtly)
giving negative feedback or (covertly) working around the system to satisfactorily
complete job tasks, to actions aimed at removing the system by (overt) physical
sabotage or (covertly) intentionally ‘forgetting’ tasks or slowing down performance
(Ferneley & Sobreperez, 2006; Hirschheim & Newman, 1988; Kim & Kankanhalli,
2009; Prasad & Prasad, 2000). Passive resistance, on the other hand, focuses on
evading the problem by altering one’s perception of the situation (C. Elie-Dit-
Cosaque et al., 2011; Nach & Lejeune, 2010). Expressed through, e.g., mockery or
apathy, it is self-destructive as the user distances and eventually exhausts him-
/herself emotionally, leading him/her to resign if there is no situational improvement
(Beaudry & Pinsonneault, 2005; Meissonier & Houzé, 2010) (Fig.2.1).
17
Resistance is neither inherently good nor bad (Ferneley & Sobreperez, 2006; Joshi,
1991; Klaus & Blanton, 2010; Lapointe & Rivard, 2005; Marakas & Hornik, 1996;
Markus, 1983; Martinko et al., 1996). Whilst the managers who advocate the IS will
likely perceive destructive-type resistance negatively, for the resisting end-users such
attitudes and behaviours are a legitimate reaction to the managers’ imposition of the
IS (Hussain & Cornelius, 2009), interpreted as a violation of the psychological
contract they had informally agreed on upon entering the employment relationship
(Klaus & Blanton, 2010; Selander & Henfridsson, 2011). So, “resistance can only be
believed to be bad or undesirable if the intentions of the designer or implementer are
accepted as good or desirable”, and vice versa (Markus, 1983, p. 433).
2.2.2 Drivers of End-User Resistance
The research literature investigating the driving forces behind end-user resistance can
be categorised into three streams: people-, system- and interaction-oriented
perspectives (Markus, 1983).
The people-oriented perspective attributes resistance to the resisting end-user’s
individual characteristics, such as age, gender, personality traits or prior experiences,
and his/her culturally shared value system (Venkatesh et al., 2007). From this
perspective, it was the employees that caused the failed implementation of the
London Ambulance Services Computer-Aided Dispatch (LASCAD) system in 1992
18
(see 1.1). For instance, resistance of older staff may have been due to a fear of the
computerisation of previously manual procedures, or more timid staff may have been
unable to quickly adapt to their new colleagues (cf. Beynon-Davies, 1999; Walber,
2003).
The system-oriented perspective, on the other hand, attributes resistance to the new
system’s dissatisfying features, such as frequent errors or an un-user-friendly
interface (Davis, 1989, 1993). From this perspective, staffs’ resistance to LASCAD
was caused by, for example, the system’s slowness due to an overload of 999 calls as
it failed to recognise repeat calls, or by the task impracticality of staff having to close
the many error messages appearing on screen in order to use the interface (Beynon-
Davies, 1999; Walber, 2003).
Whilst there are also researchers who hold both the people- and system-oriented
perspectives simultaneously, such a combined viewpoint is different from the
interaction-oriented perspective which attributes resistance to the end-user’s
negative perception of the entirety of socio-political factors (Markus, 1983). Here,
resistance to LASCAD is believed to have been not only due to the end-users’
individual characteristics and their frustration with the system’s dissatisfying
features, but also due to, e.g., their previous experience of failed IS implementation
attempts and subsequent distrust in LAS’s managers, the stress caused by the
increased workload, unfamiliar work routines and insufficient training, and so on
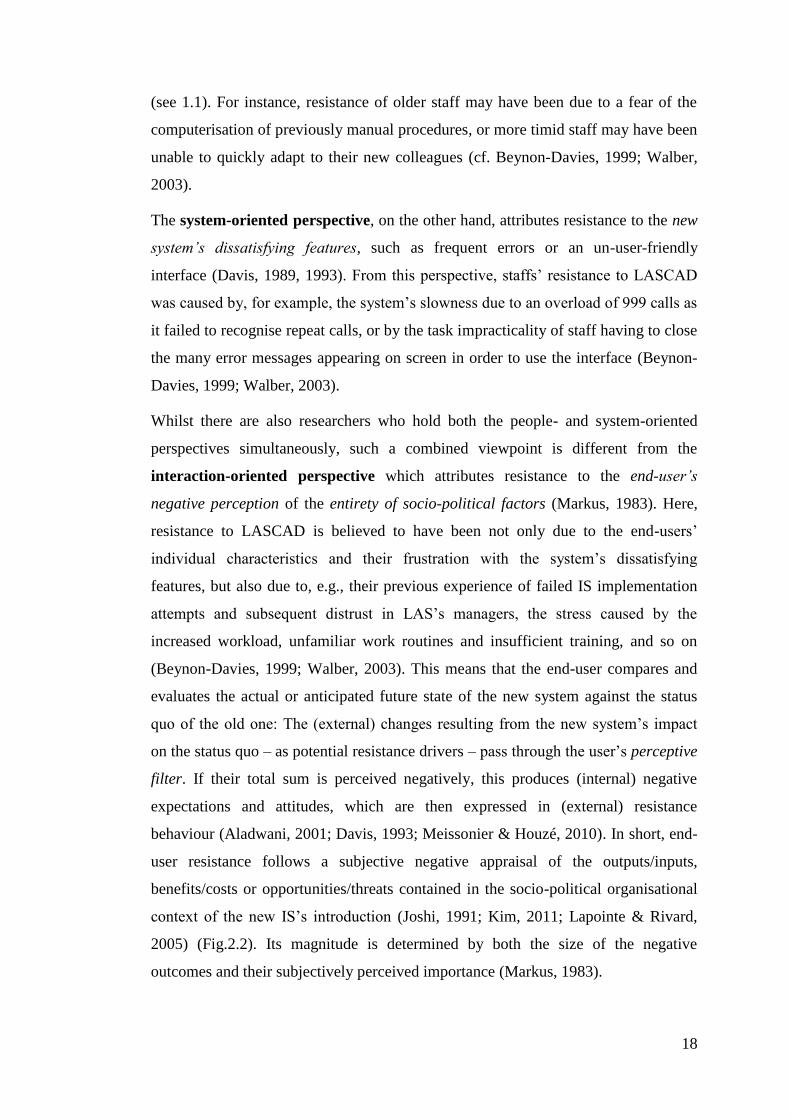
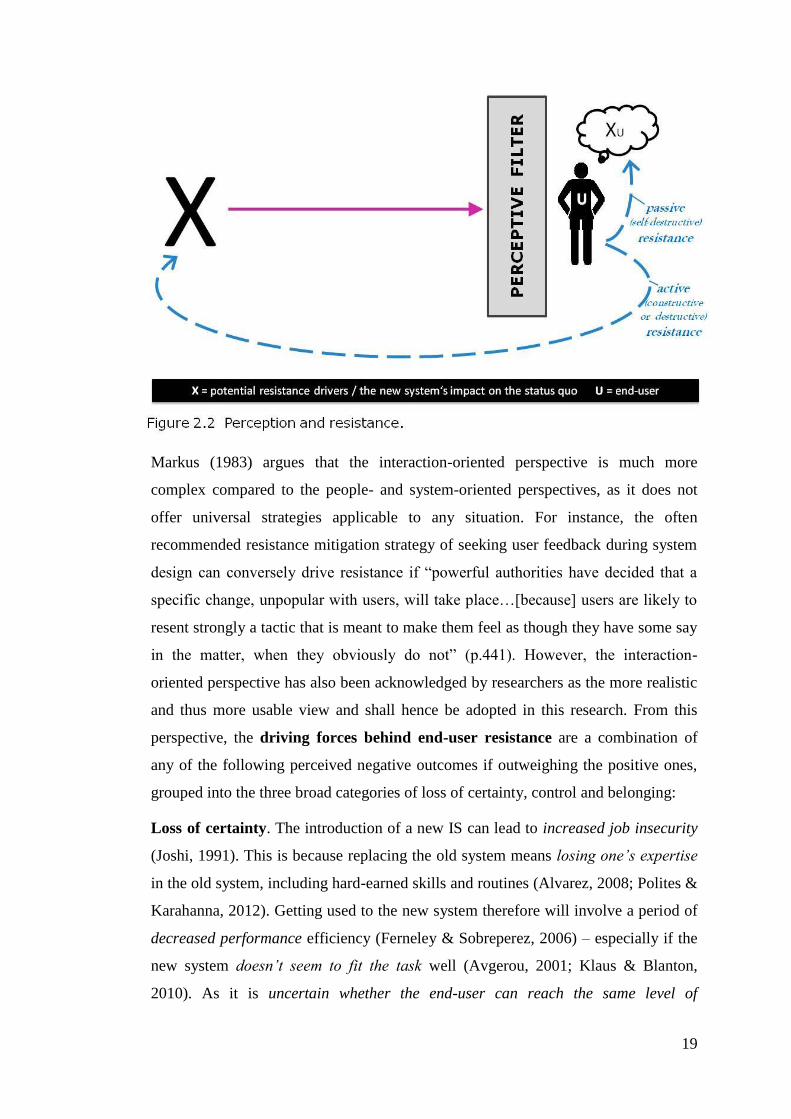
(Beynon-Davies, 1999; Walber, 2003). This means that the end-user compares and
evaluates the actual or anticipated future state of the new system against the status
quo of the old one: The (external) changes resulting from the new system’s impact
on the status quo – as potential resistance drivers – pass through the user’s perceptive
filter. If their total sum is perceived negatively, this produces (internal) negative
expectations and attitudes, which are then expressed in (external) resistance
behaviour (Aladwani, 2001; Davis, 1993; Meissonier & Houzé, 2010). In short, end-
user resistance follows a subjective negative appraisal of the outputs/inputs,
benefits/costs or opportunities/threats contained in the socio-political organisational
context of the new IS’s introduction (Joshi, 1991; Kim, 2011; Lapointe & Rivard,
2005) (Fig.2.2). Its magnitude is determined by both the size of the negative
outcomes and their subjectively perceived importance (Markus, 1983).
19
Markus (1983) argues that the interaction-oriented perspective is much more
complex compared to the people- and system-oriented perspectives, as it does not
offer universal strategies applicable to any situation. For instance, the often
recommended resistance mitigation strategy of seeking user feedback during system
design can conversely drive resistance if “powerful authorities have decided that a
specific change, unpopular with users, will take place…[because] users are likely to
resent strongly a tactic that is meant to make them feel as though they have some say
in the matter, when they obviously do not” (p.441). However, the interaction-
oriented perspective has also been acknowledged by researchers as the more realistic
and thus more usable view and shall hence be adopted in this research. From this
perspective, the driving forces behind end-user resistance are a combination of
any of the following perceived negative outcomes if outweighing the positive ones,
grouped into the three broad categories of loss of certainty, control and belonging:
Loss of certainty. The introduction of a new IS can lead to increased job insecurity
(Joshi, 1991). This is because replacing the old system means losing one’s expertise
in the old system, including hard-earned skills and routines (Alvarez, 2008; Polites &
Karahanna, 2012). Getting used to the new system therefore will involve a period of
decreased performance efficiency (Ferneley & Sobreperez, 2006) – especially if the
new system doesn’t seem to fit the task well (Avgerou, 2001; Klaus & Blanton,
2010). As it is uncertain whether the end-user can reach the same level of
20
performance in future (Kim, 2011; Marakas & Hornik, 1996), s/he may feel a loss in
employability and promotional prospects (Joshi, 1991).
Loss of control. The tendency for organisation-wide IS to take control of
information retrieval, organisation and provision leads to decreased job autonomy for
the end-user through system-mediated supervision (C. Elie-Dit-Cosaque et al., 2011;
Joshi, 1991). Moreover, if the end-user is an expert of the old system, s/he will
certainly feel a loss in bargaining power with the transition to the new system
(Avgerou, 2001; Klaus & Blanton, 2010; Markus, 1983) – especially if the status of
other employees increases as a result. Both of these types of power loss are hence
connected to distributive inequity in relation to management or other employees
(Joshi, 1991; Mitchell, Gagné, Beaudry, & Dyer, 2012). The end-user will also feel
less in control due to external pressures of having to acquire new skills and routines
(Alvarez, 2008; Kim, 2011; Polites & Karahanna, 2012) and the increased
quantitative and/or qualitative workload (Joshi, 1991; Klaus & Blanton, 2010).
Loss of belonging. As the new system inevitably changes existing job roles, a lack of
identity-fit and/or value-fit may cause end-users to suffer from an inner conflict
about what their role as part of the organisation is (Alvarez, 2008; Jiang, Muhanna,
& Klein, 2000; Nach & Lejeune, 2010). A lack of involvement in deciding the new
system’s introduction and/or its design (Hirschheim & Newman, 1988; Klaus &
Blanton, 2010) may also confront the end-user’s feeling of belonging or being valued
(Mitchell et al., 2012), particularly if s/he him-/herself doesn’t perceive any need for
replacing the old system (Leonard-Barton & Deschamps, 1988).
All of these drivers lead to increased stress levels (C. Elie-Dit-Cosaque et al., 2011;
Marakas & Hornik, 1996; Polites & Karahanna, 2012) and decreased job satisfaction
and motivation (Klaus & Blanton, 2010; Mitchell et al., 2012). Moreover, their
subjective significance is amplified if managers as the system implementers do not
adequately deal with them (i.e., too little or too late organisational support, training
and/or communication) (Beaudry & Pinsonneault, 2005; Hirschheim & Newman,
1988; Marakas & Hornik, 1996; Mitchell et al., 2012), if managers are distrusted
(Avgerou, 2001; Selander & Henfridsson, 2011), and/or if influential others (e.g.,
colleagues or supervisors) engage in resistance attitudes and behaviours (Beaudry &
Pinsonneault, 2005; Kim & Kankanhalli, 2009; Leonard-Barton & Deschamps, 1988;
Martinko et al., 1996).
21
2.3 Critical Success Factors of Managerial Pre-Implementation,
Pro-System Communication
2.3.1 Definition of Communication and Its Link to Resistance
Communication is defined as “a process by which information is exchanged between
individuals through a common system of symbols, signs, or behavior” (Merriam-
Webster Online Dictionary, 2012a). The coding system includes anything that carries
a commonly shared meaning, such as spoken and written language, facial
expressions, gestures, rituals, graphics, colours, etc. (Gill & Adams, 2002).
Therefore, communication takes place when the speaker encodes his/her (internal)
thoughts into a formal (external) message and transmits it to the listener, who must
then encode it to (internally) receive it (Shannon & Weaver, 1949). It succeeds if the
listener ‘correctly’ interprets the speaker’s intended message (Gerbner, 1956).
Successful communication, hence, depends on the speaker’s and listener’s shared
knowledge (Hall, 1959; Trompenaars & Hampden-Turner, 1997). However, it is also
influenced by ‘noise’, i.e., other sources of information including the listener’s first-
hand experience of the object of communication and other people’s messages about
this object (Fiske, 2011; Shannon & Weaver, 1949; Westley & MacLean, 1957).
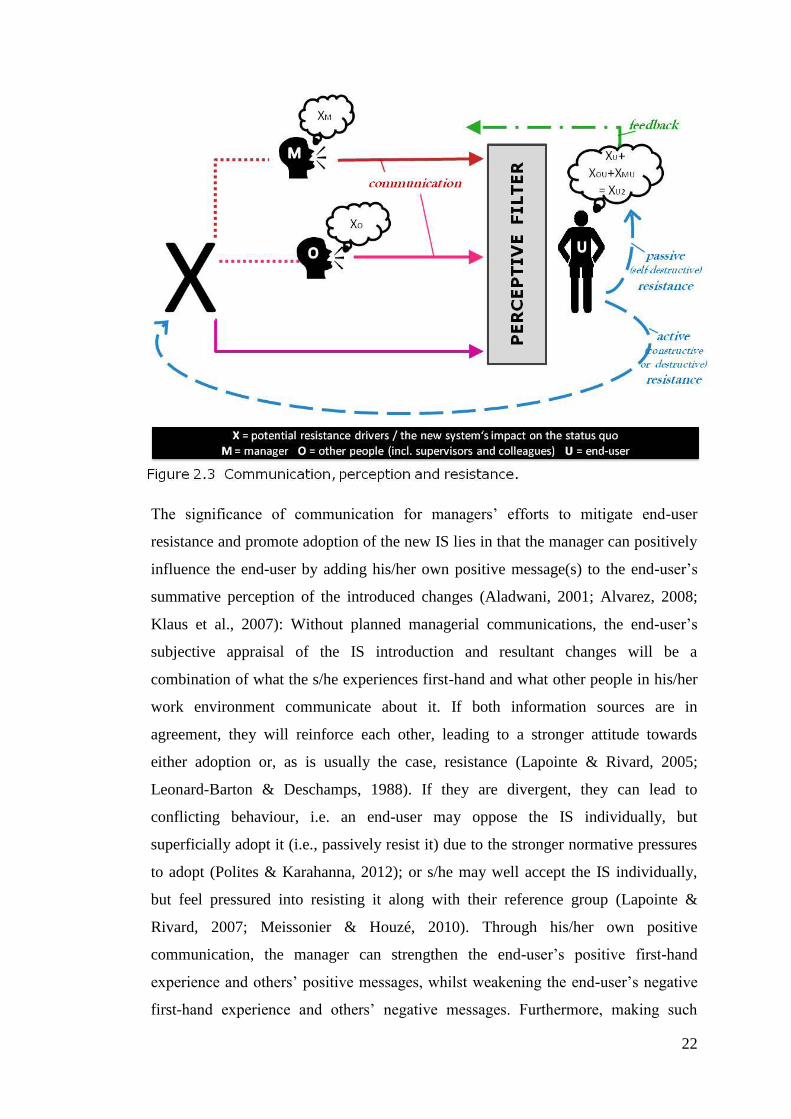
In the IS implementation context, the speaker is the manager, the listener is the end-
user (or vice versa in the case of feedback), the object of communication is the new
IS and its resultant changes, and other people include the end-user’s supervisor
(Markus, 1983), his/her colleagues (Beaudry & Pinsonneault, 2010) and incumbent
system experts (Klaus & Blanton, 2010) (Fig.2.3). Managerial communication can
range from implicit suggestive actions (e.g., providing training) to explicit verbal
messages (e.g., giving a speech about the new system’s benefits) (Leonard-Barton &
Deschamps, 1988), using communication channels like reference documentation,
newsletters, regular informal meetings, orientation sessions, etc. (Jiang et al., 2000;
Klaus & Blanton, 2010).
22
The significance of communication for managers’ efforts to mitigate end-user
resistance and promote adoption of the new IS lies in that the manager can positively
influence the end-user by adding his/her own positive message(s) to the end-user’s
summative perception of the introduced changes (Aladwani, 2001; Alvarez, 2008;
Klaus et al., 2007): Without planned managerial communications, the end-user’s
subjective appraisal of the IS introduction and resultant changes will be a
combination of what the s/he experiences first-hand and what other people in his/her
work environment communicate about it. If both information sources are in
agreement, they will reinforce each other, leading to a stronger attitude towards
either adoption or, as is usually the case, resistance (Lapointe & Rivard, 2005;
Leonard-Barton & Deschamps, 1988). If they are divergent, they can lead to
conflicting behaviour, i.e. an end-user may oppose the IS individually, but
superficially adopt it (i.e., passively resist it) due to the stronger normative pressures
to adopt (Polites & Karahanna, 2012); or s/he may well accept the IS individually,
but feel pressured into resisting it along with their reference group (Lapointe &
Rivard, 2007; Meissonier & Houzé, 2010). Through his/her own positive
communication, the manager can strengthen the end-user’s positive first-hand
experience and others’ positive messages, whilst weakening the end-user’s negative
first-hand experience and others’ negative messages. Furthermore, making such
23
communication two-way by providing end-users with a feedback channel, i.e., a
legitimate outlet for expressing their opposition, s/he can encourage end-users to
engage in constructive rather than more destructive forms of resistance (Fig.2.3).
2.3.2 Critical Success Factors of Managerial Pre-Implementation
Communication
IS researchers recommend the following managerial pre-implementation, pro-system
communication strategies, grouped into the three broad categories of certainty,
control and belonging:
Certainty. Joshi (1991) suggests that managers should reassure about end-users’ job
security, either explicitly through words, or implicitly by revising employees’
contracts to reflect the changes in job content resulting from the new system’s
introduction. This includes revising job titles and descriptions, but should be avoided
if leading to a demotion (cf. Jiang et al., 2000; Markus, 1983). He further
recommends setting in place transparent, consistent procedures to reassure users of
fair treatment. Other researchers argue that managers can reduce uncertainty by
explaining how the new system will work (Kim, 2011) and how users can reuse
previous investments (Martinko et al., 1996), and that managers should describe the
exact changes to occur (Jiang et al., 2000; Kim, 2011) at what stages of the planning
process (Klaus & Blanton, 2010; Klaus et al., 2007). Martinko et al. (1996)
emphasise that these implementation stages should be completed in order of
achievability, i.e., beginning with the most achievable stage to reassure users through
early successful experiences.
Control. Researchers recommend alleviating the stress induced by the additional
workload (including new skills and routines acquirement) by hiring temporary staff
(Joshi, 1991; Klaus et al., 2007) and temporarily reducing performance targets
(Beaudry & Pinsonneault, 2005; Kim & Kankanhalli, 2009). They further argue that
managers should motivate end-users by explaining how they can gain benefits from
the new system (Beaudry & Pinsonneault, 2010; Kim, 2011), rewarding their efforts
with skills certificates (Joshi, 1991; Markus, 1983) and providing sufficient hands-on
training (Aladwani, 2001; Jiang et al., 2000; Martinko et al., 1996; Polites &
Karahanna, 2012). Besides, Klaus et al. (2007) suggest empowering users through
24
feedback channels, and Joshi (1991) argue that managers can address users’ decrease
in power in relation to others by explaining how the employer’s and other employees’
work inputs make them deserve such power increase.
Belonging. Joshi (1991) argues that managers can communicate to end-users that
they are valued members of the organisation by acknowledging their adaptation
efforts explicitly (e.g., expressing sympathy) or implicitly (e.g., giving appreciation
letters or extra pay) (cf. Beaudry & Pinsonneault, 2005; Jiang et al., 2000; Kwahk &
Kim, 2007). Such promotion of end-users’ relationship with the organisation, he
argues, should further be addressed by taking the time to explain the company’s
reasons for introducing the new system (cf. Mitchell et al., 2012). He also
recommends managers to support users emotionally by providing individual
counselling services (cf. Jiang et al., 2000) or an online blog/forum (Beaudry &
Pinsonneault, 2010).
Cadle & Yeates (2001) and other researchers emphasise that the success of any pre-
implementation strategy depends on how it fits into the IS implementation’s overall
picture, i.e., it must be part of an integrated pre- to post-implementation
communications plan (cf. also Bradley, Pridmore, & Byrd, 2006; Orna, 2006). This
is because the end-user appraisal is not a one-off but an iterative process (Klaus &
Blanton, 2010; Lapointe & Rivard, 2005) which, ideally, becomes more and more
positive as a result of managerial communications (Beaudry & Pinsonneault, 2005).
If management disregards how their pre-implementation communications fit into the
overall plan, they risk creating too positive, unrealistic expectations, hence merely
delaying or even causing the onset of resistance during post-implementation
(Alvarez, 2008). To, instead, lead end-users from a state of potential resistance to
that of (ideally) whole-hearted adoption, managers must regularly (re)evaluate the
end-user’s current state and match their strategies accordingly (Aladwani, 2001;
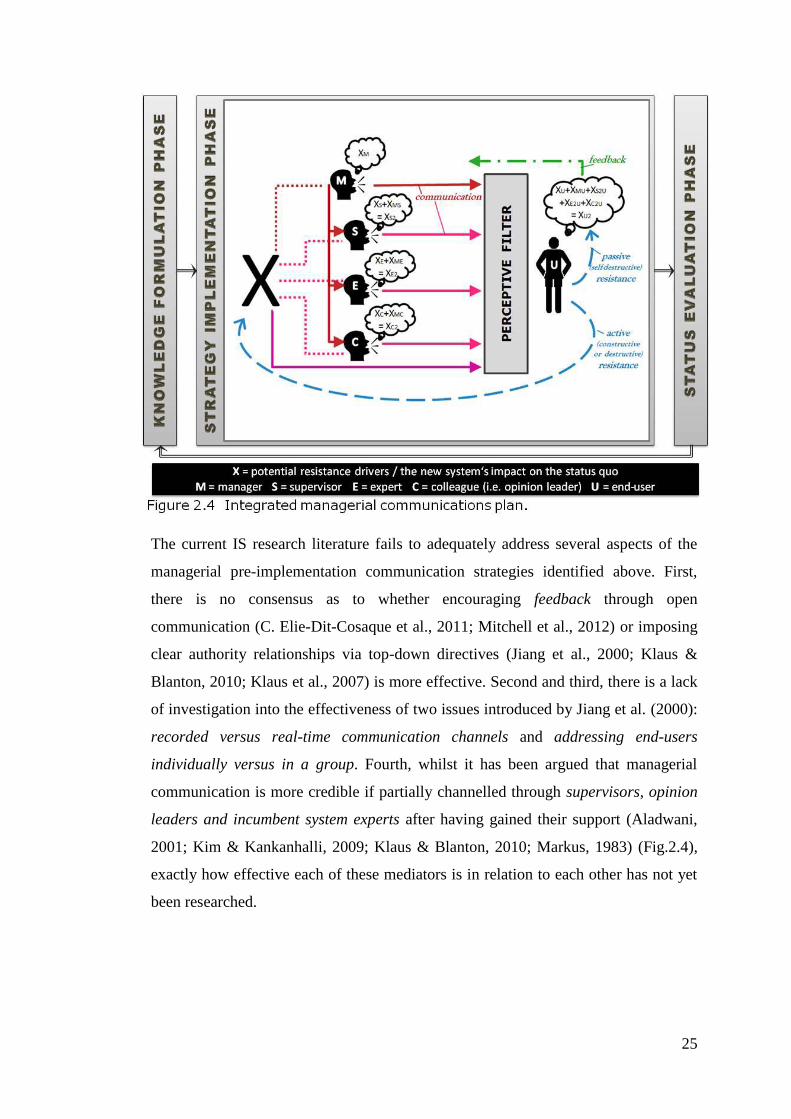
Leonard-Barton & Deschamps, 1988) (Fig.2.4). At the same time, their
communications must be ongoing to accommodate different types of end-users (C.
M. Elie-Dit-Cosaque & Straub, 2011; Klaus et al., 2007), particularly late adopters
(Nach & Lejeune, 2010).
25
The current IS research literature fails to adequately address several aspects of the
managerial pre-implementation communication strategies identified above. First,
there is no consensus as to whether encouraging feedback through open
communication (C. Elie-Dit-Cosaque et al., 2011; Mitchell et al., 2012) or imposing
clear authority relationships via top-down directives (Jiang et al., 2000; Klaus &
Blanton, 2010; Klaus et al., 2007) is more effective. Second and third, there is a lack
of investigation into the effectiveness of two issues introduced by Jiang et al. (2000):
recorded versus real-time communication channels and addressing end-users
individually versus in a group. Fourth, whilst it has been argued that managerial
communication is more credible if partially channelled through supervisors, opinion
leaders and incumbent system experts after having gained their support (Aladwani,
2001; Kim & Kankanhalli, 2009; Klaus & Blanton, 2010; Markus, 1983) (Fig.2.4),
exactly how effective each of these mediators is in relation to each other has not yet
been researched.
26
2.4 British, German and Japanese Cultural Variations of the
Critical Success Factors of Managerial Pro-System Communication
2.4.1 Definition of Culture and Its Link to Communication
Culture is defined as “the collective programming of the mind which distinguishes the
members of one human group from another” (G. H. Hofstede, 1984, p. 21). In other
words, different groups of people, such as different national cultures, function under
different ‘mental software’, which (partially) shapes their likely thoughts, feelings
and behaviours. For the individual, it is relatively unchanging once acquired during
childhood (G. H. Hofstede, Hofstede, & Minkov, 2010).
Culture has been likened to an onion (Trompenaars & Hampden-Turner, 1997): Its
invisible yet most significant core consists of our most taken-for-granted values or
assumptions about the world (e.g., good versus evil, natural versus unnatural) (Hall,
1976; G. H. Hofstede et al., 2010). The middle layer consists of our relatively
unquestioned norms and institutions (e.g., educational system). The outer layer
consists of culture’s most visible products (e.g., rituals, language) (Trompenaars &
Hampden-Turner, 2012). Whilst the outer layers may noticeably change over time,
the cultural core remains very stable as it is unconsciously passed on to the next
generation (G. H. Hofstede et al., 2010). Any culture, therefore, fundamentally
consists of several core values (also called cultural orientations or dimensions) which
are shared by its members (Fink, Kölling, & Neyer, 2005). The total number of a
culture’s dimensions, according to Hills (2002), is determined solely by the
researcher’s decision as to how far to generalise, ranging from as few as Hofstede
(1984)’s originally 4 to as many as Rokeach (1979)’s 36 dimensions (p.3).
These cultural core values or dimensions serve its members as guiding principles for
interpreting and reacting to the physical reality they perceive (Kluckhohn &
Strodtbeck, 1961; Trompenaars & Hampden-Turner, 1997). According to Hofstede
et al. (2010), they are the middle part of its members’ three-part perceptive filter,
with ‘human nature’ partially determining ‘culture’ and ‘culture’ partially
determining ‘individuality’ (i.e., personality, age, prior experiences, etc.). The end-
user’s perception of managerial communication, then, is influenced by his/her
identity as a human, as a member of a cultural group and as an individual (Fig.2.5).
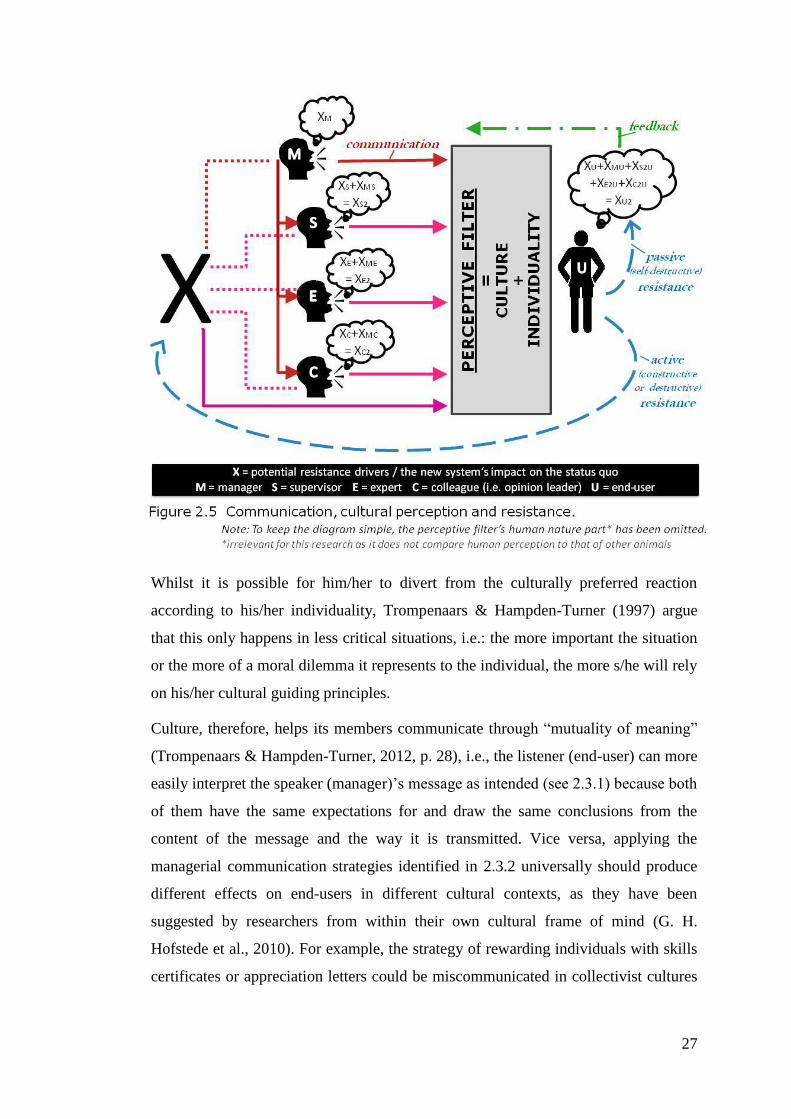
27
Whilst it is possible for him/her to divert from the culturally preferred reaction
according to his/her individuality, Trompenaars & Hampden-Turner (1997) argue
that this only happens in less critical situations, i.e.: the more important the situation
or the more of a moral dilemma it represents to the individual, the more s/he will rely
on his/her cultural guiding principles.
Culture, therefore, helps its members communicate through “mutuality of meaning”
(Trompenaars & Hampden-Turner, 2012, p. 28), i.e., the listener (end-user) can more
easily interpret the speaker (manager)’s message as intended (see 2.3.1) because both
of them have the same expectations for and draw the same conclusions from the
content of the message and the way it is transmitted. Vice versa, applying the
managerial communication strategies identified in 2.3.2 universally should produce
different effects on end-users in different cultural contexts, as they have been
suggested by researchers from within their own cultural frame of mind (G. H.
Hofstede et al., 2010). For example, the strategy of rewarding individuals with skills
certificates or appreciation letters could be miscommunicated in collectivist cultures
28
as demotivating, since it alienates these individuals from the group (Trompenaars &
Hampden-Turner, 2012). We hence obtain our first hypothesis:
H1: End-users from different countries perceive the same managerial pre-
implementation, pro-system communication differently.
2.4.2 Selection of Cultural Studies for this Research
In cultural research there are two opposing research approaches: the etic versus the
emic. The etic or culture-general approach analyses culture from the outside. Often,
the researcher preconceives and then applies some cultural dimensions to many
national cultures in order to obtain relative country scores, which represent the
statistical probability that members of a culture will react in a certain way in
comparison to other cultures (Fink et al., 2005; Triandis, 1994). The emic or culture-
specific approach, on the other hand, analyses culture from the inside. Here, the
researcher starts by observing a group’s actual behaviour in order to discover the
concepts unique to that culture (Holt, 2011; Pike, 1985).
Whilst the etic approach has dominated cultural research since the 1980s, it has been
criticised a) for providing oversimplified hence misleading images of cultures which
in fact consist of different smaller cultures (Baskerville, 2003; Holliday, 1999); b) for
the assumption of stable cultural scores when in fact cultures are constantly
changing, especially with the effects of globalisation (McSweeney, 2002; Myers &
Tan, 2003); and c) for the bias inherent in the preconception of the dimensions as etic
researchers are bound by their own cultural perception (G. H. Hofstede et al., 2010;
Javidan, House, Dorfman, Hanges, & de Luque, 2006). The since the 2000s
increasingly popular emic approach solves these limitations by refraining from fitting
cultures into preconceived frameworks and instead capturing all of a smaller
culture’s dimensions including those that do not exist in other cultures (Holliday,
1999; Watkins & Gnoth, 2011). Whilst it thus provides detailed hence more realistic
cultural images, it is disadvantageous for cross-cultural comparisons which rely on
standard units (Holt, 2011; Sayer, 1997). For example, from a British and German
viewpoint, the Japanese culture appears very hierarchical with its great concern for
showing respect to seniors (through honorific language, deeper bows, etc.); however,
from the perspective of other, more hierarchical East Asian countries, the opposite
29
holds true (itim, 2012a). Thus, the etic as a comparative cultural approach is still
relevant even today (Myers & Tan, 2003; Tsui, Nifadkar, & Ou, 2007).
Therefore, this research will rely on etic researchers’ findings to deduct the
hypotheses needed for designing the comparative empirical research – the findings of
which, however, will be explained using both etic and emic research studies (see
3.4).
The selection of etic studies is based on four reliability-maximising criteria: large
sample sizes; long-term significance for and acceptance in both cultural and
managerial research; non-abstract questionnaire items1; and complementariness to
overcome any one model’s limitations (Bailey, 1994; Hills, 2002; Javidan & House,
2002; Lapointe & Rivard, 2007). First, Geert Hofstede’s (now 6-2 but originally) 4-
dimensional3 study from 1980 is chosen as the to-date most influential cultural study
with over 70 replications (Taras, Kirkman, & Steel, 2010; Tsui et al., 2007). Second,
Fons Trompenaars & Charles Hampden-Turner’s 7-dimensional4 study from 1993 as
another influential large-scale study (Fink et al., 2005; Javidan & House, 2002; Tsui
et al., 2007) is chosen for its more emic approach (Watkins & Gnoth, 2011) in
regarding the dimensional scores not as fixed but as dependent upon the particular
situation (Trompenaars & Hampden-Turner, 2012). With a separate dimension for
emotions it also complements Hofstede’s study which incorporates them into all four
dimensions causing several contradictions. Third, Edward T. Hall (1959, 1976)’s
widely cited context of communication has been chosen as the up-to-date sole
cultural dimension which specifically focuses on communication.
As will become clear in the next section, only the five most relevant dimensions of
these three etic studies have been selected (see 2.4.3).
1 For example, the more recent GLOBE study asks respondents to evaluate the statement that
“Most people should lead highly structured lives with few unexpected events” (House,
Javidan, & Dorfman, 2001, p. 497). But what is perceived as a highly structured life with
few events is different in different cultures, so the reliability in comparing the ratings of such
abstract judgemental questions is questionable.
2 added in 1991 (G. Hofstede & Bond, 1988; G. H. Hofstede, 2001) and 2010 (G. H.
Hofstede, Hofstede, & Minkov, 2010; Smith, 2008)
3 derived from a statistical factor analysis of questionnaire responses
4 conceptually based on Kluckhohn & Strodtbeck (1961)’s 6-dimensional study
30
2.4.3 Hypothetical British, German and Japanese Cultural Variations of
the Critical Success Factors of Managerial Communication
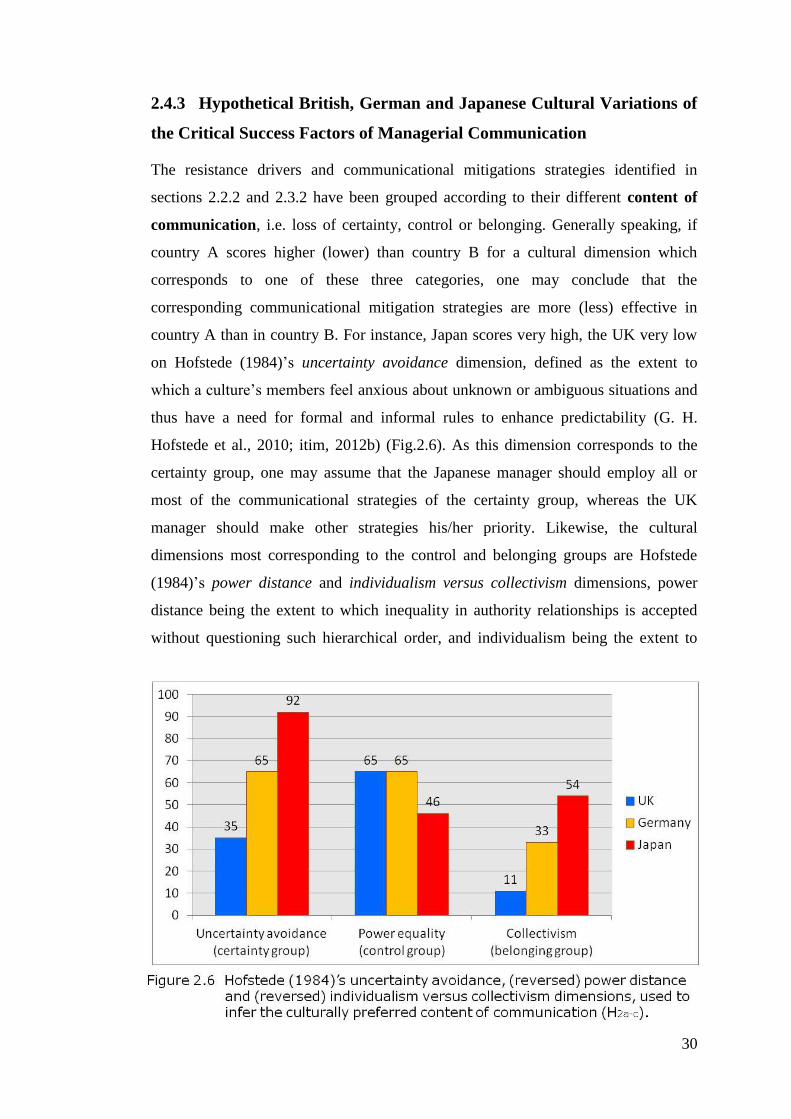
The resistance drivers and communicational mitigations strategies identified in
sections 2.2.2 and 2.3.2 have been grouped according to their different content of
communication, i.e. loss of certainty, control or belonging. Generally speaking, if
country A scores higher (lower) than country B for a cultural dimension which
corresponds to one of these three categories, one may conclude that the
corresponding communicational mitigation strategies are more (less) effective in
country A than in country B. For instance, Japan scores very high, the UK very low
on Hofstede (1984)’s uncertainty avoidance dimension, defined as the extent to
which a culture’s members feel anxious about unknown or ambiguous situations and
thus have a need for formal and informal rules to enhance predictability (G. H.
Hofstede et al., 2010; itim, 2012b) (Fig.2.6). As this dimension corresponds to the
certainty group, one may assume that the Japanese manager should employ all or
most of the communicational strategies of the certainty group, whereas the UK
manager should make other strategies his/her priority. Likewise, the cultural
dimensions most corresponding to the control and belonging groups are Hofstede
(1984)’s power distance and individualism versus collectivism dimensions, power
distance being the extent to which inequality in authority relationships is accepted
without questioning such hierarchical order, and individualism being the extent to
31
which a culture’s members see themselves as individuals independent from ‘in-
groups’ (such as family or work colleagues (Allport, 1954)), implying that they are
motivated by self- over in-group interests (Trompenaars & Hampden-Turner, 2012),
without any obligations of loyalty in exchange for protection (G. H. Hofstede et al.,
2010; itim, 2012b). Note that the scores of these two dimensions had to be reversed
(i.e., 100 – score) (Fig.2.6).
An overall comparison of the three dimensions using Figure 2.6 gives us the
following hypotheses:
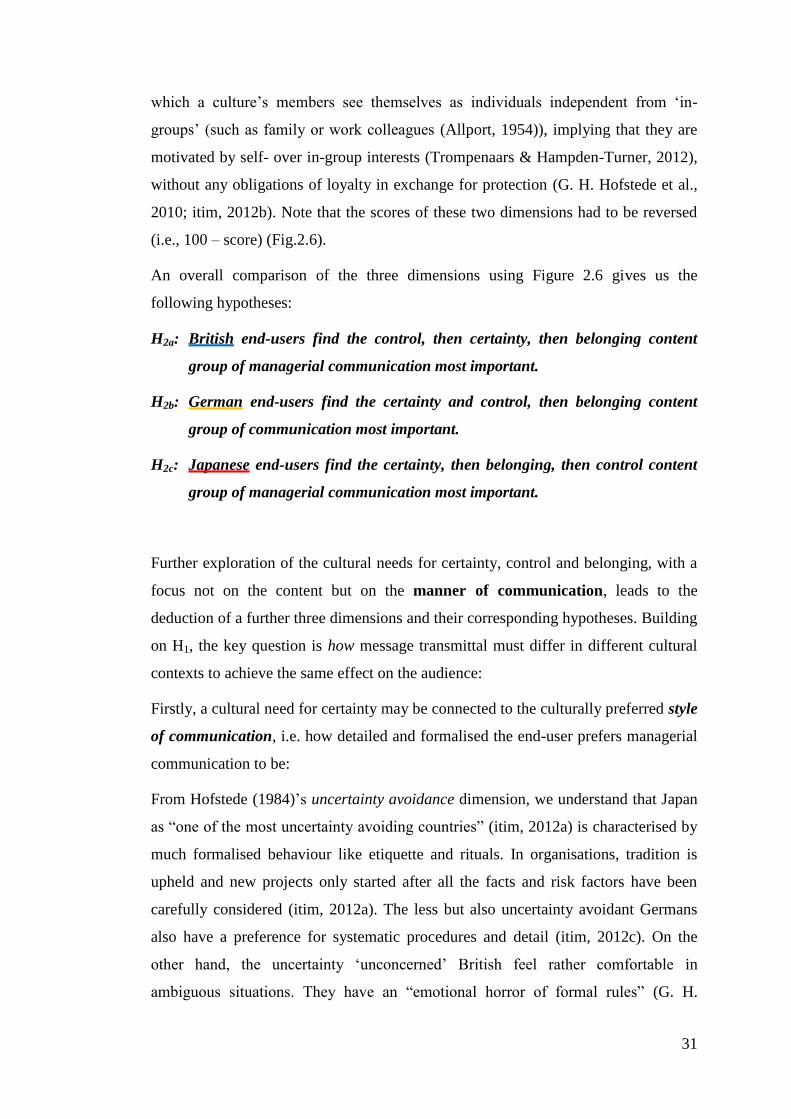
H2a: British end-users find the control, then certainty, then belonging content
group of managerial communication most important.
H2b: German end-users find the certainty and control, then belonging content
group of communication most important.
H2c: Japanese end-users find the certainty, then belonging, then control content
group of managerial communication most important.
Further exploration of the cultural needs for certainty, control and belonging, with a
focus not on the content but on the manner of communication, leads to the
deduction of a further three dimensions and their corresponding hypotheses. Building
on H1, the key question is how message transmittal must differ in different cultural
contexts to achieve the same effect on the audience:
Firstly, a cultural need for certainty may be connected to the culturally preferred style
of communication, i.e. how detailed and formalised the end-user prefers managerial
communication to be:
From Hofstede (1984)’s uncertainty avoidance dimension, we understand that Japan
as “one of the most uncertainty avoiding countries” (itim, 2012a) is characterised by
much formalised behaviour like etiquette and rituals. In organisations, tradition is
upheld and new projects only started after all the facts and risk factors have been
carefully considered (itim, 2012a). The less but also uncertainty avoidant Germans
also have a preference for systematic procedures and detail (itim, 2012c). On the
other hand, the uncertainty ‘unconcerned’ British feel rather comfortable in
ambiguous situations. They have an “emotional horror of formal rules” (G. H.
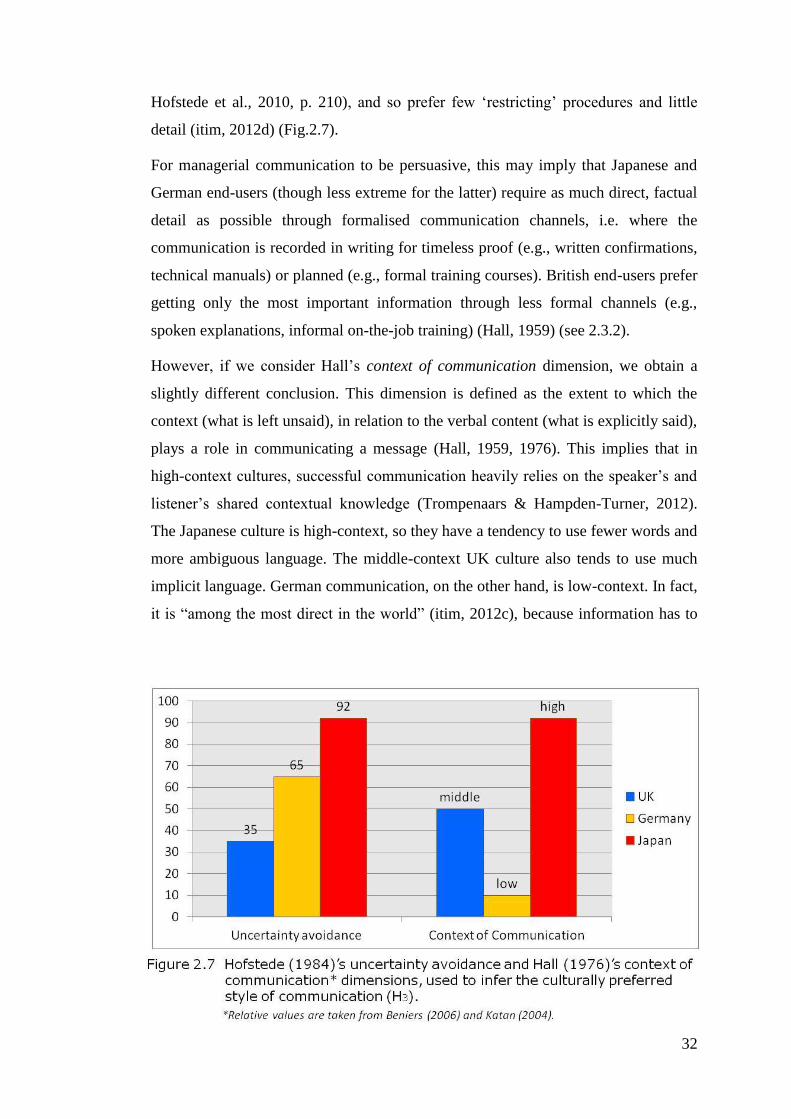
32
Hofstede et al., 2010, p. 210), and so prefer few ‘restricting’ procedures and little
detail (itim, 2012d) (Fig.2.7).
For managerial communication to be persuasive, this may imply that Japanese and
German end-users (though less extreme for the latter) require as much direct, factual
detail as possible through formalised communication channels, i.e. where the
communication is recorded in writing for timeless proof (e.g., written confirmations,
technical manuals) or planned (e.g., formal training courses). British end-users prefer
getting only the most important information through less formal channels (e.g.,
spoken explanations, informal on-the-job training) (Hall, 1959) (see 2.3.2).
However, if we consider Hall’s context of communication dimension, we obtain a
slightly different conclusion. This dimension is defined as the extent to which the
context (what is left unsaid), in relation to the verbal content (what is explicitly said),
plays a role in communicating a message (Hall, 1959, 1976). This implies that in
high-context cultures, successful communication heavily relies on the speaker’s and
listener’s shared contextual knowledge (Trompenaars & Hampden-Turner, 2012).
The Japanese culture is high-context, so they have a tendency to use fewer words and
more ambiguous language. The middle-context UK culture also tends to use much
implicit language. German communication, on the other hand, is low-context. In fact,
it is “among the most direct in the world” (itim, 2012c), because information has to
33
be made explicit to be understood (Beniers, 2006; Hall, 1959, 1976; Katan, 2004)
(Fig.2.7).
This dimension supports the previous supposition that German end-users prefer
detailed, formally communicated information, whereas British end-users prefer the
opposite. Combining the equally high Japanese scores from both cultural dimensions,
however, appears to be contradictory. But as such culturally imposed needs are
situational, (Trompenaars & Hampden-Turner, 2012), we could assume that the
average Japanese will act according to either principle if both dimensions are equally
important. Whilst the end-user situation might give prevalence to one of the
dimensions, for now it is assumed that Japanese end-users are in-between the
German and British extremes. We thus gain our third hypothesis:
H3: For the style of managerial communication, British end-users prefer
informal (spoken or unplanned) gist communications more than Japanese
and German end-users, the latter preferring detailed and formalised (written
or proceduralised) communications the most.
Secondly, a cultural need for control may be connected to the culturally preferred
direction of communication, i.e. whether the end-user prefers managerial
communication to be one-way (closed) or two-way (open):
From Hofstede (1984)’s power distance dimension, we understand that the Japanese
as members of a “mildly hierarchical” culture are constantly concerned with their
social and organisational status in relation to others (itim, 2012a). To some extent,
they “expect to be told what to do” (G. H. Hofstede et al., 2010, p. 73). Whilst both
the UK and Germany have the same low power distance score, for the British this is
reflected in their belief that everyone is equal regardless of their role within the
hierarchy, whereas Germans find unequal power relationships normal if based on
different levels of expertise (itim, 2012c, 2012d) (Fig.2.8).
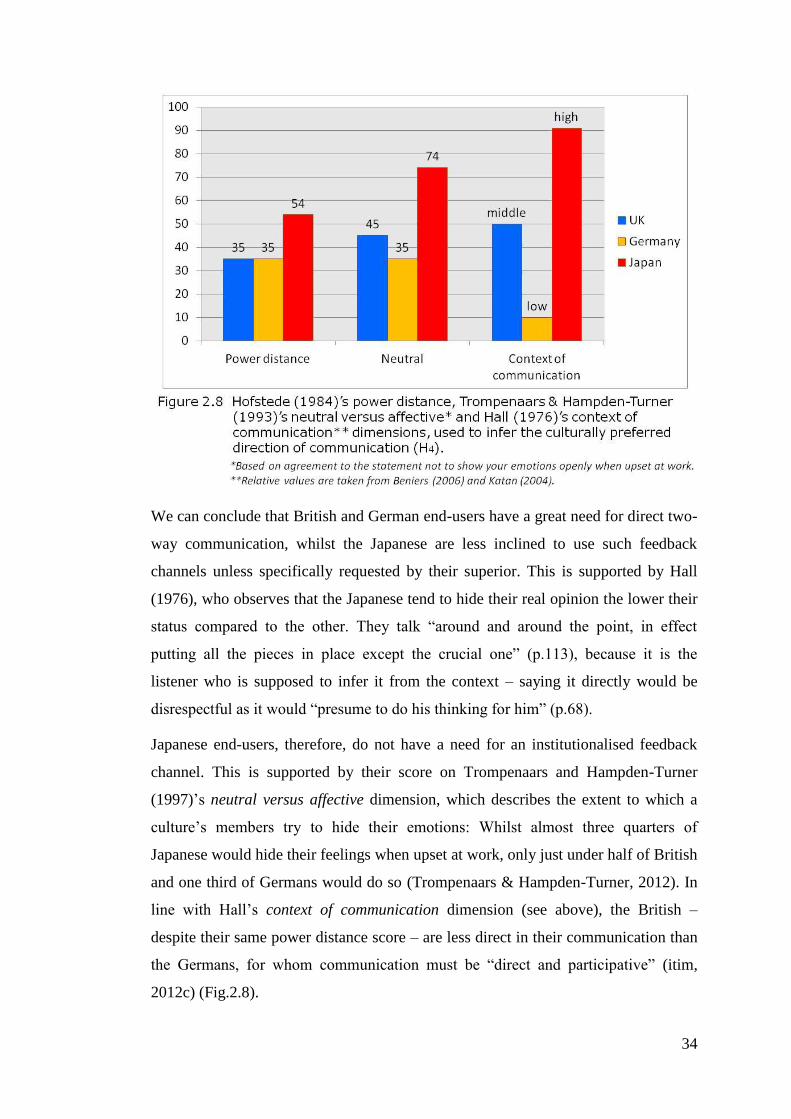
34
We can conclude that British and German end-users have a great need for direct two-
way communication, whilst the Japanese are less inclined to use such feedback
channels unless specifically requested by their superior. This is supported by Hall
(1976), who observes that the Japanese tend to hide their real opinion the lower their
status compared to the other. They talk “around and around the point, in effect
putting all the pieces in place except the crucial one” (p.113), because it is the
listener who is supposed to infer it from the context – saying it directly would be
disrespectful as it would “presume to do his thinking for him” (p.68).
Japanese end-users, therefore, do not have a need for an institutionalised feedback
channel. This is supported by their score on Trompenaars and Hampden-Turner
(1997)’s neutral versus affective dimension, which describes the extent to which a
culture’s members try to hide their emotions: Whilst almost three quarters of
Japanese would hide their feelings when upset at work, only just under half of British
and one third of Germans would do so (Trompenaars & Hampden-Turner, 2012). In
line with Hall’s context of communication dimension (see above), the British –
despite their same power distance score – are less direct in their communication than
the Germans, for whom communication must be “direct and participative” (itim,
2012c) (Fig.2.8).
35
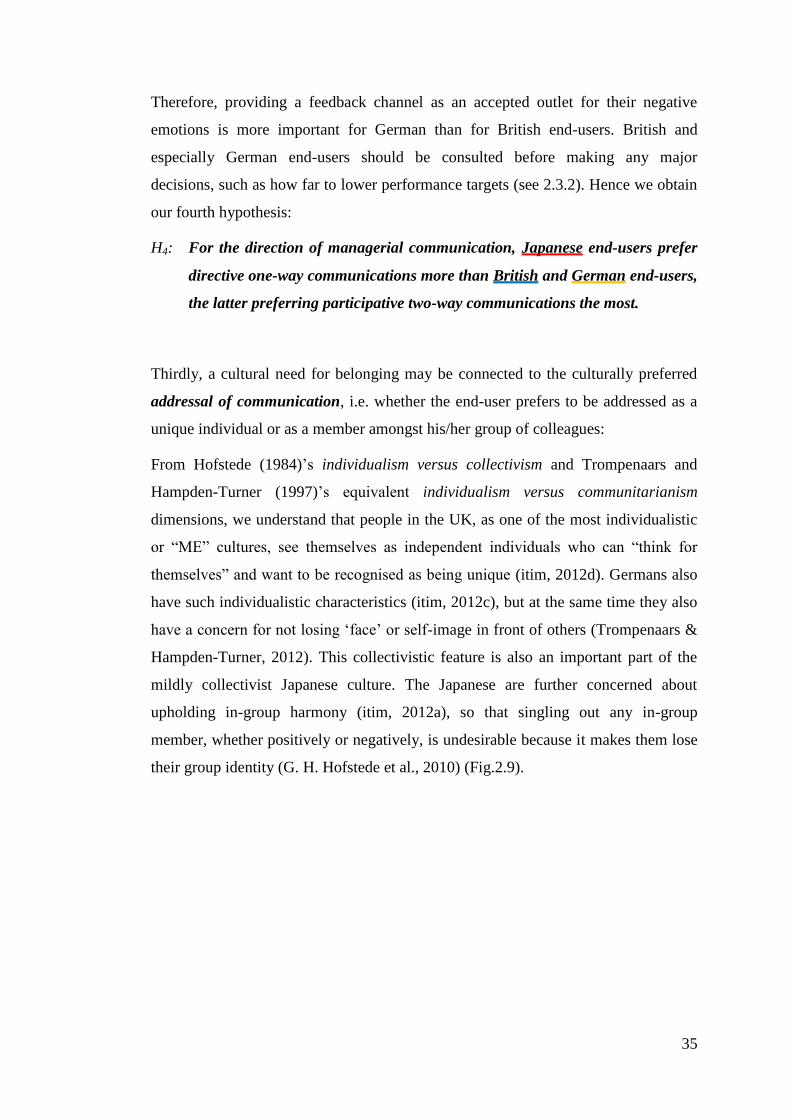
Therefore, providing a feedback channel as an accepted outlet for their negative
emotions is more important for German than for British end-users. British and
especially German end-users should be consulted before making any major
decisions, such as how far to lower performance targets (see 2.3.2). Hence we obtain
our fourth hypothesis:
H4: For the direction of managerial communication, Japanese end-users prefer
directive one-way communications more than British and German end-users,
the latter preferring participative two-way communications the most.
Thirdly, a cultural need for belonging may be connected to the culturally preferred
addressal of communication, i.e. whether the end-user prefers to be addressed as a
unique individual or as a member amongst his/her group of colleagues:
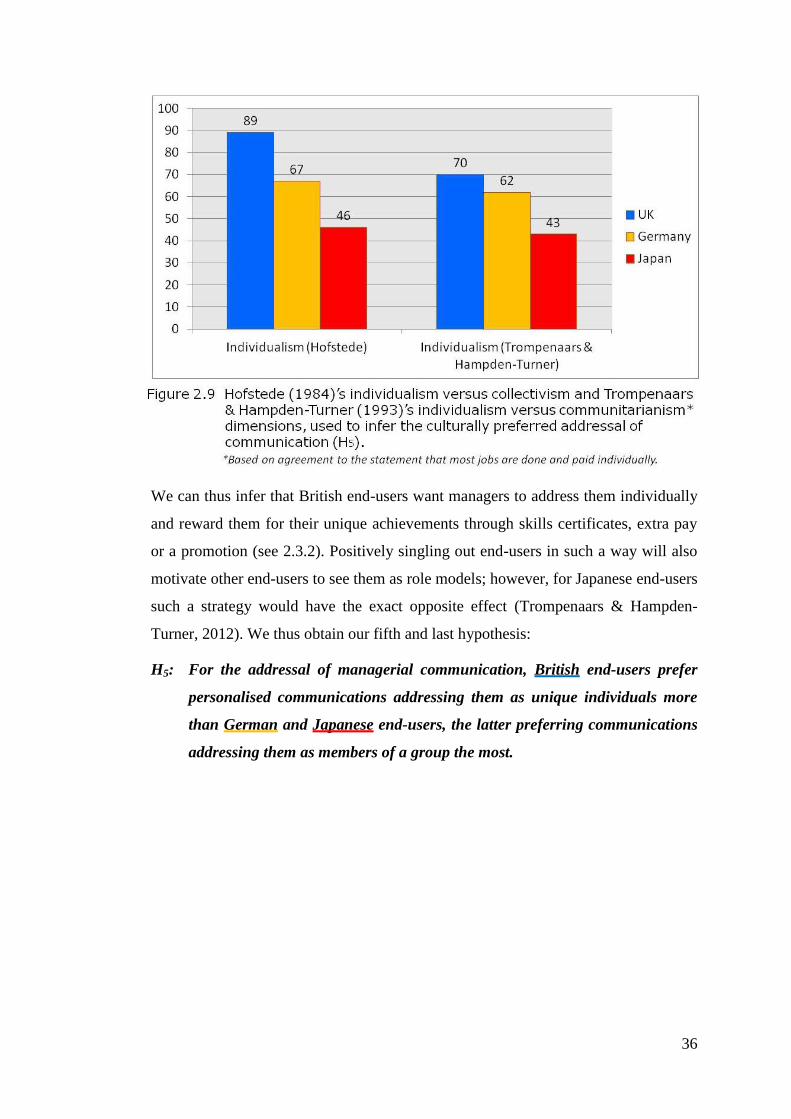
From Hofstede (1984)’s individualism versus collectivism and Trompenaars and
Hampden-Turner (1997)’s equivalent individualism versus communitarianism
dimensions, we understand that people in the UK, as one of the most individualistic
or “ME” cultures, see themselves as independent individuals who can “think for
themselves” and want to be recognised as being unique (itim, 2012d). Germans also
have such individualistic characteristics (itim, 2012c), but at the same time they also
have a concern for not losing ‘face’ or self-image in front of others (Trompenaars &
Hampden-Turner, 2012). This collectivistic feature is also an important part of the
mildly collectivist Japanese culture. The Japanese are further concerned about
upholding in-group harmony (itim, 2012a), so that singling out any in-group
member, whether positively or negatively, is undesirable because it makes them lose
their group identity (G. H. Hofstede et al., 2010) (Fig.2.9).
36
We can thus infer that British end-users want managers to address them individually
and reward them for their unique achievements through skills certificates, extra pay
or a promotion (see 2.3.2). Positively singling out end-users in such a way will also
motivate other end-users to see them as role models; however, for Japanese end-users
such a strategy would have the exact opposite effect (Trompenaars & Hampden-
Turner, 2012). We thus obtain our fifth and last hypothesis:
H5: For the addressal of managerial communication, British end-users prefer
personalised communications addressing them as unique individuals more
than German and Japanese end-users, the latter preferring communications
addressing them as members of a group the most.
37
2.5 Conclusion and Empirical Research Framework
Complemented by some relevant communicational models, the review of the
English-language, end-user resistance IS research and comparative cultural research
literatures laid the groundwork for hypothesis H1, which predicts the culturally
different perception of managerial communications and which, in turn, underlies the
subsequent hypotheses H2-5. Each sub-section first provided a general definition of
resistance, communication or culture and indicated their interlinkedness, followed by
the main argument addressing objective 1, 2 or 3: The first section identified and
contrasted the driving forces behind end-user resistance from the people-, system-
and interaction-oriented perspectives (i.e., people’s individual characteristics, versus
dissatisfying system characteristics, versus negatively appraised totality of socio-
political changes), and classified the latter into three content categories of loss of
certainty (e.g., increased job insecurity), control (e.g., increased workload and a
power decrease) or belonging (e.g., lack of identity- and value-fit). The second
section identified the for these drivers suggested communicational, pre-
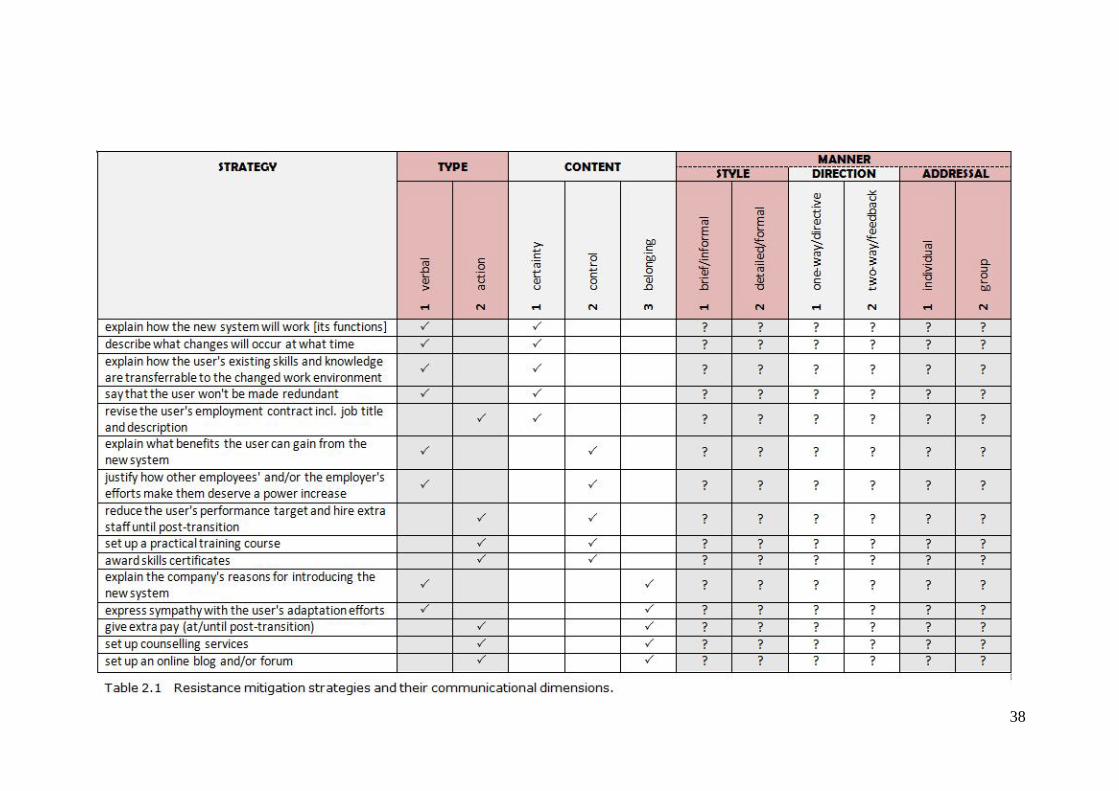
implementation mitigation strategies (summarised in Table 2.1), and indicated their
need to be part of an integrated and iterative communications plan in order to
effective. The third section explored the potential variations of these
communications’ effectiveness in the different national cultures of the UK, Germany
and Japan and deducted hypotheses H2-5, which predict the culturally preferred
content and manner [style, direction and addressal] of managerial communications.
38
39
The IS research literature demonstrated an evident gap in knowledge concerning the
impact of culture on end-user resistance and its mitigation. Furthermore, four aspects
of the managerial communication strategies recommended by researchers were found
to be lacking either investigation or consensus: the effectiveness of directive versus
feedback-allowing communications, of formal versus informal communications, of
communications addressing individuals versus the group, and of different mediators
like supervisors, opinion leaders or incumbent system experts. Three of these are
addressed by the deducted hypotheses of communicational manner. These evident
needs for further research, therefore, constitute the value of this dissertation’s
empirical research. Figure 2.10 summarises the research framework, and the next
chapter will describe and justify the methods chosen to collect and analyse the
empirical data.
40
Chapter 3: Research Methods
3.1 Introduction
From the IS research literature, the previous chapter has identified the drivers of end-
user resistance and the, for their mitigation suggested, managerial communication
strategies. It has also indicated a general lack of investigation into such
communication’s (i) effectiveness of manner (i.e., style, direction and addressal) (see
2.3.2) and (ii) the impact of culture on its perception (see 2.4.1, H1), both of which
appeared to be interrelated (see 2.4.3, H2-H5). This dissertation’s empirical research
pioneers in an attempt at filling this two-fold knowledge gap, targeting objective
(4) To investigate British, German and Japanese end-users’ attitudes towards
different managerial pre-implementation communications.
This chapter seeks to elucidate the research’s methodology. It is structured as
follows: First, the chosen research strategy, sampling method, data collection
technique and instrument design are described and justified. Then, this research’s
ethical issues are addressed and the framework for data analysis is elucidated.
Finally, the limitations and potential problems of this research are discussed.
3.2 Research Strategy, Sample Selection, Data Collection Technique
and Instrument Design
Saunders, Lewis & Thornhill (2009) argue that the selection of appropriate research
methods should be based on what the research aims to achieve. This dissertation
aims to determine the in the British, German and Japanese cultural contexts effective
pre-implementation managerial communication strategies. Through a literature
review, the drivers of end-user resistance, their recommended communicational
mitigation strategies and the potential cultural differences in the preferred content,
style, direction and addressal of such communications were identified (objectives 1-
3). The following empirical research was to collect data on British, German and
Japanese end-users’ actual attitudes towards different managerial pre-
implementation communications (objective 4), in order to confirm or disconfirm the
41
hypotheses made and use the findings to provide recommendations to managers
(objective 5).
The research needs to be met by the chosen research strategy, sampling method, data
collection technique and instrument design were hence:
(a) The identified communication strategies had to be completed along the
dimensions of style, direction and addressal;
(b) The research subjects had to be comparable in terms of the end-users’ job
role prior to and after the IS implementation and the type of IS imposed (i.e.,
the size of the loss), the point in time (i.e., pre-implementation) and the end-
users’ individual traits (i.e., gender, age, personality, prior experiences);
(c) The researcher had to have access to an adequately large5 sample of each of
the three independent target populations (i.e., British, German and Japanese
nationals), which were geographically distant and spoke different languages;
(d) The research instrument’s design, data collection and data analysis had to be
completed within the limited time frame given.
Note that the research’s aim and objectives also reflect its need to be quantitative and
deductive: It was quantitative (i.e., focus on the ‘what’) rather than qualitative (i.e.,
focus on the ‘why’), because up-to-date this was the first study to seek results by
integrating the three research fields of IS, communication and culture; one has to first
discover the facts before one can explore the reasons behind them. Quantitative
research is also particularly suited for measuring attitudes (Creswell, 2003) and is
lacking in IS research (Kim & Kankanhalli, 2009). Moreover, this research was
deductive (i.e., hypotheses precede data collection) rather than inductive (i.e., data
collection precedes hypotheses), because each of the research areas individually
already offered a wealth of information, and because this approach is particularly
suited for comparing groups (Creswell, 2003).
5 Whilst the ideal is 100 respondents per country, it is more important to have approximately
the same number of responses for each sample in order to be able to statistically compare the
answers during data analysis.
42
3.2.1 Research Strategy
The adopted research strategy was scenario planning, addressing research needs (a),
(b), (c) and (d). Following researchers’ advice that simpler scenario approaches are
most effective (De Jouvenel, 2000; Mercer, 1995; I. Wilson, 2000), a simplified
variation combining a base- and sub-scenario approach, Trompenaars & Hampden-
Turner (1997)’s extreme scenario approach and Ritchey (2011a)’s general
morphological analysis (GMA) was used to match this research’s needs.
Scenario planning is about combining different values of at least four situational
variables or dimensions to create alternative future or strategy scenarios (Bradfield,
Wright, Burt, Cairns, & Van Der Heijden, 2005; Coates, 2000). This involves either
drawing all the different paths or branches in a tree structure or listing the variables
and their possible values in columns of a table, to investigate all possible value
combinations either by hand or computer (Fig.3.1-3.2; Table 2.1) (De Jouvenel,
2000; Ritchey, 2011a). Coinciding with the IS resistance interaction-oriented
perspective, these four or more dimensions cannot be visualised using 2D-/3D-
diagrams but also cannot be realistically separated from each other to show causal
relationships, because their meaning is subjectively perceived from their interaction
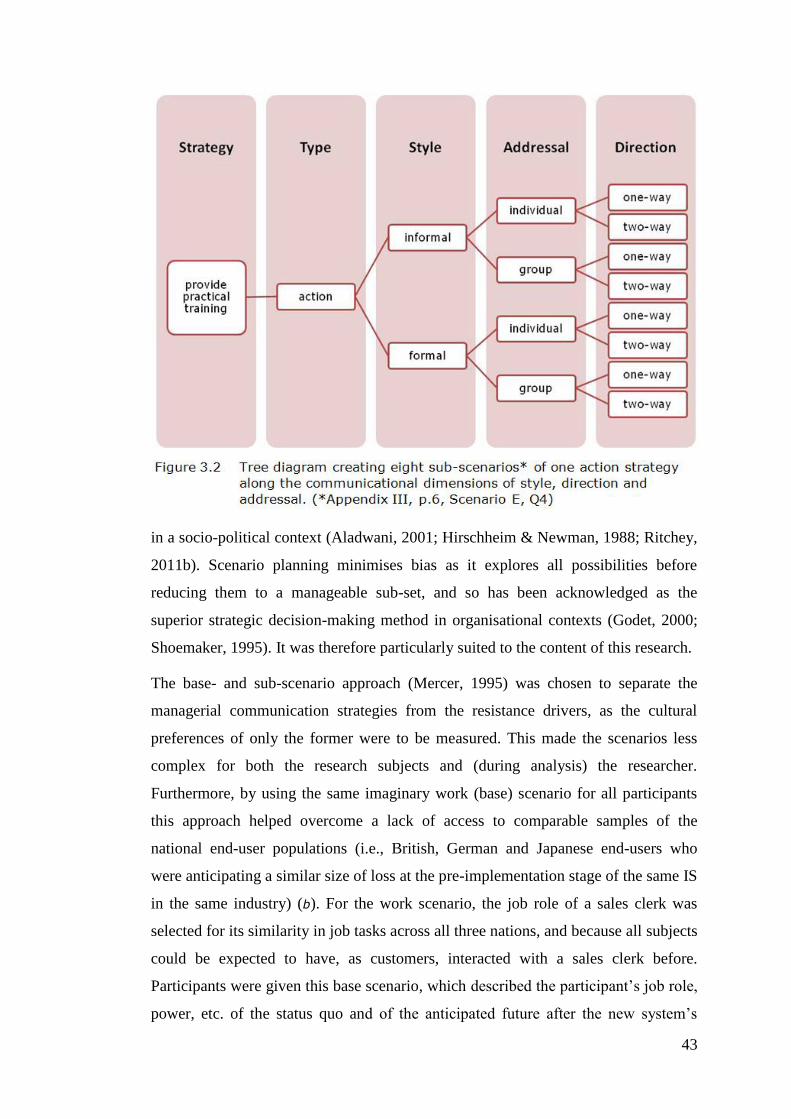
43
in a socio-political context (Aladwani, 2001; Hirschheim & Newman, 1988; Ritchey,
2011b). Scenario planning minimises bias as it explores all possibilities before
reducing them to a manageable sub-set, and so has been acknowledged as the
superior strategic decision-making method in organisational contexts (Godet, 2000;
Shoemaker, 1995). It was therefore particularly suited to the content of this research.
The base- and sub-scenario approach (Mercer, 1995) was chosen to separate the
managerial communication strategies from the resistance drivers, as the cultural
preferences of only the former were to be measured. This made the scenarios less
complex for both the research subjects and (during analysis) the researcher.
Furthermore, by using the same imaginary work (base) scenario for all participants
this approach helped overcome a lack of access to comparable samples of the
national end-user populations (i.e., British, German and Japanese end-users who
were anticipating a similar size of loss at the pre-implementation stage of the same IS
in the same industry) (b). For the work scenario, the job role of a sales clerk was
selected for its similarity in job tasks across all three nations, and because all subjects
could be expected to have, as customers, interacted with a sales clerk before.
Participants were given this base scenario, which described the participant’s job role,
power, etc. of the status quo and of the anticipated future after the new system’s
44
introduction, incorporating most of the resistance drivers identified in 2.2.2, and were
then asked to evaluate (within this work context) several possible managerial
communicational sub-scenarios.
Ritchey (2011a)’s GMA was chosen for its ease of use in systematically combining
the identified managerial pre-implementation communication strategies with the
different values of the communicational dimensions of style, direction and addressal
(a). However, in order to be able to recruit more participants by requiring less time
from each (c) and to shorten the time needed for the later analysis (d), only some of
the sub-scenarios were created with GMA, using Trompenaars & Hampden-Turner
(1997)’s extreme scenario approach for the others: GMA means to combine the 15
communicational strategies with the style, direction and addressal dimensions,
producing a total set of 15x2x2x2 = 120 communicational scenarios. Even if the
number of communicational strategies were reduced to one per type (i.e.,
verbal/action) and content (i.e., certainty/control/belonging), it would still produce a
total set of (2x3)x2x2x2 = 48 communicational scenarios. Therefore, GMA was used
to combine only one verbal- and one action-type of communication with the three
dimensions of communicational manner, producing 2x2x2x2 = 16 communicational
scenarios (Fig.3.1-3.2). At the same time, participants were given one sub-scenario
combining all verbal-type and one sub-scenario combining all action-type
communications and, following Trompenaars & Hampden-Turner (1997)’s extreme
scenario approach, asked to choose either extreme of each of the three dimensions as
their preference. This forced-answer approach (together with the base scenario
describing many potential resistance drivers) is required for creating enough of a
dilemma to make participants rely on their cultural guiding principles (Trompenaars
& Hampden-Turner, 2012).
3.2.2 Sample Selection
The adopted sampling method was convenience sampling, addressing research needs
(b) and (c).
Convenience sampling is a non-probabilistic “method of drawing representative data
by selecting people because of the ease of their volunteering or selecting units
because of their availability or easy access” (BusinessDictionary.com, 2012). This
45
means that samples might not be representative of the target population(s), and so the
findings cannot be generalised as such (Bailey, 1994).
This research required a large number of subjects from each national population if it
was to draw any viable comparisons (c). However, it is impossible for a project
without governmental support of the three nations to obtain access to large
representative samples. In order to still obtain sufficiently large sample sizes, the
researcher directly contacted students and staff of the University of Sheffield through
an email distribution list, as well as her personal acquaintances in each country
through email and Facebook. She also indirectly recruited secondary contacts by
further asking her acquaintances to recruit some of their own acquaintances.
To determine how ‘representative’ or ‘typically British, German or Japanese’
subjects are along the five cultural dimensions incorporated into the hypotheses of
communicational content, style, direction and addressal, one of Hofstede (1984)’s,
Trompenaars & Hampden-Turner (1993)’s or Hall (1976)’s original questions per
dimension were included. Furthermore, whilst subjects were not required to be of a
certain age, have a certain occupation, etc. to avoid an over-reduction of sample
sizes, they were required to indicate their gender, age group and possession of some
but lower-level (i.e., less strategic) work experience to explain any inconsistencies in
findings during data analysis (b). Subjects without work experience or who had held
a departmental- or higher-level managerial position before were excluded to prevent
over-optimistic responses and because “often the statements obtained from those
who are led are a better reflection of the differences than those obtained from the
leaders” (G. H. Hofstede et al., 2010, p. 62).
3.2.3 Data Collection Technique
The adopted data collection technique was a closed-question online questionnaire,
addressing research needs (c) and (d).
A questionnaire is “a set of questions for obtaining statistically useful or personal
information from individuals” (Merriam-Webster Online Dictionary, 2012b), and a
closed question “is one in which the respondents are offered a choice of alternative
replies” (Oppenheim, 1992, p. 112). A closed-question online questionnaire is
advantageous if seeking factual information and large samples for making
46
comparisons (Wilkinson, 2000), i.e. for “show[ing] differences in answers between
groups or categories of respondents” (G. H. Hofstede et al., 2010, p. 28).
Thus, a closed-question questionnaire was particularly suited to this research which
sought to compare large samples of different national cultures, and its online
distribution was the best way to gain access to the geographically distant populations
without incurring financial costs (c). More specifically, three language versions of
the questionnaire were easily created with GoogleDocs, the thereby created
hyperlinks easily distributed and the automatically compiled Microsoft Excel
spreadsheets easily downloaded for data analysis. Another advantage of distributing
the questionnaire online is that there was no time lag between submittal and receipt
of responses (d).
3.2.4 Instrument Design and Pilot
The questionnaire consisted of one preliminary information sheet and six scenario
and question pages (Appendix II-III):
The pre-page provided contact details and general information about the research
project, participant selection and confidentiality, and required the respondent’s
informed consent before s/he could proceed to the questionnaire. The first and
second pages asked the respondent to confirm his/her nationality, gender, age group
and work experience, and the third page presented five general cultural questions
taken from the selected cultural researchers. After introducing him/her to his/her
(imaginary) current and future job role with the base scenario on page four, s/he was
asked to choose between three scenarios of different communicational content (i.e.,
certainty vs. control, certainty vs. belonging, control vs. belonging) on page five. The
final page presented two scenarios of different communicational type (i.e., verbal vs.
action) and asked the respondent to, for each, a) choose his/her preferred style
(formal vs. informal), direction (one-way vs. two-way) and addressal (individual vs.
group), and b) rate the eight combined sub-scenarios created with GMA on a 4-point
Likert scale.
The researcher first designed the questionnaire in English and then translated it into
German, her native language, and Japanese, which she had acquired through her
Japanese Studies bachelor degree and year abroad at Kyoto University, Japan. These
47
content-equivalent versions were then piloted with two native speakers per language
version and revised accordingly, altering several phrases and shortening some
communicational sub-scenarios to include fewer of the identified strategies to
prevent respondents’ information overload. Data collection commenced on 12th July
2012 and ended on 31st July 2012 (20 days), receiving a total of 70 British, 67
German and 72 Japanese responses (Appendix IV).
3.3 Research Ethics
The researcher confirms to have read and agrees to abide by the University’s Ethics
Policy Governing Research Involving Human Participants, Personal Data and
Human Tissue, as publicised on http://www.shef.ac.uk/ris/other/gov-
ethics/ethicspolicy.
As this research involved people without a potential for their physical and/or
psychological harm/distress, it was classified as ‘low risk’. The questionnaires’ pre-
page emphasised the voluntariness and anonymity of participation and respondents
were required to give informed consent before being able to proceed to the questions.
Ethical approval was granted prior to pilot and data collection in June 2012
(Appendix I).
3.4 Framework for Data Analysis
The responses of the three questionnaire versions first had to be coded into numeric
format and then collated into a single spreadsheet (Appendix IV). The data was then
analysed, hypothesis-by-hypothesis, using the statistical package SPSS: starting with
H2a-c (culturally preferred communicational content; Appendix III, p.5, Q1-3), then
H3-5 (culturally preferred communicational manner, i.e. style/direction/addressal;
Appendix III, p.6, Q1-4) and finally H1 (there is a cultural difference in perception),
which formed the basis of H2-5 and hence was revealed through their analysis.
General frequency distributions and crosstabulated tables and graphs were created, to
meaningfully describe and compare the results and to determine whether the results
had been affected by the respondents’ gender, age and leadership experience and/or
48
cultural scores that differed from Hofstede (1984) etc.’s original scores. Moreover,
one-way independent ANOVA (ANalysis Of VAriance) with subsequent Bonferroni
comparisons was used to calculate, for each communicational dimension, the
differences between the three national samples’ mean scores which were significant
at the 0.05 level (Field, 2005).
Finally, these empirical findings were synthesised with the literature findings of
Chapter 2, interpreting any inconsistencies using the data itself and additional
culture-specific studies.
3.5 Limitations and Potential Problems
One limitation to this empirical research was its basis solely on the findings of
previous English-language IS and etic (culture-general/comparative) cultural
research studies. It only dealt with the resistance drivers and communicational
mitigation strategies that IS researchers, and the cultural dimensions that three
selected etic cultural researchers had suggested, excluding German- and Japanese-
language IS and emic (culture-specific) studies. Moreover, the (closed-question)
questionnaire did not give respondents the opportunity to evaluate the effectiveness
of each strategy individually or suggest other preferred strategies not listed, nor was
it triangulated with some form of qualitative research. Therefore, the research design
might have been biased, making its findings less reliable. However, due to the time
constraints of the dissertation, such pre-selection and lack of triangulation could not
be avoided. To nevertheless ensure the validity of the questionnaire, a pilot study was
conducted prior to data collection, asking the volunteers to comment on how logical
the order of the questions was, how easy to understand the instructions and scenarios
were, whether the scenarios provided too much information at once, etc.
Other limitations to this research were its reliance on respondents’ power of
imagination and its sample selection. If respondents had difficulties in imagining
themselves into the job role presented and the managerial communications
happening in that situation of high resistance emergence potential, they would have
been less likely to base their forced-option answers on their cultural guiding
principles (Trompenaars & Hampden-Turner, 2012). Furthermore, the non-randomly
selected national samples included those of any gender, age group and occupations,
49
so the research findings were not simply generalisable to the British, German and
Japanese cultures. However, the non-abstract, imaginary scenarios should have been
sufficiently easy to understand after their revision according to the six pilot study
participants, and they did provide the advantage of potentially eliciting more honest
answers by the questionnaire respondents who might fear negative consequences
with their employer. Moreover, personal information and more general cultural
dimensional questions were asked to be able to adequately explain the findings
during data analysis.

50
Chapter 4: Research Findings
4.1 Introduction
As described and justified in the previous chapter, this quantitative empirical
research employed a scenario-method, closed-question online questionnaire in three
languages in order
(4) To investigate British, German and Japanese end-users’ attitudes towards
different managerial pre-implementation communications.
The nationality, gender, age and leadership distributions of the in total 209 responses
were as follows:
With 70 British, 67 German and 72 Japanese, respondents were
approximately equally distributed across all nationalities (Fig.4.1).
The majority of respondents (i.e., approximately 70% of German and over
half of British and Japanese respondents) were female (Fig.4.2).
The majority of respondents (i.e., approximately 80-85% of British and
German and 60% of Japanese respondents) was between 18-35 years old
(Fig.4.3).
The minority of each samples’ respondents (i.e., approximately 20% of the
German and Japanese and just under half of the British respondents) has had
a lower-level leadership position before (Fig.4.4).
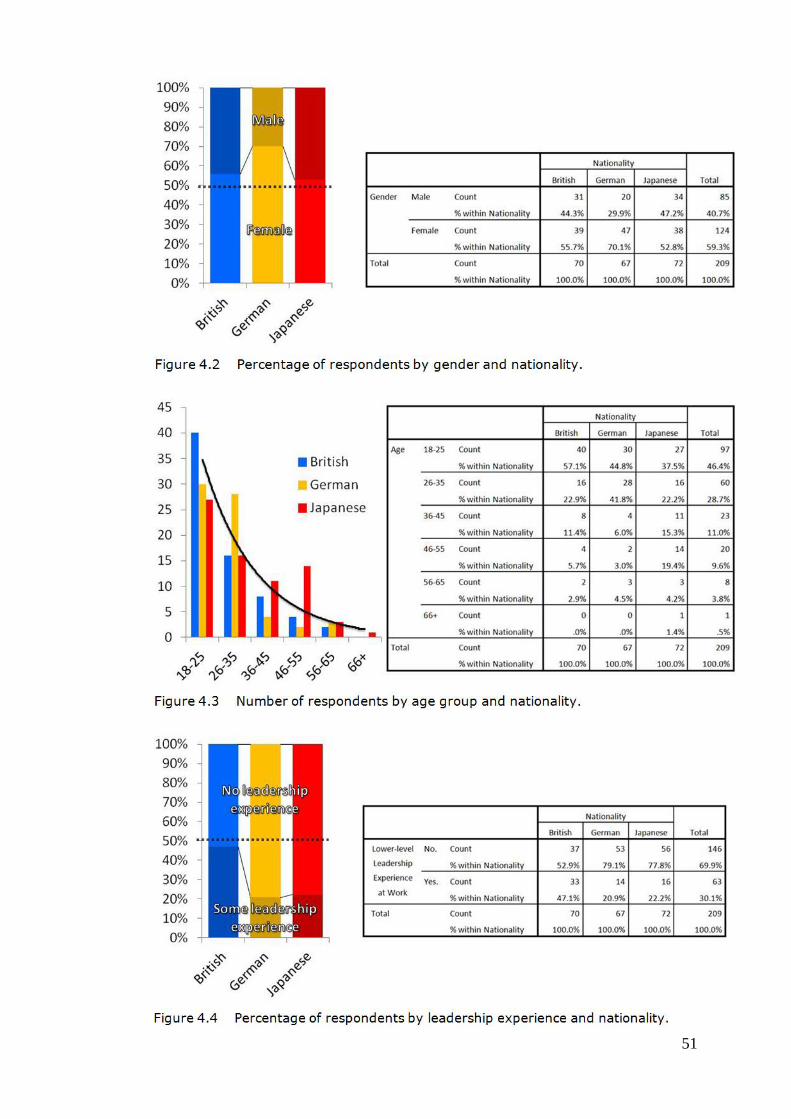
51
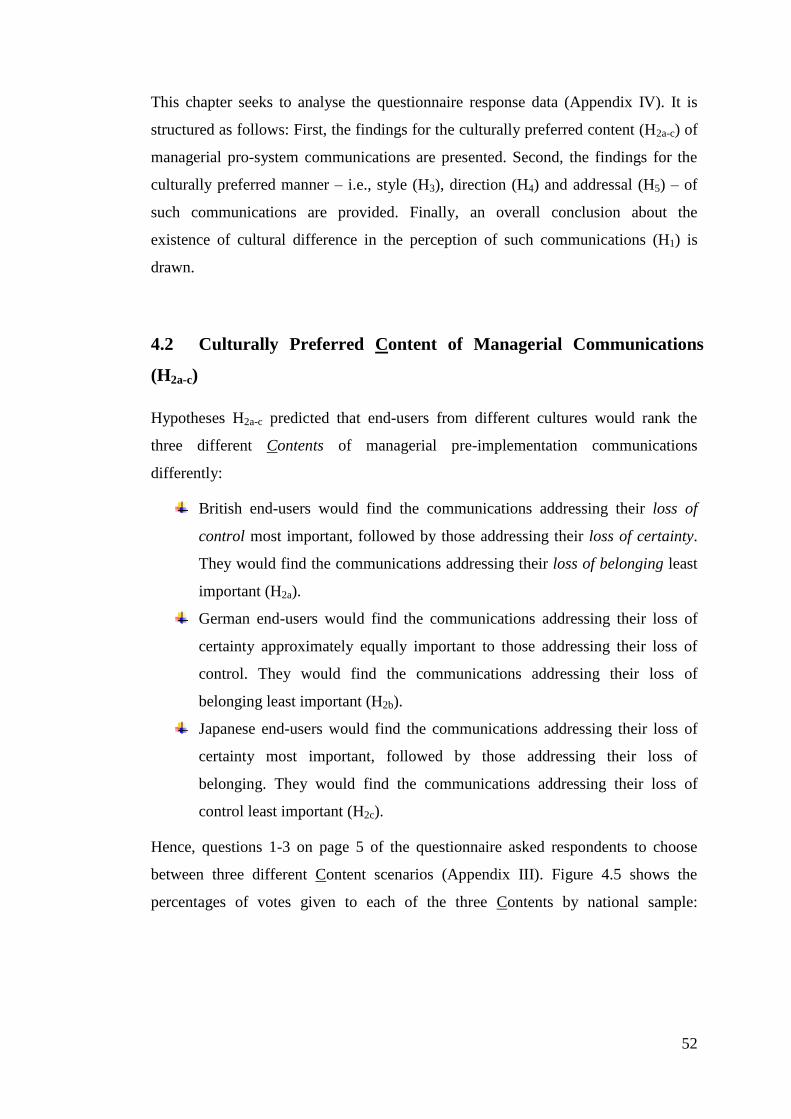
52
This chapter seeks to analyse the questionnaire response data (Appendix IV). It is
structured as follows: First, the findings for the culturally preferred content (H2a-c) of
managerial pro-system communications are presented. Second, the findings for the
culturally preferred manner – i.e., style (H3), direction (H4) and addressal (H5) – of
such communications are provided. Finally, an overall conclusion about the
existence of cultural difference in the perception of such communications (H1) is
drawn.
4.2 Culturally Preferred Content of Managerial Communications
(H2a-c)
Hypotheses H2a-c predicted that end-users from different cultures would rank the
three different Contents of managerial pre-implementation communications
differently:
British end-users would find the communications addressing their loss of
control most important, followed by those addressing their loss of certainty.
They would find the communications addressing their loss of belonging least
important (H2a).
German end-users would find the communications addressing their loss of
certainty approximately equally important to those addressing their loss of
control. They would find the communications addressing their loss of
belonging least important (H2b).
Japanese end-users would find the communications addressing their loss of
certainty most important, followed by those addressing their loss of
belonging. They would find the communications addressing their loss of
control least important (H2c).
Hence, questions 1-3 on page 5 of the questionnaire asked respondents to choose
between three different Content scenarios (Appendix III). Figure 4.5 shows the
percentages of votes given to each of the three Contents by national sample:
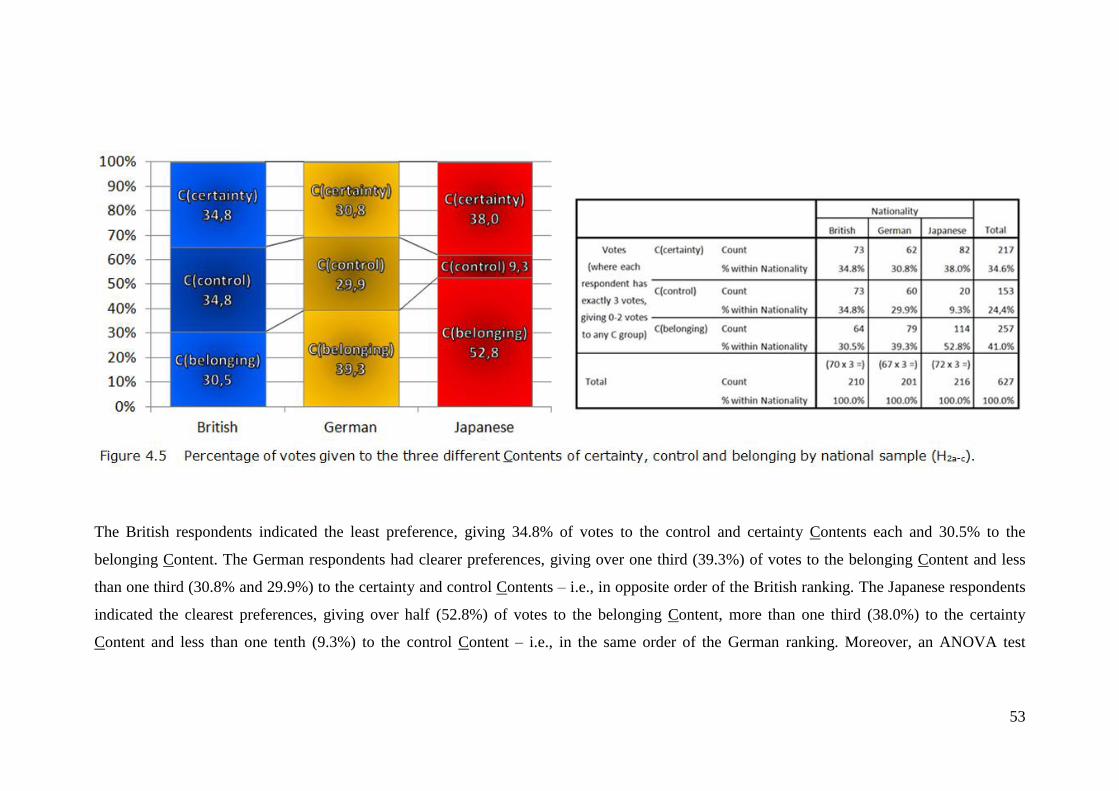
53
The British respondents indicated the least preference, giving 34.8% of votes to the control and certainty Contents each and 30.5% to the
belonging Content. The German respondents had clearer preferences, giving over one third (39.3%) of votes to the belonging Content and less
than one third (30.8% and 29.9%) to the certainty and control Contents – i.e., in opposite order of the British ranking. The Japanese respondents
indicated the clearest preferences, giving over half (52.8%) of votes to the belonging Content, more than one third (38.0%) to the certainty
Content and less than one tenth (9.3%) to the control Content – i.e., in the same order of the German ranking. Moreover, an ANOVA test
54
revealed that the subjective importance of the control and belonging Contents were
significantly different between the Japanese and British and the Japanese and
German respondents at the 0.05 level (Appendix V, Table 1).
These results confirm that a) the British found the control and certainty Contents
more important than the belonging Content, b) the Germans found the certainty and
control Contents approximately equally important, and c) the Japanese found the
certainty and belonging Contents more important than the control Content. However,
against prior assumptions, the control Content was not most important to the British,
and the belonging Content was most important to the German and Japanese
respondents.
Therefore, hypotheses H2a-b are partially supported.
4.3 Culturally Preferred Manner of Managerial Communications
(H3-5)
Hypotheses H3-5 predicted that different cultures’ end-users would prefer the
extremes of the three different Manners of managerial pre-implementation
communications to a different extent:
British end-users would prefer a brief and informal (rather than a detailed and
formal) communicational Style more than Japanese end-users, who would
prefer so more than German end-users (H3).
Japanese end-users would prefer a one-way (rather than two-way)
communicational Direction more than British end-users, who would prefer so
more than German end-users (H4).
British end-users would prefer being Addressed as individuals (rather than as
members of a group) more than German end-users, who would prefer so more
than Japanese end-users (H5).
Hence, questions 1-4 on page 6 of the questionnaire asked respondents to choose
between either extreme of each of the three different communicational Manners for
one verbal- and for one action-type communicational scenario. Respondents were
also asked to evaluate eight verbal- and eight action-type scenarios which combined
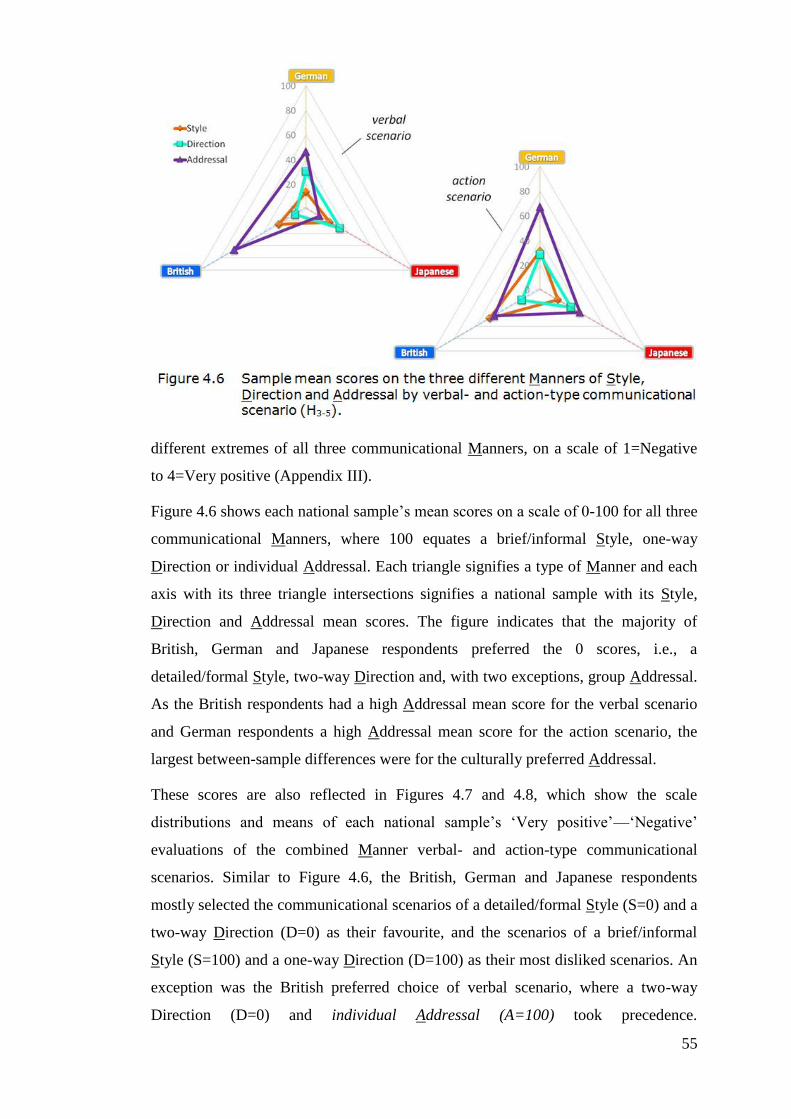
55
different extremes of all three communicational Manners, on a scale of 1=Negative
to 4=Very positive (Appendix III).
Figure 4.6 shows each national sample’s mean scores on a scale of 0-100 for all three
communicational Manners, where 100 equates a brief/informal Style, one-way
Direction or individual Addressal. Each triangle signifies a type of Manner and each
axis with its three triangle intersections signifies a national sample with its Style,
Direction and Addressal mean scores. The figure indicates that the majority of
British, German and Japanese respondents preferred the 0 scores, i.e., a
detailed/formal Style, two-way Direction and, with two exceptions, group Addressal.
As the British respondents had a high Addressal mean score for the verbal scenario
and German respondents a high Addressal mean score for the action scenario, the
largest between-sample differences were for the culturally preferred Addressal.
These scores are also reflected in Figures 4.7 and 4.8, which show the scale
distributions and means of each national sample’s ‘Very positive’—‘Negative’
evaluations of the combined Manner verbal- and action-type communicational
scenarios. Similar to Figure 4.6, the British, German and Japanese respondents
mostly selected the communicational scenarios of a detailed/formal Style (S=0) and a
two-way Direction (D=0) as their favourite, and the scenarios of a brief/informal
Style (S=100) and a one-way Direction (D=100) as their most disliked scenarios. An
exception was the British preferred choice of verbal scenario, where a two-way
Direction (D=0) and individual Addressal (A=100) took precedence.
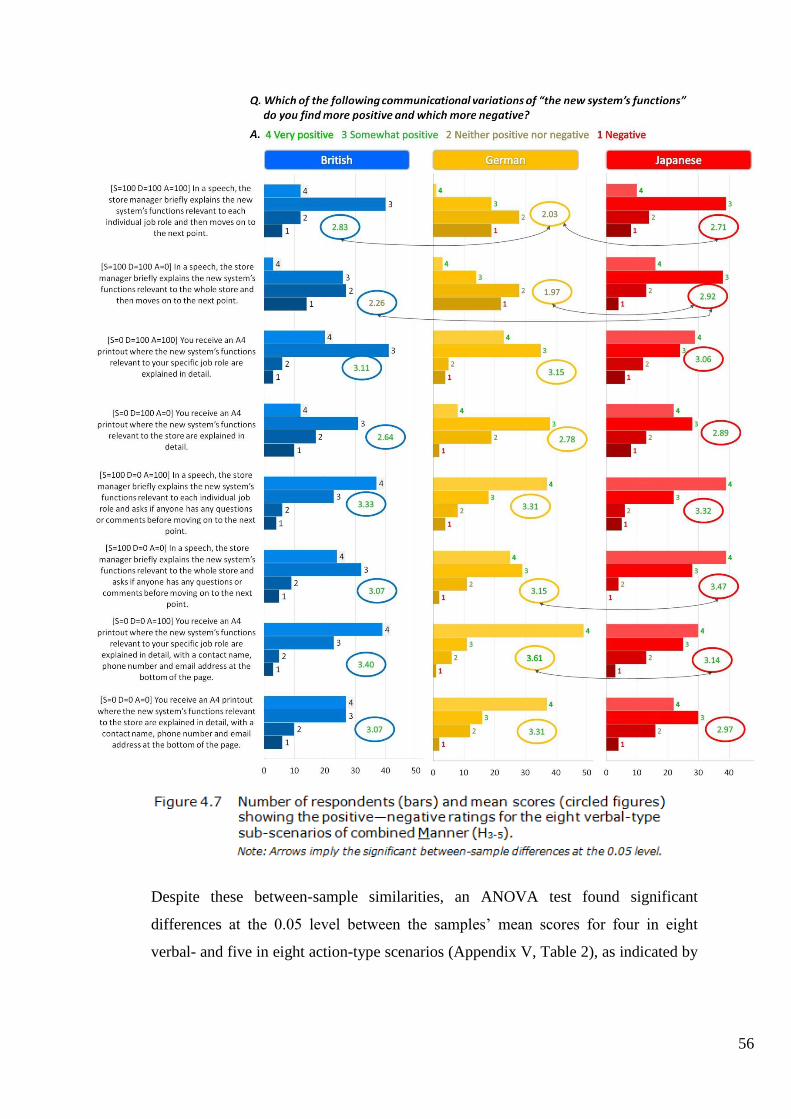
56
Despite these between-sample similarities, an ANOVA test found significant
differences at the 0.05 level between the samples’ mean scores for four in eight
verbal- and five in eight action-type scenarios (Appendix V, Table 2), as indicated by
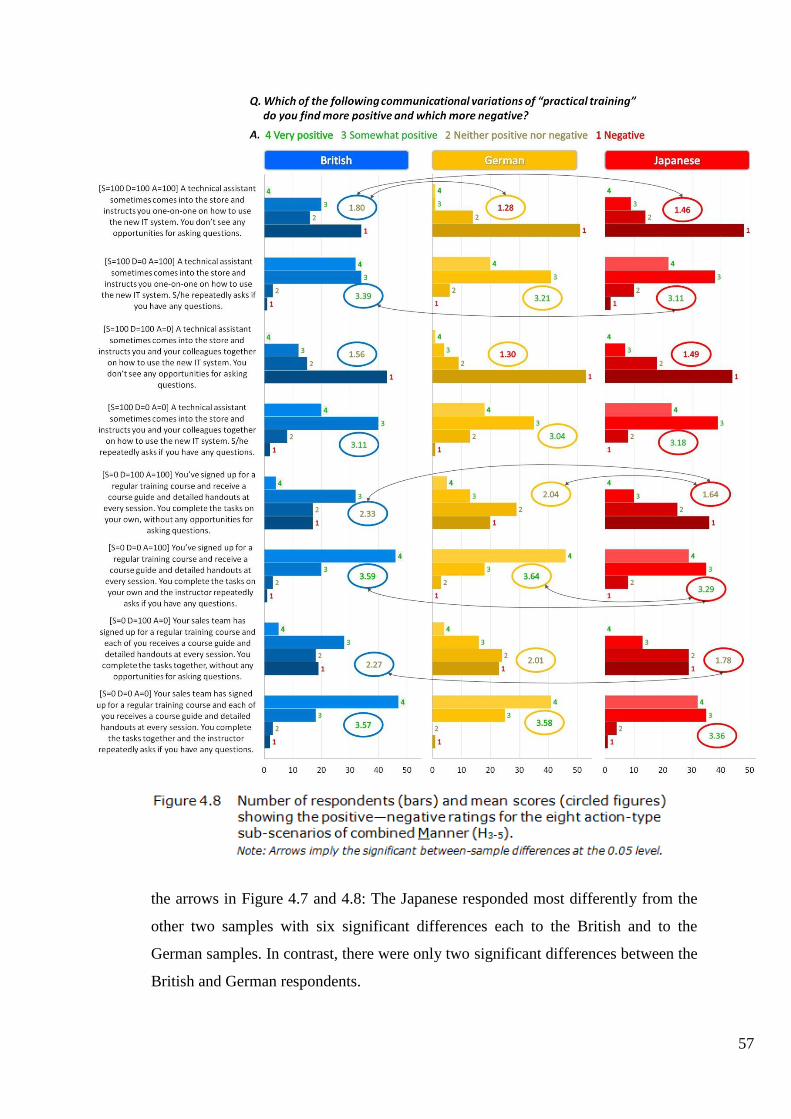
57
the arrows in Figure 4.7 and 4.8: The Japanese responded most differently from the
other two samples with six significant differences each to the British and to the
German samples. In contrast, there were only two significant differences between the
British and German respondents.
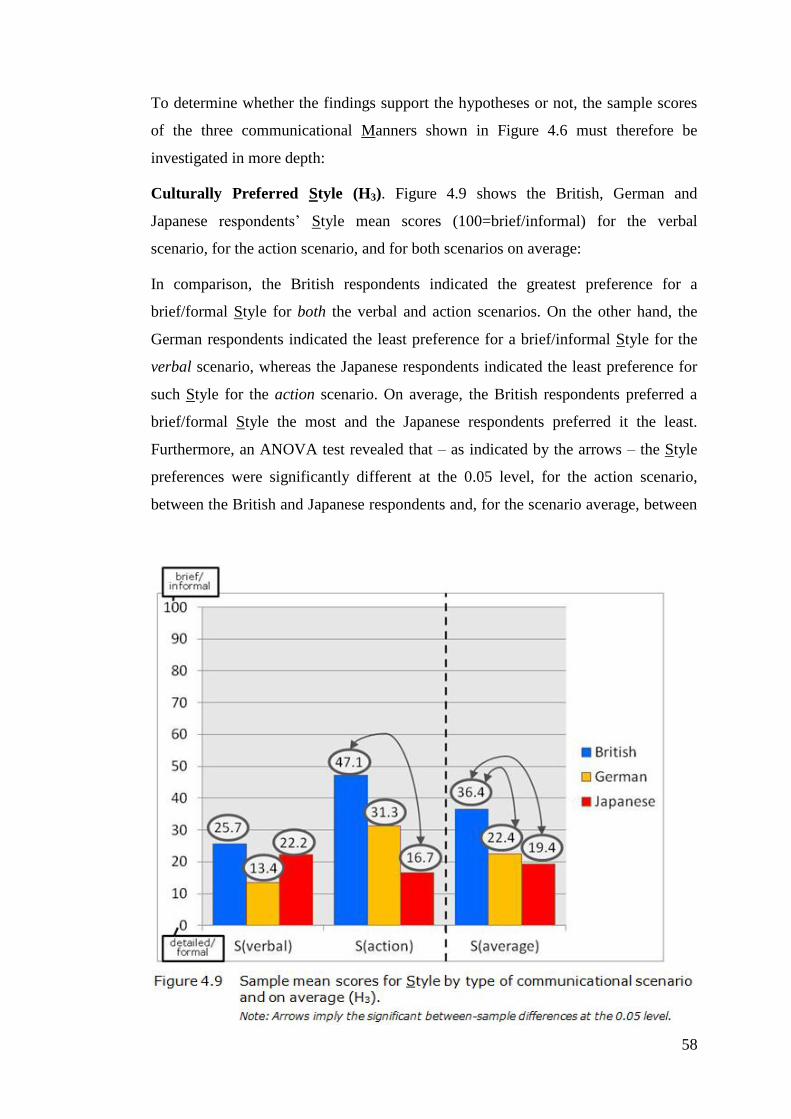
58
To determine whether the findings support the hypotheses or not, the sample scores
of the three communicational Manners shown in Figure 4.6 must therefore be
investigated in more depth:
Culturally Preferred Style (H3). Figure 4.9 shows the British, German and
Japanese respondents’ Style mean scores (100=brief/informal) for the verbal
scenario, for the action scenario, and for both scenarios on average:
In comparison, the British respondents indicated the greatest preference for a
brief/formal Style for both the verbal and action scenarios. On the other hand, the
German respondents indicated the least preference for a brief/informal Style for the
verbal scenario, whereas the Japanese respondents indicated the least preference for
such Style for the action scenario. On average, the British respondents preferred a
brief/formal Style the most and the Japanese respondents preferred it the least.
Furthermore, an ANOVA test revealed that – as indicated by the arrows – the Style
preferences were significantly different at the 0.05 level, for the action scenario,
between the British and Japanese respondents and, for the scenario average, between
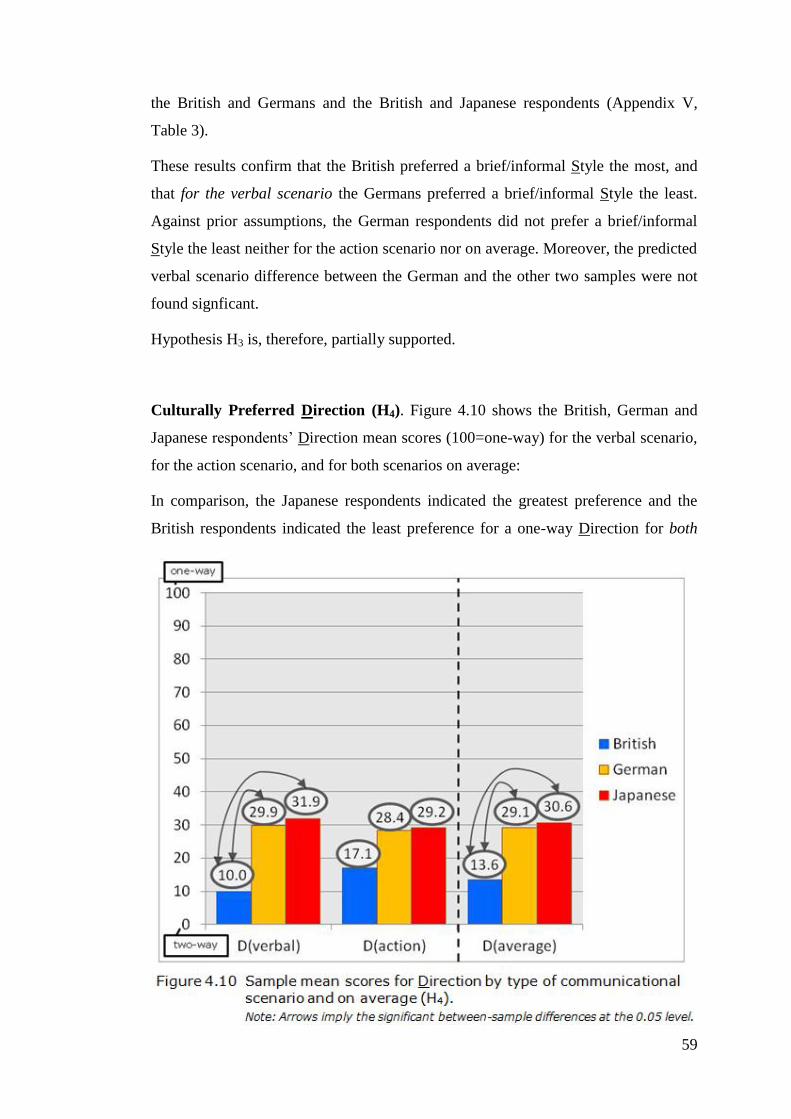
59
the British and Germans and the British and Japanese respondents (Appendix V,
Table 3).
These results confirm that the British preferred a brief/informal Style the most, and
that for the verbal scenario the Germans preferred a brief/informal Style the least.
Against prior assumptions, the German respondents did not prefer a brief/informal
Style the least neither for the action scenario nor on average. Moreover, the predicted
verbal scenario difference between the German and the other two samples were not
found signficant.
Hypothesis H3 is, therefore, partially supported.
Culturally Preferred Direction (H4). Figure 4.10 shows the British, German and
Japanese respondents’ Direction mean scores (100=one-way) for the verbal scenario,
for the action scenario, and for both scenarios on average:
In comparison, the Japanese respondents indicated the greatest preference and the
British respondents indicated the least preference for a one-way Direction for both
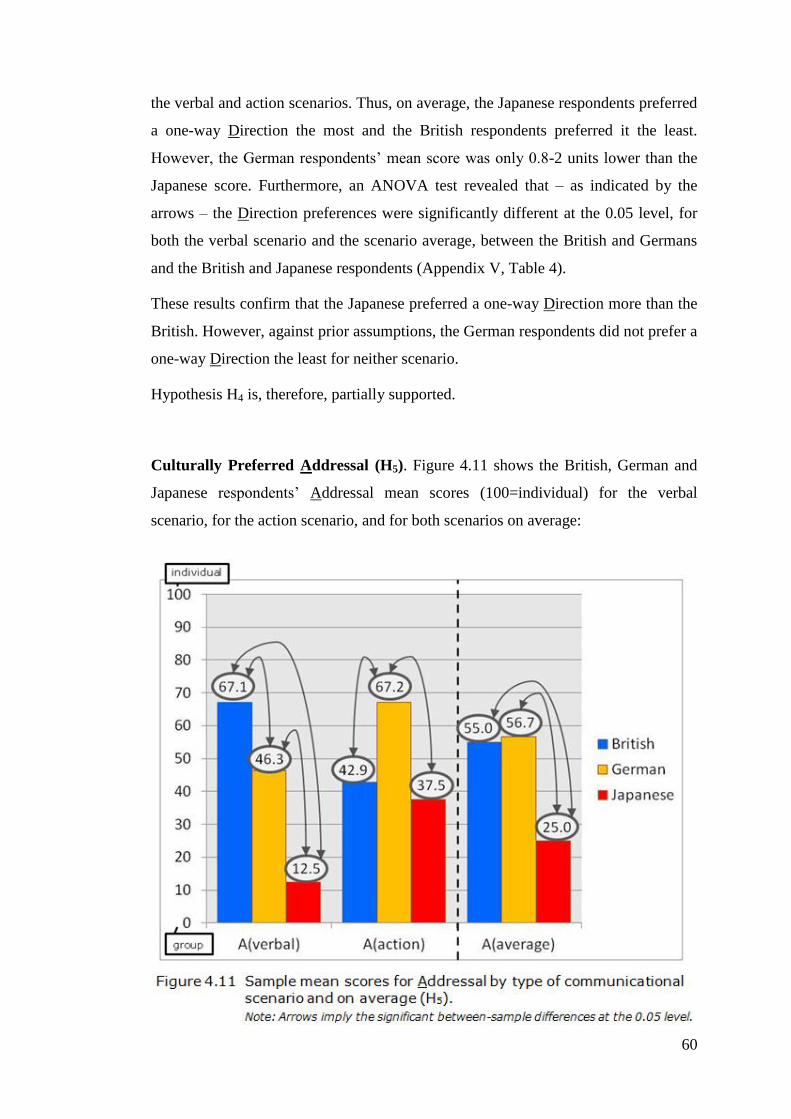
60
the verbal and action scenarios. Thus, on average, the Japanese respondents preferred
a one-way Direction the most and the British respondents preferred it the least.
However, the German respondents’ mean score was only 0.8-2 units lower than the
Japanese score. Furthermore, an ANOVA test revealed that – as indicated by the
arrows – the Direction preferences were significantly different at the 0.05 level, for
both the verbal scenario and the scenario average, between the British and Germans
and the British and Japanese respondents (Appendix V, Table 4).
These results confirm that the Japanese preferred a one-way Direction more than the
British. However, against prior assumptions, the German respondents did not prefer a
one-way Direction the least for neither scenario.
Hypothesis H4 is, therefore, partially supported.
Culturally Preferred Addressal (H5). Figure 4.11 shows the British, German and
Japanese respondents’ Addressal mean scores (100=individual) for the verbal
scenario, for the action scenario, and for both scenarios on average:
61
In comparison, the British respondents indicated the greatest preference for
individual Addressal for the verbal scenario, whereas the German respondents
indicated the greatest preference for such Addressal for the action scenario. On the
other hand, the Japanese respondents indicated the least preference for individual
Addressal for both the verbal and action scenarios. On average, the German
respondents preferred being Addressed individually the most and the Japanese
respondents preferred it the least. Furthermore, an ANOVA test revealed that – as
indicated by the arrows – the Addressal preferences were significantly different at
the 0.05 level, for the verbal scenario, between all three samples; for the action
scenario, between the German and British and the German and Japanese respondents
and, for the scenario average, between the Japanese and British and the Japanese and
German respondents (Appendix V, Table 5).
These results confirm that the Japanese preferred individual Addressal the least, and
that for the verbal scenario the British preferred individual Addressal the most.
Against prior assumptions, the British respondents did not prefer individual
Addressal the most neither for the action scenario nor on average.
Hypothesis H5 is, therefore, partially supported.
4.4 Conclusion: Culturally Different Perception of Managerial
Communications (H1)
By analysising the questionnaire results, the previous sections have investigated
British, German and Japanese end-users’ attitudes towards different managerial pre-
implementation communications. Hypotheses H2-5 predicted the three national
samples’ different preferences in communicational content and manner, and as
summarised in Table 4.1, were found to be partially supported.
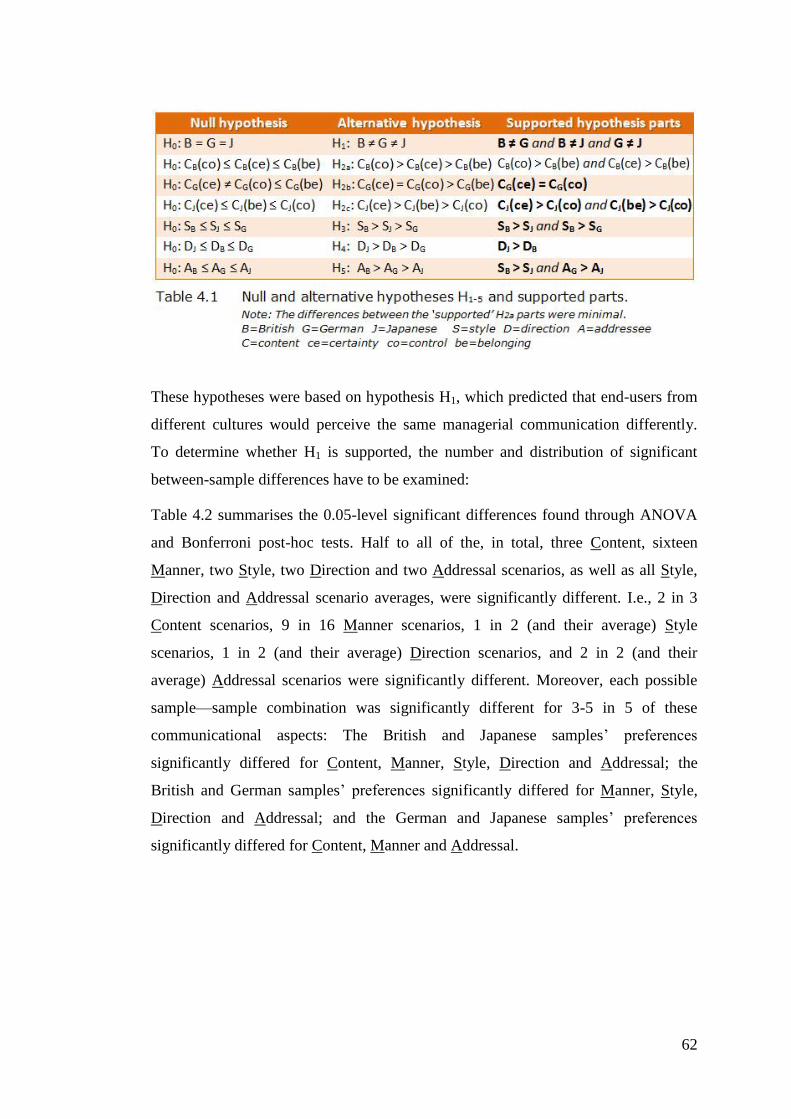
62
These hypotheses were based on hypothesis H1, which predicted that end-users from
different cultures would perceive the same managerial communication differently.
To determine whether H1 is supported, the number and distribution of significant
between-sample differences have to be examined:
Table 4.2 summarises the 0.05-level significant differences found through ANOVA
and Bonferroni post-hoc tests. Half to all of the, in total, three Content, sixteen
Manner, two Style, two Direction and two Addressal scenarios, as well as all Style,
Direction and Addressal scenario averages, were significantly different. I.e., 2 in 3
Content scenarios, 9 in 16 Manner scenarios, 1 in 2 (and their average) Style
scenarios, 1 in 2 (and their average) Direction scenarios, and 2 in 2 (and their
average) Addressal scenarios were significantly different. Moreover, each possible
sample—sample combination was significantly different for 3-5 in 5 of these
communicational aspects: The British and Japanese samples’ preferences
significantly differed for Content, Manner, Style, Direction and Addressal; the
British and German samples’ preferences significantly differed for Manner, Style,
Direction and Addressal; and the German and Japanese samples’ preferences
significantly differed for Content, Manner and Addressal.
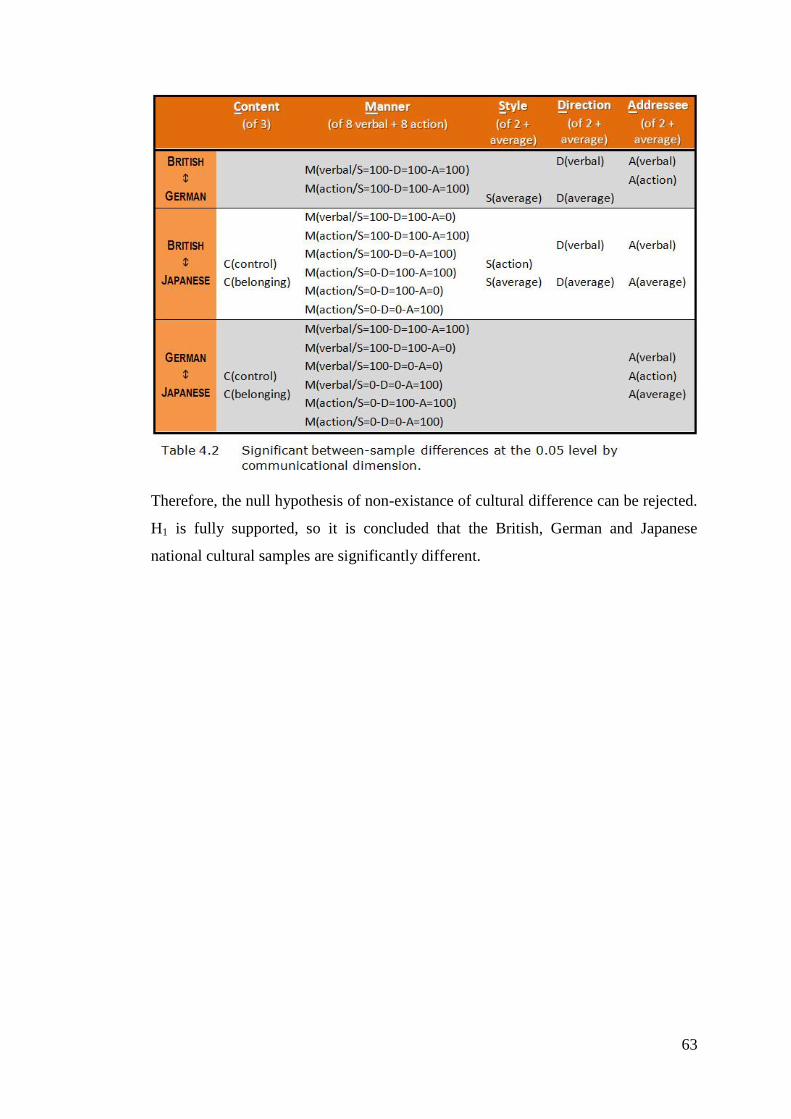
63
Therefore, the null hypothesis of non-existance of cultural difference can be rejected.
H1 is fully supported, so it is concluded that the British, German and Japanese
national cultural samples are significantly different.
64
Chapter 5: Discussion
5.1 Introduction
The previous three chapters have, inter alia, reviewed the extant research literature to
explore the potential cultural differences in attitudes towards the same managerial
pre-implementation communications, and they have described this dissertation’s
empirical research methods and findings to investigate the actual cultural differences
in such attitudes. This chapter seeks to synthesise these literature and empirical
findings in order
(5) To provide recommendations to managers for optimising their pre-
implementation communication strategy in organisations in the UK, Germany
and Japan.
The chapter is structured as follows: First, the consistencies in findings are
summarised. Then, the inconsistencies in findings are discussed. Three possible
explanations are provided based on an investigation of the samples’ gender, age and
leadership distributions, cultural dimensional scores and additional culture-specific
studies. Finally, the implications for managers in the UK, Germany and Japan are
elucidated.
5.2 Synthesis of Consistencies in Empirical and Literature Findings
By deducting and testing five hypotheses through a literature review and
questionnaire, this research investigated the culturally different perception and
preferences in managerial pre-implementation communications. Hypotheses H1 was
fully and H2-5 were partially supported:
Culturally different perception. Recent IS studies indicate that end-users from
different cultures may have different resistance drivers and perceive resistance
mitigating strategies differently (Beaudry & Pinsonneault, 2010; C. M. Elie-Dit-
Cosaque & Straub, 2011). Culture being understood as part of its members’
perceptive filter (G. H. Hofstede et al., 2010) to guide them in how to understand and
react to reality (Kluckhohn & Strodtbeck, 1961; Trompenaars & Hampden-Turner,
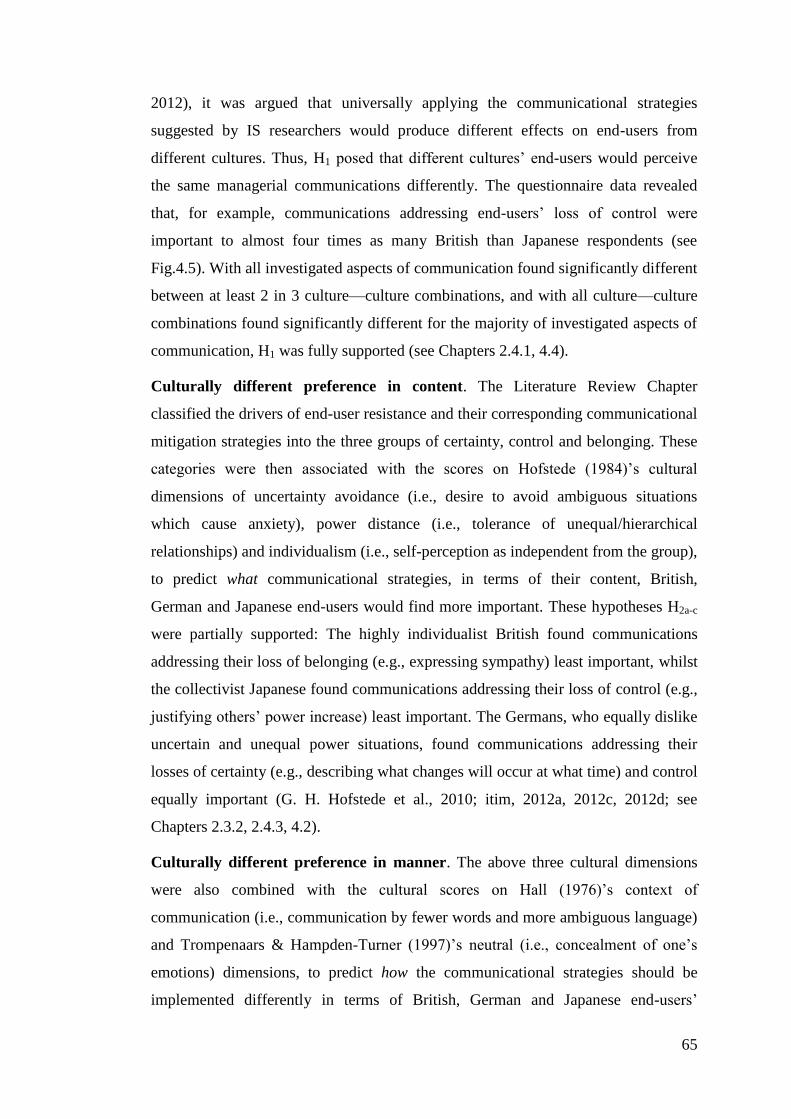
65
2012), it was argued that universally applying the communicational strategies
suggested by IS researchers would produce different effects on end-users from
different cultures. Thus, H1 posed that different cultures’ end-users would perceive
the same managerial communications differently. The questionnaire data revealed
that, for example, communications addressing end-users’ loss of control were
important to almost four times as many British than Japanese respondents (see
Fig.4.5). With all investigated aspects of communication found significantly different
between at least 2 in 3 culture—culture combinations, and with all culture—culture
combinations found significantly different for the majority of investigated aspects of
communication, H1 was fully supported (see Chapters 2.4.1, 4.4).
Culturally different preference in content. The Literature Review Chapter
classified the drivers of end-user resistance and their corresponding communicational
mitigation strategies into the three groups of certainty, control and belonging. These
categories were then associated with the scores on Hofstede (1984)’s cultural
dimensions of uncertainty avoidance (i.e., desire to avoid ambiguous situations
which cause anxiety), power distance (i.e., tolerance of unequal/hierarchical
relationships) and individualism (i.e., self-perception as independent from the group),
to predict what communicational strategies, in terms of their content, British,
German and Japanese end-users would find more important. These hypotheses H2a-c
were partially supported: The highly individualist British found communications
addressing their loss of belonging (e.g., expressing sympathy) least important, whilst
the collectivist Japanese found communications addressing their loss of control (e.g.,
justifying others’ power increase) least important. The Germans, who equally dislike
uncertain and unequal power situations, found communications addressing their
losses of certainty (e.g., describing what changes will occur at what time) and control
equally important (G. H. Hofstede et al., 2010; itim, 2012a, 2012c, 2012d; see
Chapters 2.3.2, 2.4.3, 4.2).
Culturally different preference in manner. The above three cultural dimensions
were also combined with the cultural scores on Hall (1976)’s context of
communication (i.e., communication by fewer words and more ambiguous language)
and Trompenaars & Hampden-Turner (1997)’s neutral (i.e., concealment of one’s
emotions) dimensions, to predict how the communicational strategies should be
implemented differently in terms of British, German and Japanese end-users’

66
preferred brief/informal versus detailed/formal style, one-way versus two-way
direction and individual versus group addressal. These hypotheses H3-5 were partially
supported: The less direct British, who dislike detail and procedures, preferred a brief
and informal communicational style (e.g., briefly explaining the new system’s
functions in a spoken manner, informal on-the-job training) the most. The hierarchy-
oriented Japanese preferred one-way (top-down) communications (e.g., providing
information without allowing feedback) more than the equality-oriented British. The
collectivist Japanese preferred being addressed individually (e.g., explaining the new
system’s benefits for each individual job role rather than for the immediate staff
team) the least, whilst in verbal communication the individualist British preferred
being addressed individually the most (Hall, 1959; G. H. Hofstede et al., 2010; itim,
2012a, 2012d; Trompenaars & Hampden-Turner, 2012; see Chapters 2.3.2, 2.4.3).
Overall, the samples’ scores and ratings indicated that the British, German and
Japanese alike found detailed/formal, two-way communications more preferable than
brief/informal, one-way communications (see Chapter 4.3).
5.3 Discussion of Inconsistencies in Empirical and Literature
Findings
The partially supported hypotheses H2-5 each predicted the order of three groups of
communicational content (H2a-c) or national cultures (H3-5) on a scale of preference.
For example, H3 predicted that a brief/informal style would be preferred the most by
British end-users, second most by Japanese end-users, and the least by German end-
users. In other words, it predicted that a brief/informal style would be preferred by a)
British more than Japanese end-users, b) British more than German end-users, and c)
Japanese more than German end-users, thus specifying three comparative directions.
Therefore, hypotheses H2-5 being partially supported meant that 1-2 in 3 predicted
directions were found and were of a significant difference at the 0.05 level. Figure
5.1 summarises the unsupported directions, i.e., the empirical findings found
inconsistent with the literature findings.
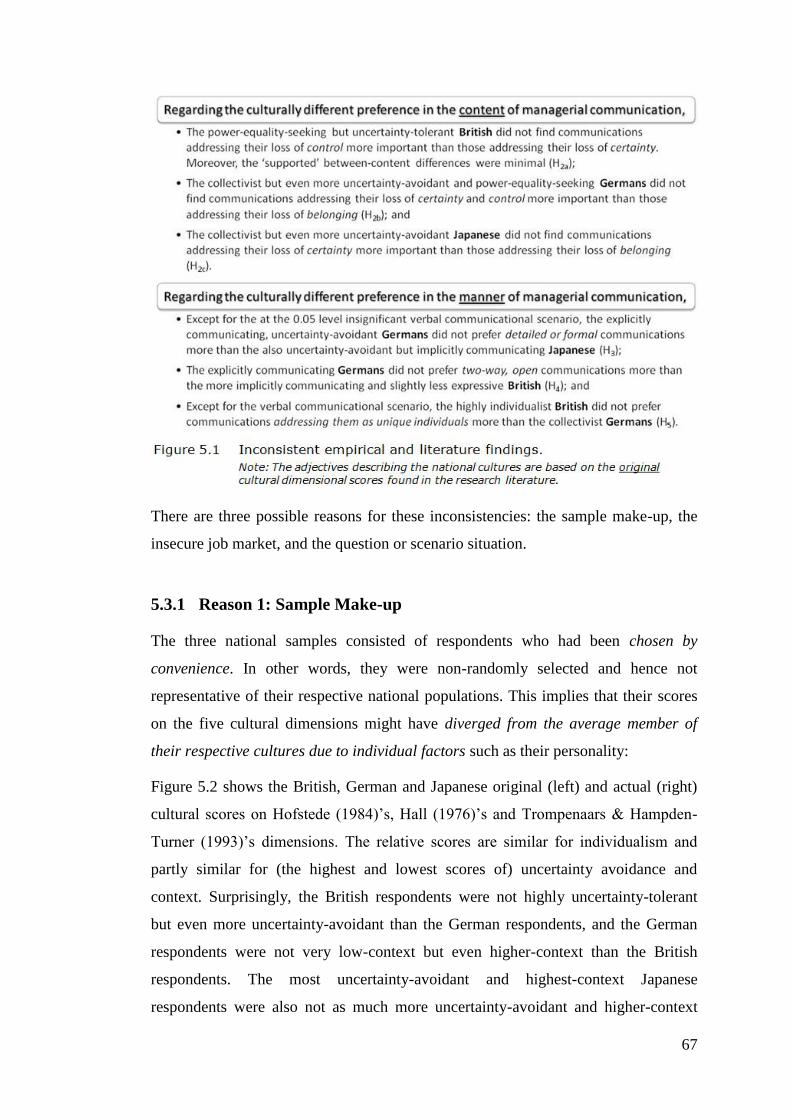
67
There are three possible reasons for these inconsistencies: the sample make-up, the
insecure job market, and the question or scenario situation.
5.3.1 Reason 1: Sample Make-up
The three national samples consisted of respondents who had been chosen by
convenience. In other words, they were non-randomly selected and hence not
representative of their respective national populations. This implies that their scores
on the five cultural dimensions might have diverged from the average member of
their respective cultures due to individual factors such as their personality:
Figure 5.2 shows the British, German and Japanese original (left) and actual (right)
cultural scores on Hofstede (1984)’s, Hall (1976)’s and Trompenaars & Hampden-
Turner (1993)’s dimensions. The relative scores are similar for individualism and
partly similar for (the highest and lowest scores of) uncertainty avoidance and
context. Surprisingly, the British respondents were not highly uncertainty-tolerant
but even more uncertainty-avoidant than the German respondents, and the German
respondents were not very low-context but even higher-context than the British
respondents. The most uncertainty-avoidant and highest-context Japanese
respondents were also not as much more uncertainty-avoidant and higher-context
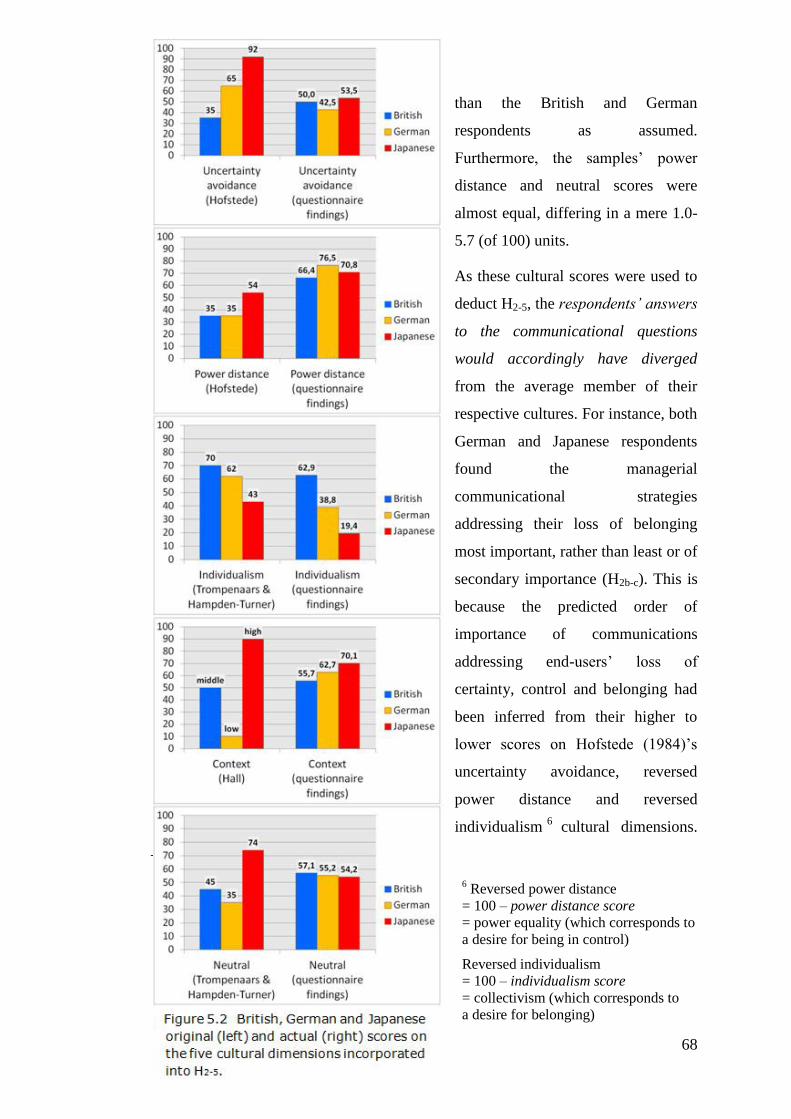
68
than the British and German
respondents as assumed.
Furthermore, the samples’ power
distance and neutral scores were
almost equal, differing in a mere 1.0-
5.7 (of 100) units.
As these cultural scores were used to
deduct H2-5, the respondents’ answers
to the communicational questions
would accordingly have diverged
from the average member of their
respective cultures. For instance, both
German and Japanese respondents
found the managerial
communicational strategies
addressing their loss of belonging
most important, rather than least or of
secondary importance (H2b-c). This is
because the predicted order of
importance of communications
addressing end-users’ loss of
certainty, control and belonging had
been inferred from their higher to
lower scores on Hofstede (1984)’s
uncertainty avoidance, reversed
power distance and reversed
individualism6
cultural dimensions.
6 Reversed power distance
= 100 – power distance score
= power equality (which corresponds to
a desire for being in control)
Reversed individualism
= 100 – individualism score
= collectivism (which corresponds to
a desire for belonging)
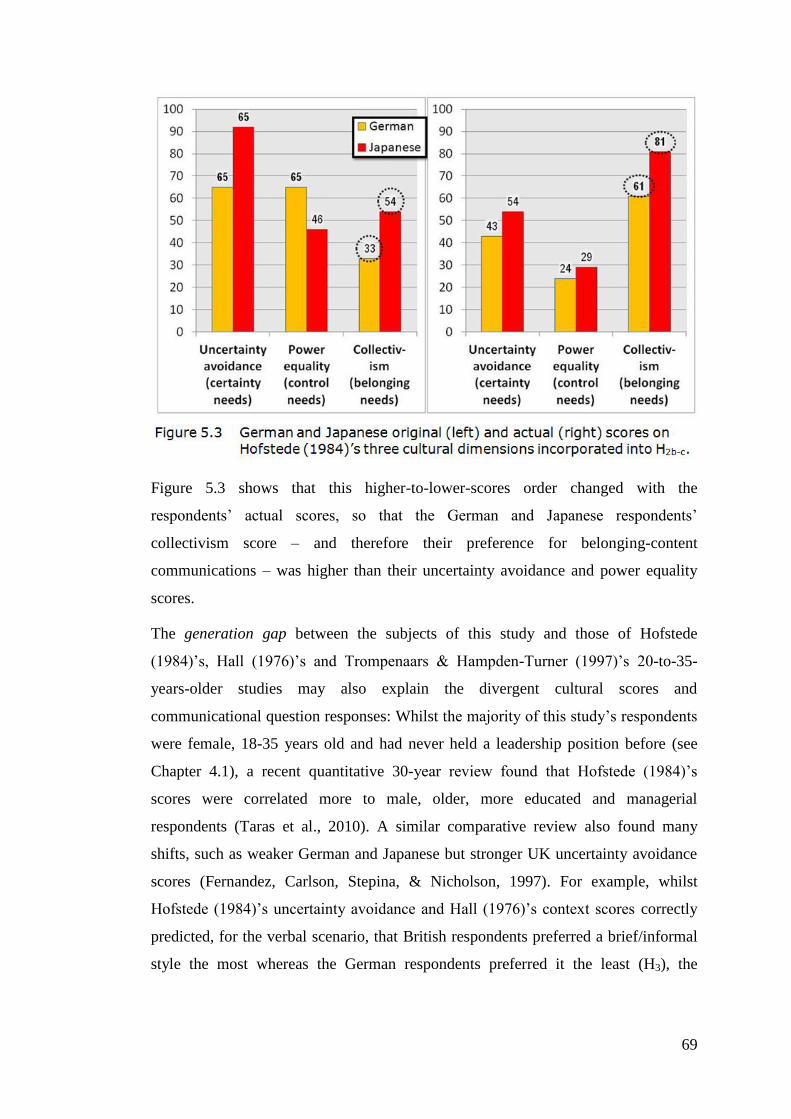
69
Figure 5.3 shows that this higher-to-lower-scores order changed with the
respondents’ actual scores, so that the German and Japanese respondents’
collectivism score – and therefore their preference for belonging-content
communications – was higher than their uncertainty avoidance and power equality
scores.
The generation gap between the subjects of this study and those of Hofstede
(1984)’s, Hall (1976)’s and Trompenaars & Hampden-Turner (1997)’s 20-to-35-
years-older studies may also explain the divergent cultural scores and
communicational question responses: Whilst the majority of this study’s respondents
were female, 18-35 years old and had never held a leadership position before (see
Chapter 4.1), a recent quantitative 30-year review found that Hofstede (1984)’s
scores were correlated more to male, older, more educated and managerial
respondents (Taras et al., 2010). A similar comparative review also found many
shifts, such as weaker German and Japanese but stronger UK uncertainty avoidance
scores (Fernandez, Carlson, Stepina, & Nicholson, 1997). For example, whilst
Hofstede (1984)’s uncertainty avoidance and Hall (1976)’s context scores correctly
predicted, for the verbal scenario, that British respondents preferred a brief/informal
style the most whereas the German respondents preferred it the least (H3), the
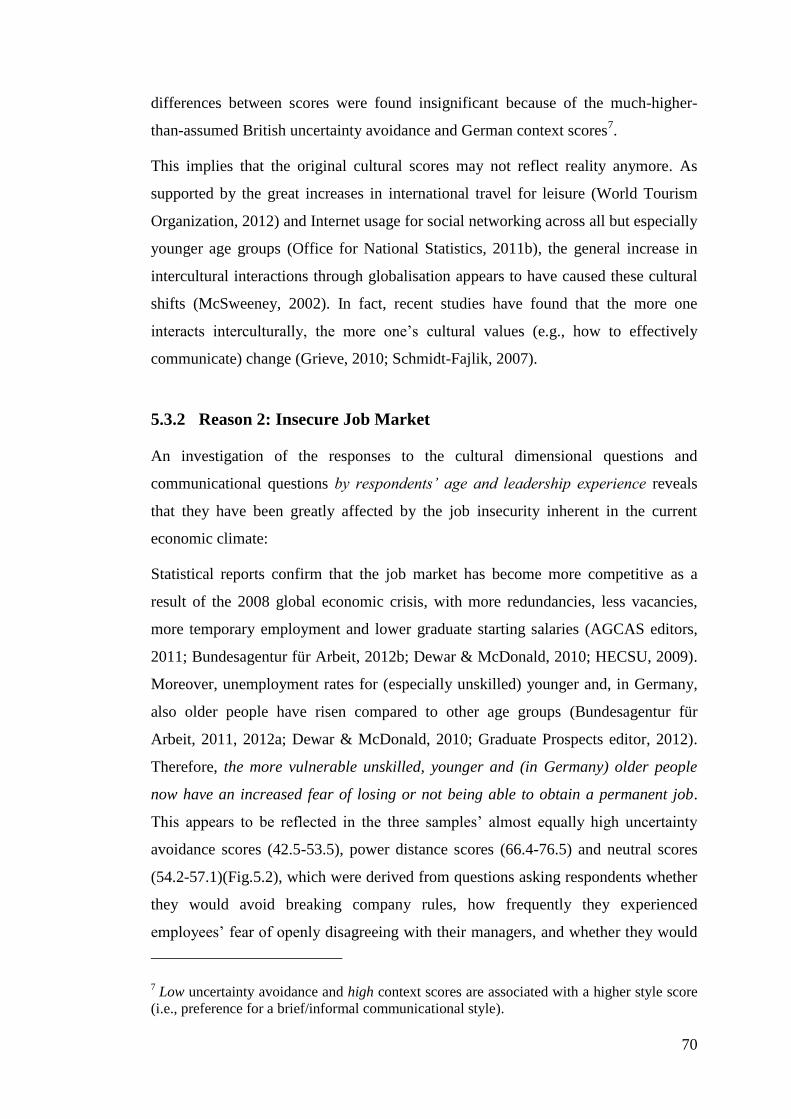
70
differences between scores were found insignificant because of the much-higher-
than-assumed British uncertainty avoidance and German context scores7.
This implies that the original cultural scores may not reflect reality anymore. As
supported by the great increases in international travel for leisure (World Tourism
Organization, 2012) and Internet usage for social networking across all but especially
younger age groups (Office for National Statistics, 2011b), the general increase in
intercultural interactions through globalisation appears to have caused these cultural
shifts (McSweeney, 2002). In fact, recent studies have found that the more one
interacts interculturally, the more one’s cultural values (e.g., how to effectively
communicate) change (Grieve, 2010; Schmidt-Fajlik, 2007).
5.3.2 Reason 2: Insecure Job Market
An investigation of the responses to the cultural dimensional questions and
communicational questions by respondents’ age and leadership experience reveals
that they have been greatly affected by the job insecurity inherent in the current
economic climate:
Statistical reports confirm that the job market has become more competitive as a
result of the 2008 global economic crisis, with more redundancies, less vacancies,
more temporary employment and lower graduate starting salaries (AGCAS editors,
2011; Bundesagentur für Arbeit, 2012b; Dewar & McDonald, 2010; HECSU, 2009).
Moreover, unemployment rates for (especially unskilled) younger and, in Germany,
also older people have risen compared to other age groups (Bundesagentur für
Arbeit, 2011, 2012a; Dewar & McDonald, 2010; Graduate Prospects editor, 2012).
Therefore, the more vulnerable unskilled, younger and (in Germany) older people
now have an increased fear of losing or not being able to obtain a permanent job.
This appears to be reflected in the three samples’ almost equally high uncertainty
avoidance scores (42.5-53.5), power distance scores (66.4-76.5) and neutral scores
(54.2-57.1)(Fig.5.2), which were derived from questions asking respondents whether
they would avoid breaking company rules, how frequently they experienced
employees’ fear of openly disagreeing with their managers, and whether they would
7 Low uncertainty avoidance and high context scores are associated with a higher style score
(i.e., preference for a brief/informal communicational style).
71
hide their negative feelings at work (see Appendix III, p.3, Q2-4). For example,
Figure 5.4 shows, for Trompenaars & Hampden-Turner (1993)’s neutral dimension,
the original (left) and the respondents’ scores by leadership experience (middle) and
age (right). The British and German respondents who had never held a leadership
position before8, the 18-25-year-old British, German and Japanese respondents and
the 46-years-or-older German respondents were much more likely to hide their
negative feelings at work. Indeed, the scores of respondents who had been in a
leadership position before approximate the original scores.
8 Note that the opposite holds true in Japan as status is more closely tied to the company.
Whilst a skilled German or British worker who changes companies can immediately start in
a higher position, a skilled Japanese worker would have to restart at the bottom (Prasol,
2010).
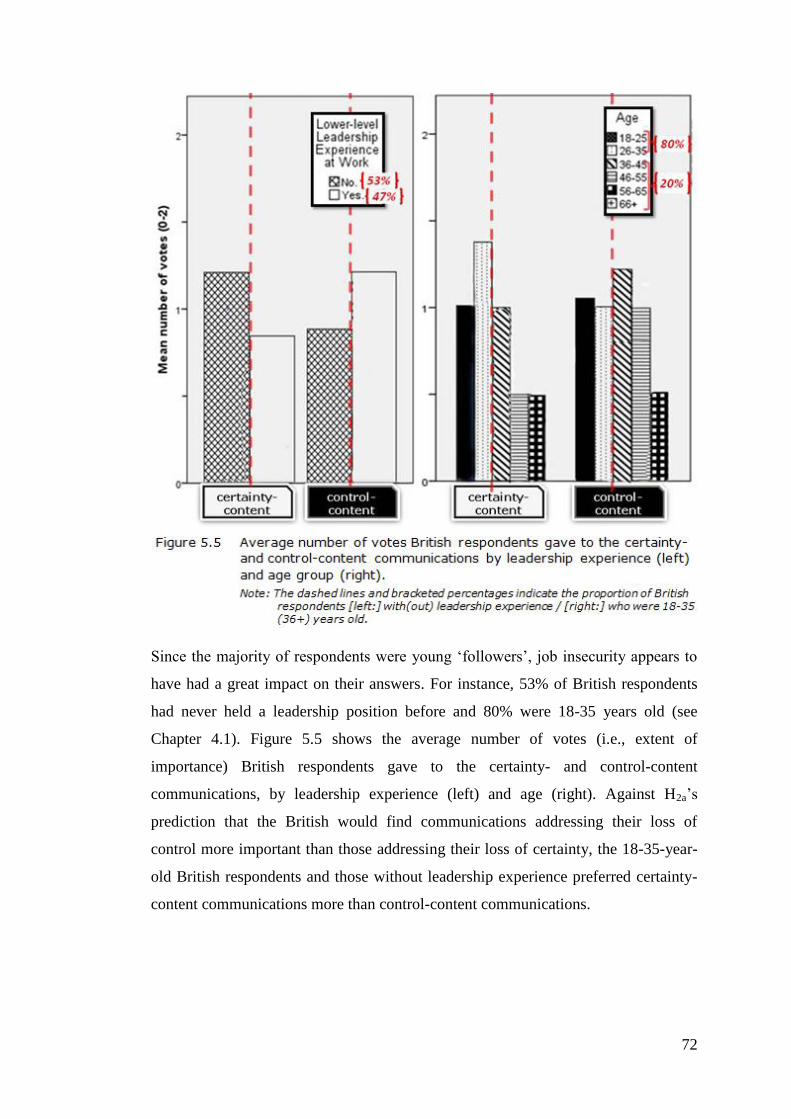
72
Since the majority of respondents were young ‘followers’, job insecurity appears to
have had a great impact on their answers. For instance, 53% of British respondents
had never held a leadership position before and 80% were 18-35 years old (see
Chapter 4.1). Figure 5.5 shows the average number of votes (i.e., extent of
importance) British respondents gave to the certainty- and control-content
communications, by leadership experience (left) and age (right). Against H2a’s
prediction that the British would find communications addressing their loss of
control more important than those addressing their loss of certainty, the 18-35-year-
old British respondents and those without leadership experience preferred certainty-
content communications more than control-content communications.
73
5.3.3 Reason 3: Question or Scenario Situation
The questionnaire included only one question per cultural dimension from the
cultural researchers’ original questions. Moreover, the communicational strategies
suggested by IS researchers had been grouped into single scenarios. Both imply that
the responses might have been affected by the specific question or scenario situation,
because different situations hold different meanings for different cultures
(Trompenaars & Hampden-Turner, 2012):
The German respondents’ unexpectedly high and the Japanese respondents’ not as
high as expected context scores (Fig.5.2) are likely due to the situation presented by
the question, which asked respondents how indirectly they would complain in a
restaurant (see Appendix III, p.3, Q1). The average German respondent complained
indirectly rather than directly, and the average Japanese respondent complained less
indirectly than assumed. Whilst Germans are known for their directness in
communicating, e.g., in clarifying own mistakes or accepting compliments (Golato,
2002; Grieve, 2010; Luchtenberg, 1994), they do communicate as or even more
indirectly than middle-context UK and US cultures when making requests or
confronting others (Friday, 1989; Ogiermann, 2009; Park et al., 2012; Scheu-Lottgen
& Hernández-Campoy, 1998). As for the Japanese, as customers they have a much
higher status than the waiter (Gesteland & Seyk, 2002; Tanaka, Spencer-Oatey, &
Cray, 2000) and so do not need to show respect through the use of indirect language
(Hall, 1976).
Furthermore, the unexpected order of the samples’ action-scenario addressal scores is
likely due to the scenario situation. Whilst Hofstede (1984)’s and Trompenaars &
Hampden-Turner (1993)’s individualism scores, which the respondents’ actual
scores did approximate (Fig.5.2), correctly predicted that British respondents
preferred being addressed individually the most whereas the Japanese respondents
preferred it the least (H5) for the verbal scenario, for the action scenario the German
respondents preferred such addressal the most. Indeed, in comparing the verbal and
action scenarios, it appears as if the British scores dropped whilst simultaneously the
German and Japanese scores rose by 20-25 (of 100) units (see Fig.4.11). As
respondents were asked whether the action-type communications (e.g., providing pay
rises and skills certificates) should be directed at only outstanding individuals or all
members of staff (see Appendix III, p.6, Q3b), the change in scores appears to be due
74
to the cultures’ different meanings of fairness in resource allocation, i.e.: Whilst the
British are highly individualist, they also believe that everyone should be treated
equally regardless of their status (itim, 2012d). On the other hand, whilst the
Germans and Japanese are more collectivist, they also believe that those holding
expertise deserve better treatment (itim, 2012a, 2012c).
These opposing beliefs also explain the unexpected order of the samples’ direction
scores, i.e., the German respondents scoring higher (preferring one-way
communication more) than British respondents: Seeing that four fifths of German
respondents had never held a leadership position before (see Chapter 4.1), they seem
to have judged managers to be better experts for making decisions (see Appendix III,
p.6, Q1b,3a).
5.4 Conclusion and Recommendations to Managers for Optimising
their Pre-Implementation, Pro-System Communications
The previous sections have synthesised the empirical and literature findings to
summarise and discuss their consistencies and inconsistencies. Whilst the
inconsistencies could adequately be explained, it is not clear how strong the impact
of the non-random sampling method, the original cultural scores’ age, or the
grouping of strategies into single scenarios, is. Therefore, more research is desirable
before revising any of the partially supported hypotheses H2-5.
Based on the above discussion, the following recommendations are made to
managers responsible for implementing a new IS in British, German and Japanese
organisations9:
First, in order to prevent their pre-implementation communications from having a
negative impact on end-users, managers should avoid applying the strategies
suggested by IS researchers without considering their cultural context. This is
because British, German and Japanese end-users perceive the same communication
differently: For example, the Japanese perceived communications addressing their
loss of control 4-6 times less important than those addressing their losses of certainty
9 Note that these recommendations are based on findings from national cultural samples
which are non-representative of their respective populations.
75
and belonging, whereas the British perceived such control-content communications
at least as important as certainty- and belonging-content communications.
Second, in order to optimise the positive impact of their pre-implementation
communications on end-users, managers should understand what communicational
strategies are more effective in their cultural context, so that they can focus their
limited resources on these. For instance, Japanese managers could ignore control-
content communicational strategies to focus on the certainty- and belonging-content
strategies. British and German managers could focus on certainty-content strategies
more than control-content strategies, if their workforce consists mainly of younger
(and, in the German case, also older), unskilled employees.
Third, managers must understand how to apply the chosen communicational
strategies in order to optimise their positive impact on end-users. For example, when
communicating verbally, British managers should address end-users individually,
whereas Japanese managers should address them collectively. But when extra
resources, such as pay or certificates, are involved, Japanese and German managers
should allocate them only to deserving experts and hard workers, whilst British
managers should emphasise that all end-users are treated equally. Besides, British,
German and Japanese managers alike should allow end-user feedback and
communicate in a more rather than less detailed and formalised way. However, as the
amount of information desired by end-users depends on the specific
communicational strategy, managers could provide less detail initially, whilst
ensuring access to more detailed information without arousing end-users’ fear that
seeking it would negatively impact their job security – e.g., providing handouts that
outline the system’s new functions whilst providing all the details on a website.
Finally, in order to succeed their resistance mitigation in the long term, managers
should make these optimised pre-implementation communications part of an overall
pre- to post-implementation communications plan.
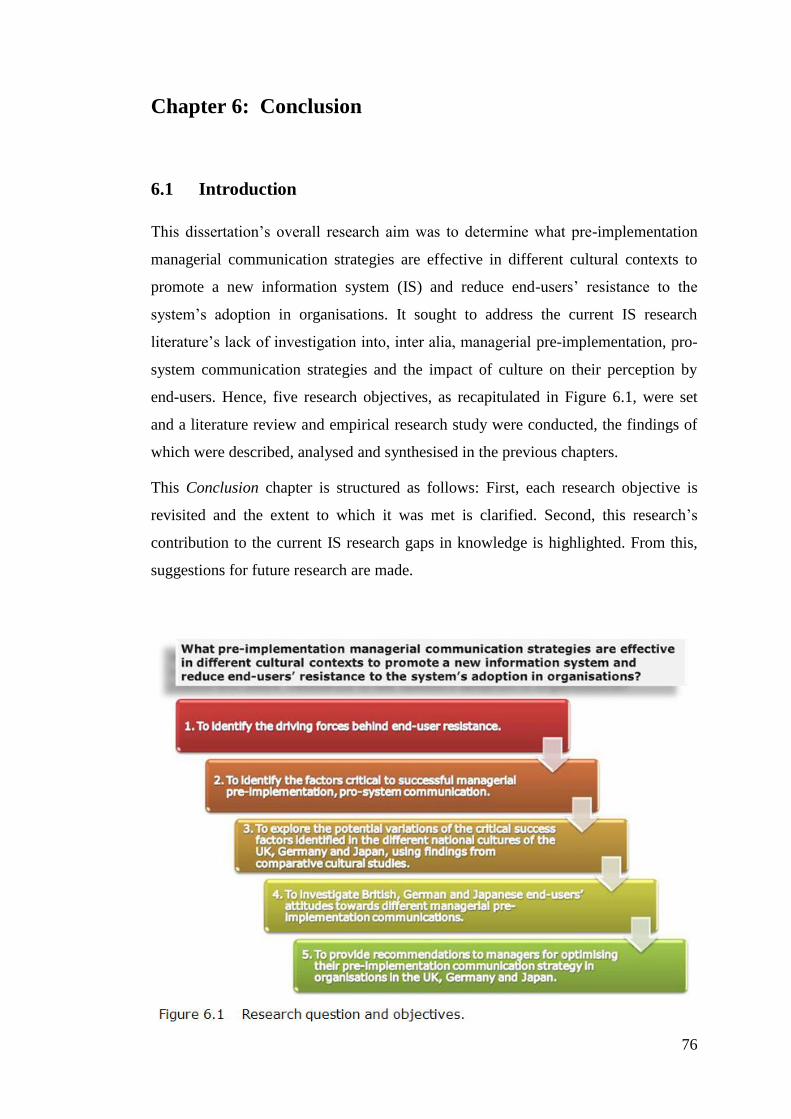
76
Chapter 6: Conclusion
6.1 Introduction
This dissertation’s overall research aim was to determine what pre-implementation
managerial communication strategies are effective in different cultural contexts to
promote a new information system (IS) and reduce end-users’ resistance to the
system’s adoption in organisations. It sought to address the current IS research
literature’s lack of investigation into, inter alia, managerial pre-implementation, pro-
system communication strategies and the impact of culture on their perception by
end-users. Hence, five research objectives, as recapitulated in Figure 6.1, were set
and a literature review and empirical research study were conducted, the findings of
which were described, analysed and synthesised in the previous chapters.
This Conclusion chapter is structured as follows: First, each research objective is
revisited and the extent to which it was met is clarified. Second, this research’s
contribution to the current IS research gaps in knowledge is highlighted. From this,
suggestions for future research are made.
77
6.2 Research Objectives Revisited: Concluding Overview of
Findings
Objective 1 was achieved by reviewing the IS resistance literature, although limited
to English-language sources. Thus, the driving forces behind end-user resistance
were identified as – depending on whether the people-, system- or interaction-
oriented perspective is adopted – either the end-user’s individual characteristics, the
system’s dissatisfying characteristics, or the by the end-user negatively appraised
totality of socio-political organisational changes including the people- and system-
oriented drivers. The interaction-oriented drivers were classified into three content
categories: loss of certainty (e.g., increased job insecurity), loss of control (e.g.,
increased workload and a power decrease) and loss of belonging (e.g., lack of
identity- and value-fit).
Objective 2, likewise, was met through an IS literature review and limited to
English-language sources: The factors critical to successful managerial pre-
implementation, pro-system communication were identified as developing an
integrated and iterative communications plan which incorporates pre-implementation
strategies that address end-users’ needs for certainty (e.g., revising end-users’
employment contracts and saying they will not be made redundant), control (e.g.,
temporarily reducing performance targets and justifying others’ power increase) and
belonging (e.g., setting up counselling services and expressing sympathy).
Objective 3 was obtained by widening the scope of investigation to include findings
from the cultural research literature, although limited to three of the major
comparative cultural studies. Based on the underlying assumption that different
cultures perceive the same managerial communication differently (H1), the potential
British, German and Japanese cultural variations of the identified managerial
communicational strategies were explored to deduct hypotheses H2-5 regarding these
cultures’ preferred communicational content and manner (i.e., style, direction and
addressal) in relation to each other.
Objective 4 was achieved through a quantitative empirical research project using an
online questionnaire, which was designed to test hypotheses H1-5, distributed to a
total of 209 respondents of approximately equal nationality shares, and analysed
using descriptive statistics and ANOVA. Whilst being limited to non-random
78
samples, the British, German and Japanese end-users’ attitudes towards the
different managerial communicational strategies were investigated by analysing
the responses to questions asking respondents to choose between and rate different
communicational scenarios. H1 was fully and H2-5 were partially supported.
Objective 5 was met through a synthesis of the IS and cultural literature and
empirical findings: From a discussion of their consistencies and inconsistencies,
some practical implications, although limited in generalisability, were drawn. Thus,
managers in the UK, Germany and Japan were advised to always consider the
cultural context before applying any of the universally suggested strategies. Further
country-specific recommendations for optimising their system pre-implementation
communication strategy, in terms of the culturally preferred, hence more effective
communicational content and manner, were provided.
6.3 Contribution to Knowledge and Suggestions for Future Research
Apart from its practical contribution to managers, this study also contributes
theoretically and methodologically to the IS research literature in three ways:
Firstly, it is valuable in that it addressed all of the five research areas identified in
Chapter 1 as still lacking investigation: the impact of culture; the practical details
(i.e., manner) of the suggested communicational resistance mitigation strategies; the
IS pre-implementation stage; the interaction-oriented perspective; and quantitative
methodologies.
Secondly, this research pioneered an attempt at bridging the gap between the IS and
cultural research fields. Whilst its findings are limited in generalisability due to the
non-random sample selection, they do emphasise the need for further integrated
culture—IS research as H1’s hypothesised culturally different perception was
strongly supported.
Thirdly, the developed questionnaire can be used by other researchers to explore the
investigated and/or other national cultures’ differences.
79
To conclude this dissertation, the following suggestions for future research are
made:
A replication of this study with random samples could be conducted to
produce more reliable findings. It would also be useful to include all of the
original questions of the five cultural dimensions, to determine how the
cultural scores may have changed with the increase in intercultural contact
and the current economic recession’s job market insecurity.
The questionnaire could also be revised to investigate each of the identified
managerial communication strategies on its own rather than combining them
into the five different content and verbal-/action-type scenarios. This would
help determine whether other, non-investigated variables (e.g., the role of
expertise for the Germans) might affect the results.
The forced-option questions could also be complemented by additional Likert
rating scales, providing findings that are less limited in their relativity to the
other investigated cultures and could thus be more useful for making practical
recommendations. Alternatively, as was done with two of the strategies, each
strategy’s combined manner scenarios could be produced with GMA.
Furthermore, the strategies to be considered could be expanded by including
findings from the management and the German and Japanese (or other
culture’s) IS literature.
Finally, additional questions could be included to investigate the influence of
end-users’ colleagues, opinion leaders, incumbent system experts and
supervisors as potential change agents or champions whom managers could
exploit. This area was identified as still lacking investigation (see 2.3.2) but
was excluded from this study as it was not directly relevant to the research
aim and objectives.
Total: 15,957 words
80
Bibliography
AGCAS editors. (2011, December). Japan: job market. Prospects.ac.uk. Retrieved
August 21, 2012, from http://www.prospects.ac.uk/japan_job_market.htm
Aladwani, A. M. (2001). Change management strategies for successful ERP
implementation. Business Process Management Journal, 7(3), 266–275.
doi:10.1108/14637150110392764
Allport, G. W. (1954). Formation of in-groups. The nature of prejudice (pp. 29–47).
Reading, MA: Addison-Wesley Publishing Company.
Alvarez, R. (2008). Examining technology, structure and identity during an
Enterprise System implementation. Information Systems Journal, 18(2), 203–
224. doi:10.1111/j.1365-2575.2007.00286.x
Avgerou, C. (2001). The significance of context in information systems and
organizational change. Information Systems Journal, 11(1), 43–63.
doi:10.1046/j.1365-2575.2001.00095.x
Bailey, K. D. (1994). Methods of social research (4th ed.). Oxford: Maxwell
Macmillan International.
Baskerville, R. F. (2003). Hofstede never studied culture. Accounting, Organizations
and Society, 28(1), 1–14. doi:10.1016/S0361-3682(01)00048-4
Beaudry, A., & Pinsonneault, A. (2005). Understanding user responses to
information technology: a coping model of user adaptation. MIS Quarterly,
29(3), 493–524.
Beaudry, A., & Pinsonneault, A. (2010). The other side of acceptance: studying the
direct and indirect effects of emotions on information technology use. MIS
Quarterly, 34(4), 689–710.
81
Beniers, C. J. M. (2006). Managerwissen kompakt: interkulturelle Kommunikation.
Pocket Power. München: Carl Hanser Verlag.
Beynon-Davies, P. (1999). Human error and information systems failure : the case of
the London ambulance service computer-aided despatch system project.
Interacting with Computers, 11(6), 699–720. doi:10.1016/S0953-
5438(98)00050-2
Bradfield, R., Wright, G., Burt, G., Cairns, G., & Van Der Heijden, K. (2005). The
origins and evolution of scenario techniques in long range business planning.
Futures, 37(8), 795–812. doi:10.1016/j.futures.2005.01.003
Bradley, R. V., Pridmore, J. L., & Byrd, T. A. (2006). Information systems success
in the context of different corporate cultural types : an empirical
investigation. Journal of Management Information Systems, 23(2), 267–294.
doi:10.2753/MIS0742-1222230211
Bundesagentur für Arbeit. (2011). Der Arbeitsmarkt in Deutschland: jüngere
Menschen ohne Berufsabschluss. Nürnberg: Bundesagentur für Arbeit.
Retrieved from http://statistik.arbeitsagentur.de/Statischer-
Content/Arbeitsmarktberichte/Berichte-
Broschueren/Arbeitsmarkt/Generische-Publikationen/Juengere-Menschen-
ohne-Berufsabschluss-2011.pdf
Bundesagentur für Arbeit. (2012a). Der Arbeitsmarkt in Deutschland: Ältere am
Arbeitsmarkt. Nürnberg: Bundesagentur für Arbeit. Retrieved from
http://statistik.arbeitsagentur.de/Statischer-
Content/Arbeitsmarktberichte/Berichte-
Broschueren/Arbeitsmarkt/Generische-Publikationen/Aeltere-am-
Arbeitsmarkt-2011.pdf
82
Bundesagentur für Arbeit. (2012b, July 24). Aktuelle Entwicklungen in der
Zeitarbeit. Arbeitsagentur.de. Retrieved August 21, 2012, from
http://www.arbeitsagentur.de/nn_27908/zentraler-Content/A01-Allgemein-
Info/A015-Oeffentlichkeitsarbeit/Allgemein/Broschuere-Entwicklungen-
Zeitarbeit.html
Burr, V. (2003). The role of language in social constructionism. Social
constructionism (pp. 46–62). Hove: Routledge.
BusinessDictionary.com. (2012). Convenience Sampling. BusinessDictionary.com.
WebFinance, Inc. Retrieved from
http://www.businessdictionary.com/definition/convenience-sampling.html
Butler Group. (2004). Exploiting corporate information assets : generating business
value from information resources (Technology management and strategy
report). Hull.
Cadle, J., & Yeates, D. (2001). Project management for information systems (3rd
ed.). Harlow: Pearson Education Ltd.
Cashmore, C. (1991). Business information: systems and strategies. Hemel
Hempstead: Prentice Hall International.
Coates, J. F. (2000). Scenario Planning. Technological Forecasting and Social
Change, 65(1), 115–123. doi:10.1016/S0040-1625(99)00084-0
Creswell, J. W. (2003). Research design: qualitative, quantitative, and mixed
methods approaches (2nd ed.). London: Sage Publications Ltd.
Davis, F. D. (1989). Perceived usefulness, perceived ease of use, and user acceptance
of information technology. MIS Quarterly, 13(3), 319–340.
doi:10.2307/249008
83
Davis, F. D. (1993). User acceptance of information technology: system
characteristics, user perceptions and behavioral impacts. International
Journal of Man-Machine Studies, 38(3), 475–487.
doi:10.1006/imms.1993.1022
De Jouvenel, H. (2000). A brief methodological guide to scenario building.
Technological Forecasting and Social Change, 65(1), 37–48.
doi:10.1016/S0040-1625(99)00123-7
Dewar, C., & McDonald, L. (2010, April). Your degree...what next?: job market.
Prospects.ac.uk. Retrieved August 21, 2012, from
http://www.prospects.ac.uk/your_degree_what_next_job_market.htm
Elie-Dit-Cosaque, C. M., & Straub, D. W. (2011). Opening the black box of system
usage: user adaptation to disruptive IT. European Journal of Information
Systems, 20(5), 589–607. doi:10.1057/ejis.2010.23
Elie-Dit-Cosaque, C., Pallud, J., & Kalika, M. (2011). The influence of individual,
contextual, and social factors on perceived behavioral control of information
technology: a field theory approach. Journal of Management Information
Systems, 28(3), 201–234. doi:10.2753/MIS0742-1222280306
Fernandez, D. R., Carlson, D. S., Stepina, L. P., & Nicholson, J. D. (1997).
Hofstede’s country classification 25 years later. The Journal of Social
Psychology, 137(1), 43–54.
Ferneley, E. H., & Sobreperez, P. (2006). Resist, comply or workaround? An
examination of different facets of user engagement with information systems.
European Journal of Information Systems, 15(4), 345–356.
doi:10.1057/palgrave.ejis.3000629
84
Field, A. (2005). Discovering statistics using SPSS: and sex, drugs and rock’n’roll
(2nd ed.). London: SAGE Publications Ltd.
Fink, G., Kölling, M., & Neyer, A.-K. (2005). The cultural standard method. EI
Working Papers / Europainstitut (Vol. 62). Vienna: Europainstitut, WU
Vienna University of Economics and Business. Retrieved from
http://epub.wu.ac.at/450/
Fiske, J. (2011). Introduction to communication studies (3rd ed.). Abingdon:
Routledge.
Friday, R. A. (1989). Contrasts in discussion behaviors of German and American
managers. International Journal of Intercultural Relations, 13(4), 429–446.
doi:10.1016/0147-1767(89)90022-9
Gerbner, G. (1956). Toward a general model of communication. Audio Visual
Communication Review, 4(3), 171–199. doi:10.1007/BF02717110
Gesteland, R. R., & Seyk, G. F. (2002). Marketing across cultures in Asia: a
practical guide. Copenhagen: Copenhagen Business School Press.
Gill, D., & Adams, B. (2002). ABC of communication studies (2nd ed.). Cheltenham:
Nelson Thornes Ltd.
Godet, M. (2000). The art of scenarios and strategic planning: tools and pitfalls.
Technological Forecasting and Social Change, 65(1), 3–22.
doi:10.1016/S0040-1625(99)00120-1
Golato, A. (2002). German compliment responses. Journal of Pragmatics, 34(5),
547–571. doi:10.1016/S0378-2166(01)00040-6
Graduate Prospects editor. (2012, May). Latest news: unemployment down by
45,000. Prospects.ac.uk. Retrieved August 21, 2012, from
85
http://www.prospects.ac.uk/latest_news_unemployment_down_by_45000.ht
m
Grieve, A. (2010). ‘Aber ganz ehrlich’: differences in episodic structure, apologies
and truth-orientation in German and Australian workplace telephone
discourse. Journal of Pragmatics, 42(1), 190–219.
doi:10.1016/j.pragma.2009.05.009
Guardian Government Computing. (2012, June 11). New system causes fall in
London Ambulance Service’s 999 response. www.guardian.co.uk. Retrieved
from http://www.guardian.co.uk/government-computing-
network/2012/jun/11/london-ambulance-service-drop-response-times-
commandpoint
Hall, E. T. (1959). The silent language. New York: Anchor Books.
Hall, E. T. (1976). Beyond culture. New York: Anchor Books.
HECSU. (2009, July). What does the job market look like for the class of 2008?
Prospects.ac.uk. Retrieved August 21, 2012, from
http://ww2.prospects.ac.uk/cms/ShowPage/Home_page/Main_menu___Resea
rch/Labour_market_information/Labour_market_FAQs/What_does_the_job_
market_look_like_for_the_class_of_2008_/p!eaLXbdj
Hills, M. (2002). Kluckhohn and Strodtbeck’s values orientation theory. Online
Readings in Psychology and Culture, 4(4). Retrieved from
http://scholarworks.gvsu.edu/orpc/vol4/iss4/3
Hinton, M. (2006). Generic types of information systems. In M. Hinton (Ed.),
Introducing information management : the business approach (pp. 91–97).
Oxford: Elsevier Butterworth-Heinemann.
86
Hirschheim, R., & Newman, M. (1988). Information systems and user resistance:
theory and practice. The Computer Journal, 31(5), 398–408.
doi:10.1093/comjnl/31.5.398
Hitchcock, G. (2011, June 9). London Ambulance Service’s computer crashes.
www.guardian.co.uk. Retrieved from http://www.guardian.co.uk/healthcare-
network/2011/jun/09/london-ambulance-service-emergency-computer-crash
Hofstede, G., & Bond, M. H. (1988). The Confucius connection: from cultural roots
to economic growth. Organizational Dynamics, 16(4), 5–21.
doi:10.1016/0090-2616(88)90009-5
Hofstede, G. H. (1984). Culture’s consequences: international differences in work-
related values (Abridged ed.). London: Sage Publications.
Hofstede, G. H. (2001). Culture’s consequences: comparing values, behaviors,
institutions and organizations across nations (2nd ed.). London: Sage
Publications.
Hofstede, G. H., Hofstede, G. J., & Minkov, M. (2010). Cultures and organizations:
software of the mind: intercultural cooperation and its importance for
survival (3rd ed.). New York; London: McGraw-Hill.
Holliday, A. (1999). Small cultures. Applied Linguistics, 20(2), 237 –264.
doi:10.1093/applin/20.2.237
Holt, M. K. (2011). Culture-free or culture-bound? Two views of swaying branches.
International Journal of Business, Humanities and Technology, 1(3), 80–87.
House, R., Javidan, M., & Dorfman, P. (2001). Project GLOBE: an introduction.
Applied Psychology, 50(4), 489–505. doi:10.1111/1464-0597.00070
87
Hussain, Z. I., & Cornelius, N. (2009). The use of domination and legitimation in
information systems implementation. Information Systems Journal, 19(2),
197–224. doi:10.1111/j.1365-2575.2008.00322.x
itim. (2012a). National culture: Japan. www.geert-hofstede.com. Retrieved June 4,
2012, from http://geert-hofstede.com/japan.html
itim. (2012b). National culture: dimensions. www.geert-hofstede.com. Retrieved June
4, 2012, from http://geert-hofstede.com/dimensions.html
itim. (2012c). National culture: Germany. www.geert-hofstede.com. Retrieved June
4, 2012, from http://geert-hofstede.com/germany.html
itim. (2012d). National culture: United Kingdom. www.geert-hofstede.com.
Retrieved June 4, 2012, from http://geert-hofstede.com/united-kingdom.html
Javidan, M., & House, R. J. (2002). Leadership and cultures around the world:
findings from GLOBE: an introduction to the special issue. Journal of World
Business, 37(1), 1–2. doi:10.1016/S1090-9516(01)00068-2
Javidan, M., House, R. J., Dorfman, P. W., Hanges, P. J., & de Luque, M. S. (2006).
Conceptualizing and measuring cultures and their consequences: a
comparative review of GLOBE’s and Hofstede’s approaches. Journal of
International Business Studies, 37(6), 897–914.
doi:10.1057/palgrave.jibs.8400234
Jiang, J. J., Muhanna, W. A., & Klein, G. (2000). User resistance and strategies for
promoting acceptance across system types. Information & Management,
37(1), 25–36. doi:10.1016/S0378-7206(99)00032-4
Joshi, K. (1991). A model of users’ perspective on change: the case of information
systems technology implementation. MIS Quarterly, 15(2), 229–242.
doi:10.2307/249384
88
Katan, D. (2004). Translating cultures: an introduction for translators, interpreters
and mediators (2nd ed.). Manchester: St. Jerome Publishing.
Kim, H.-W. (2011). The effects of switching costs on user resistance to enterprise
systems implementation. IEEE Transactions on Engineering Management,
58(3), 471 –482. doi:10.1109/TEM.2010.2089630
Kim, H.-W., & Kankanhalli, A. (2009). Investigating user resistance to information
systems implementation: a status quo bias perspective. Management
Information Systems Quarterly, 33(3), 567–582.
Klaus, T., & Blanton, J. E. (2010). User resistance determinants and the
psychological contract in enterprise system implementations. European
Journal of Information Systems, 19(6), 625–636. doi:10.1057/ejis.2010.39
Klaus, T., Wingreen, S., & Blanton, J. E. (2007). Examining user resistance and
management strategies in enterprise system implementations. Proceedings of
the 2007 ACM SIGMIS CPR Conference Global Information Technology
Workforce (pp. 55–62). Presented at the 45th Annual Computer Personnel
Research Conference 2007, St Louis, Missouri, USA: Assoc Computing
Machinery.
Kluckhohn, F. R., & Strodtbeck, F. L. (1961). Variations in value orientations.
Evanston, IL: Peterson.
Kwahk, K.-Y., & Kim, H.-W. (2007). Managing readiness in enterprise systems-
driven organizational change. Behaviour & Information Technology, 27(1),
79–87. doi:10.1080/01449290701398475
Lapointe, L., & Rivard, S. (2005). A multilevel model of resistance to information
technology implementation. MIS Quarterly, 29(3), 461–491.
89
Lapointe, L., & Rivard, S. (2007). A triple take on information system
implementation. Organization Science, 18(1), 89–107.
doi:10.1287/orsc.1060.0225
LAS. (2012). London Ambulance Service NHS Trust.
www.londonambulance.nhs.uk. Retrieved July 23, 2012, from
http://www.londonambulance.nhs.uk/
Leonard-Barton, D., & Deschamps, I. (1988). Managerial influence in the
implementation of new technology. Management Science, 34(10), 1252–
1265. doi:10.1287/mnsc.34.10.1252
Luchtenberg, S. (1994). A friendly voice to help you vs. working thoroughly through
your manual: pragmatic differences between American and German software
manuals. Journal of Pragmatics, 21(3), 315–319. doi:10.1016/0378-
2166(94)90004-3
Marakas, G. M., & Hornik, S. (1996). Passive resistance misuse: overt support and
covert recalcitrance in IS implementation. European Journal of Information
Systems, 5(3), 208–219. doi:10.1057/ejis.1996.26
Markus, M. L. (1983). Power, politics, and MIS implementation. Commun. ACM,
26(6), 430–444. doi:10.1145/358141.358148
Martinko, M., Henry, J., & Zmud, R. (1996). An attributional explanation of
individual resistance to the introduction of information technologies in the
workplace. Behaviour & Information Technology, 15(5), 313–330.
doi:10.1080/014492996120085a
McSweeney, B. (2002). Hofstede’s model of national cultural differences and their
consequences: a triumph of faith - a failure of analysis. Human Relations,
55(1), 89 –118. doi:10.1177/0018726702551004
90
Meissonier, R., & Houzé, E. (2010). Toward an ‘IT conflict-resistance theory’:
action research during IT pre-implementation. European Journal of
Information Systems, 19(5), 540–561. doi:10.1057/ejis.2010.35
Mercer, D. (1995). Simpler scenarios. Management Decision, 33(4), 32–40.
doi:10.1108/00251749510084662
Merriam-Webster Online Dictionary. (2012a). Communication. Merriam-Webster’s
Collegiate® Dictionary, Eleventh Edition (Online). Merriam-Webster, Inc.
Retrieved from http://www.merriam-webster.com/dictionary/communication
Merriam-Webster Online Dictionary. (2012b). Questionnaire. Merriam-Webster’s
Collegiate® Dictionary, Eleventh Edition (Online). Merriam-Webster, Inc.
Retrieved from http://www.merriam-webster.com/dictionary/questionnaire
Mitchell, J. I., Gagné, M., Beaudry, A., & Dyer, L. (2012). The role of perceived
organizational support, distributive justice and motivation in reactions to new
information technology. Computers in Human Behavior, 28(2), 729–738.
doi:10.1016/j.chb.2011.11.021
Myers, M. D., & Tan, F. B. (2003). Beyond models of national culture in information
systems research. In F. B. Tan (Ed.), Advanced topics in global information
management (Vol. 2, pp. 14–29). Hershey, PA: Idea Group Publishing.
Nach, H., & Lejeune, A. (2010). Coping with information technology challenges to
identity: a theoretical framework. Computers in Human Behavior, 26(4),
618–629. doi:10.1016/j.chb.2009.12.015
Office for National Statistics. (2010). E-commerce and ICT activity 2009 (Statistical
Bulletin). ICT Activity of UK Businesses. Office for National Statistics
(ONS). Retrieved from http://www.ons.gov.uk/ons/rel/rdit2/ict-activity-of-
uk-businesses/2009/index.html
91
Office for National Statistics. (2011a). E-commerce and ICT activity 2010 (Statistical
Bulletin). ICT Activity of UK Businesses. Office for National Statistics
(ONS). Retrieved from http://www.ons.gov.uk/ons/rel/rdit2/ict-activity-of-
uk-businesses/2010/stb-e-commerce-and-ict-activity-2010.html
Office for National Statistics. (2011b). Internet access: households and individuals,
2011 (Statistical Bulletin). Internet access - households and individuals.
Office for National Statistics (ONS). Retrieved from
http://www.ons.gov.uk/ons/rel/rdit2/internet-access---households-and-
individuals/2011/stb-internet-access-2011.html
Office for National Statistics. (2012). Labour market statistics : July 2012 (Statistical
Bulletin). Regional labour market statistics. Office for National Statistics
(ONS). Retrieved from http://www.ons.gov.uk/ons/rel/lms/labour-market-
statistics/july-2012/index.html
Ogiermann, E. (2009). Politeness and in-directness across cultures: a comparison of
English, German, Polish and Russian requests. Journal of Politeness
Research-Language Behaviour Culture, 5(2), 189–216.
doi:10.1515/JPLR.2009.011
Oppenheim, A. N. (1992). Questionnaire design, interviewing and attitude
measurement (New ed.). London: Pinter.
Orna, E. (2006). Organizations and information. In M. Hinton (Ed.), Introducing
information management : the business approach (pp. 75–85). Oxford:
Elsevier Butterworth-Heinemann.
Park, H. S., Levine, T. R., Weber, R., Lee, H. E., Terra, L. I., Botero, I. C.,
Bessarabova, E., et al. (2012). Individual and cultural variations in direct
92
communication style. International Journal of Intercultural Relations, 36(2),
179–187. doi:10.1016/j.ijintrel.2011.12.010
Pike, K. L. (1985). Systematic emic pattern above abstract etic universals: a query.
Word-Journal of the International Linguistic Association, 36(2), 179–181.
Polites, G. L., & Karahanna, E. (2012). Shackled to the status quo: the inhibiting
effects of incumbent system habit, switching costs, and inertia on new system
acceptance. MIS Quarterly, 36(1), 21–42.
Prasad, P., & Prasad, A. (2000). Stretching the iron cage: the constitution and
implications of routine workplace resistance. Organization Science, 11(4),
387–403. doi:10.1287/orsc.11.4.387.14597
Prasol, A. (2010). Modern Japan: origins of the mind. Japanese traditions and
approaches to contemporary life. Singapore: World Scientific.
Ritchey, T. (2011a). Wicked problems - social messes: decision support modelling
with morphological analysis. Risk, Governance and Society (Vol. 17).
Heidelberg: Springer.
Ritchey, T. (2011b). General morphological analysis: a general method for non-
quantified modelling. Fritz Zwicky, Morphologie and Policy Analysis (pp. 1–
11). Presented at the 16th EURO Conference on Operational Analysis (1998),
Brussels: Swedish Morphological Society (www.swemorph.com). Retrieved
from http://www.swemorph.com/ma.html
Robson, W. (2006). The need for redesign - a paradigm shift? In M. Hinton (Ed.),
Introducing information management : the business approach (pp. 190–197).
Oxford: Elsevier Butterworth-Heinemann.
Saunders, M., Lewis, P., & Thornhill, A. (2009). Research methods for business
students (5th ed.). Harlow: Financial Times Prentice Hall. Retrieved from
93
http://www.dawsonera.com/depp/reader/protected/external/AbstractView/S97
80273716938
Sayer, A. (1997). Essentialism, social constructionism, and beyond. The Sociological
Review, 45(3), 453–487. doi:10.1111/1467-954X.00073
Scheu-Lottgen, U. D., & Hernández-Campoy, J. M. (1998). An analysis of
sociocultural miscommunication: English, Spanish and German.
International Journal of Intercultural Relations, 22(4), 375–394.
doi:10.1016/S0147-1767(98)00006-6
Schmidt-Fajlik, R. (2007). Introducing non-verbal communication to Japanese
university students: determining content. Journal of Intercultural
Communication, (15). Retrieved from
http://www.immi.se/jicc/index.php/jicc/article/view/78/49
Selander, L., & Henfridsson, O. (2011). Cynicism as user resistance in IT
implementation. Information Systems Journal. doi:10.1111/j.1365-
2575.2011.00386.x
Shannon, C. E., & Weaver, W. (1949). The Mathematical Theory of Communication.
Urbana, IL: University of Illinois Press.
Shoemaker, P. J. H. (1995). Scenario planning: a tool for strategic thinking. Sloan
Management Review, 36(2), 25–40.
Smith, P. B. (2008). Book review: Michael Minkov, What makes us different and
similar: a new interpretation of the World Values Survey and other cross-
cultural data. International Journal of Cross Cultural Management, 8(1),
110–112. doi:10.1177/14705958080080010602
Tanaka, N., Spencer-Oatey, H., & Cray, E. (2000). ‘It’s not my fault!’: Japanese and
English responses to unfounded accusations. In H. Spencer-Oatey (Ed.),
94
Culturally speaking: managing rapport through talk across cultures, Open
linguistics series (pp. 76–97). London: Continuum.
Taras, V., Kirkman, B. L., & Steel, P. (2010). Examining the impact of Culture’s
Consequences: a three-decade, multilevel, meta-analytic review of Hofstede’s
cultural value dimensions. Journal of Applied Psychology, 95(3), 405–439.
doi:10.1037/a0018938.supp
Triandis, H. C. (1994). Culture and social behavior. New York: McGraw-Hill, Inc.
Trompenaars, F., & Hampden-Turner, C. (1997). Riding the waves of culture:
understanding cultural diversity in business (2nd ed.). London: Nicholas
Brealey.
Trompenaars, F., & Hampden-Turner, C. (2012). Riding the waves of culture:
understanding diversity in global business (3rd ed.). London: Nicholas
Brealey.
Tsui, A. S., Nifadkar, S. S., & Ou, A. Y. (2007). Cross-national, cross-cultural
organizational behavior research: advances, gaps, and recommendations.
Journal of Management, 33(3), 426–478. doi:10.1177/0149206307300818
Turban, E., & Volonino, L. (2010). Information technology for management :
transforming organizations in the digital economy (7th ed.). Hoboken: John
Wiley & Sons, Inc.
Venkatesh, V., Davis, F. D., & Morris, M. G. (2007). Dead or alive? The
development, trajectory and future of technology adoption research. Journal
of the Association for Information Systems, 8(4), 267–286.
Walber, T. (2003, August 4). Seminar: ‘Berühmt-berüchtigte Softwarefehler’
Sommersemester 2003 - Thema: London Ambulance Dispatch System und
Gepäcktransport am Flughafen Denver (Logistik) (Seminararbeit).

95
Universität Koblenz-Landau, Koblenz. Retrieved from
http://formal.iti.kit.edu/~beckert/teaching/Seminar-Softwarefehler-
SS03/Ausarbeitungen/walber.pdf
Watkins, L., & Gnoth, J. (2011). The value orientation approach to understanding
culture. Annals of Tourism Research, 38(4), 1274–1299.
doi:10.1016/j.annals.2011.03.003
Westley, B. H., & MacLean, M. S. (1957). A Conceptual Model for Communications
Research. Journalism Quarterly, 34(1), 31–38.
doi:10.1177/107769905703400103
Wilkinson, D. (2000). The researcher’s toolkit : the complete guide to practitioner
research. London: RoutledgeFalmer.
Wilson, F. M. (2004). Organizational behaviour and work: a critical introduction
(2nd ed.). Oxford: Oxford University Press.
Wilson, I. (2000). From scenario thinking to strategic action. Technological
Forecasting and Social Change, 65(1), 23–29. doi:10.1016/S0040-
1625(99)00122-5
World Tourism Organization. (2012). Tourism highlights: 2012 edition. Spain:
World Tourism Organization (UNWTO). Retrieved from
http://dtxtq4w60xqpw.cloudfront.net/sites/all/files/docpdf/unwtohighlights12
enlr_1.pdf
96
Appendix I – Ethics Approval: Ethics Application Form
UUnniivveerrssiittyy RReesseeaarrcchh EEtthhiiccss AApppplliiccaattiioonn FFoorrmm for Undergraduate & Postgraduate-Taught Students
This form has been approved by the University Research Ethics Committee (UREC)
Complete this form if you are an undergraduate or a postgraduate-taught student who plans to undertake a research project which requires ethics approval via the University Ethics Review Procedure.
Your Supervisor decides if ethics approval is required and, if required, which ethics review procedure (e.g. University, NHS, Alternative) applies.
If the University’s procedure applies, your Supervisor decides if your proposed project should be classed as ‘low risk’ or potentially ‘high risk’.
*PLEASE NOTE THAT YOUR DEPARTMENT MAY USE A VARIATION OF THIS FORM: PLEASE CHECK WITH THE ETHICS ADMINISTRATOR IN YOUR DEPARTMENT*
This form should be accompanied, where appropriate, by all Information Sheets / Covering Letters / Written Scripts which you propose to use to inform the prospective participants about the proposed research, and/or by a Consent Form where you need to use one.
Further guidance on how to apply is at: www.sheffield.ac.uk/ris/other/gov-ethics/ethicspolicy/approval-procedure/review-procedure
Guidance on the possible routes for obtaining ethics approval (i.e. on the University Ethics Review Procedure, the NHS procedure and the Social Care Research Ethics Committee, and the Alternative procedure) is at: www.sheffield.ac.uk/ris/other/gov-ethics/ethicspolicy/approval-procedure/ethics-approval
Once you have completed this research ethics application form in full, and other documents where appropriate, check that your name, the title of your research project and the date is contained in the footer of each page.
If your Supervisor has classed the project as ‘low risk’:
Email this form, together with other documents where applicable, to your Supervisor; and
Sign and date Annex 1 of this form and provide a paper copy to your Supervisor.
Important Note for Supervisors:
FFoolllloowwiinngg tthhee eetthhiiccss rreevviieeww tthhee SSuuppeerrvviissoorr mmuusstt pprroovviiddee tthhee aaccaaddeemmiicc ddeeppaarrttmmeenntt’’ss EEtthhiiccss AAddmmiinniissttrraattoorr wwiitthh aa ccooppyy ooff tthhee ‘‘llooww rriisskk’’ rreesseeaarrcchh eetthhiiccss aapppplliiccaattiioonn tthhaatt ss//hhee rreevviieewweedd aanndd aa ccoommpplleetteedd EEtthhiiccss RReevviieewweerr’’ss CCoommmmeennttss FFoorrmm iinnddiiccaattiinngg tthhee eetthhiiccss ddeecciissiioonn tthhaatt ss//hhee ttooookk iinn rreellaattiioonn ttoo iitt.. TThhee EEtthhiiccss RReevviieewweerr’’ss CCoommmmeennttss FFoorrmm ccaann bbee ddoowwnnllooaaddeedd hheerree:: wwwwww..sshheeffffiieelldd..aacc..uukk//rriiss//ootthheerr//ggoovv--eetthhiiccss//eetthhiiccssppoolliiccyy//ffuurrtthheerr--gguuiiddaannccee//uunniivveerrssiittyypprroocceedduurree22//rreevviieewweerrsscc TThhee EEtthhiiccss AAddmmiinniissttrraattoorr rreesseerrvveess tthhee rriigghhtt ttoo ccoonnssuulltt tthhee CChhaaiirr ooff tthhee aaccaaddeemmiicc ddeeppaarrttmmeenntt’’ss EEtthhiiccss RReevviieeww PPaanneell ((oorr eeqquuiivvaalleenntt)) ooff ss//hhee hhaass ccoonncceerrnnss tthhaatt pprroojjeeccttss ccllaasssseedd aass llooww rriisskk sshhoouulldd iinn ffaacctt hhaavvee bbeeeenn ccllaasssseedd aass ppootteennttiiaallllyy hhiigghh rriisskk..
If your Supervisor has classed the project as potentially ‘high risk’:
Email this form, together with other documents where applicable, to your department’s Ethics Administrator; and
Ask your Supervisor to sign and date Annex 2 of this form and provide a paper copy of it to your department’s Ethics Administrator.
Ethics Administrators are listed at: www.sheffield.ac.uk/polopoly_fs/1.99105!/file/Ethics-Administrators.pdf

97
UUnniivveerrssiittyy RReesseeaarrcchh EEtthhiiccss AApppplliiccaattiioonn FFoorrmm for Undergraduate & Postgraduate-Taught Students
I confirm that I have read the current version of the University of Sheffield ‘Ethics Policy Governing Research Involving Human Participants, Personal Data and Human Tissue’, as shown on the University’s research ethics website at: www.sheffield.ac.uk/ris/other/gov-ethics/ethicspolicy A1. Title of research project: Optimising Pre-Implementation Managerial Communication to Overcome
End-User Resistance to System Adoption: A Comparative Study of British, German and Japanese End-
Users’ Cultural Perceptions
A2. Name of Student: Miryam Prasetyo Department: MLTC/Information School
Email: [email protected] Tel.: 07587 197353
Name of Supervisor: Dr Angela Lin
A3. Proposed Project Duration:
Start date: June 2012 End date: September 2012
A4. Mark ‘X’ in one or more of the following boxes if your research:
involves adults with mental incapacity or mental illness
involves prisoners or others in custodial care (e.g. young offenders)
involves children or young people aged under 18 years
involves using samples of human biological material collected before for another purpose
involves taking new samples of human biological material (e.g. blood, tissue) *
involves testing a medicinal product *
involves taking new samples of human biological material (e.g. blood, tissue) *
involves additional radiation above that required for clinical care *
involves investigating a medical device *
* If you have marked boxes marked * then you also need to obtain confirmation that
appropriate University insurance is in place. To do this email [email protected] and request a copy of the ‘Clinical Trial Insurance Application Form’.
It is recommended that you familiarise yourself with the University’s Ethics Policy Governing Research Involving Human Participants, Personal Data and Human Tissue before completing the following questions. Please note that if you provide sufficient information about the research (what you intend to do, how it will be carried out and how you intend to minimise any risks), this will help the ethics reviewers to make an informed judgement quickly without having to ask for further details.
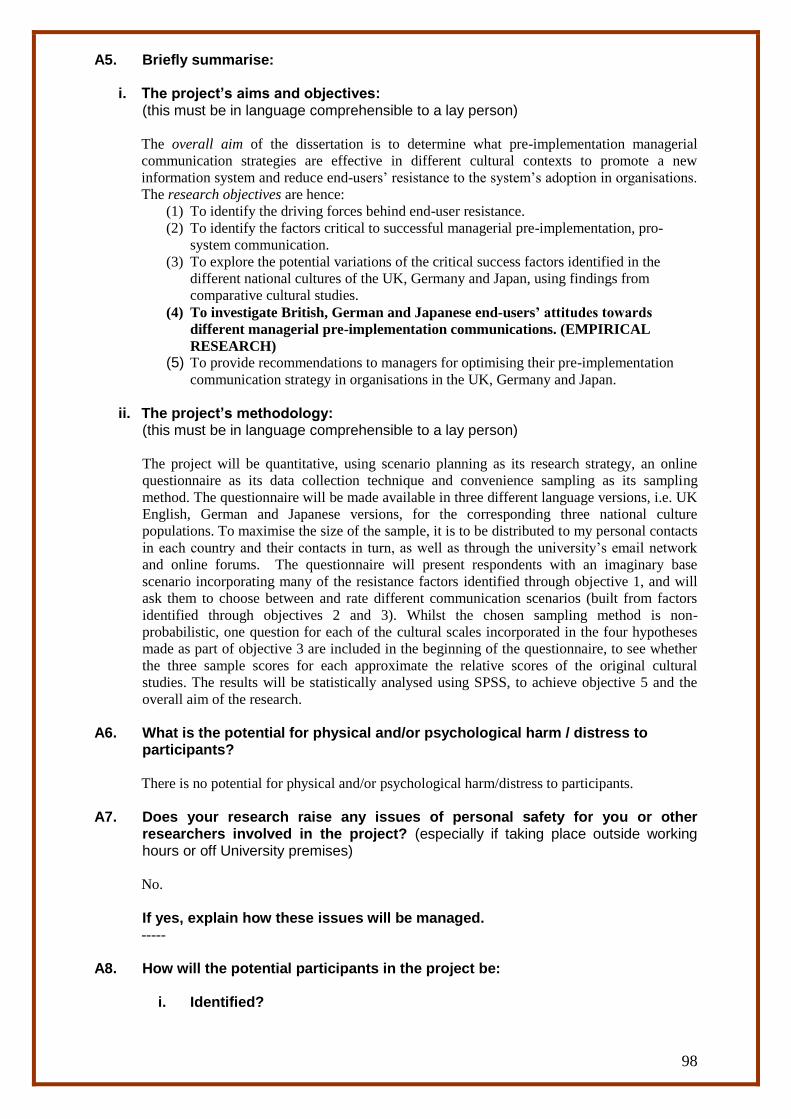
98
A5. Briefly summarise:
i. The project’s aims and objectives: (this must be in language comprehensible to a lay person) The overall aim of the dissertation is to determine what pre-implementation managerial
communication strategies are effective in different cultural contexts to promote a new
information system and reduce end-users’ resistance to the system’s adoption in organisations.
The research objectives are hence:
(1) To identify the driving forces behind end-user resistance.
(2) To identify the factors critical to successful managerial pre-implementation, pro-
system communication.
(3) To explore the potential variations of the critical success factors identified in the
different national cultures of the UK, Germany and Japan, using findings from
comparative cultural studies.
(4) To investigate British, German and Japanese end-users’ attitudes towards
different managerial pre-implementation communications. (EMPIRICAL
RESEARCH)
(5) To provide recommendations to managers for optimising their pre-implementation
communication strategy in organisations in the UK, Germany and Japan.
ii. The project’s methodology: (this must be in language comprehensible to a lay person) The project will be quantitative, using scenario planning as its research strategy, an online
questionnaire as its data collection technique and convenience sampling as its sampling
method. The questionnaire will be made available in three different language versions, i.e. UK
English, German and Japanese versions, for the corresponding three national culture
populations. To maximise the size of the sample, it is to be distributed to my personal contacts
in each country and their contacts in turn, as well as through the university’s email network
and online forums. The questionnaire will present respondents with an imaginary base
scenario incorporating many of the resistance factors identified through objective 1, and will
ask them to choose between and rate different communication scenarios (built from factors
identified through objectives 2 and 3). Whilst the chosen sampling method is non-
probabilistic, one question for each of the cultural scales incorporated in the four hypotheses
made as part of objective 3 are included in the beginning of the questionnaire, to see whether
the three sample scores for each approximate the relative scores of the original cultural
studies. The results will be statistically analysed using SPSS, to achieve objective 5 and the
overall aim of the research.
A6. What is the potential for physical and/or psychological harm / distress to participants? There is no potential for physical and/or psychological harm/distress to participants.
A7. Does your research raise any issues of personal safety for you or other
researchers involved in the project? (especially if taking place outside working hours or off University premises)
No.
If yes, explain how these issues will be managed. -----
A8. How will the potential participants in the project be:
i. Identified?
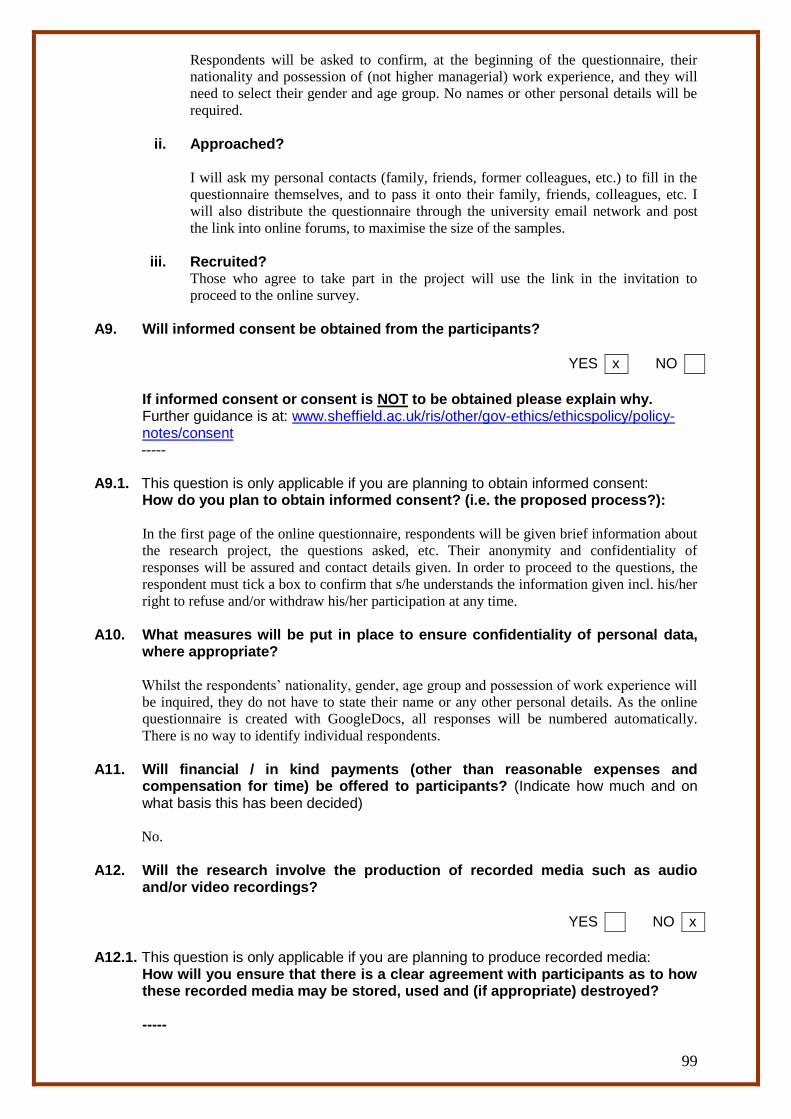
99
Respondents will be asked to confirm, at the beginning of the questionnaire, their
nationality and possession of (not higher managerial) work experience, and they will
need to select their gender and age group. No names or other personal details will be
required.
ii. Approached?
I will ask my personal contacts (family, friends, former colleagues, etc.) to fill in the
questionnaire themselves, and to pass it onto their family, friends, colleagues, etc. I
will also distribute the questionnaire through the university email network and post
the link into online forums, to maximise the size of the samples.
iii. Recruited?
Those who agree to take part in the project will use the link in the invitation to
proceed to the online survey.
A9. Will informed consent be obtained from the participants?
YES x NO
If informed consent or consent is NOT to be obtained please explain why. Further guidance is at: www.sheffield.ac.uk/ris/other/gov-ethics/ethicspolicy/policy-notes/consent -----
A9.1. This question is only applicable if you are planning to obtain informed consent:
How do you plan to obtain informed consent? (i.e. the proposed process?): In the first page of the online questionnaire, respondents will be given brief information about
the research project, the questions asked, etc. Their anonymity and confidentiality of
responses will be assured and contact details given. In order to proceed to the questions, the
respondent must tick a box to confirm that s/he understands the information given incl. his/her
right to refuse and/or withdraw his/her participation at any time.
A10. What measures will be put in place to ensure confidentiality of personal data, where appropriate? Whilst the respondents’ nationality, gender, age group and possession of work experience will
be inquired, they do not have to state their name or any other personal details. As the online
questionnaire is created with GoogleDocs, all responses will be numbered automatically.
There is no way to identify individual respondents.
A11. Will financial / in kind payments (other than reasonable expenses and compensation for time) be offered to participants? (Indicate how much and on what basis this has been decided) No.
A12. Will the research involve the production of recorded media such as audio
and/or video recordings?
YES NO x
A12.1. This question is only applicable if you are planning to produce recorded media:
How will you ensure that there is a clear agreement with participants as to how these recorded media may be stored, used and (if appropriate) destroyed? -----

100
Guidance on a range of ethical issues, including safety and well-being, consent and anonymity, confidentiality and data protection’ are available at: www.sheffield.ac.uk/ris/other/gov-ethics/ethicspolicy/policy-notes

101
Annex 1
For Undergraduate & Postgraduate-Taught Students
SSttuuddeenntt DDeeccllaarraattiioonn
(The student completes Annex 1 if the Supervisor has classed the student’s proposed research project as ‘low risk’)
The Supervisor needs to receive an electronic copy of the form, and other documents where appropriate, plus a signed, dated paper copy of this Annex 1 ‘the Student Declaration’.
Full Research Project Title: Optimising Pre-Implementation Managerial Communication to Overcome End-User Resistance to System Adoption: A Comparative Study of British, German and Japanese End-Users’ Cultural Perceptions
In signing this Student Declaration I am confirming that:
The research ethics application form for the above-named project is accurate to the best of my knowledge and belief.
The above-named project will abide by the University’s ‘Good Research Practice Standards’: www.sheffield.ac.uk/ris/other/gov-ethics/good
The above-named project will abide by the University’s ‘Ethics Policy Governing Research Involving Human Participants, Personal Data and Human Tissue’: www.sheffield.ac.uk/ris/other/gov-ethics/ethicspolicy
Subject to the above-named project being ethically approved I undertake to adhere to any ethics conditions that may be set.
I will inform my Supervisor of significant changes to the above-named project that have ethical consequences.
I will inform my Supervisor if prospective participants make a complaint about the above-named project.
I understand that personal data about me as a researcher on the research ethics application form will be held by those involved in the ethics review process (e.g. my Supervisor and the Ethics Administrator) and that this will be managed according to Data Protection Act principles.
I understand that this project cannot be submitted for ethics approval in more than one department, and that if I wish to appeal against the decision made, this must be done through the original department.
Name of Supervisor: Dr Angela Lin
Name of student: Miryam Prasetyo
Signature of student: Miryam Prasetyo
Date: 6th July 2012

102
Annex 2 For Undergraduate & Postgraduate-Taught Students
SSuuppeerrvviissoorr DDeeccllaarraattiioonn
((TThhee SSuuppeerrvviissoorr ccoommpplleetteess AAnnnneexx 22 iiff ss//hhee hhaass ccllaasssseedd tthhee ssttuuddeenntt’’ss pprrooppoosseedd
rreesseeaarrcchh pprroojjeecctt aass ppootteennttiiaallllyy ‘‘hhiigghh rriisskk’’))
TThhee EEtthhiiccss AAddmmiinniissttrraattoorr nneeeeddss ttoo rreecceeiivvee aann eelleeccttrroonniicc ccooppyy ooff tthhee ffoorrmm,, aanndd ootthheerr
ddooccuummeennttss wwhheerree aapppprroopprriiaattee,, pplluuss aa ssiiggnneedd,, ddaatteedd ppaappeerr ccooppyy ooff tthhiiss AAnnnneexx 22 ‘‘tthhee
SSuuppeerrvviissoorr DDeeccllaarraattiioonn’’..
Full Research Project Title: Optimising Pre-Implementation Managerial Communication to Overcome End-User Resistance to System Adoption: A Comparative Study of British, German and Japanese End-Users’ Cultural Perceptions
In signing this Supervisor Declaration I am confirming that:
The research ethics application form for the above-named project is accurate to the best of my knowledge and belief.
The above-named project will abide by the University’s ‘Good Research Practice Standards’: www.sheffield.ac.uk/ris/other/gov-ethics/good
The above-named project will abide by the University’s ‘Ethics Policy for Research Involving Human Participants, Data and Tissue’: www.sheffield.ac.uk/ris/other/gov-ethics/ethicspolicy
Subject to the above-named project being ethically approved I will undertake to ensure that the student adheres to any ethics conditions that may be set.
The student or the Supervisor will undertake to inform the Ethics Administrator of significant changes to the above-named project that have ethical consequences.
The student or the Supervisor will undertake to inform the Ethics Administrator if prospective participants make a complaint about the above-named project.
I understand that personal data about the student and/or myself on the research ethics application form will be held by those involved in the ethics review process (e.g. the Ethics Administrator and/or reviewers) and that this will be managed according to Data Protection Act principles.
I understand that this project cannot be submitted for ethics approval in more than one department, and that if I and/or the student wish to appeal against the decision made, this must be done through the original department.
Name of Supervisor: Angela Lin
Name of student: Miryam Prasetyo
SSiiggnnaattuurree ooff SSuuppeerrvviissoorr::
Date: 09 July 2012
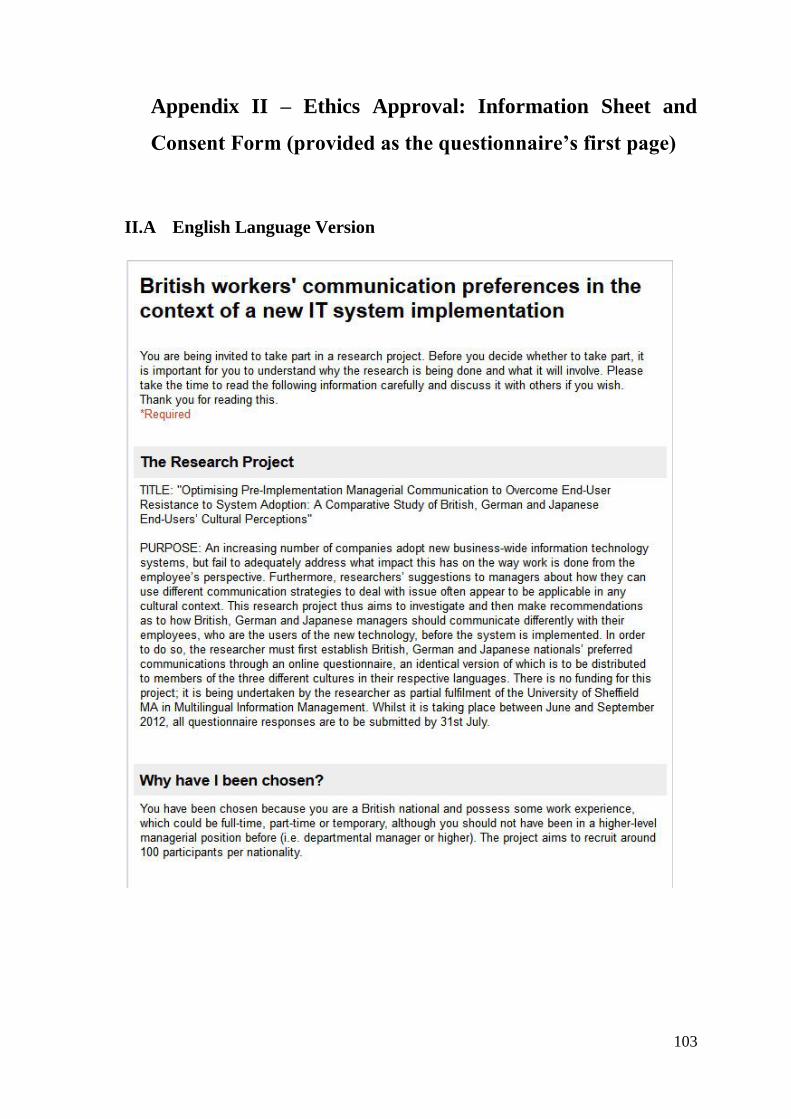
103
Appendix II – Ethics Approval: Information Sheet and
Consent Form (provided as the questionnaire’s first page)
II.A English Language Version
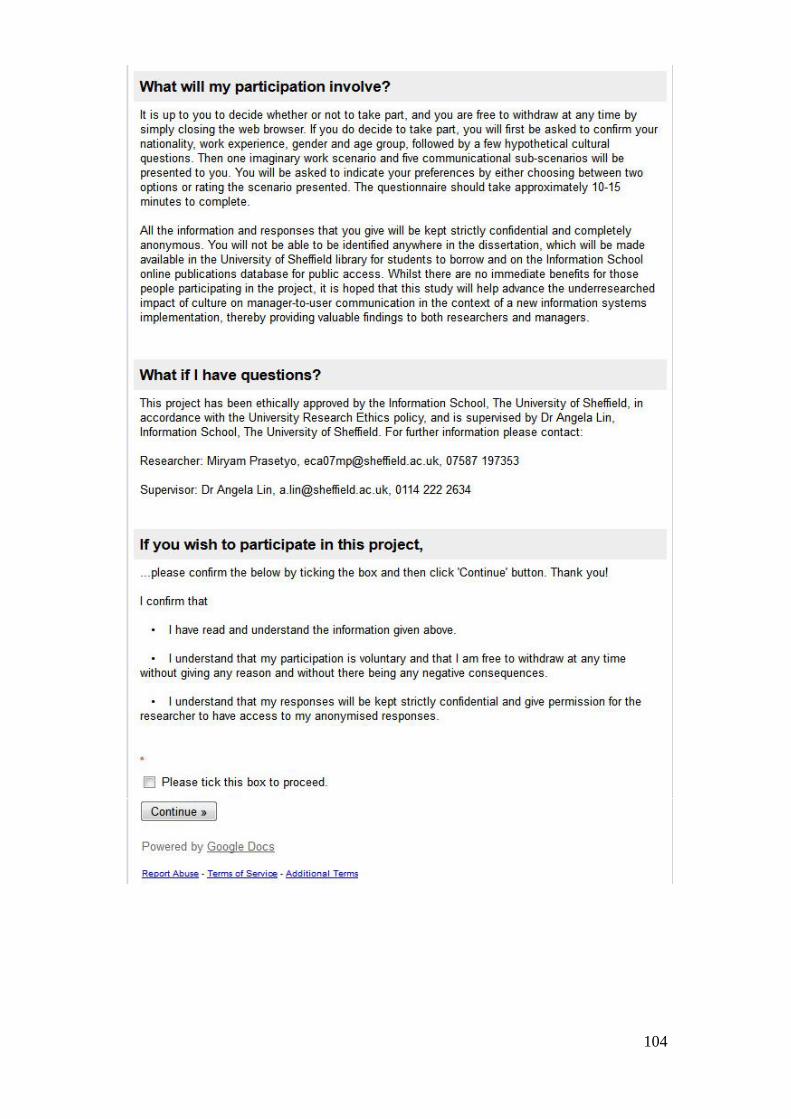
104
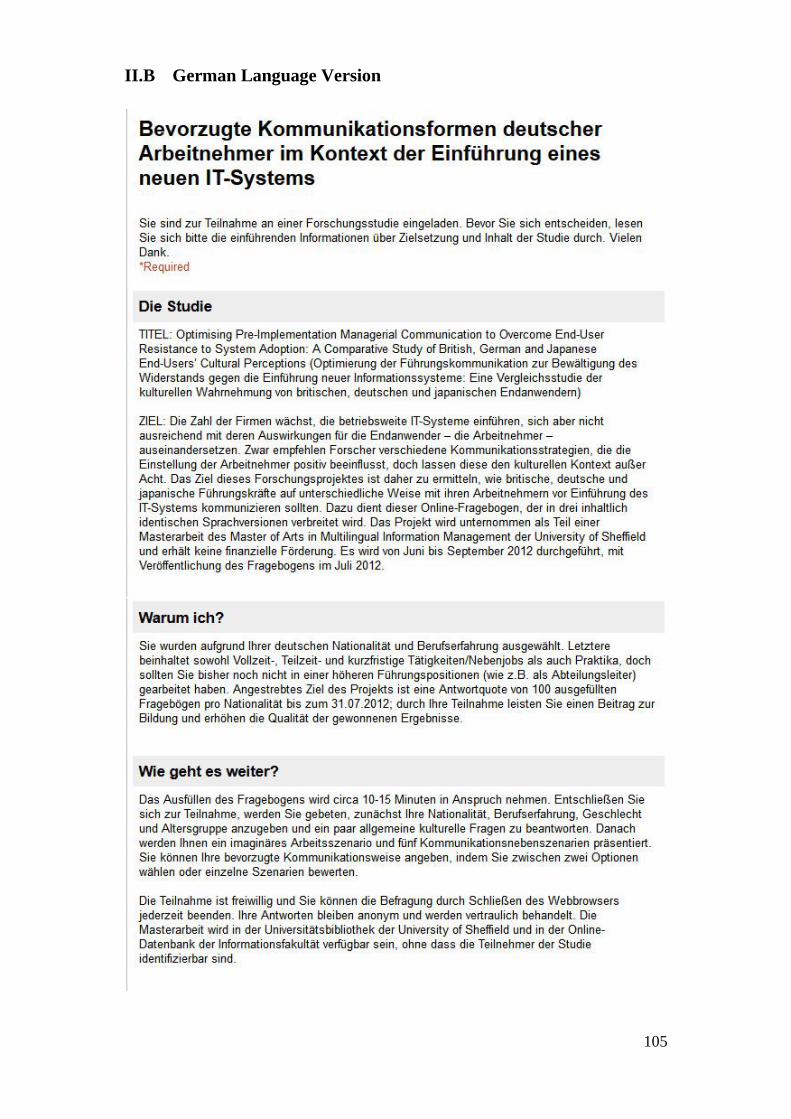
105
II.B German Language Version
106
II.C Japanese Language Version

107

108

109
Appendix III – Questionnaire
III.A English Language Version
Page 1:
If option 2 or 3:
110
If option 4:
Page 2:

111
If option 3 or 4:
Page 3:

112
Page 4:
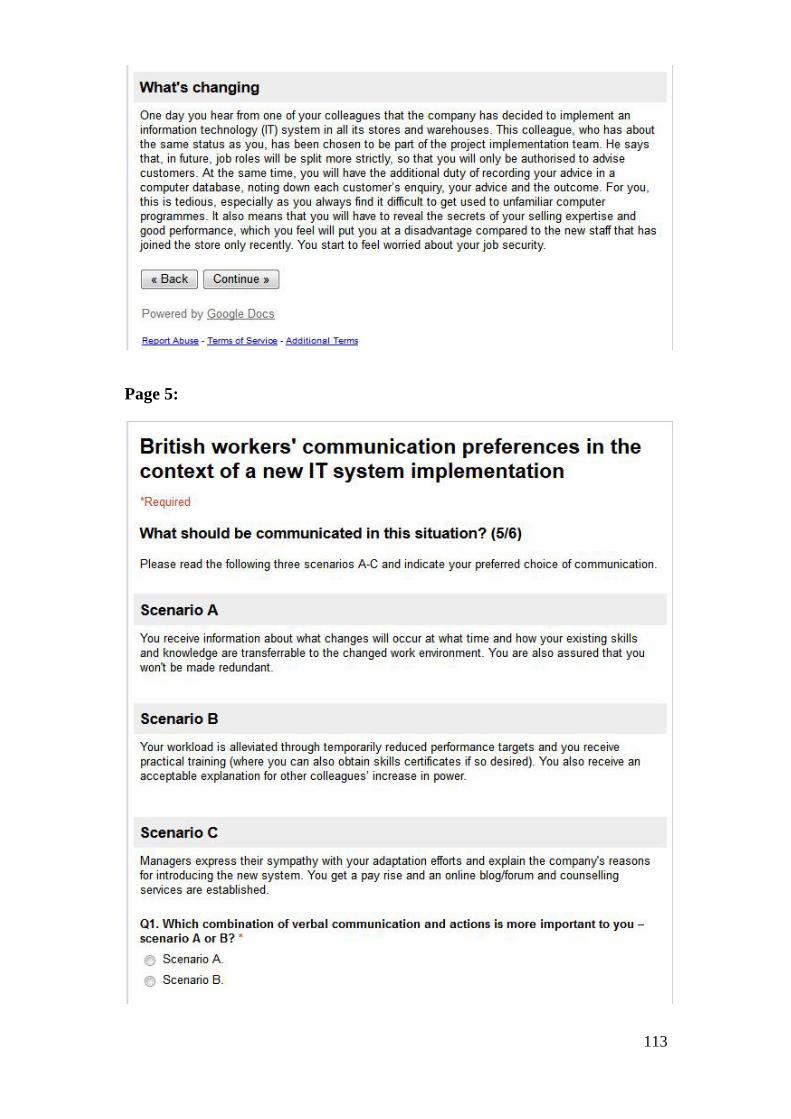
113
Page 5:

114
Page 6:
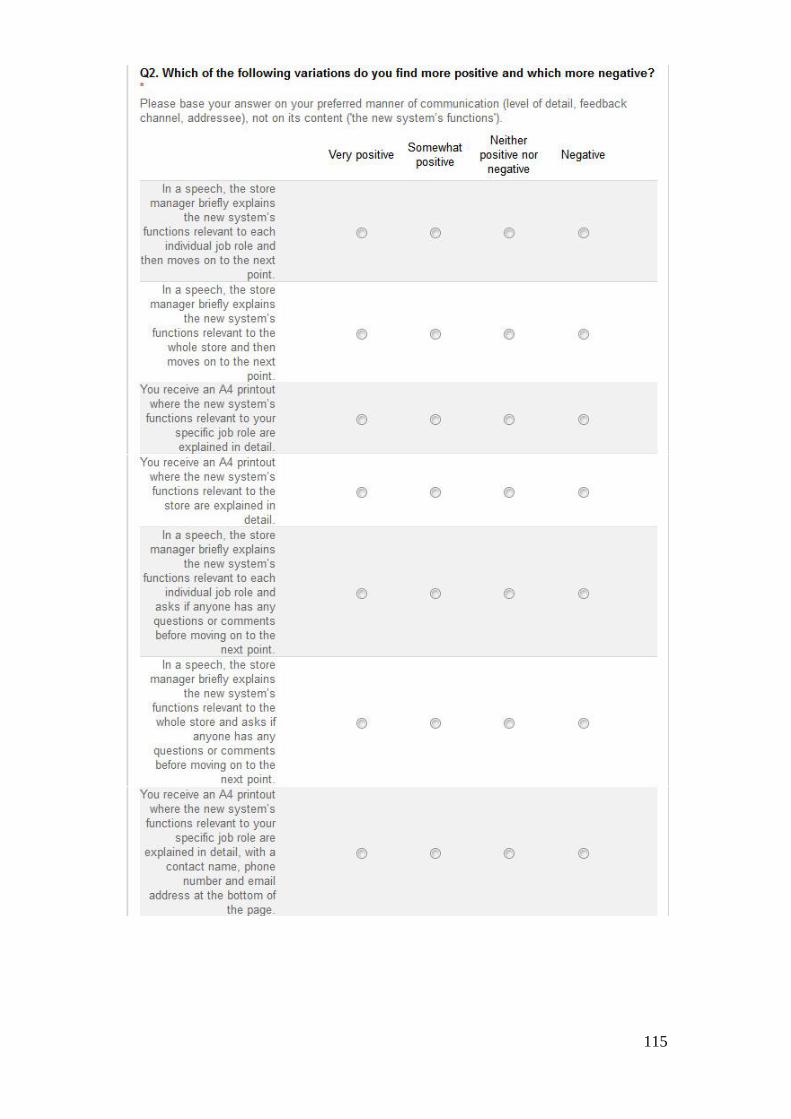
115
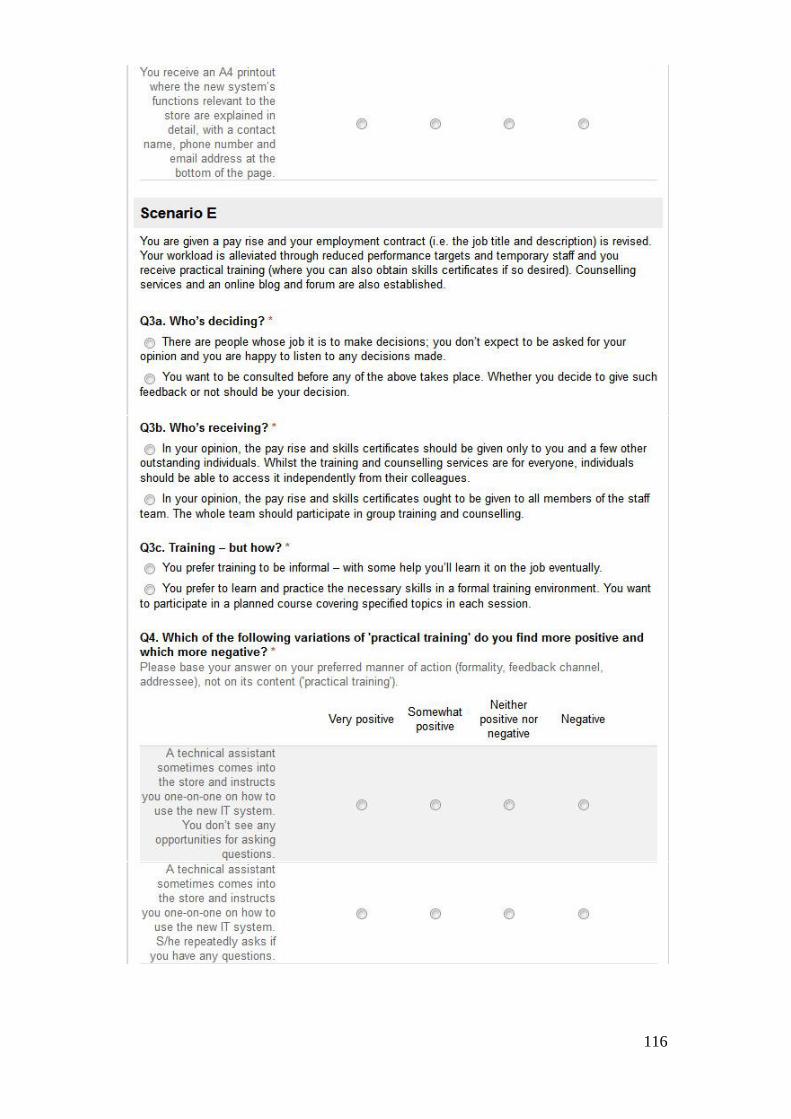
116
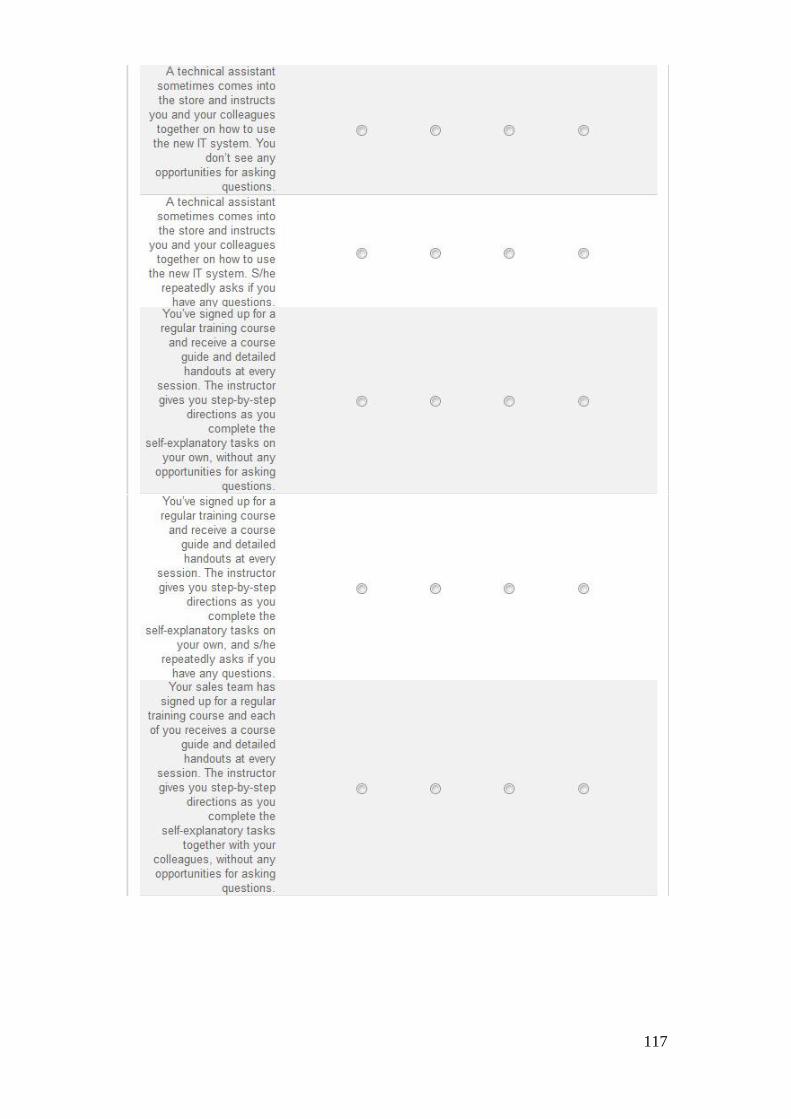
117
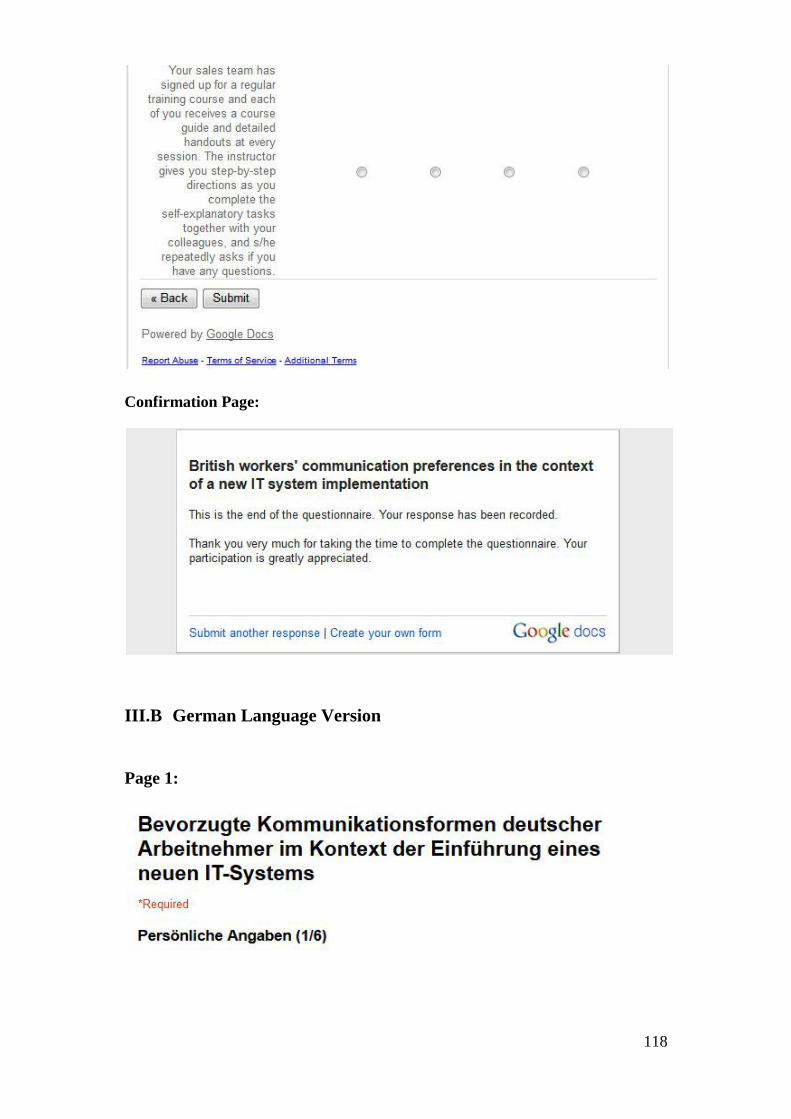
118
Confirmation Page:
III.B German Language Version
Page 1:
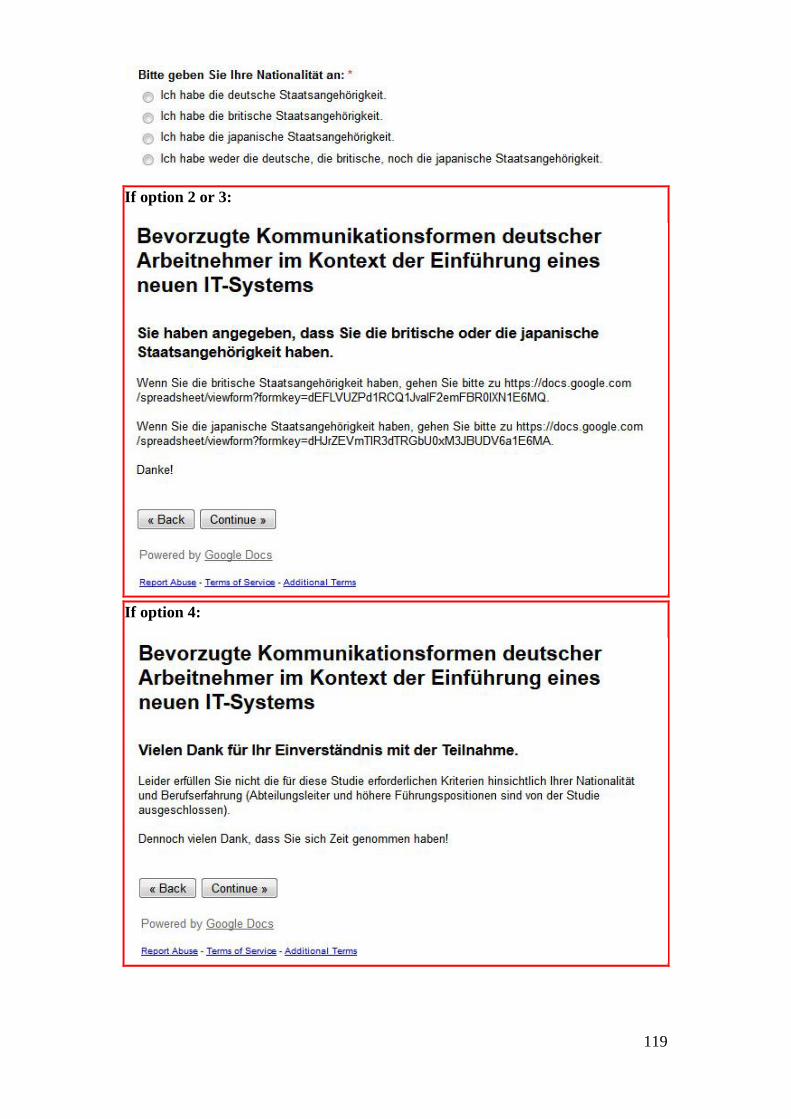
119
If option 2 or 3:
If option 4:
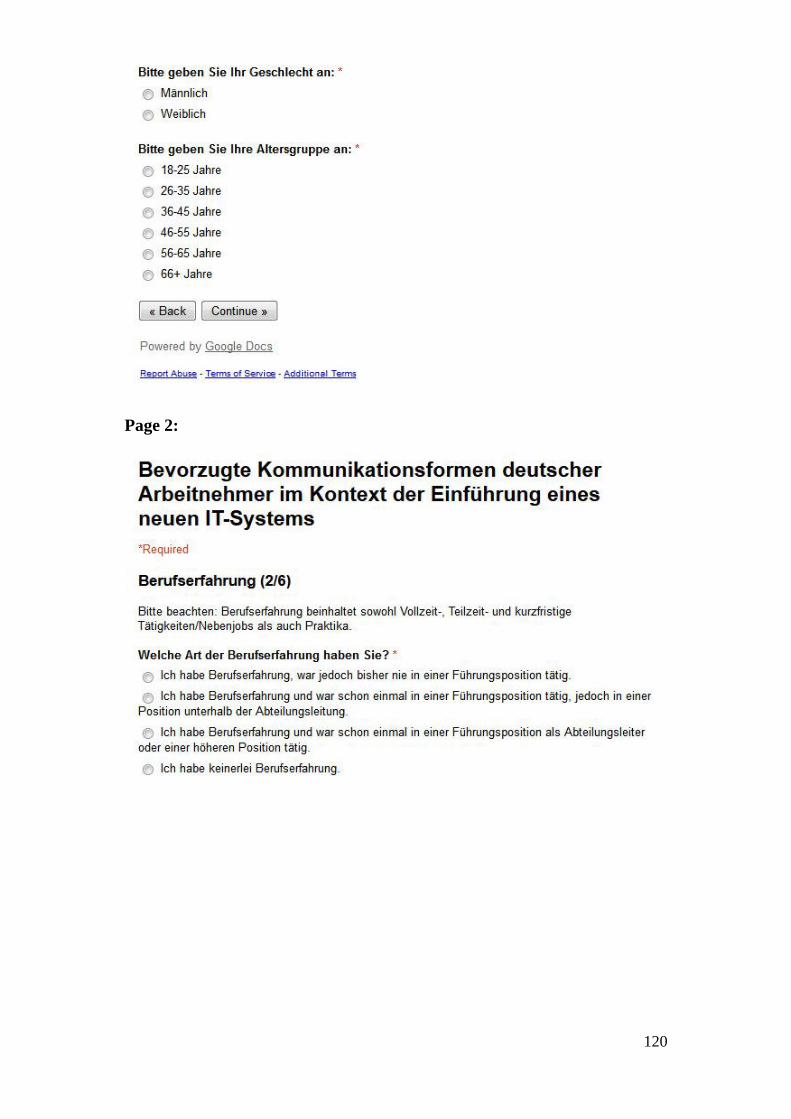
120
Page 2:
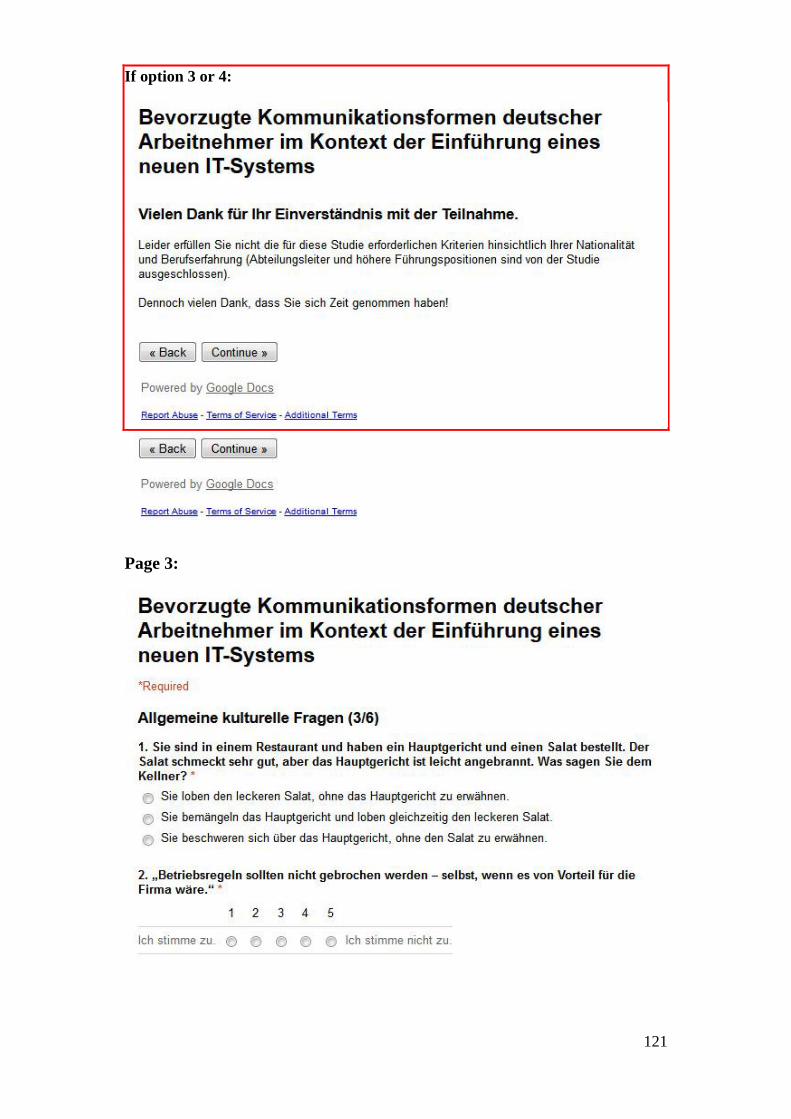
121
If option 3 or 4:
Page 3:
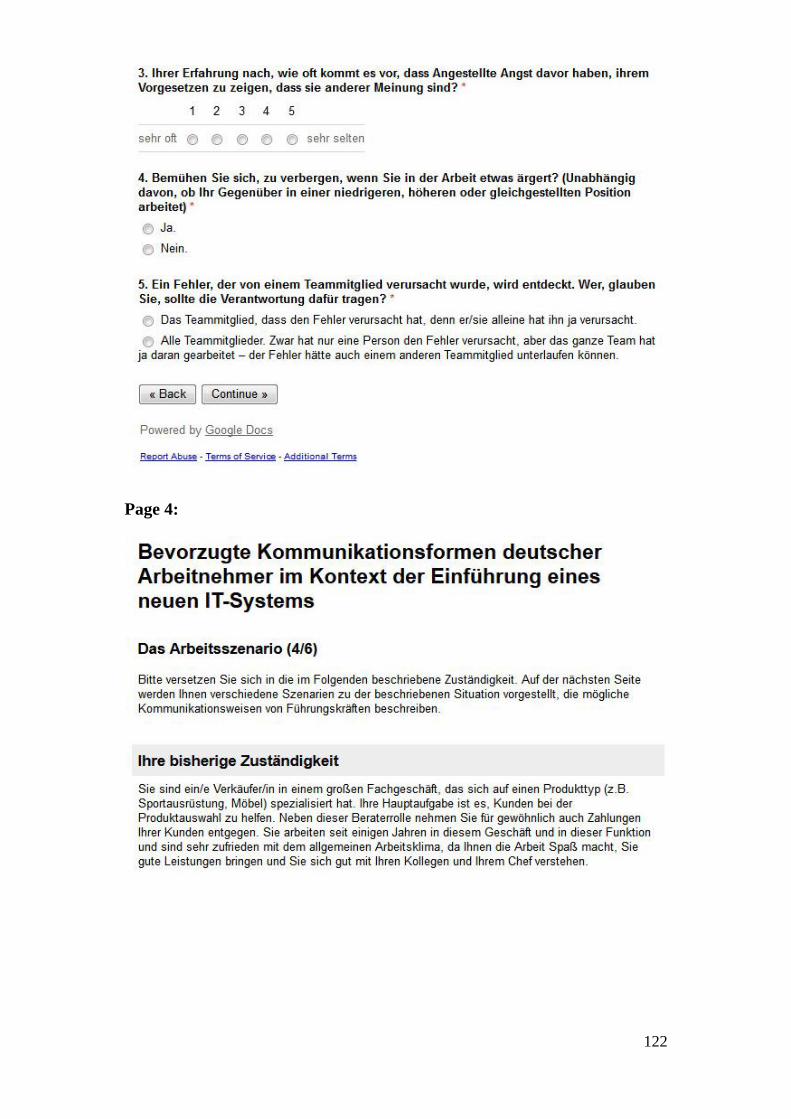
122
Page 4:
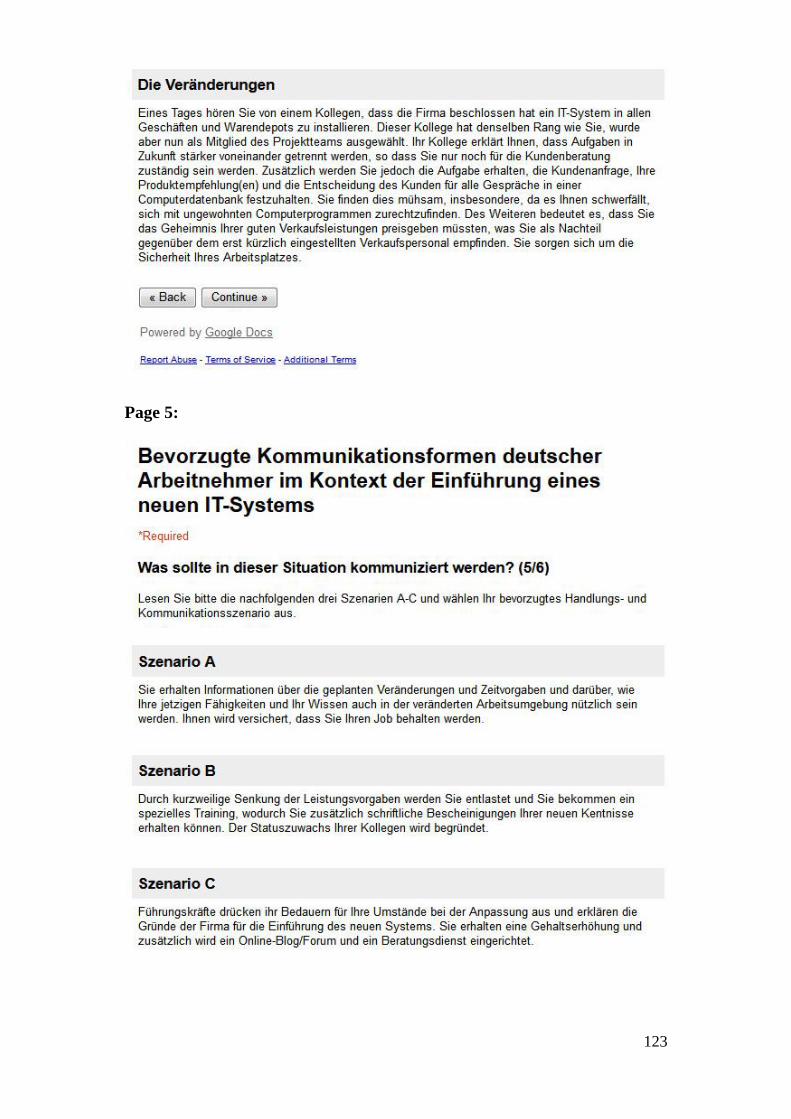
123
Page 5:
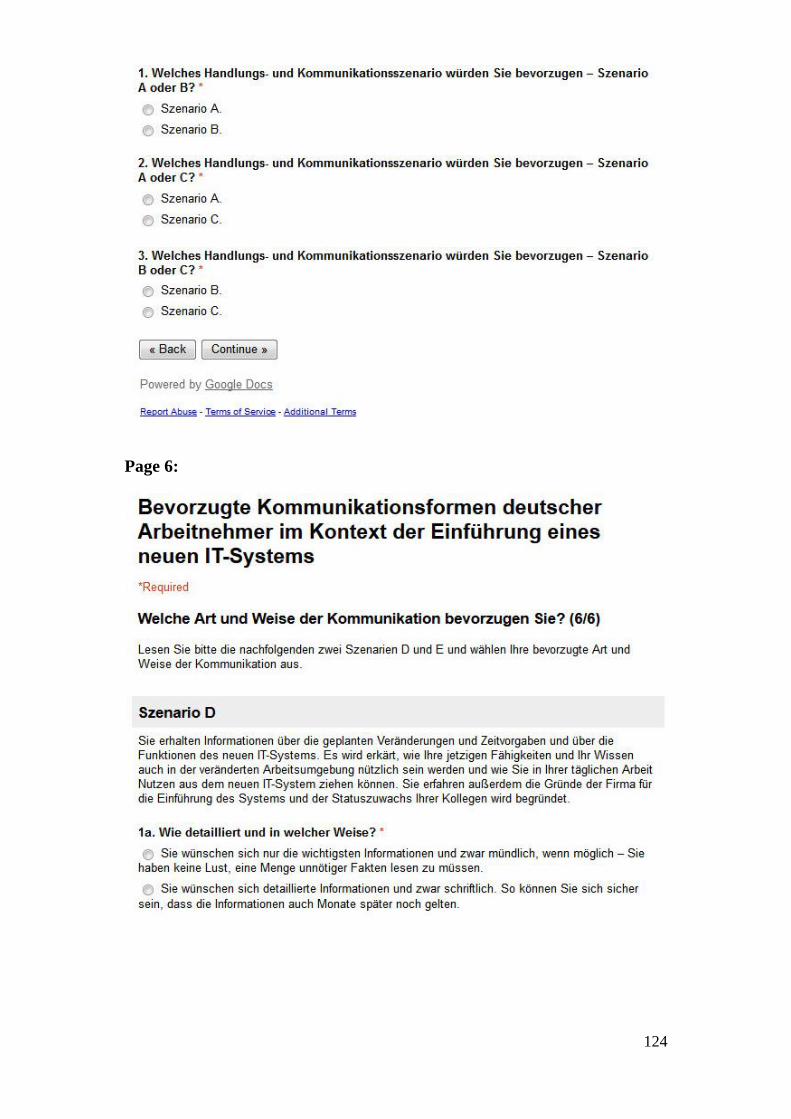
124
Page 6:
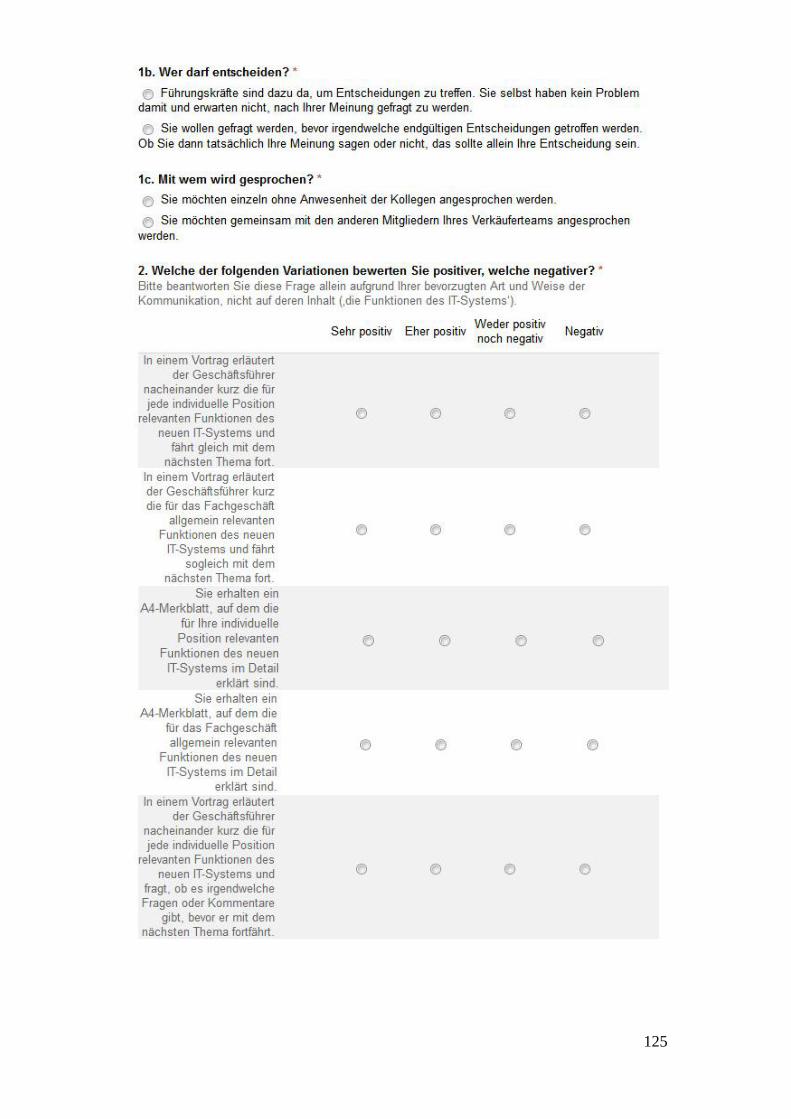
125
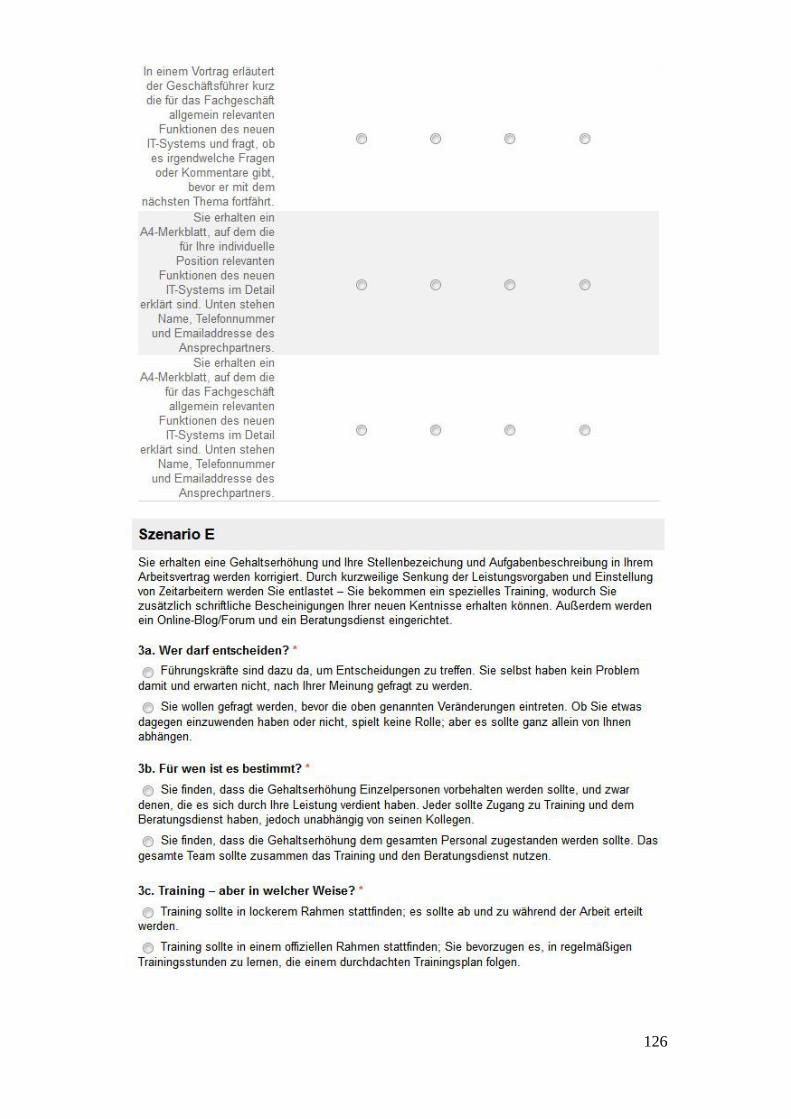
126
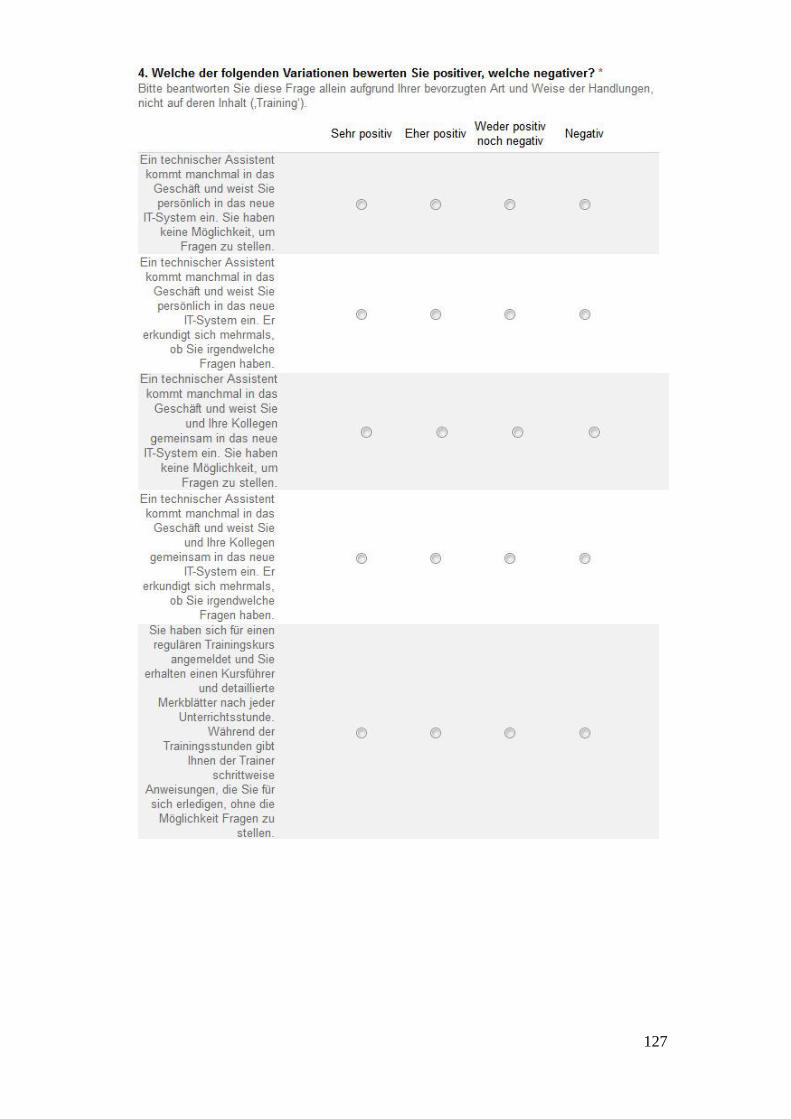
127
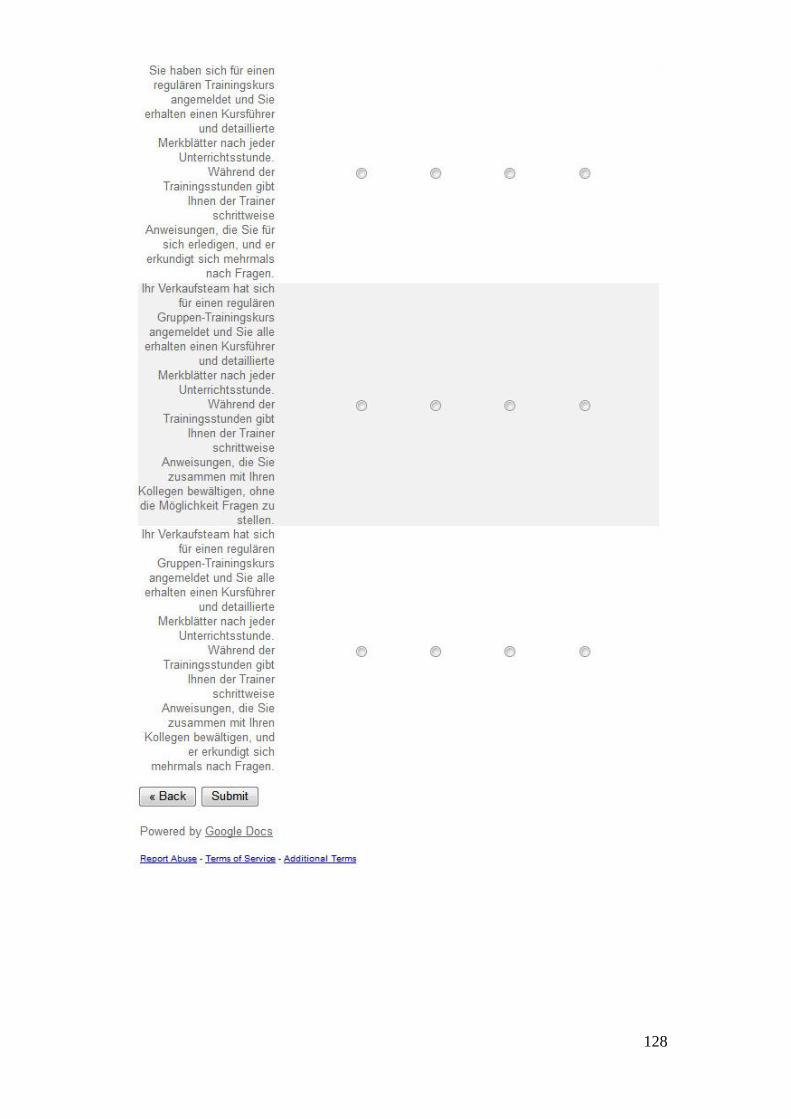
128
129
Confirmation Page:
III.C Japanese Language Version
Page 1:
130
If option 2 or 3:
If option 4:
131
Page 2:
If option 3 or 4:
Page 3:
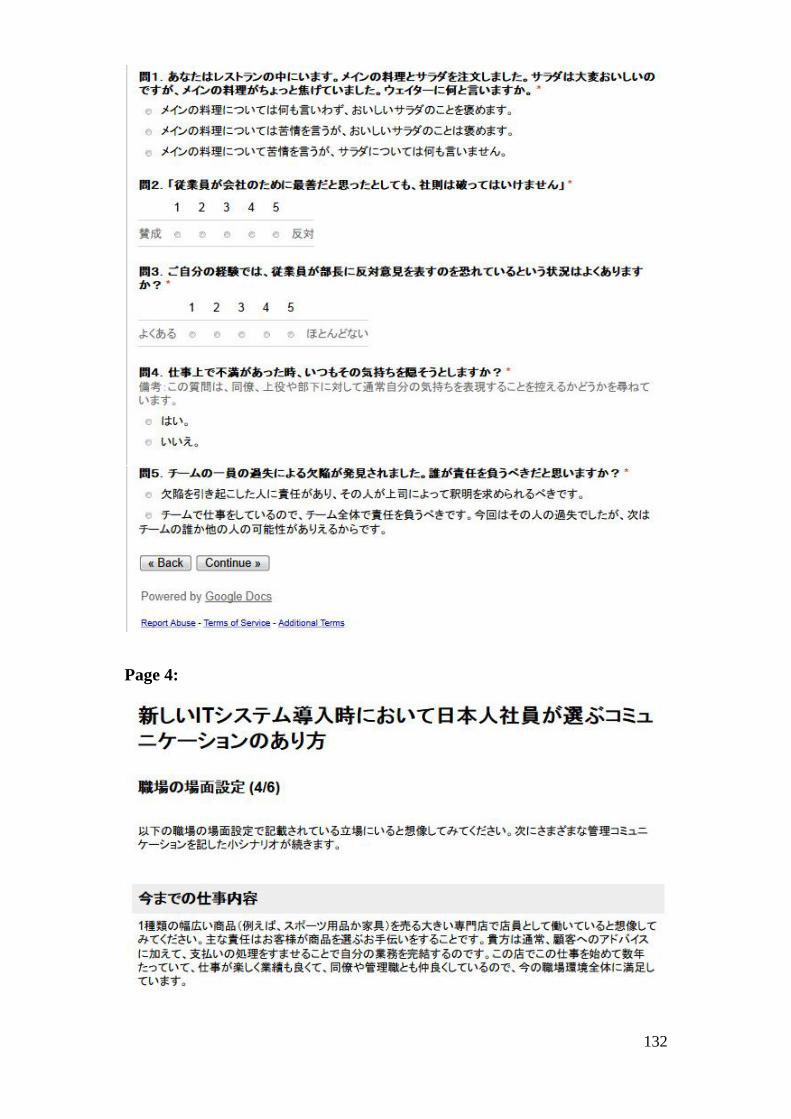
132
Page 4:
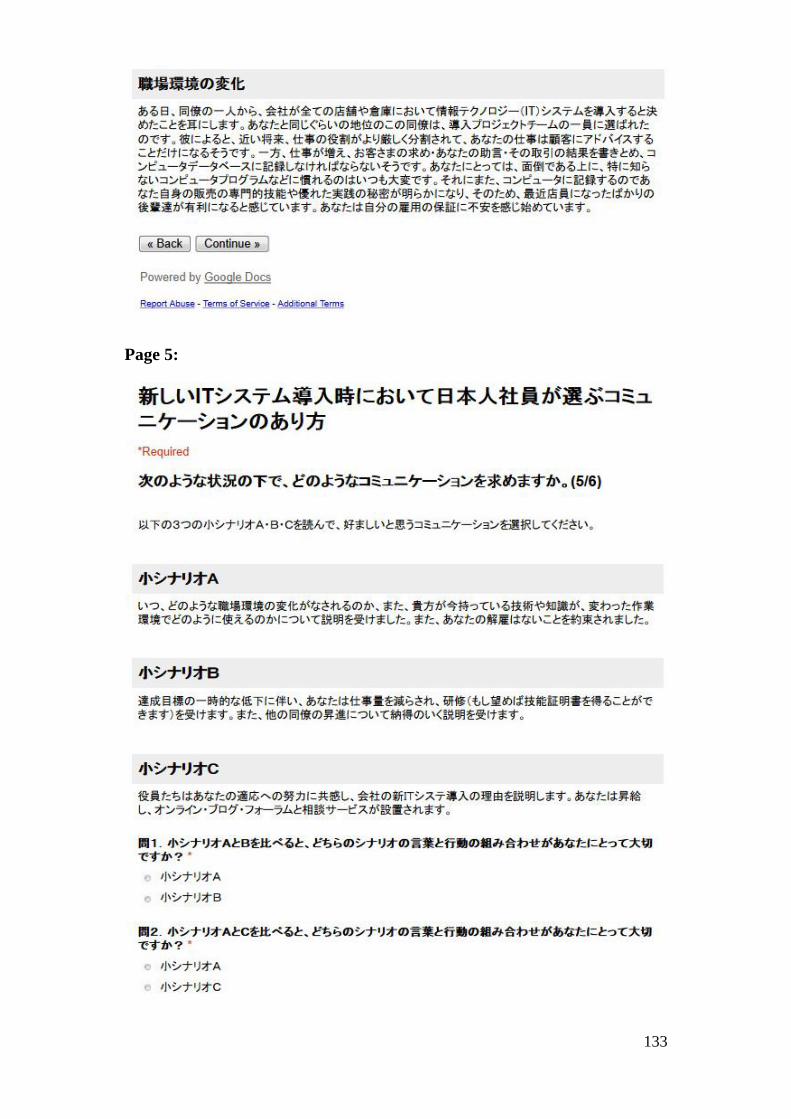
133
Page 5:
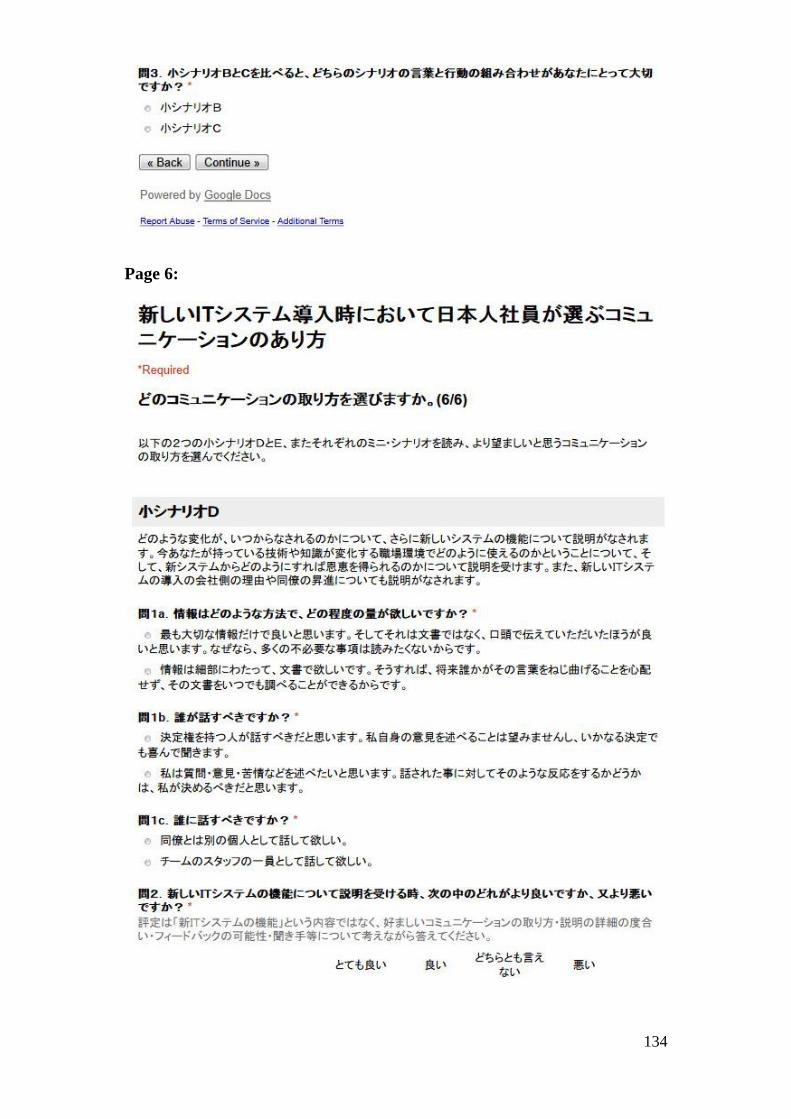
134
Page 6:
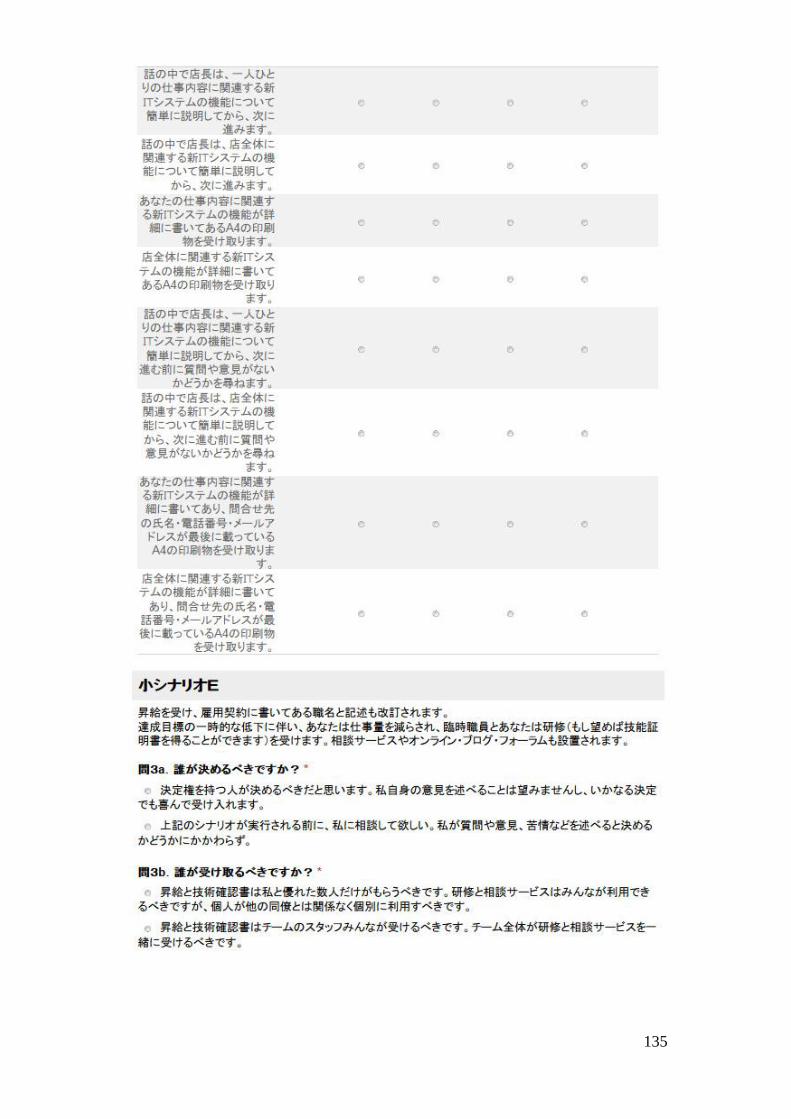
135
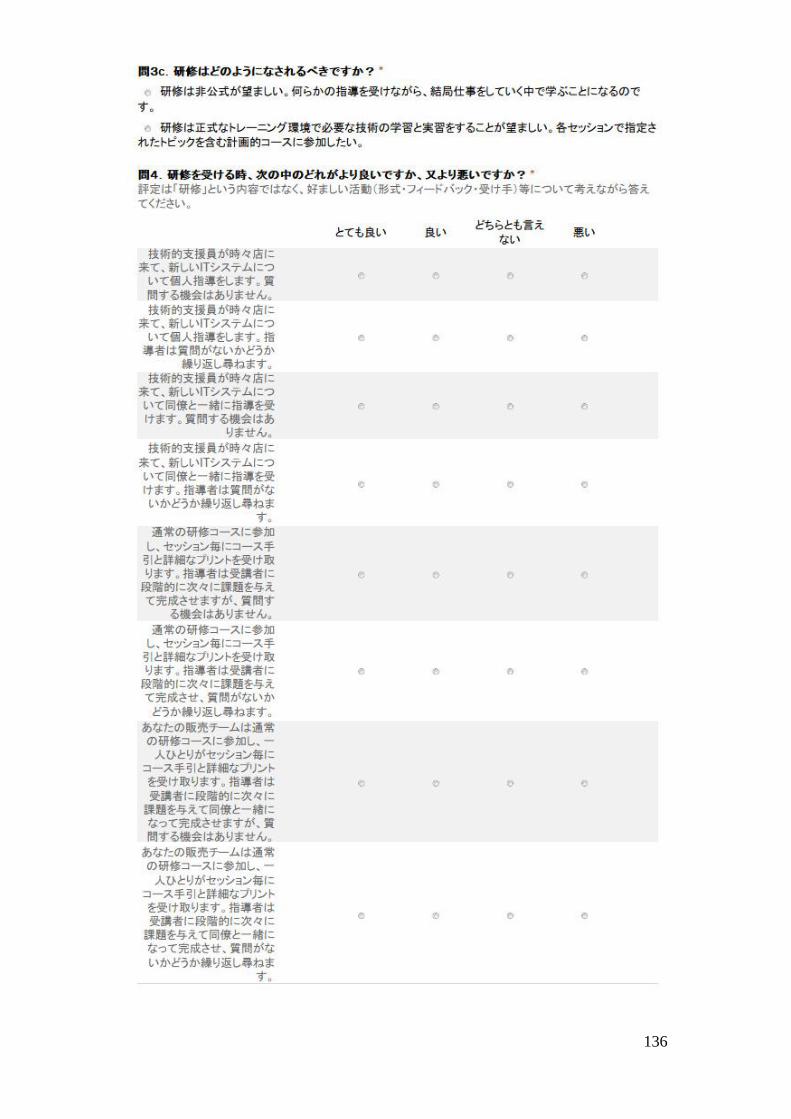
136
137
Confirmation Page:
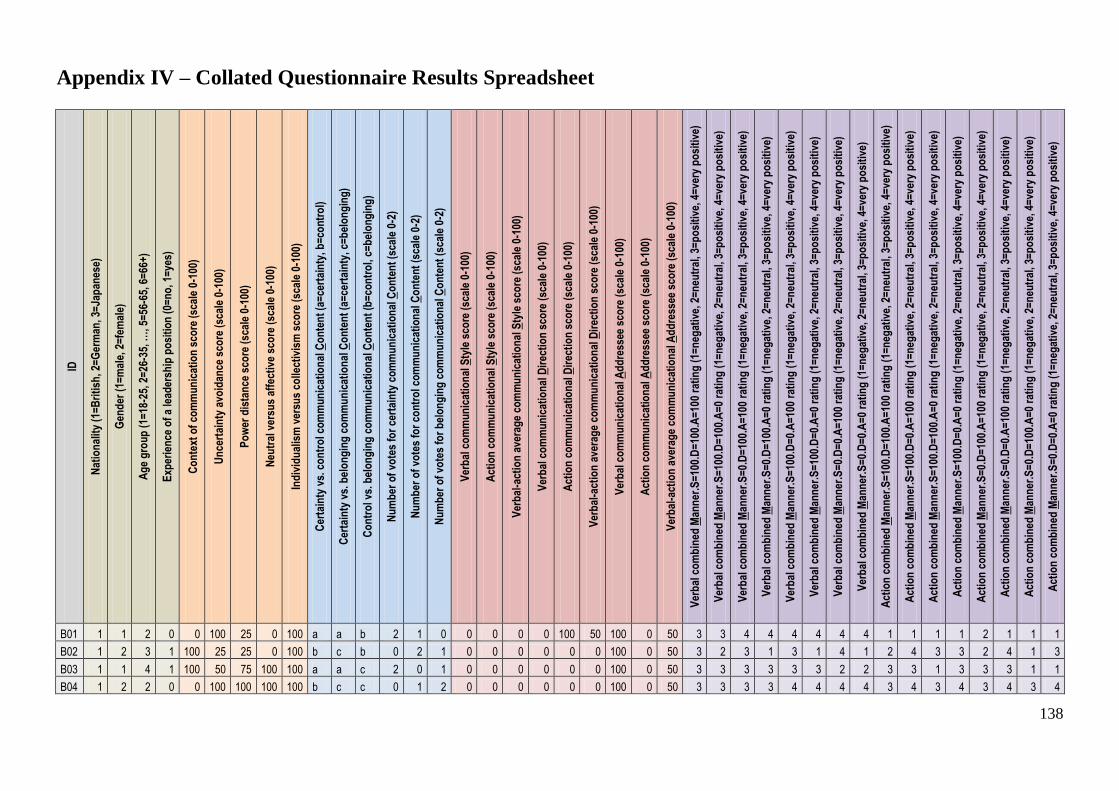
138
Appendix IV – Collated Questionnaire Results Spreadsheet ID
Nat
ion
alit
y (1
=B
riti
sh, 2
=G
erm
an, 3
=Ja
pan
ese)
Gen
der
(1=
mal
e, 2
=fe
mal
e)
Ag
e g
rou
p (
1=18
-25,
2=
26-3
5, …
, 5=
56-6
5, 6
=66
+)
Exp
erie
nce
of
a le
ader
ship
po
siti
on
(0=
no
, 1=
yes)
Co
nte
xt o
f co
mm
un
icat
ion
sco
re (
scal
e 0-
100)
Un
cert
ain
ty a
void
ance
sco
re (
scal
e 0-
100)
Po
wer
dis
tan
ce s
core
(sc
ale
0-10
0)
Neu
tral
ver
sus
affe
ctiv
e sc
ore
(sc
ale
0-10
0)
Ind
ivid
ual
ism
ver
sus
colle
ctiv
ism
sco
re (
scal
e 0-
100)
Cer
tain
ty v
s. c
on
tro
l co
mm
un
icat
ion
al C
on
ten
t (a
=ce
rtai
nty
, b=
con
tro
l)
Cer
tain
ty v
s. b
elo
ng
ing
co
mm
un
icat
ion
al C
on
ten
t (a
=ce
rtai
nty
, c=
bel
on
gin
g)
Co
ntr
ol v
s. b
elo
ng
ing
co
mm
un
icat
ion
al C
on
ten
t (b
=co
ntr
ol,
c=b
elo
ng
ing
)
Nu
mb
er o
f vo
tes
for
cert
ain
ty c
om
mu
nic
atio
nal
Co
nte
nt
(sca
le 0
-2)
Nu
mb
er o
f vo
tes
for
con
tro
l co
mm
un
icat
ion
al C
on
ten
t (s
cale
0-2
)
Nu
mb
er o
f vo
tes
for
bel
on
gin
g c
om
mu
nic
atio
nal
Co
nte
nt
(sca
le 0
-2)
Ver
bal
co
mm
un
icat
ion
al S
tyle
sco
re (
scal
e 0-
100)
Act
ion
co
mm
un
icat
ion
al S
tyle
sco
re (
scal
e 0-
100)
Ver
bal
-act
ion
ave
rag
e co
mm
un
icat
ion
al S
tyle
sco
re (
scal
e 0-
100)
Ver
bal
co
mm
un
icat
ion
al D
irec
tio
n s
core
(sc
ale
0-10
0)
Act
ion
co
mm
un
icat
ion
al D
irec
tio
n s
core
(sc
ale
0-10
0)
Ver
bal
-act
ion
ave
rag
e co
mm
un
icat
ion
al D
irec
tio
n s
core
(sc
ale
0-10
0)
Ver
bal
co
mm
un
icat
ion
al A
dd
ress
ee s
core
(sc
ale
0-10
0)
Act
ion
co
mm
un
icat
ion
al A
dd
ress
ee s
core
(sc
ale
0-10
0)
Ver
bal
-act
ion
ave
rag
e co
mm
un
icat
ion
al A
dd
ress
ee s
core
(sc
ale
0-10
0)
Ver
bal
co
mb
ined
Man
ner
.S=
100.
D=
100.
A=
100
rati
ng
(1=
neg
ativ
e, 2
=n
eutr
al, 3
=p
osi
tive
, 4=
very
po
siti
ve)
Ver
bal
co
mb
ined
Man
ner
.S=
100.
D=
100.
A=
0 ra
tin
g (
1=n
egat
ive,
2=
neu
tral
, 3=
po
siti
ve, 4
=ve
ry p
osi
tive
)
Ver
bal
co
mb
ined
Man
ner
.S=
0.D
=10
0.A
=10
0 ra
tin
g (
1=n
egat
ive,
2=
neu
tral
, 3=
po
siti
ve, 4
=ve
ry p
osi
tive
)
Ver
bal
co
mb
ined
Man
ner
.S=
0.D
=10
0.A
=0
rati
ng
(1=
neg
ativ
e, 2
=n
eutr
al, 3
=p
osi
tive
, 4=
very
po
siti
ve)
Ver
bal
co
mb
ined
Man
ner
.S=
100.
D=
0.A
=10
0 ra
tin
g (
1=n
egat
ive,
2=
neu
tral
, 3=
po
siti
ve, 4
=ve
ry p
osi
tive
)
Ver
bal
co
mb
ined
Man
ner
.S=
100.
D=
0.A
=0
rati
ng
(1=
neg
ativ
e, 2
=n
eutr
al, 3
=p
osi
tive
, 4=
very
po
siti
ve)
Ver
bal
co
mb
ined
Man
ner
.S=
0.D
=0.
A=
100
rati
ng
(1=
neg
ativ
e, 2
=n
eutr
al, 3
=p
osi
tive
, 4=
very
po
siti
ve)
Ver
bal
co
mb
ined
Man
ner
.S=
0.D
=0.
A=
0 ra
tin
g (
1=n
egat
ive,
2=
neu
tral
, 3=
po
siti
ve, 4
=ve
ry p
osi
tive
)
Act
ion
co
mb
ined
Man
ner
.S=
100.
D=
100.
A=
100
rati
ng
(1=
neg
ativ
e, 2
=n
eutr
al, 3
=p
osi
tive
, 4=
very
po
siti
ve)
Act
ion
co
mb
ined
Man
ner
.S=
100.
D=
0.A
=10
0 ra
tin
g (
1=n
egat
ive,
2=
neu
tral
, 3=
po
siti
ve, 4
=ve
ry p
osi
tive
)
Act
ion
co
mb
ined
Man
ner
.S=
100.
D=
100.
A=
0 ra
tin
g (
1=n
egat
ive,
2=
neu
tral
, 3=
po
siti
ve, 4
=ve
ry p
osi
tive
)
Act
ion
co
mb
ined
Man
ner
.S=
100.
D=
0.A
=0
rati
ng
(1=
neg
ativ
e, 2
=n
eutr
al, 3
=p
osi
tive
, 4=
very
po
siti
ve)
Act
ion
co
mb
ined
Man
ner
.S=
0.D
=10
0.A
=10
0 ra
tin
g (
1=n
egat
ive,
2=
neu
tral
, 3=
po
siti
ve, 4
=ve
ry p
osi
tive
)
Act
ion
co
mb
ined
Man
ner
.S=
0.D
=0.
A=
100
rati
ng
(1=
neg
ativ
e, 2
=n
eutr
al, 3
=p
osi
tive
, 4=
very
po
siti
ve)
Act
ion
co
mb
ined
Man
ner
.S=
0.D
=10
0.A
=0
rati
ng
(1=
neg
ativ
e, 2
=n
eutr
al, 3
=p
osi
tive
, 4=
very
po
siti
ve)
Act
ion
co
mb
ined
Man
ner
.S=
0.D
=0.
A=
0 ra
tin
g (
1=n
egat
ive,
2=
neu
tral
, 3=
po
siti
ve, 4
=ve
ry p
osi
tive
)
B01 1 1 2 0 0 100 25 0 100 a a b 2 1 0 0 0 0 0 100 50 100 0 50 3 3 4 4 4 4 4 4 1 1 1 1 2 1 1 1
B02 1 2 3 1 100 25 25 0 100 b c b 0 2 1 0 0 0 0 0 0 100 0 50 3 2 3 1 3 1 4 1 2 4 3 3 2 4 1 3
B03 1 1 4 1 100 50 75 100 100 a a c 2 0 1 0 0 0 0 0 0 100 0 50 3 3 3 3 3 3 2 2 3 3 1 3 3 3 1 1
B04 1 2 2 0 0 100 100 100 100 b c c 0 1 2 0 0 0 0 0 0 100 0 50 3 3 3 3 4 4 4 4 3 4 3 4 3 4 3 4

139
B05 1 1 3 1 50 25 75 100 100 a a c 2 0 1 100 0 50 0 0 0 100 100 100 3 2 1 1 4 4 1 1 1 4 1 4 1 4 1 4
B06 1 2 1 1 50 0 100 100 100 b c b 0 2 1 0 100 50 0 0 0 100 100 100 4 4 4 4 4 4 4 4 2 3 2 4 2 4 2 4
B07 1 2 3 1 50 50 50 0 100 a a b 2 1 0 0 0 0 0 0 0 100 0 50 3 2 3 2 3 2 2 2 1 3 1 2 2 4 2 3
B08 1 1 2 0 50 50 25 100 100 a a b 2 1 0 0 0 0 0 0 0 100 0 50 3 2 3 2 4 3 4 3 2 3 1 2 3 4 3 4
B09 1 2 2 0 50 25 100 100 100 a a c 2 0 1 0 0 0 100 100 100 100 100 100 2 2 3 3 3 3 4 4 3 3 1 3 4 4 4 4
B10 1 1 1 0 50 50 75 0 0 b c c 0 1 2 0 100 50 0 0 0 0 100 50 1 1 3 3 3 3 4 4 2 4 1 2 1 4 1 3
B11 1 2 1 1 100 25 100 0 0 b c c 0 1 2 0 0 0 0 0 0 100 0 50 3 3 3 3 4 4 4 4 3 4 1 4 3 4 3 4
B12 1 2 1 0 100 50 75 100 100 b c c 0 1 2 100 100 100 0 0 0 100 0 50 3 3 2 2 4 3 3 3 1 3 1 3 3 4 2 3
B13 1 2 2 0 100 50 50 0 100 a a c 2 0 1 0 0 0 0 0 0 100 100 100 3 1 3 1 4 3 3 2 1 4 1 3 2 4 1 2
B14 1 1 3 1 50 75 75 0 100 b a b 1 2 0 0 100 50 0 0 0 100 0 50 1 1 2 2 2 2 3 3 1 3 1 2 1 3 1 4
B15 1 1 5 1 50 50 75 0 100 a c c 1 0 2 100 100 100 100 100 100 100 0 50 2 2 3 3 2 3 3 3 1 3 1 3 1 3 1 3
B16 1 2 1 1 0 0 75 100 100 b c b 0 2 1 0 100 50 0 100 50 0 0 0 3 2 2 1 3 2 3 2 3 4 2 3 1 3 3 4
B17 1 2 2 1 50 0 25 0 0 a c c 1 0 2 0 0 0 0 0 0 0 0 0 4 1 3 1 4 3 3 2 1 3 1 3 1 4 1 4
B18 1 2 1 1 50 25 50 100 0 b c b 0 2 1 0 100 50 0 0 0 100 0 50 3 1 4 3 4 3 4 3 1 3 1 3 1 3 1 3
B19 1 1 1 0 50 75 25 100 0 a a c 2 0 1 0 100 50 0 0 0 0 100 50 3 3 4 4 4 4 4 4 3 4 2 3 3 3 3 4
B20 1 2 1 0 0 50 75 100 100 a a c 2 0 1 0 0 0 0 0 0 100 0 50 4 3 3 3 4 4 3 3 1 4 1 3 1 4 1 3
B21 1 2 1 0 50 50 0 0 0 a c b 1 1 1 0 0 0 0 0 0 0 0 0 3 3 3 3 4 4 4 4 1 3 1 3 2 3 3 4
B22 1 2 2 0 100 0 75 0 0 b c c 0 1 2 0 0 0 0 0 0 100 100 100 3 1 4 2 4 3 4 3 1 3 1 3 2 3 2 4
B23 1 1 1 0 50 25 75 100 100 a c b 1 1 1 0 100 50 0 100 50 0 100 50 3 3 3 3 3 3 3 3 3 4 3 4 3 4 3 4
B24 1 2 4 1 50 75 75 0 0 b c b 0 2 1 0 0 0 0 0 0 100 100 100 3 2 4 3 4 3 4 3 3 4 1 2 3 4 2 4
B25 1 2 3 1 50 75 100 100 0 a a b 2 1 0 0 0 0 0 0 0 100 100 100 3 3 3 3 2 4 4 4 1 3 1 3 3 4 2 4
B26 1 2 1 1 50 75 25 0 0 a a b 2 1 0 0 0 0 0 0 0 100 100 100 4 3 3 3 4 4 1 1 1 4 1 4 3 4 3 4
B27 1 2 3 0 50 75 75 0 0 b a b 1 2 0 0 100 50 0 0 0 100 0 50 1 1 4 3 4 4 4 4 1 4 1 4 1 4 1 4
B28 1 2 1 0 0 50 100 100 0 b c c 0 1 2 0 0 0 0 0 0 0 0 0 3 3 4 3 4 3 4 4 3 3 3 3 3 4 3 4
B29 1 1 1 0 50 50 25 0 100 b c c 0 1 2 0 0 0 0 0 0 100 0 50 4 1 3 3 4 4 4 2 2 4 3 4 3 4 3 4
B30 1 1 1 1 100 25 100 100 100 b c b 0 2 1 0 100 50 0 0 0 0 0 0 2 2 4 4 4 4 4 4 2 4 2 4 3 4 3 4
B31 1 1 2 1 50 25 100 100 100 a a b 2 1 0 0 100 50 0 0 0 0 0 0 3 3 4 4 4 4 4 4 3 3 1 3 3 4 2 4
B32 1 1 3 1 100 0 100 100 0 b c c 0 1 2 100 100 100 100 0 50 0 0 0 2 2 3 3 3 3 3 3 2 3 1 3 1 3 2 3
B33 1 2 1 1 50 75 25 0 0 a a c 2 0 1 100 0 50 0 0 0 0 0 0 2 2 3 2 4 4 4 4 1 3 1 3 1 3 1 4
B34 1 2 2 0 100 50 100 100 100 a a b 2 1 0 0 0 0 0 0 0 100 100 100 3 3 3 3 3 3 3 3 1 4 1 3 1 4 1 3
B35 1 2 2 1 50 100 100 100 100 a a b 2 1 0 100 0 50 0 0 0 100 100 100 3 1 3 3 4 4 4 4 3 4 3 4 3 4 3 4
B36 1 1 5 1 50 25 50 100 100 b c c 0 1 2 100 0 50 0 0 0 100 100 100 2 1 1 1 3 2 2 1 3 4 2 3 3 4 3 4
B37 1 1 4 1 50 0 0 0 100 b c c 0 1 2 0 100 50 0 0 0 100 0 50 4 4 3 3 1 1 1 1 3 4 1 3 3 4 3 3
B38 1 2 3 1 50 75 75 0 0 b c c 0 1 2 100 100 100 0 0 0 100 0 50 2 2 3 3 3 3 3 3 2 3 2 3 3 4 3 4
B39 1 2 2 0 0 75 25 100 0 a a b 2 1 0 0 0 0 0 0 0 100 0 50 2 2 3 3 3 3 3 3 1 3 1 3 1 3 1 3
B40 1 1 1 1 50 75 75 100 100 b a b 1 2 0 0 0 0 0 0 0 0 0 0 1 2 3 4 2 3 4 4 1 3 2 3 3 4 3 4
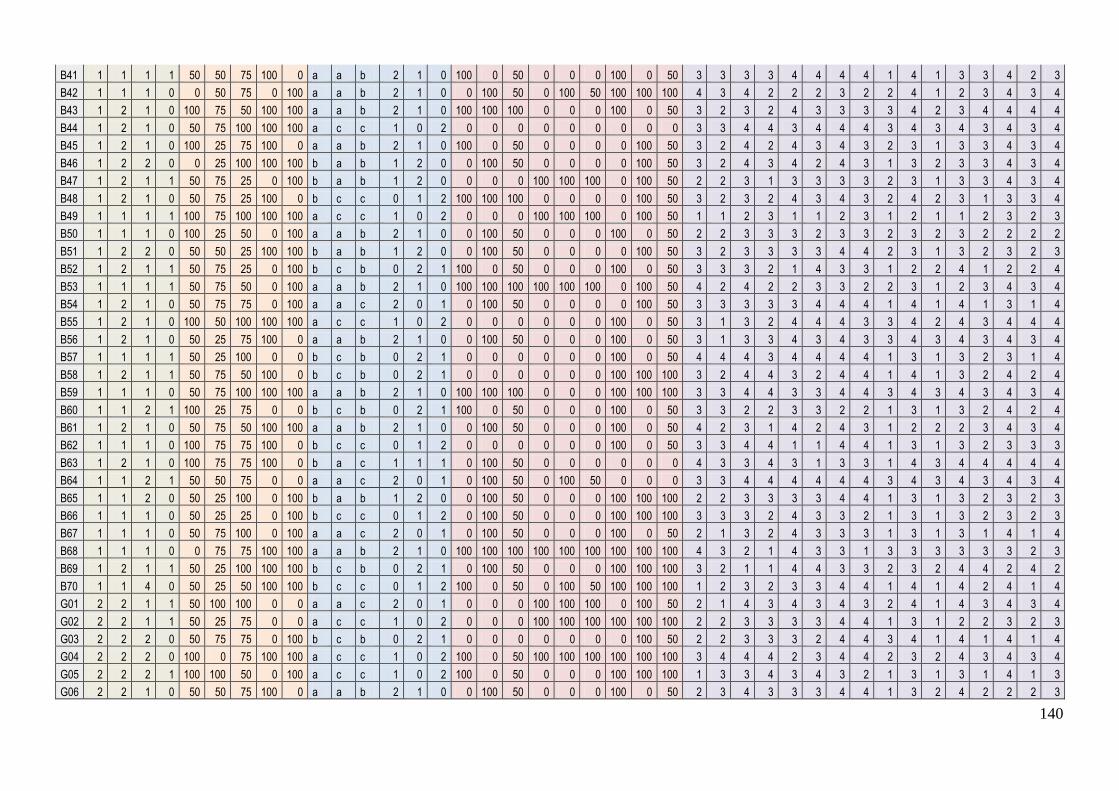
140
B41 1 1 1 1 50 50 75 100 0 a a b 2 1 0 100 0 50 0 0 0 100 0 50 3 3 3 3 4 4 4 4 1 4 1 3 3 4 2 3
B42 1 1 1 0 0 50 75 0 100 a a b 2 1 0 0 100 50 0 100 50 100 100 100 4 3 4 2 2 2 3 2 2 4 1 2 3 4 3 4
B43 1 2 1 0 100 75 50 100 100 a a b 2 1 0 100 100 100 0 0 0 100 0 50 3 2 3 2 4 3 3 3 3 4 2 3 4 4 4 4
B44 1 2 1 0 50 75 100 100 100 a c c 1 0 2 0 0 0 0 0 0 0 0 0 3 3 4 4 3 4 4 4 3 4 3 4 3 4 3 4
B45 1 2 1 0 100 25 75 100 0 a a b 2 1 0 100 0 50 0 0 0 0 100 50 3 2 4 2 4 3 4 3 2 3 1 3 3 4 3 4
B46 1 2 2 0 0 25 100 100 100 b a b 1 2 0 0 100 50 0 0 0 0 100 50 3 2 4 3 4 2 4 3 1 3 2 3 3 4 3 4
B47 1 2 1 1 50 75 25 0 100 b a b 1 2 0 0 0 0 100 100 100 0 100 50 2 2 3 1 3 3 3 3 2 3 1 3 3 4 3 4
B48 1 2 1 0 50 75 25 100 0 b c c 0 1 2 100 100 100 0 0 0 0 100 50 3 2 3 2 4 3 4 3 2 4 2 3 1 3 3 4
B49 1 1 1 1 100 75 100 100 100 a c c 1 0 2 0 0 0 100 100 100 0 100 50 1 1 2 3 1 1 2 3 1 2 1 1 2 3 2 3
B50 1 1 1 0 100 25 50 0 100 a a b 2 1 0 0 100 50 0 0 0 100 0 50 2 2 3 3 3 2 3 3 2 3 2 3 2 2 2 2
B51 1 2 2 0 50 50 25 100 100 b a b 1 2 0 0 100 50 0 0 0 0 100 50 3 2 3 3 3 3 4 4 2 3 1 3 2 3 2 3
B52 1 2 1 1 50 75 25 0 100 b c b 0 2 1 100 0 50 0 0 0 100 0 50 3 3 3 2 1 4 3 3 1 2 2 4 1 2 2 4
B53 1 1 1 1 50 75 50 0 100 a a b 2 1 0 100 100 100 100 100 100 0 100 50 4 2 4 2 2 3 3 2 2 3 1 2 3 4 3 4
B54 1 2 1 0 50 75 75 0 100 a a c 2 0 1 0 100 50 0 0 0 0 100 50 3 3 3 3 3 4 4 4 1 4 1 4 1 3 1 4
B55 1 2 1 0 100 50 100 100 100 a c c 1 0 2 0 0 0 0 0 0 100 0 50 3 1 3 2 4 4 4 3 3 4 2 4 3 4 4 4
B56 1 2 1 0 50 25 75 100 0 a a b 2 1 0 0 100 50 0 0 0 100 0 50 3 1 3 3 4 3 4 3 3 4 3 4 3 4 3 4
B57 1 1 1 1 50 25 100 0 0 b c b 0 2 1 0 0 0 0 0 0 100 0 50 4 4 4 3 4 4 4 4 1 3 1 3 2 3 1 4
B58 1 2 1 1 50 75 50 100 0 b c b 0 2 1 0 0 0 0 0 0 100 100 100 3 2 4 4 3 2 4 4 1 4 1 3 2 4 2 4
B59 1 1 1 0 50 75 100 100 100 a a b 2 1 0 100 100 100 0 0 0 100 100 100 3 3 4 4 3 3 4 4 3 4 3 4 3 4 3 4
B60 1 1 2 1 100 25 75 0 0 b c b 0 2 1 100 0 50 0 0 0 100 0 50 3 3 2 2 3 3 2 2 1 3 1 3 2 4 2 4
B61 1 2 1 0 50 75 50 100 100 a a b 2 1 0 0 100 50 0 0 0 100 0 50 4 2 3 1 4 2 4 3 1 2 2 2 3 4 3 4
B62 1 1 1 0 100 75 75 100 0 b c c 0 1 2 0 0 0 0 0 0 100 0 50 3 3 4 4 1 1 4 4 1 3 1 3 2 3 3 3
B63 1 2 1 0 100 75 75 100 0 b a c 1 1 1 0 100 50 0 0 0 0 0 0 4 3 3 4 3 1 3 3 1 4 3 4 4 4 4 4
B64 1 1 2 1 50 50 75 0 0 a a c 2 0 1 0 100 50 0 100 50 0 0 0 3 3 4 4 4 4 4 4 3 4 3 4 3 4 3 4
B65 1 1 2 0 50 25 100 0 100 b a b 1 2 0 0 100 50 0 0 0 100 100 100 2 2 3 3 3 3 4 4 1 3 1 3 2 3 2 3
B66 1 1 1 0 50 25 25 0 100 b c c 0 1 2 0 100 50 0 0 0 100 100 100 3 3 3 2 4 3 3 2 1 3 1 3 2 3 2 3
B67 1 1 1 0 50 75 100 0 100 a a c 2 0 1 0 100 50 0 0 0 100 0 50 2 1 3 2 4 3 3 3 1 3 1 3 1 4 1 4
B68 1 1 1 0 0 75 75 100 100 a a b 2 1 0 100 100 100 100 100 100 100 100 100 4 3 2 1 4 3 3 1 3 3 3 3 3 3 2 3
B69 1 2 1 1 50 25 100 100 100 b c b 0 2 1 0 100 50 0 0 0 100 100 100 3 2 1 1 4 4 3 3 2 3 2 4 4 2 4 2
B70 1 1 4 0 50 25 50 100 100 b c c 0 1 2 100 0 50 0 100 50 100 100 100 1 2 3 2 3 3 4 4 1 4 1 4 2 4 1 4
G01 2 2 1 1 50 100 100 0 0 a a c 2 0 1 0 0 0 100 100 100 0 100 50 2 1 4 3 4 3 4 3 2 4 1 4 3 4 3 4
G02 2 2 1 1 50 25 75 0 0 a c c 1 0 2 0 0 0 100 100 100 100 100 100 2 2 3 3 3 3 4 4 1 3 1 2 2 3 2 3
G03 2 2 2 0 50 75 75 0 100 b c b 0 2 1 0 0 0 0 0 0 0 100 50 2 2 3 3 3 2 4 4 3 4 1 4 1 4 1 4
G04 2 2 2 0 100 0 75 100 100 a c c 1 0 2 100 0 50 100 100 100 100 100 100 3 4 4 4 2 3 4 4 2 3 2 4 3 4 3 4
G05 2 2 2 1 100 100 50 0 100 a c c 1 0 2 100 0 50 0 0 0 100 100 100 1 3 3 4 3 4 3 2 1 3 1 3 1 4 1 3
G06 2 2 1 0 50 50 75 100 0 a a b 2 1 0 0 100 50 0 0 0 100 0 50 2 3 4 3 3 3 4 4 1 3 2 4 2 2 2 3
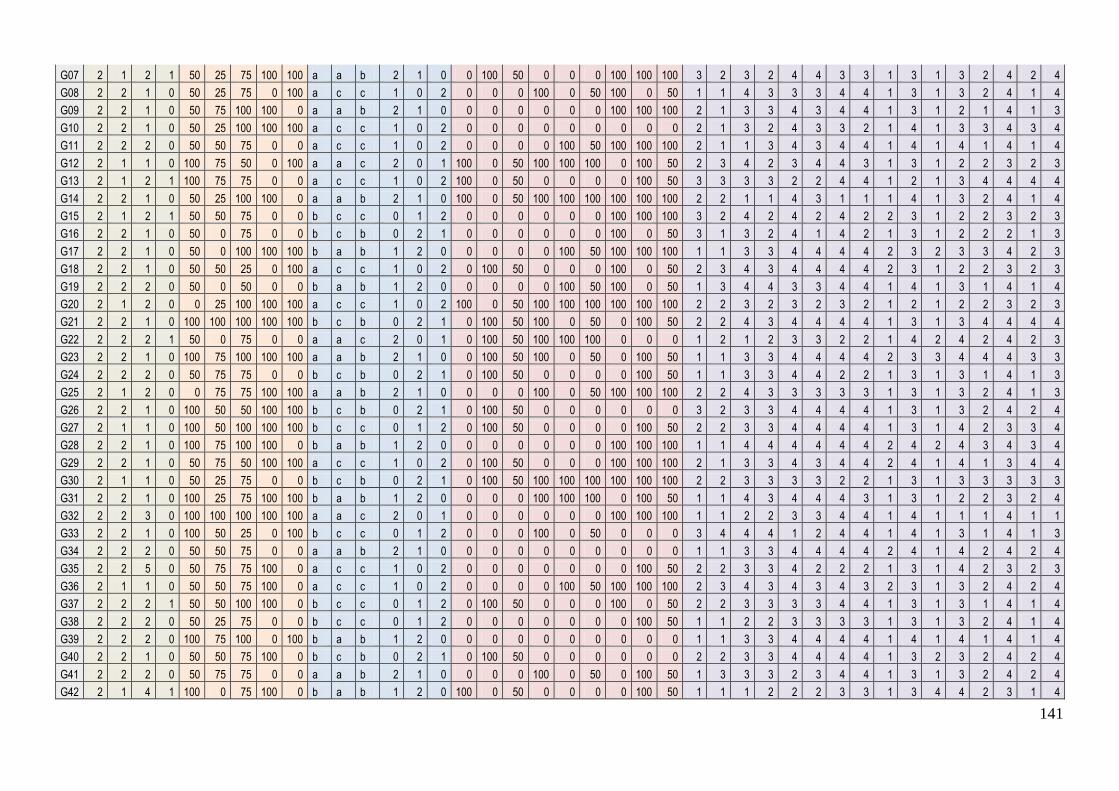
141
G07 2 1 2 1 50 25 75 100 100 a a b 2 1 0 0 100 50 0 0 0 100 100 100 3 2 3 2 4 4 3 3 1 3 1 3 2 4 2 4
G08 2 2 1 0 50 25 75 0 100 a c c 1 0 2 0 0 0 100 0 50 100 0 50 1 1 4 3 3 3 4 4 1 3 1 3 2 4 1 4
G09 2 2 1 0 50 75 100 100 0 a a b 2 1 0 0 0 0 0 0 0 100 100 100 2 1 3 3 4 3 4 4 1 3 1 2 1 4 1 3
G10 2 2 1 0 50 25 100 100 100 a c c 1 0 2 0 0 0 0 0 0 0 0 0 2 1 3 2 4 3 3 2 1 4 1 3 3 4 3 4
G11 2 2 2 0 50 50 75 0 0 a c c 1 0 2 0 0 0 0 100 50 100 100 100 2 1 1 3 4 3 4 4 1 4 1 4 1 4 1 4
G12 2 1 1 0 100 75 50 0 100 a a c 2 0 1 100 0 50 100 100 100 0 100 50 2 3 4 2 3 4 4 3 1 3 1 2 2 3 2 3
G13 2 1 2 1 100 75 75 0 0 a c c 1 0 2 100 0 50 0 0 0 0 100 50 3 3 3 3 2 2 4 4 1 2 1 3 4 4 4 4
G14 2 2 1 0 50 25 100 100 0 a a b 2 1 0 100 0 50 100 100 100 100 100 100 2 2 1 1 4 3 1 1 1 4 1 3 2 4 1 4
G15 2 1 2 1 50 50 75 0 0 b c c 0 1 2 0 0 0 0 0 0 100 100 100 3 2 4 2 4 2 4 2 2 3 1 2 2 3 2 3
G16 2 2 1 0 50 0 75 0 0 b c b 0 2 1 0 0 0 0 0 0 100 0 50 3 1 3 2 4 1 4 2 1 3 1 2 2 2 1 3
G17 2 2 1 0 50 0 100 100 100 b a b 1 2 0 0 0 0 0 100 50 100 100 100 1 1 3 3 4 4 4 4 2 3 2 3 3 4 2 3
G18 2 2 1 0 50 50 25 0 100 a c c 1 0 2 0 100 50 0 0 0 100 0 50 2 3 4 3 4 4 4 4 2 3 1 2 2 3 2 3
G19 2 2 2 0 50 0 50 0 0 b a b 1 2 0 0 0 0 0 100 50 100 0 50 1 3 4 4 3 3 4 4 1 4 1 3 1 4 1 4
G20 2 1 2 0 0 25 100 100 100 a c c 1 0 2 100 0 50 100 100 100 100 100 100 2 2 3 2 3 2 3 2 1 2 1 2 2 3 2 3
G21 2 2 1 0 100 100 100 100 100 b c b 0 2 1 0 100 50 100 0 50 0 100 50 2 2 4 3 4 4 4 4 1 3 1 3 4 4 4 4
G22 2 2 2 1 50 0 75 0 0 a a c 2 0 1 0 100 50 100 100 100 0 0 0 1 2 1 2 3 3 2 2 1 4 2 4 2 4 2 3
G23 2 2 1 0 100 75 100 100 100 a a b 2 1 0 0 100 50 100 0 50 0 100 50 1 1 3 3 4 4 4 4 2 3 3 4 4 4 3 3
G24 2 2 2 0 50 75 75 0 0 b c b 0 2 1 0 100 50 0 0 0 0 100 50 1 1 3 3 4 4 2 2 1 3 1 3 1 4 1 3
G25 2 1 2 0 0 75 75 100 100 a a b 2 1 0 0 0 0 100 0 50 100 100 100 2 2 4 3 3 3 3 3 1 3 1 3 2 4 1 3
G26 2 2 1 0 100 50 50 100 100 b c b 0 2 1 0 100 50 0 0 0 0 0 0 3 2 3 3 4 4 4 4 1 3 1 3 2 4 2 4
G27 2 1 1 0 100 50 100 100 100 b c c 0 1 2 0 100 50 0 0 0 0 100 50 2 2 3 3 4 4 4 4 1 3 1 4 2 3 3 4
G28 2 2 1 0 100 75 100 100 0 b a b 1 2 0 0 0 0 0 0 0 100 100 100 1 1 4 4 4 4 4 4 2 4 2 4 3 4 3 4
G29 2 2 1 0 50 75 50 100 100 a c c 1 0 2 0 100 50 0 0 0 100 100 100 2 1 3 3 4 3 4 4 2 4 1 4 1 3 4 4
G30 2 1 1 0 50 25 75 0 0 b c b 0 2 1 0 100 50 100 100 100 100 100 100 2 2 3 3 3 3 2 2 1 3 1 3 3 3 3 3
G31 2 2 1 0 100 25 75 100 100 b a b 1 2 0 0 0 0 100 100 100 0 100 50 1 1 4 3 4 4 4 3 1 3 1 2 2 3 2 4
G32 2 2 3 0 100 100 100 100 100 a a c 2 0 1 0 0 0 0 0 0 100 100 100 1 1 2 2 3 3 4 4 1 4 1 1 1 4 1 1
G33 2 2 1 0 100 50 25 0 100 b c c 0 1 2 0 0 0 100 0 50 0 0 0 3 4 4 4 1 2 4 4 1 4 1 3 1 4 1 3
G34 2 2 2 0 50 50 75 0 0 a a b 2 1 0 0 0 0 0 0 0 0 0 0 1 1 3 3 4 4 4 4 2 4 1 4 2 4 2 4
G35 2 2 5 0 50 75 75 100 0 a c c 1 0 2 0 0 0 0 0 0 0 100 50 2 2 3 3 4 2 2 2 1 3 1 4 2 3 2 3
G36 2 1 1 0 50 50 75 100 0 a c c 1 0 2 0 0 0 0 100 50 100 100 100 2 3 4 3 4 3 4 3 2 3 1 3 2 4 2 4
G37 2 2 2 1 50 50 100 100 0 b c c 0 1 2 0 100 50 0 0 0 100 0 50 2 2 3 3 3 3 4 4 1 3 1 3 1 4 1 4
G38 2 2 2 0 50 25 75 0 0 b c c 0 1 2 0 0 0 0 0 0 0 100 50 1 1 2 2 3 3 3 3 1 3 1 3 2 4 1 4
G39 2 2 2 0 100 75 100 0 100 b a b 1 2 0 0 0 0 0 0 0 0 0 0 1 1 3 3 4 4 4 4 1 4 1 4 1 4 1 4
G40 2 2 1 0 50 50 75 100 0 b c b 0 2 1 0 100 50 0 0 0 0 0 0 2 2 3 3 4 4 4 4 1 3 2 3 2 4 2 4
G41 2 2 2 0 50 75 75 0 0 a a b 2 1 0 0 0 0 100 0 50 0 100 50 1 3 3 3 2 3 4 4 1 3 1 3 2 4 2 4
G42 2 1 4 1 100 0 75 100 0 b a b 1 2 0 100 0 50 0 0 0 0 100 50 1 1 1 2 2 2 3 3 1 3 4 4 2 3 1 4
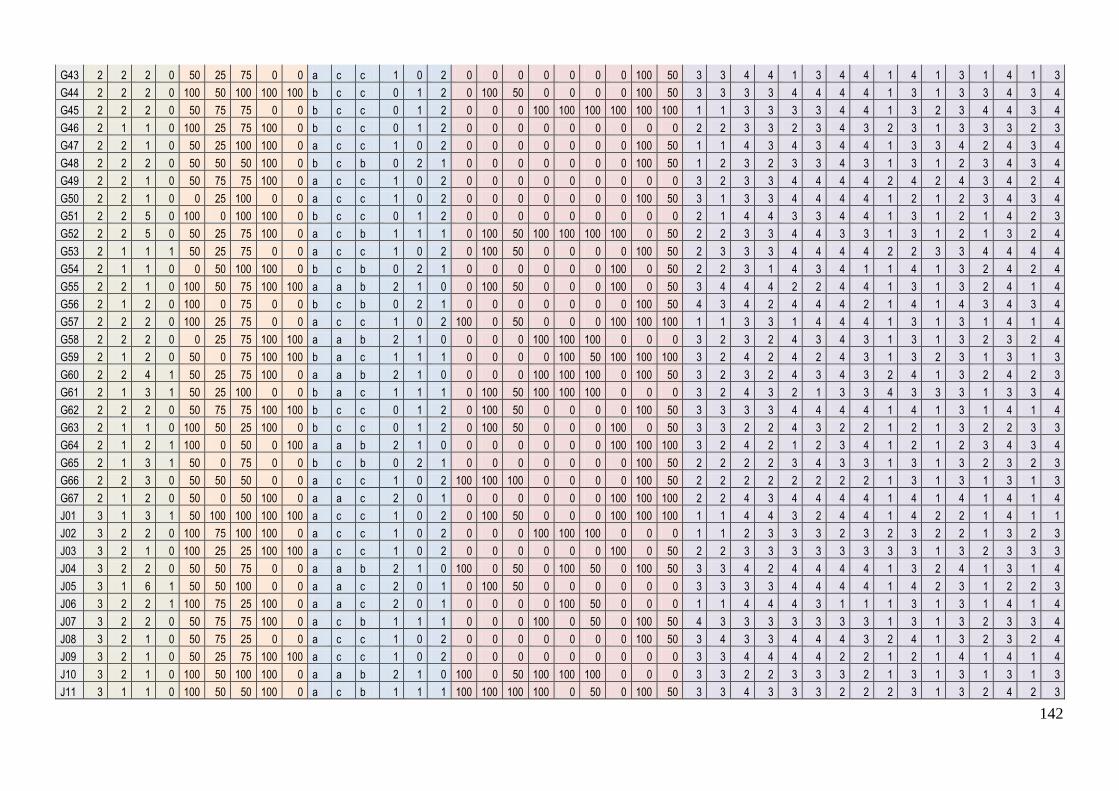
142
G43 2 2 2 0 50 25 75 0 0 a c c 1 0 2 0 0 0 0 0 0 0 100 50 3 3 4 4 1 3 4 4 1 4 1 3 1 4 1 3
G44 2 2 2 0 100 50 100 100 100 b c c 0 1 2 0 100 50 0 0 0 0 100 50 3 3 3 3 4 4 4 4 1 3 1 3 3 4 3 4
G45 2 2 2 0 50 75 75 0 0 b c c 0 1 2 0 0 0 100 100 100 100 100 100 1 1 3 3 3 3 4 4 1 3 2 3 4 4 3 4
G46 2 1 1 0 100 25 75 100 0 b c c 0 1 2 0 0 0 0 0 0 0 0 0 2 2 3 3 2 3 4 3 2 3 1 3 3 3 2 3
G47 2 2 1 0 50 25 100 100 0 a c c 1 0 2 0 0 0 0 0 0 0 100 50 1 1 4 3 4 3 4 4 1 3 3 4 2 4 3 4
G48 2 2 2 0 50 50 50 100 0 b c b 0 2 1 0 0 0 0 0 0 0 100 50 1 2 3 2 3 3 4 3 1 3 1 2 3 4 3 4
G49 2 2 1 0 50 75 75 100 0 a c c 1 0 2 0 0 0 0 0 0 0 0 0 3 2 3 3 4 4 4 4 2 4 2 4 3 4 2 4
G50 2 2 1 0 0 25 100 0 0 a c c 1 0 2 0 0 0 0 0 0 0 100 50 3 1 3 3 4 4 4 4 1 2 1 2 3 4 3 4
G51 2 2 5 0 100 0 100 100 0 b c c 0 1 2 0 0 0 0 0 0 0 0 0 2 1 4 4 3 3 4 4 1 3 1 2 1 4 2 3
G52 2 2 5 0 50 25 75 100 0 a c b 1 1 1 0 100 50 100 100 100 100 0 50 2 2 3 3 4 4 3 3 1 3 1 2 1 3 2 4
G53 2 1 1 1 50 25 75 0 0 a c c 1 0 2 0 100 50 0 0 0 0 100 50 2 3 3 3 4 4 4 4 2 2 3 3 4 4 4 4
G54 2 1 1 0 0 50 100 100 0 b c b 0 2 1 0 0 0 0 0 0 100 0 50 2 2 3 1 4 3 4 1 1 4 1 3 2 4 2 4
G55 2 2 1 0 100 50 75 100 100 a a b 2 1 0 0 100 50 0 0 0 100 0 50 3 4 4 4 2 2 4 4 1 3 1 3 2 4 1 4
G56 2 1 2 0 100 0 75 0 0 b c b 0 2 1 0 0 0 0 0 0 0 100 50 4 3 4 2 4 4 4 2 1 4 1 4 3 4 3 4
G57 2 2 2 0 100 25 75 0 0 a c c 1 0 2 100 0 50 0 0 0 100 100 100 1 1 3 3 1 4 4 4 1 3 1 3 1 4 1 4
G58 2 2 2 0 0 25 75 100 100 a a b 2 1 0 0 0 0 100 100 100 0 0 0 3 2 3 2 4 3 4 3 1 3 1 3 2 3 2 4
G59 2 1 2 0 50 0 75 100 100 b a c 1 1 1 0 0 0 0 100 50 100 100 100 3 2 4 2 4 2 4 3 1 3 2 3 1 3 1 3
G60 2 2 4 1 50 25 75 100 0 a a b 2 1 0 0 0 0 100 100 100 0 100 50 3 2 3 2 4 3 4 3 2 4 1 3 2 4 2 3
G61 2 1 3 1 50 25 100 0 0 b a c 1 1 1 0 100 50 100 100 100 0 0 0 3 2 4 3 2 1 3 3 4 3 3 3 1 3 3 4
G62 2 2 2 0 50 75 75 100 100 b c c 0 1 2 0 100 50 0 0 0 0 100 50 3 3 3 3 4 4 4 4 1 4 1 3 1 4 1 4
G63 2 1 1 0 100 50 25 100 0 b c c 0 1 2 0 100 50 0 0 0 100 0 50 3 3 2 2 4 3 2 2 1 2 1 3 2 2 3 3
G64 2 1 2 1 100 0 50 0 100 a a b 2 1 0 0 0 0 0 0 0 100 100 100 3 2 4 2 1 2 3 4 1 2 1 2 3 4 3 4
G65 2 1 3 1 50 0 75 0 0 b c b 0 2 1 0 0 0 0 0 0 0 100 50 2 2 2 2 3 4 3 3 1 3 1 3 2 3 2 3
G66 2 2 3 0 50 50 50 0 0 a c c 1 0 2 100 100 100 0 0 0 0 100 50 2 2 2 2 2 2 2 2 1 3 1 3 1 3 1 3
G67 2 1 2 0 50 0 50 100 0 a a c 2 0 1 0 0 0 0 0 0 100 100 100 2 2 4 3 4 4 4 4 1 4 1 4 1 4 1 4
J01 3 1 3 1 50 100 100 100 100 a c c 1 0 2 0 100 50 0 0 0 100 100 100 1 1 4 4 3 2 4 4 1 4 2 2 1 4 1 1
J02 3 2 2 0 100 75 100 100 0 a c c 1 0 2 0 0 0 100 100 100 0 0 0 1 1 2 3 3 3 2 3 2 3 2 2 1 3 2 3
J03 3 2 1 0 100 25 25 100 100 a c c 1 0 2 0 0 0 0 0 0 100 0 50 2 2 3 3 3 3 3 3 3 3 1 3 2 3 3 3
J04 3 2 2 0 50 50 75 0 0 a a b 2 1 0 100 0 50 0 100 50 0 100 50 3 3 4 2 4 4 4 4 1 3 2 4 1 3 1 4
J05 3 1 6 1 50 50 100 0 0 a a c 2 0 1 0 100 50 0 0 0 0 0 0 3 3 3 3 4 4 4 4 1 4 2 3 1 2 2 3
J06 3 2 2 1 100 75 25 100 0 a a c 2 0 1 0 0 0 0 100 50 0 0 0 1 1 4 4 4 3 1 1 1 3 1 3 1 4 1 4
J07 3 2 2 0 50 75 75 100 0 a c b 1 1 1 0 0 0 100 0 50 0 100 50 4 3 3 3 3 3 3 3 1 3 1 3 2 3 3 4
J08 3 2 1 0 50 75 25 0 0 a c c 1 0 2 0 0 0 0 0 0 0 100 50 3 4 3 3 4 4 4 3 2 4 1 3 2 3 2 4
J09 3 2 1 0 50 25 75 100 100 a c c 1 0 2 0 0 0 0 0 0 0 0 0 3 3 4 4 4 4 2 2 1 2 1 4 1 4 1 4
J10 3 2 1 0 100 50 100 100 0 a a b 2 1 0 100 0 50 100 100 100 0 0 0 3 3 2 2 3 3 3 2 1 3 1 3 1 3 1 3
J11 3 1 1 0 100 50 50 100 0 a c b 1 1 1 100 100 100 100 0 50 0 100 50 3 3 4 3 3 3 2 2 2 3 1 3 2 4 2 3
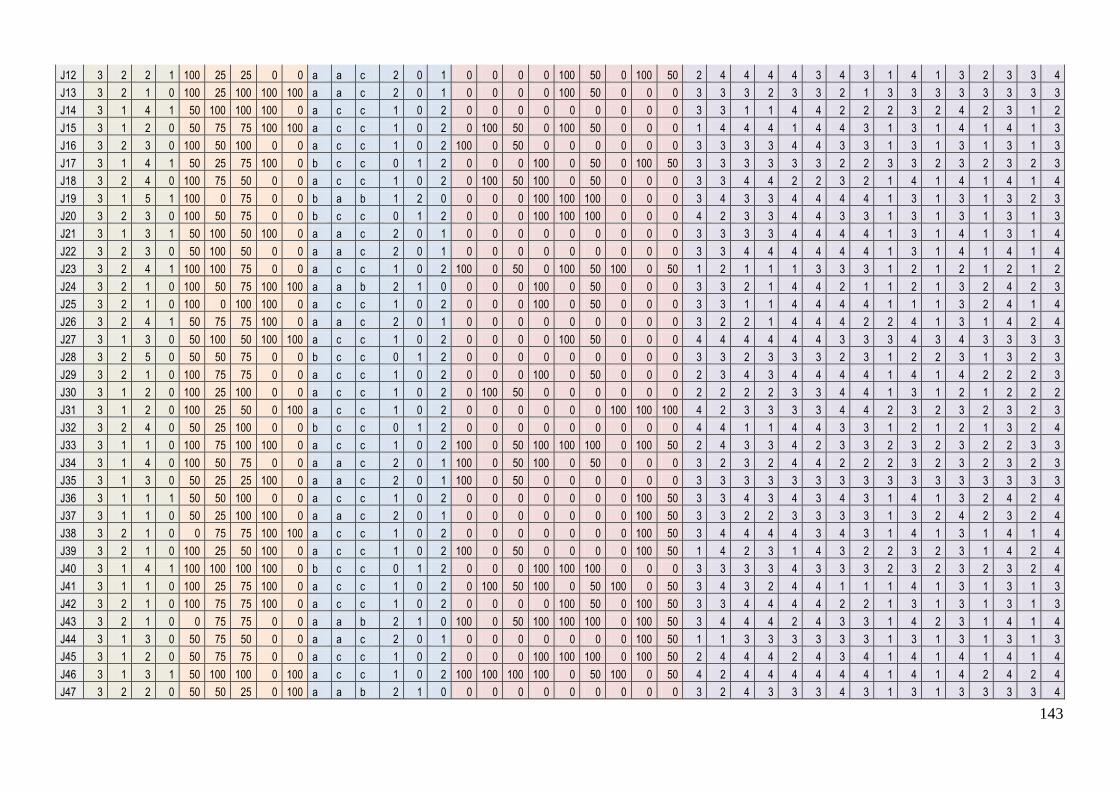
143
J12 3 2 2 1 100 25 25 0 0 a a c 2 0 1 0 0 0 0 100 50 0 100 50 2 4 4 4 4 3 4 3 1 4 1 3 2 3 3 4
J13 3 2 1 0 100 25 100 100 100 a a c 2 0 1 0 0 0 0 100 50 0 0 0 3 3 3 2 3 3 2 1 3 3 3 3 3 3 3 3
J14 3 1 4 1 50 100 100 100 0 a c c 1 0 2 0 0 0 0 0 0 0 0 0 3 3 1 1 4 4 2 2 2 3 2 4 2 3 1 2
J15 3 1 2 0 50 75 75 100 100 a c c 1 0 2 0 100 50 0 100 50 0 0 0 1 4 4 4 1 4 4 3 1 3 1 4 1 4 1 3
J16 3 2 3 0 100 50 100 0 0 a c c 1 0 2 100 0 50 0 0 0 0 0 0 3 3 3 3 4 4 3 3 1 3 1 3 1 3 1 3
J17 3 1 4 1 50 25 75 100 0 b c c 0 1 2 0 0 0 100 0 50 0 100 50 3 3 3 3 3 3 2 2 3 3 2 3 2 3 2 3
J18 3 2 4 0 100 75 50 0 0 a c c 1 0 2 0 100 50 100 0 50 0 0 0 3 3 4 4 2 2 3 2 1 4 1 4 1 4 1 4
J19 3 1 5 1 100 0 75 0 0 b a b 1 2 0 0 0 0 100 100 100 0 0 0 3 4 3 3 4 4 4 4 1 3 1 3 1 3 2 3
J20 3 2 3 0 100 50 75 0 0 b c c 0 1 2 0 0 0 100 100 100 0 0 0 4 2 3 3 4 4 3 3 1 3 1 3 1 3 1 3
J21 3 1 3 1 50 100 50 100 0 a a c 2 0 1 0 0 0 0 0 0 0 0 0 3 3 3 3 4 4 4 4 1 3 1 4 1 3 1 4
J22 3 2 3 0 50 100 50 0 0 a a c 2 0 1 0 0 0 0 0 0 0 0 0 3 3 4 4 4 4 4 4 1 3 1 4 1 4 1 4
J23 3 2 4 1 100 100 75 0 0 a c c 1 0 2 100 0 50 0 100 50 100 0 50 1 2 1 1 1 3 3 3 1 2 1 2 1 2 1 2
J24 3 2 1 0 100 50 75 100 100 a a b 2 1 0 0 0 0 100 0 50 0 0 0 3 3 2 1 4 4 2 1 1 2 1 3 2 4 2 3
J25 3 2 1 0 100 0 100 100 0 a c c 1 0 2 0 0 0 100 0 50 0 0 0 3 3 1 1 4 4 4 4 1 1 1 3 2 4 1 4
J26 3 2 4 1 50 75 75 100 0 a a c 2 0 1 0 0 0 0 0 0 0 0 0 3 2 2 1 4 4 4 2 2 4 1 3 1 4 2 4
J27 3 1 3 0 50 100 50 100 100 a c c 1 0 2 0 0 0 0 100 50 0 0 0 4 4 4 4 4 4 3 3 3 4 3 4 3 3 3 3
J28 3 2 5 0 50 50 75 0 0 b c c 0 1 2 0 0 0 0 0 0 0 0 0 3 3 2 3 3 3 2 3 1 2 2 3 1 3 2 3
J29 3 2 1 0 100 75 75 0 0 a c c 1 0 2 0 0 0 100 0 50 0 0 0 2 3 4 3 4 4 4 4 1 4 1 4 2 2 2 3
J30 3 1 2 0 100 25 100 0 0 a c c 1 0 2 0 100 50 0 0 0 0 0 0 2 2 2 2 3 3 4 4 1 3 1 2 1 2 2 2
J31 3 1 2 0 100 25 50 0 100 a c c 1 0 2 0 0 0 0 0 0 100 100 100 4 2 3 3 3 3 4 4 2 3 2 3 2 3 2 3
J32 3 2 4 0 50 25 100 0 0 b c c 0 1 2 0 0 0 0 0 0 0 0 0 4 4 1 1 4 4 3 3 1 2 1 2 1 3 2 4
J33 3 1 1 0 100 75 100 100 0 a c c 1 0 2 100 0 50 100 100 100 0 100 50 2 4 3 3 4 2 3 3 2 3 2 3 2 2 3 3
J34 3 1 4 0 100 50 75 0 0 a a c 2 0 1 100 0 50 100 0 50 0 0 0 3 2 3 2 4 4 2 2 2 3 2 3 2 3 2 3
J35 3 1 3 0 50 25 25 100 0 a a c 2 0 1 100 0 50 0 0 0 0 0 0 3 3 3 3 3 3 3 3 3 3 3 3 3 3 3 3
J36 3 1 1 1 50 50 100 0 0 a c c 1 0 2 0 0 0 0 0 0 0 100 50 3 3 4 3 4 3 4 3 1 4 1 3 2 4 2 4
J37 3 1 1 0 50 25 100 100 0 a a c 2 0 1 0 0 0 0 0 0 0 100 50 3 3 2 2 3 3 3 3 1 3 2 4 2 3 2 4
J38 3 2 1 0 0 75 75 100 100 a c c 1 0 2 0 0 0 0 0 0 0 100 50 3 4 4 4 4 3 4 3 1 4 1 3 1 4 1 4
J39 3 2 1 0 100 25 50 100 0 a c c 1 0 2 100 0 50 0 0 0 0 100 50 1 4 2 3 1 4 3 2 2 3 2 3 1 4 2 4
J40 3 1 4 1 100 100 100 100 0 b c c 0 1 2 0 0 0 100 100 100 0 0 0 3 3 3 3 4 3 3 3 2 3 2 3 2 3 2 4
J41 3 1 1 0 100 25 75 100 0 a c c 1 0 2 0 100 50 100 0 50 100 0 50 3 4 3 2 4 4 1 1 1 4 1 3 1 3 1 3
J42 3 2 1 0 100 75 75 100 0 a c c 1 0 2 0 0 0 0 100 50 0 100 50 3 3 4 4 4 4 2 2 1 3 1 3 1 3 1 3
J43 3 2 1 0 0 75 75 0 0 a a b 2 1 0 100 0 50 100 100 100 0 100 50 3 4 4 4 2 4 3 3 1 4 2 3 1 4 1 4
J44 3 1 3 0 50 75 50 0 0 a a c 2 0 1 0 0 0 0 0 0 0 100 50 1 1 3 3 3 3 3 3 1 3 1 3 1 3 1 3
J45 3 1 2 0 50 75 75 0 0 a c c 1 0 2 0 0 0 100 100 100 0 100 50 2 4 4 4 2 4 3 4 1 4 1 4 1 4 1 4
J46 3 1 3 1 50 100 100 0 100 a c c 1 0 2 100 100 100 100 0 50 100 0 50 4 2 4 4 4 4 4 4 1 4 1 4 2 4 2 4
J47 3 2 2 0 50 50 25 0 100 a a b 2 1 0 0 0 0 0 0 0 0 0 0 3 2 4 3 3 3 4 3 1 3 1 3 3 3 3 4
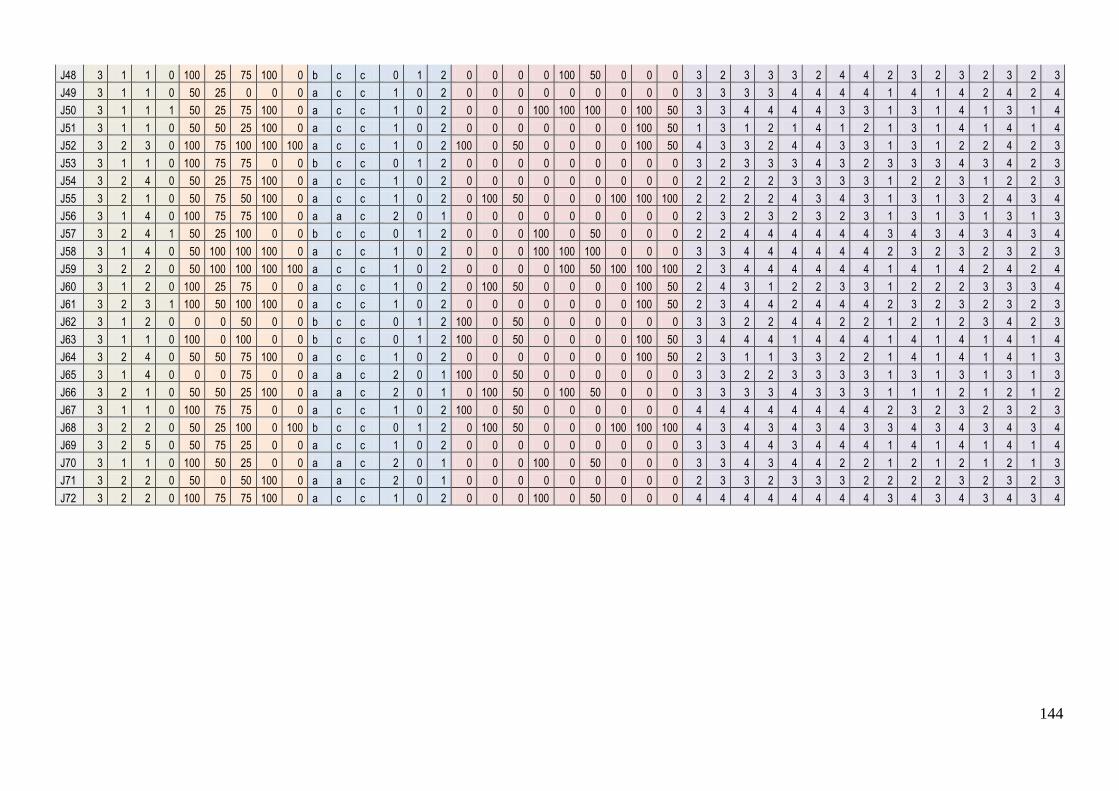
144
J48 3 1 1 0 100 25 75 100 0 b c c 0 1 2 0 0 0 0 100 50 0 0 0 3 2 3 3 3 2 4 4 2 3 2 3 2 3 2 3
J49 3 1 1 0 50 25 0 0 0 a c c 1 0 2 0 0 0 0 0 0 0 0 0 3 3 3 3 4 4 4 4 1 4 1 4 2 4 2 4
J50 3 1 1 1 50 25 75 100 0 a c c 1 0 2 0 0 0 100 100 100 0 100 50 3 3 4 4 4 4 3 3 1 3 1 4 1 3 1 4
J51 3 1 1 0 50 50 25 100 0 a c c 1 0 2 0 0 0 0 0 0 0 100 50 1 3 1 2 1 4 1 2 1 3 1 4 1 4 1 4
J52 3 2 3 0 100 75 100 100 100 a c c 1 0 2 100 0 50 0 0 0 0 100 50 4 3 3 2 4 4 3 3 1 3 1 2 2 4 2 3
J53 3 1 1 0 100 75 75 0 0 b c c 0 1 2 0 0 0 0 0 0 0 0 0 3 2 3 3 3 4 3 2 3 3 3 4 3 4 2 3
J54 3 2 4 0 50 25 75 100 0 a c c 1 0 2 0 0 0 0 0 0 0 0 0 2 2 2 2 3 3 3 3 1 2 2 3 1 2 2 3
J55 3 2 1 0 50 75 50 100 0 a c c 1 0 2 0 100 50 0 0 0 100 100 100 2 2 2 2 4 3 4 3 1 3 1 3 2 4 3 4
J56 3 1 4 0 100 75 75 100 0 a a c 2 0 1 0 0 0 0 0 0 0 0 0 2 3 2 3 2 3 2 3 1 3 1 3 1 3 1 3
J57 3 2 4 1 50 25 100 0 0 b c c 0 1 2 0 0 0 100 0 50 0 0 0 2 2 4 4 4 4 4 4 3 4 3 4 3 4 3 4
J58 3 1 4 0 50 100 100 100 0 a c c 1 0 2 0 0 0 100 100 100 0 0 0 3 3 4 4 4 4 4 4 2 3 2 3 2 3 2 3
J59 3 2 2 0 50 100 100 100 100 a c c 1 0 2 0 0 0 0 100 50 100 100 100 2 3 4 4 4 4 4 4 1 4 1 4 2 4 2 4
J60 3 1 2 0 100 25 75 0 0 a c c 1 0 2 0 100 50 0 0 0 0 100 50 2 4 3 1 2 2 3 3 1 2 2 2 3 3 3 4
J61 3 2 3 1 100 50 100 100 0 a c c 1 0 2 0 0 0 0 0 0 0 100 50 2 3 4 4 2 4 4 4 2 3 2 3 2 3 2 3
J62 3 1 2 0 0 0 50 0 0 b c c 0 1 2 100 0 50 0 0 0 0 0 0 3 3 2 2 4 4 2 2 1 2 1 2 3 4 2 3
J63 3 1 1 0 100 0 100 0 0 b c c 0 1 2 100 0 50 0 0 0 0 100 50 3 4 4 4 1 4 4 4 1 4 1 4 1 4 1 4
J64 3 2 4 0 50 50 75 100 0 a c c 1 0 2 0 0 0 0 0 0 0 100 50 2 3 1 1 3 3 2 2 1 4 1 4 1 4 1 3
J65 3 1 4 0 0 0 75 0 0 a a c 2 0 1 100 0 50 0 0 0 0 0 0 3 3 2 2 3 3 3 3 1 3 1 3 1 3 1 3
J66 3 2 1 0 50 50 25 100 0 a a c 2 0 1 0 100 50 0 100 50 0 0 0 3 3 3 3 4 3 3 3 1 1 1 2 1 2 1 2
J67 3 1 1 0 100 75 75 0 0 a c c 1 0 2 100 0 50 0 0 0 0 0 0 4 4 4 4 4 4 4 4 2 3 2 3 2 3 2 3
J68 3 2 2 0 50 25 100 0 100 b c c 0 1 2 0 100 50 0 0 0 100 100 100 4 3 4 3 4 3 4 3 3 4 3 4 3 4 3 4
J69 3 2 5 0 50 75 25 0 0 a c c 1 0 2 0 0 0 0 0 0 0 0 0 3 3 4 4 3 4 4 4 1 4 1 4 1 4 1 4
J70 3 1 1 0 100 50 25 0 0 a a c 2 0 1 0 0 0 100 0 50 0 0 0 3 3 4 3 4 4 2 2 1 2 1 2 1 2 1 3
J71 3 2 2 0 50 0 50 100 0 a a c 2 0 1 0 0 0 0 0 0 0 0 0 2 3 3 2 3 3 3 2 2 2 2 3 2 3 2 3
J72 3 2 2 0 100 75 75 100 0 a c c 1 0 2 0 0 0 100 0 50 0 0 0 4 4 4 4 4 4 4 4 3 4 3 4 3 4 3 4
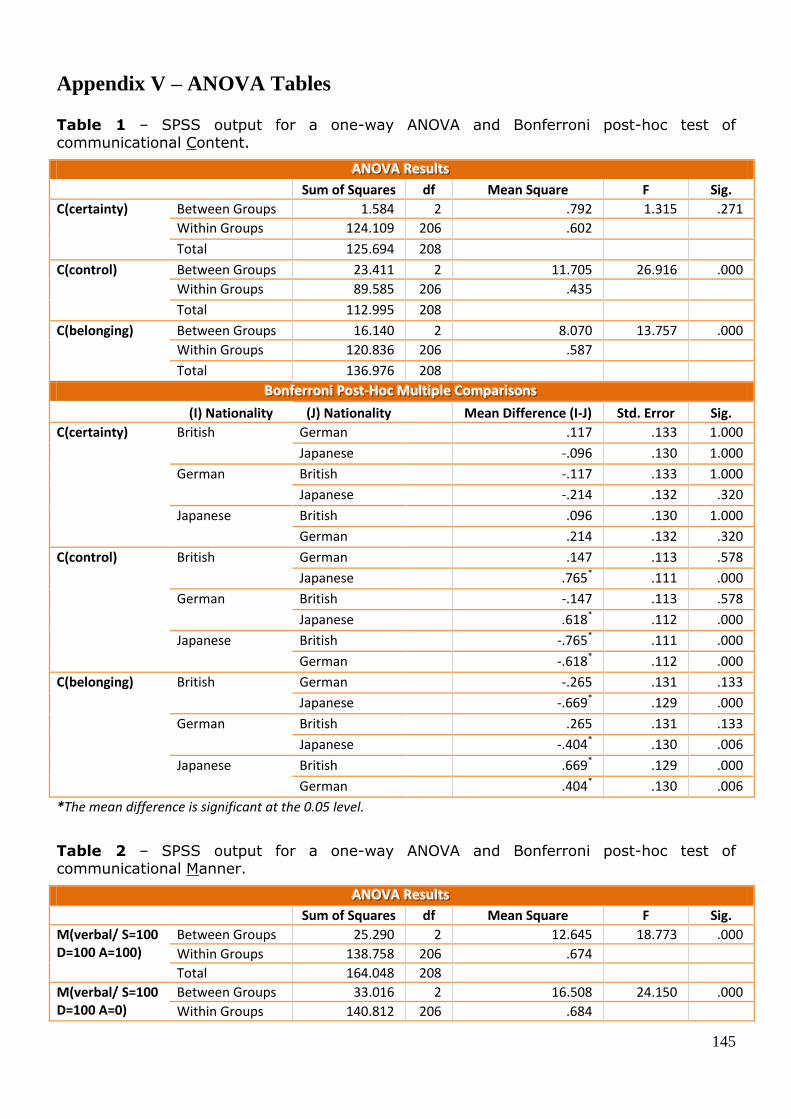
145
Appendix V – ANOVA Tables
Table 1 – SPSS output for a one-way ANOVA and Bonferroni post-hoc test of communicational Content.
AAANNNOOOVVVAAA RRReeesssuuullltttsss Sum of Squares df Mean Square F Sig.
C(certainty) Between Groups 1.584 2 .792 1.315 .271 Within Groups 124.109 206 .602 Total 125.694 208
C(control) Between Groups 23.411 2 11.705 26.916 .000 Within Groups 89.585 206 .435 Total 112.995 208
C(belonging) Between Groups 16.140 2 8.070 13.757 .000 Within Groups 120.836 206 .587 Total 136.976 208
BBBooonnnfffeeerrrrrrooonnniii PPPooosssttt---HHHoooccc MMMuuullltttiiipppllleee CCCooommmpppaaarrriiisssooonnnsss
(I) Nationality (J) Nationality Mean Difference (I-J) Std. Error Sig. C(certainty) British German .117 .133 1.000
Japanese -.096 .130 1.000
German British -.117 .133 1.000
Japanese -.214 .132 .320
Japanese British .096 .130 1.000
German .214 .132 .320
C(control) British German .147 .113 .578
Japanese .765* .111 .000
German British -.147 .113 .578
Japanese .618* .112 .000
Japanese British -.765* .111 .000
German -.618* .112 .000
C(belonging) British German -.265 .131 .133
Japanese -.669* .129 .000
German British .265 .131 .133
Japanese -.404* .130 .006
Japanese British .669* .129 .000
German .404* .130 .006
*The mean difference is significant at the 0.05 level.
Table 2 – SPSS output for a one-way ANOVA and Bonferroni post-hoc test of communicational Manner.
AAANNNOOOVVVAAA RRReeesssuuullltttsss
Sum of Squares df Mean Square F Sig.
M(verbal/ S=100 D=100 A=100)
Between Groups 25.290 2 12.645 18.773 .000
Within Groups 138.758 206 .674
Total 164.048 208
M(verbal/ S=100 D=100 A=0)
Between Groups 33.016 2 16.508 24.150 .000
Within Groups 140.812 206 .684
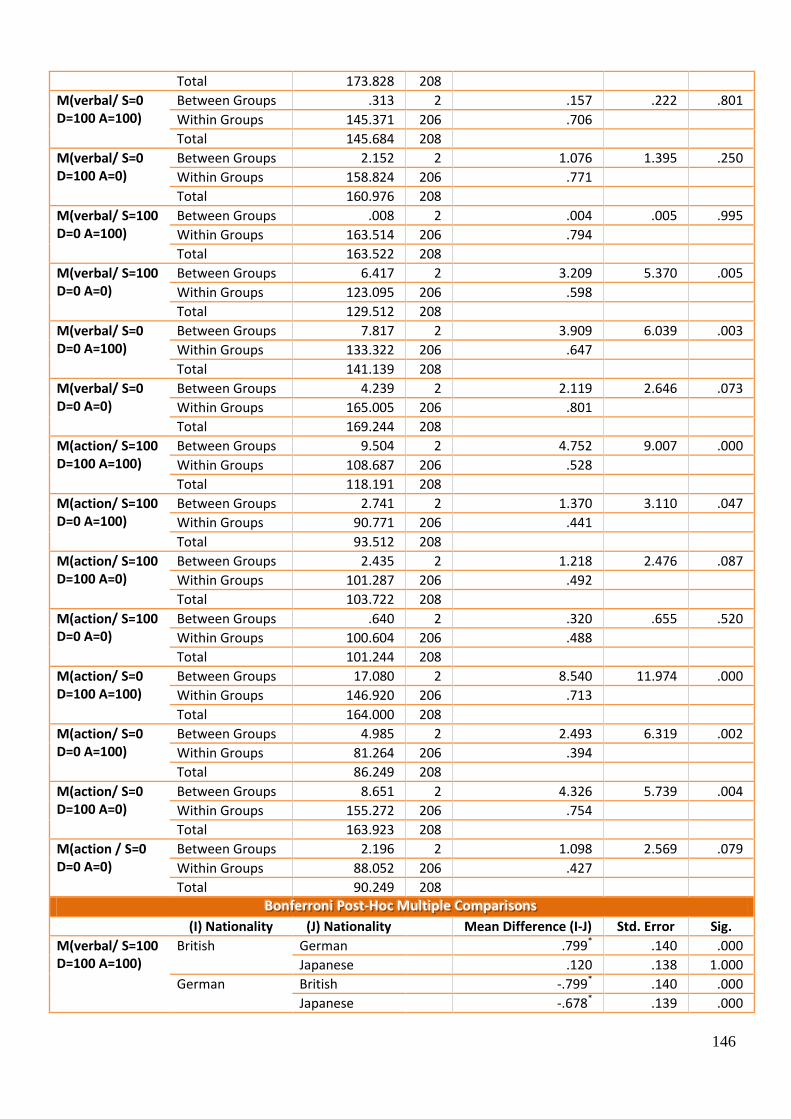
146
Total 173.828 208
M(verbal/ S=0 D=100 A=100)
Between Groups .313 2 .157 .222 .801
Within Groups 145.371 206 .706
Total 145.684 208
M(verbal/ S=0 D=100 A=0)
Between Groups 2.152 2 1.076 1.395 .250
Within Groups 158.824 206 .771
Total 160.976 208
M(verbal/ S=100 D=0 A=100)
Between Groups .008 2 .004 .005 .995
Within Groups 163.514 206 .794
Total 163.522 208
M(verbal/ S=100 D=0 A=0)
Between Groups 6.417 2 3.209 5.370 .005
Within Groups 123.095 206 .598
Total 129.512 208
M(verbal/ S=0 D=0 A=100)
Between Groups 7.817 2 3.909 6.039 .003
Within Groups 133.322 206 .647
Total 141.139 208
M(verbal/ S=0 D=0 A=0)
Between Groups 4.239 2 2.119 2.646 .073
Within Groups 165.005 206 .801
Total 169.244 208
M(action/ S=100 D=100 A=100)
Between Groups 9.504 2 4.752 9.007 .000
Within Groups 108.687 206 .528
Total 118.191 208
M(action/ S=100 D=0 A=100)
Between Groups 2.741 2 1.370 3.110 .047
Within Groups 90.771 206 .441
Total 93.512 208
M(action/ S=100 D=100 A=0)
Between Groups 2.435 2 1.218 2.476 .087
Within Groups 101.287 206 .492
Total 103.722 208
M(action/ S=100 D=0 A=0)
Between Groups .640 2 .320 .655 .520
Within Groups 100.604 206 .488
Total 101.244 208
M(action/ S=0 D=100 A=100)
Between Groups 17.080 2 8.540 11.974 .000
Within Groups 146.920 206 .713
Total 164.000 208
M(action/ S=0 D=0 A=100)
Between Groups 4.985 2 2.493 6.319 .002
Within Groups 81.264 206 .394
Total 86.249 208
M(action/ S=0 D=100 A=0)
Between Groups 8.651 2 4.326 5.739 .004
Within Groups 155.272 206 .754
Total 163.923 208
M(action / S=0 D=0 A=0)
Between Groups 2.196 2 1.098 2.569 .079
Within Groups 88.052 206 .427
Total 90.249 208
BBBooonnnfffeeerrrrrrooonnniii PPPooosssttt---HHHoooccc MMMuuullltttiiipppllleee CCCooommmpppaaarrriiisssooonnnsss
(I) Nationality (J) Nationality Mean Difference (I-J) Std. Error Sig.
M(verbal/ S=100 D=100 A=100)
British German .799* .140 .000
Japanese .120 .138 1.000
German British -.799* .140 .000
Japanese -.678* .139 .000
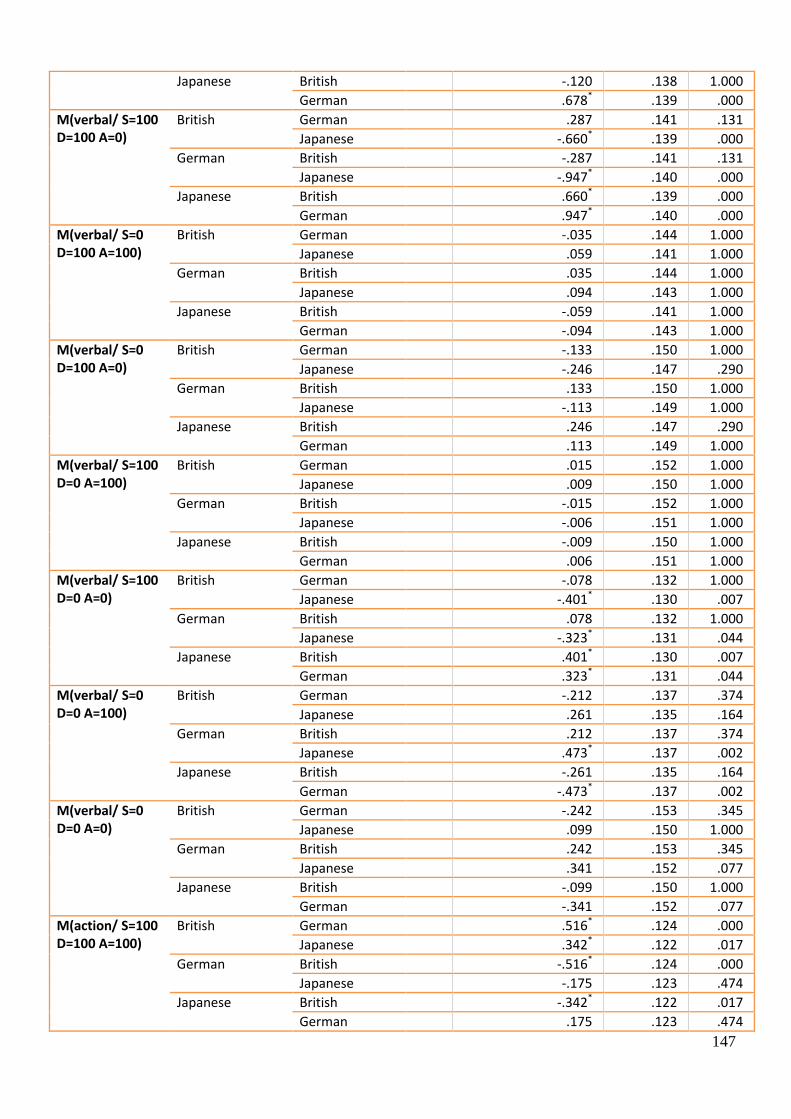
147
Japanese British -.120 .138 1.000
German .678* .139 .000
M(verbal/ S=100 D=100 A=0)
British German .287 .141 .131
Japanese -.660* .139 .000
German British -.287 .141 .131
Japanese -.947* .140 .000
Japanese British .660* .139 .000
German .947* .140 .000
M(verbal/ S=0 D=100 A=100)
British German -.035 .144 1.000
Japanese .059 .141 1.000
German British .035 .144 1.000
Japanese .094 .143 1.000
Japanese British -.059 .141 1.000
German -.094 .143 1.000
M(verbal/ S=0 D=100 A=0)
British German -.133 .150 1.000
Japanese -.246 .147 .290
German British .133 .150 1.000
Japanese -.113 .149 1.000
Japanese British .246 .147 .290
German .113 .149 1.000
M(verbal/ S=100 D=0 A=100)
British German .015 .152 1.000
Japanese .009 .150 1.000
German British -.015 .152 1.000
Japanese -.006 .151 1.000
Japanese British -.009 .150 1.000
German .006 .151 1.000
M(verbal/ S=100 D=0 A=0)
British German -.078 .132 1.000
Japanese -.401* .130 .007
German British .078 .132 1.000
Japanese -.323* .131 .044
Japanese British .401* .130 .007
German .323* .131 .044
M(verbal/ S=0 D=0 A=100)
British German -.212 .137 .374
Japanese .261 .135 .164
German British .212 .137 .374
Japanese .473* .137 .002
Japanese British -.261 .135 .164
German -.473* .137 .002
M(verbal/ S=0 D=0 A=0)
British German -.242 .153 .345
Japanese .099 .150 1.000
German British .242 .153 .345
Japanese .341 .152 .077
Japanese British -.099 .150 1.000
German -.341 .152 .077
M(action/ S=100 D=100 A=100)
British German .516* .124 .000
Japanese .342* .122 .017
German British -.516* .124 .000
Japanese -.175 .123 .474
Japanese British -.342* .122 .017
German .175 .123 .474
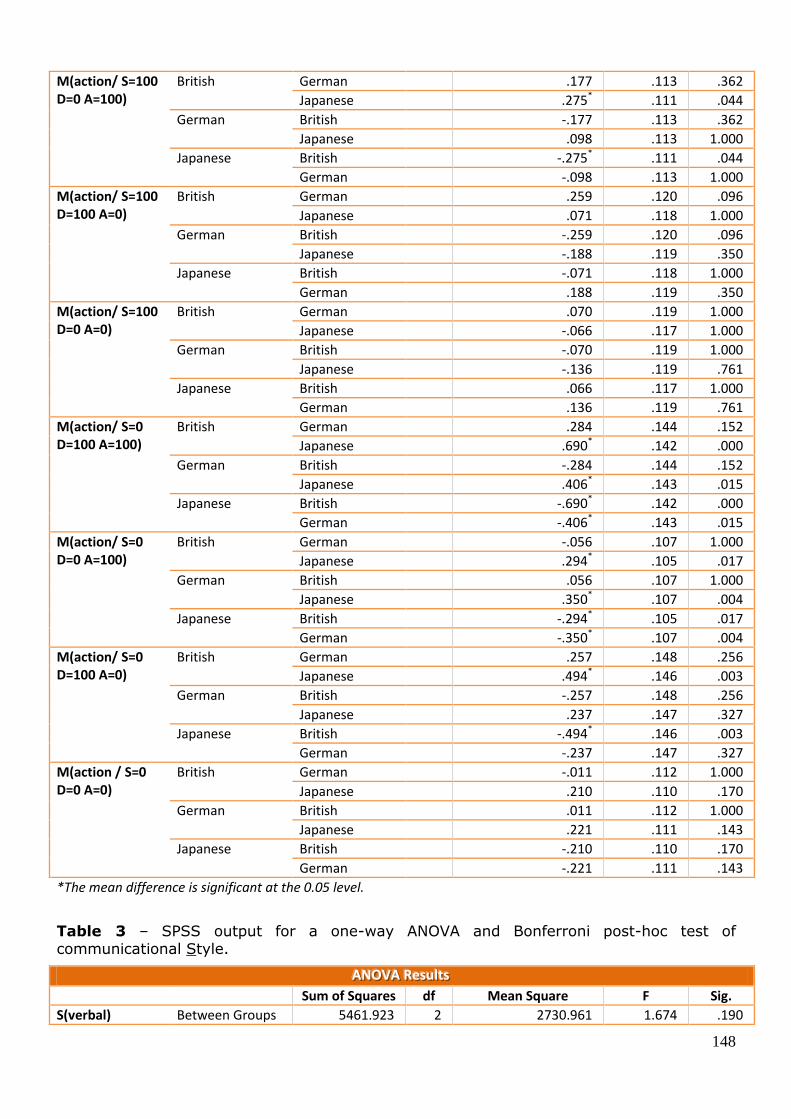
148
M(action/ S=100 D=0 A=100)
British German .177 .113 .362
Japanese .275* .111 .044
German British -.177 .113 .362
Japanese .098 .113 1.000
Japanese British -.275* .111 .044
German -.098 .113 1.000
M(action/ S=100 D=100 A=0)
British German .259 .120 .096
Japanese .071 .118 1.000
German British -.259 .120 .096
Japanese -.188 .119 .350
Japanese British -.071 .118 1.000
German .188 .119 .350
M(action/ S=100 D=0 A=0)
British German .070 .119 1.000
Japanese -.066 .117 1.000
German British -.070 .119 1.000
Japanese -.136 .119 .761
Japanese British .066 .117 1.000
German .136 .119 .761
M(action/ S=0 D=100 A=100)
British German .284 .144 .152
Japanese .690* .142 .000
German British -.284 .144 .152
Japanese .406* .143 .015
Japanese British -.690* .142 .000
German -.406* .143 .015
M(action/ S=0 D=0 A=100)
British German -.056 .107 1.000
Japanese .294* .105 .017
German British .056 .107 1.000
Japanese .350* .107 .004
Japanese British -.294* .105 .017
German -.350* .107 .004
M(action/ S=0 D=100 A=0)
British German .257 .148 .256
Japanese .494* .146 .003
German British -.257 .148 .256
Japanese .237 .147 .327
Japanese British -.494* .146 .003
German -.237 .147 .327
M(action / S=0 D=0 A=0)
British German -.011 .112 1.000
Japanese .210 .110 .170
German British .011 .112 1.000
Japanese .221 .111 .143
Japanese British -.210 .110 .170
German -.221 .111 .143
*The mean difference is significant at the 0.05 level.
Table 3 – SPSS output for a one-way ANOVA and Bonferroni post-hoc test of communicational Style.
AAANNNOOOVVVAAA RRReeesssuuullltttsss
Sum of Squares df Mean Square F Sig.
S(verbal) Between Groups 5461.923 2 2730.961 1.674 .190
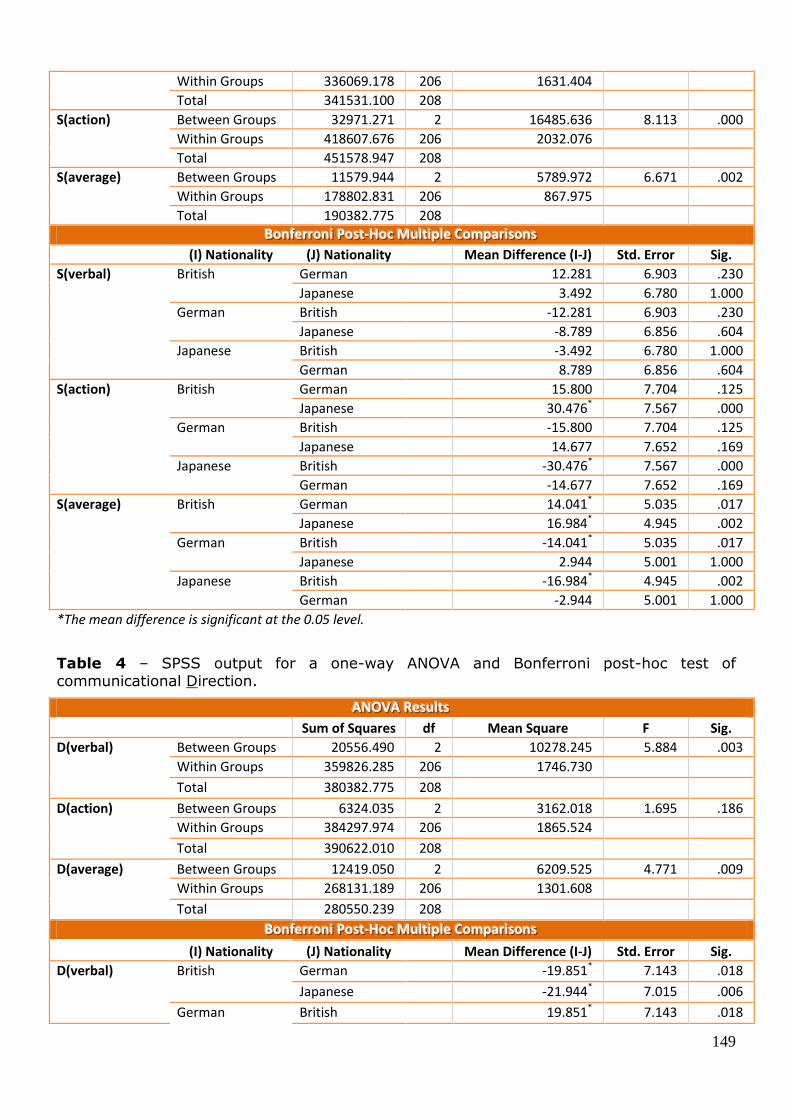
149
Within Groups 336069.178 206 1631.404
Total 341531.100 208
S(action) Between Groups 32971.271 2 16485.636 8.113 .000
Within Groups 418607.676 206 2032.076
Total 451578.947 208
S(average) Between Groups 11579.944 2 5789.972 6.671 .002
Within Groups 178802.831 206 867.975
Total 190382.775 208
BBBooonnnfffeeerrrrrrooonnniii PPPooosssttt---HHHoooccc MMMuuullltttiiipppllleee CCCooommmpppaaarrriiisssooonnnsss
(I) Nationality (J) Nationality Mean Difference (I-J) Std. Error Sig.
S(verbal) British German 12.281 6.903 .230
Japanese 3.492 6.780 1.000
German British -12.281 6.903 .230
Japanese -8.789 6.856 .604
Japanese British -3.492 6.780 1.000
German 8.789 6.856 .604
S(action) British German 15.800 7.704 .125
Japanese 30.476* 7.567 .000
German British -15.800 7.704 .125
Japanese 14.677 7.652 .169
Japanese British -30.476* 7.567 .000
German -14.677 7.652 .169
S(average) British German 14.041* 5.035 .017
Japanese 16.984* 4.945 .002
German British -14.041* 5.035 .017
Japanese 2.944 5.001 1.000
Japanese British -16.984* 4.945 .002
German -2.944 5.001 1.000
*The mean difference is significant at the 0.05 level.
Table 4 – SPSS output for a one-way ANOVA and Bonferroni post-hoc test of communicational Direction.
AAANNNOOOVVVAAA RRReeesssuuullltttsss Sum of Squares df Mean Square F Sig.
D(verbal) Between Groups 20556.490 2 10278.245 5.884 .003 Within Groups 359826.285 206 1746.730 Total 380382.775 208
D(action) Between Groups 6324.035 2 3162.018 1.695 .186 Within Groups 384297.974 206 1865.524 Total 390622.010 208
D(average) Between Groups 12419.050 2 6209.525 4.771 .009 Within Groups 268131.189 206 1301.608 Total 280550.239 208
BBBooonnnfffeeerrrrrrooonnniii PPPooosssttt---HHHoooccc MMMuuullltttiiipppllleee CCCooommmpppaaarrriiisssooonnnsss
(I) Nationality (J) Nationality Mean Difference (I-J) Std. Error Sig. D(verbal) British German -19.851* 7.143 .018
Japanese -21.944* 7.015 .006
German British 19.851* 7.143 .018
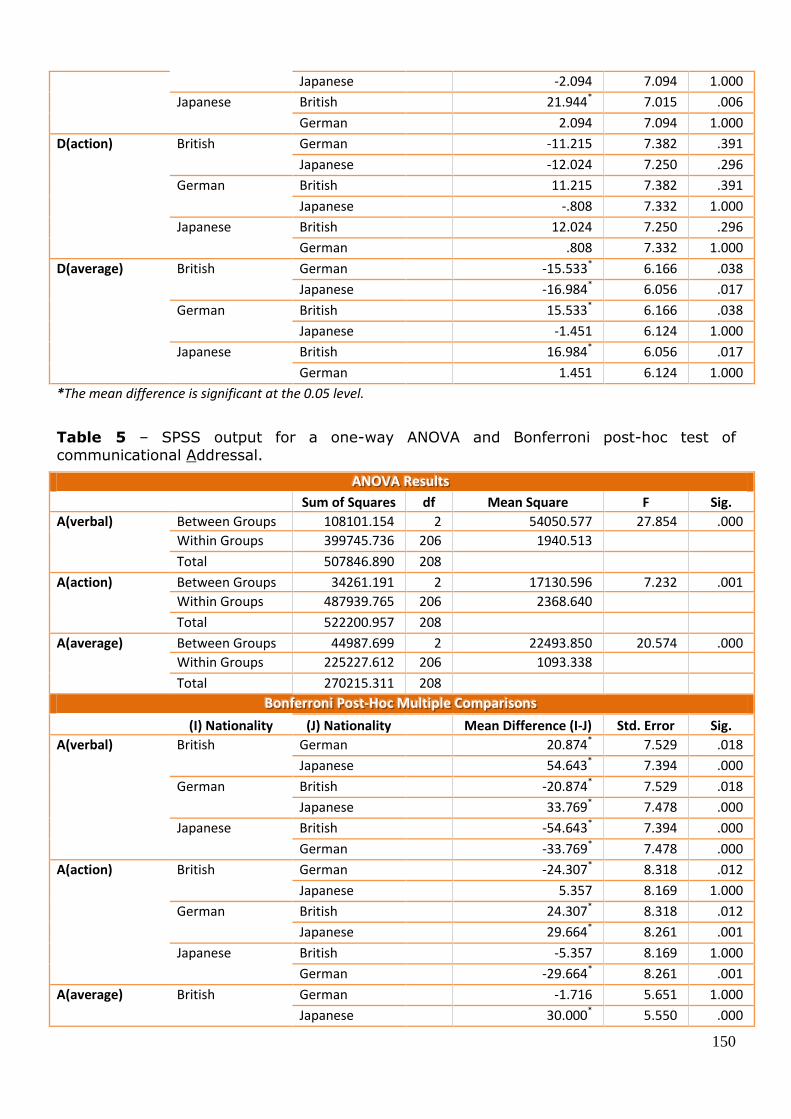
150
Japanese -2.094 7.094 1.000
Japanese British 21.944* 7.015 .006
German 2.094 7.094 1.000
D(action) British German -11.215 7.382 .391
Japanese -12.024 7.250 .296
German British 11.215 7.382 .391
Japanese -.808 7.332 1.000
Japanese British 12.024 7.250 .296
German .808 7.332 1.000
D(average) British German -15.533* 6.166 .038
Japanese -16.984* 6.056 .017
German British 15.533* 6.166 .038
Japanese -1.451 6.124 1.000
Japanese British 16.984* 6.056 .017
German 1.451 6.124 1.000
*The mean difference is significant at the 0.05 level.
Table 5 – SPSS output for a one-way ANOVA and Bonferroni post-hoc test of
communicational Addressal.
AAANNNOOOVVVAAA RRReeesssuuullltttsss Sum of Squares df Mean Square F Sig.
A(verbal) Between Groups 108101.154 2 54050.577 27.854 .000 Within Groups 399745.736 206 1940.513 Total 507846.890 208
A(action) Between Groups 34261.191 2 17130.596 7.232 .001 Within Groups 487939.765 206 2368.640 Total 522200.957 208
A(average) Between Groups 44987.699 2 22493.850 20.574 .000 Within Groups 225227.612 206 1093.338 Total 270215.311 208
BBBooonnnfffeeerrrrrrooonnniii PPPooosssttt---HHHoooccc MMMuuullltttiiipppllleee CCCooommmpppaaarrriiisssooonnnsss
(I) Nationality (J) Nationality Mean Difference (I-J) Std. Error Sig. A(verbal) British German 20.874* 7.529 .018
Japanese 54.643* 7.394 .000
German British -20.874* 7.529 .018
Japanese 33.769* 7.478 .000
Japanese British -54.643* 7.394 .000
German -33.769* 7.478 .000
A(action) British German -24.307* 8.318 .012
Japanese 5.357 8.169 1.000
German British 24.307* 8.318 .012
Japanese 29.664* 8.261 .001
Japanese British -5.357 8.169 1.000
German -29.664* 8.261 .001
A(average) British German -1.716 5.651 1.000
Japanese 30.000* 5.550 .000
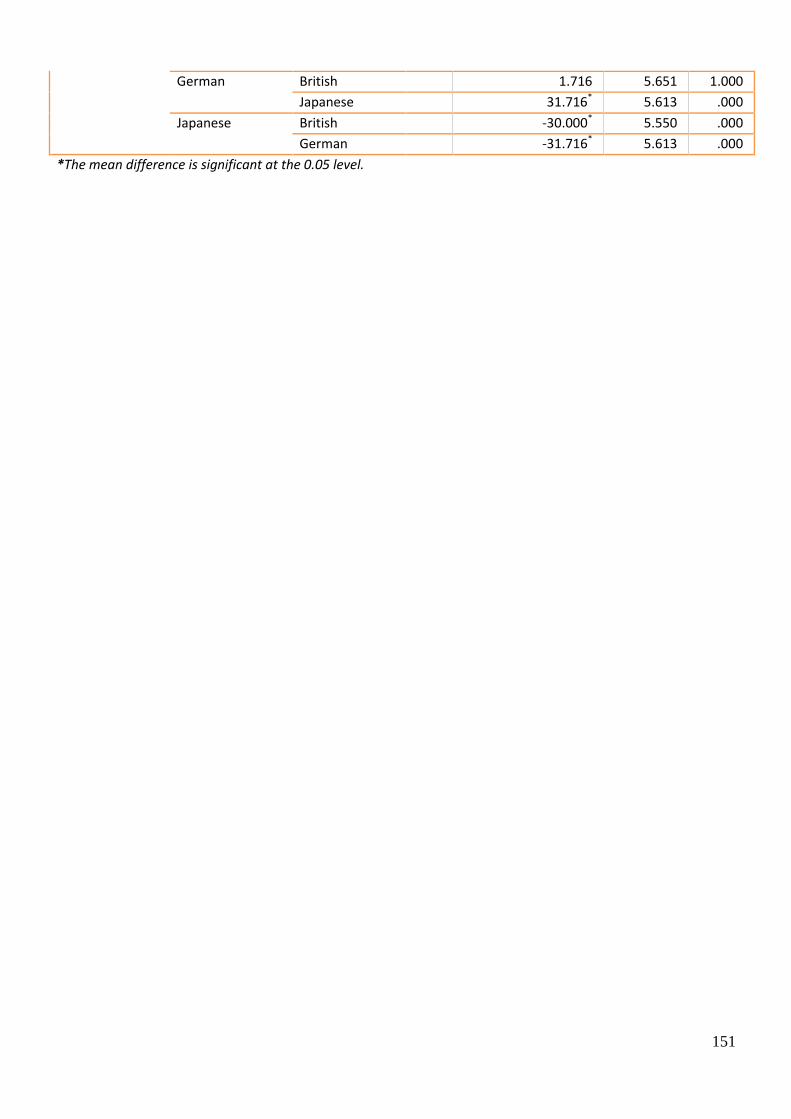
151
German British 1.716 5.651 1.000
Japanese 31.716* 5.613 .000
Japanese British -30.000* 5.550 .000
German -31.716* 5.613 .000
*The mean difference is significant at the 0.05 level.