optical measurements for determination of distances and
TRANSCRIPT
1
Abstract—With the technological advances and the ambition of
exploring new scientific areas, a quick evolution of metrology was
verified. This evolution was important in the creation and
development of new technological concepts. Optical metrology had
a fast development with the creation of laser sources, enhancing
important technological advances like significant increases in the
quality of distance measurements, vibrations or deformations in
equipment or structures.
In this paper, it will be presented the triangulation method
applied to distance measurement, as well as one of the techniques
that work based on it - shadow Moiré. For this technique, this
paper will refer its applications, advantages and disadvantages.
The theoretical concepts behind it will also be presented and
explained.
For the shadow Moiré technique several experiments were
assembled, with the main purpose of validating the distance
measurement device that was created – this device is referred
through this dissertation as profilometer. Another objective is to
study the results obtained by different configurations of the
shadow Moiré technique and to compare them with the results
obtained by the classic configuration.
Index Terms—Triangulation, Shadow Moiré, Profilometer
I. INTRODUCTION
HE development of a profilometer for surface digitalization using
non-invasive measurement techniques is utterly important, since it
is possible to advance in areas such as virtual reality or reverse
engineering [1]. These techniques consist mainly on the emission of a
signal – radio, sonic or ultrasonic – over a surface, recovering the
reflected signal and analyzing it to retrieve the corresponding distance
[1].
The possible applications of the device extend from industrial
control, where it can be used to measure the deformation level of
certain components, for the characterization and digitalization of
surface profiles for quality control and for robotics, where it can be
used for obstacle detection systems of remote controlled vehicles and
smart robots [2].
On the military domain, this industrial control can be used in the
manufacture of military material, which needs to fulfill additional
requirements related to safety and robustness and has a stricter control
applied to it. Another possible application on this matter is to be
applied on the security and surveillance of military facilities.
There are several methods to perform non-invasive distance
measurement. Among them, the method of triangulation was used to
perform the described experiments. There has been a significant
progress of optical measurement systems through recent years, mainly
because of the increased understanding of basic physical principles and
theoretical information about the detection range [1].
II. TRIANGULATION
The triangulation method applied to distance measurement has its
oldest references to the Greek philosopher and mathematician Thales
of Miletus, who around 600 B.C1 used this method to determine the
height of the Giza pyramids and to determine the distance to a ship that
was in the sea [3].
An example of the principle used in this method is represented in
Figure 1:
Figure 1 – Method of Triangulation [4]
Knowing the distance between A and B and the values of angles
α and β, it is possible to use trigonometric relations to determine the
distances between A and C and between B and C, who have currently
an unknown value. The trigonometric relation between these points
and angles are described by Expression (1):
sin 𝛼
𝐵𝐶=
sin 𝛽
𝐴𝐶=
sin(𝜋−𝛼−𝛽)
𝐴𝐵 (1)
Through Expression (1), it is possible to determine the expressions
for distances AC and BC, given in Expressions (2) and (3), respectively
[5]:
𝐴𝐶 =𝐴𝐵 sin 𝛽
sin(𝛼+𝛽) (2)
𝐵𝐶 =𝐴𝐵 sin 𝛼
sin(𝛼+𝛽) (3)
Given these expressions, all of the distances of the triangle ABC can
be determined, including the pretended distance AC.
There are three optical measurement techniques who use the
triangulation method as its basic principle: laser scanning, Shadow
Moiré and fringe projection. Each one of these techniques has its own
advantages, disadvantages and principles of distance measurement.
Nonetheless, the technique used during the experiments was the
Shadow Moiré technique, since it has a simple configuration, is fast
and is cheaper to perform than other techniques. Moreover, the
identified disadvantages of this technique didn’t apply in a laboratorial
environment. This fact along with the identified advantages of the
technique made it the chosen one to use in the proposed experiments.
Optical measurements for determination of
distances and deformations
Tiago Fernando Ribeiro Fernandes Araújo Gouveia, Military Academy / IST
T

2
The Shadow Moiré technique will be described in detail on the next
chapter.
III. SHADOW MOIRÉ TECHNIQUE
The Shadow Moiré technique has its principles based on the
triangulation method, as exposed above. The word “moiré” has its
origins in the French literature and is often used to name a silk fabric
which is composed by two layers. The movement of these layers
creates some patterns on the fabric which are very similar to waves and
named Moiré fringes or Moiré patterns [6]
The functioning principle of the technique is this: a grating
composed by alternating opaque and transparent stripes with the same
width is placed in front of the target object or surface. Posteriorly, a
light source illuminates the surface from a certain direction, which
projects a shadow of the grating fringes over the surface [7]. This
shadow will be observed from another direction, and from the optical
interference caused by the projected shadow and the observed image
on the camera direction will result the so-called Moiré fringes [7]. The
scheme for this technique can be seen in Figure 2, represented below:
Figure 2 – Representation of Shadow Moiré technique [7]
Analyzing the Figure 2, the implementation of this technique can be
well understood. Since the values of distances ℎ and 𝑑𝑓𝑐 are fixed and
known, as well as the period p that represents the distance between two
fringes of the same opacity, the determination of the distance z between
the grating and a point Q of the surface occurs in a simple manner [8].
The value of z is given at any point of the surface by Expression (4)
[8]:
. .
tan tan 2
N p p lz
w
(4)
In Expression (4), N is the number of fringes which are situated
between A and B, and the angles α’ and β’ are the illumination and
visualization angles on the object surface, respectively. These angles
are different from the angles α and β, who represent the illumination
and visualization angles on the grating surface, respectively [8].
Generally, there is a phase shifting technique associated with moiré
techniques. This phase shifting technique consists in the variation of
the distance between the grating and the light source. Since this
distance varies, the phase of the light beam will also vary, according
to the expressions that define propagation of a light beam in space. For
each distance variation, an image must be captured in order to capture
the corresponding phase shift. From the application of this technique
results a better and more precise phase map, since most of the resulting
ambiguities and errors are corrected when compared to a phase map
obtained with only one image.
After obtaining the images with the phase shifts, it is necessary to
obtain the absolute phase map that, for each pixel, will retrieve the
correspondent distance, according to Expression (4). However, the
phase determination involves a series of steps, which will now be
presented. First, it is necessary to consider a sensitivity calibration
algorithm, which will retrieve the sensitivity as a statistical parameter
for validation of the experiment results. This algorithm was proposed
by Du, Wang, Zhao and Jia and is described in the reference [9].
After the application of the sensitivity calibration algorithm, it is
necessary to transform the pixel intensities in the corresponding
phases. The PCA algorithm is responsible for this part of the process,
and it is described in the reference [10].
However, the phase values retrieved by the PCA algorithm are
wrapped in the interval ]-π,π], as it can be seen in reference [10].
Therefore, the obtained phase map is not absolute, since there will be
multiple distance values corresponding to the same phase values,
which invalidates the use of Expression (4) [11]. Due to this question,
it is necessary to retrieve the absolute phase map with the absolute
phase values for each pixel. This way the phase map can be represented
correctly, and the Expression (4) can now be applied. The operation
that retrieves the absolute phase map from the wrapped phase map is
called “phase unwrapping”. The algorithm used for phase unwrapping
was the Goldstein algorithm, and it is described on references [12] and
[13].
Once the absolute phase map is obtained, the distance map can now
be determined. The transformation of the phase map into distance is
done according to the sensitivity calibration algorithm described on
reference [9].
IV. SHADOW MOIRÉ EXPERIMENT
In order to validate the proper use of the Shadow Moiré technique,
an experiment was conducted. For the computerized component of the
experiment, some scripts were created in the software Matlab 2014b.
Note that the script used for the PCA algorithm was obtained in
[10]. The script used for the Goldstein algorithm was obtained through
reference [14].
The experiment was conducted as represented in Figure 3:
Figure 3 – Experiment schematic representation
The material used in the experiment was the following: (1) camera
Canon 700D [15] (2) headphones JBL T450BT (3) 1 mm period
grating (4) Newport M-460-X Series grating support (5) Epson EB-S03
LCD light projector [16]. The experiment was assembled as
represented in Figure 4:

3
Figure 4 – Assembled Shadow Moiré experiment
The distances used in the experiment were the following: camera-
object distance (𝑑𝑐−𝑜) of 55 cm, source-camera distance (𝑑𝑓𝑐) of 55
cm and grating-object distance (𝑑𝑔−𝑜) of 3 cm.
During the experiment, a set of 11 images were obtained. Each one
of these images were captured with a uniform shift of Δh=0.5 mm
compared to the previous image. This set is represented in Figure 5:
Figure 5 – Image set of Shadow Moiré experiment
Posteriorly, some image processing techniques were applied to the
set of Figure 5. These techniques combined contrast enhancement
techniques and noise suppression techniques through image filtering
with an area of 30x30 pixels. After the application of these image
processing techniques, a new set of images was obtained. After
obtaining this new set, the algorithm expressed in [9] was followed.
Considering it, the set of Figure 5 was divided in two different subsets:
the first subset contained the images from (a) to (j); the second subset
contained the images from (b) to (k). From these subsets resulted the
corresponding non-absolute phase maps after the application of PCA
algorithm, represented in Figure 6:
Figure 6 – Non-absolute phase maps obtained from Figure 5: (a) first
subset; (b) second subset;
After the application of Goldstein algorithm to the previous phase
maps, the absolute tridimensional phase map was obtained, which is
represented in Figure 7:
Figure 7 – Tridimensional absolute phase maps obtained with Goldstein
algorithm: (a) first subset; (b) second subset;
Considering the sensitivity calibration algorithm expressed in [9],
the distance map was obtained. This map is represented in Figure 8:
Figure 8 – Distance map obtained from the absolute phase maps
From the analysis of Figure 8, the results obtained show the
reliability of the experiment. The distance difference between the
highest and lowest plane is of 1.75 mm. This value is concordant with
the measured value before the experiment, which was of 2±0.5 mm.
Furthermore, the visual shape of the object that was obtained is
identical to the original shape of the tested object.
To validate mathematically the obtained results, some statistical
parameters were determined – sensitivity, standard deviation and
standard error. For the sensitivity, the sensitivity calibration algorithm
described in [9] was again considered. Using the phase maps of Figure
7, the obtained sensitivity map is represented in Figure 9:
Figure 9 – Obtained sensitivity of measurement
The sensitivity results exposed in Figure 9 show that these are
uniform for the entire image. This feature is important, since it
influences the obtained distance map in a direct manner. Additionally,
it can also be noted that the obtained sensitivity has values of 0.28 mm.
This result validates the experiment for the measurement of small
distances, since it shows that is capable of detecting very small changes
in the surface topography.
Posteriorly, the values of standard deviation and standard error were
determined. To obtain them, five sets of images identical to the set of

4
Figure 5 were captured. Then, the standard deviation was determined
for each pixel, and is shown in Figure 10:
Figure 10 – Standard deviation obtained from the experiment
The maximum standard deviation obtained is from 0.015 mm, to
which corresponds a maximum standard error of 0.0067 mm.
Therefore, the obtained results in the experiment were determined with
a precision of 0.0067 mm in the worst case. This precision value
validates these results, since it confirms the possibility of measuring
very small distances and obtaining an identical surface compared with
the original surface.
V. ADDITIONAL EXPERIMENTS WITH SHADOW MOIRÉ
After validation of the previous results, obtained with the Shadow
Moiré technique, other variations of this technique were tested. Those
variations occurred not only in the physical configurations of the
Shadow Moiré technique, but also at the several stages of the distance
measurement process – like the image processing stage. The main
objective of this variations was to understand the influence that each
of the components of the experiment has in the obtained results.
A. Shadow Moiré with two projectors
This variation of the classic technique consists on the use of two
projectors illuminating the target surface instead of one as in the classic
technique. The objective is to understand the effects of light intensity
on the results. The experiment was assembled following the scheme
represented in Figure 11.
Picture 11 – Scheme representation of Shadow Moiré technique with two
projectors
Since the objective is to evaluate the effect of light intensity, all the
other parameters have to remain the same. Therefore, the materials and
values of the distances and angles remain the same as the ones stated
in Chapter IV.
The experiment was assembled as represented in Figure 12:
Figure 12 – Assembled experiment of Shadow Moiré technique with two
projectors
During the experiment, a set of 11 images were obtained. Each one
of these images were captured with a uniform shift of Δh=0.5 mm
compared to the previous image. This set is represented in Figure 13:
Figure 13 – Image set of Shadow Moiré experiment with two projectors
After this set was obtained, another set resulted from image
processing techniques, which were the same as the ones applied in
Chapter IV. After obtaining this new set of images, the algorithm
expressed in [9] was followed. Considering it, the set of Figure 13 was
divided in two different subsets: the first subset contained the images
from (a) to (j); the second subset contained the images from (b) to (k).
From these subsets resulted the corresponding non-absolute phase
maps after the application of PCA algorithm, represented in Figure 14:
Figure 14 – Non-absolute phase maps obtained from Figure 13: (a) first
subset; (b) second subset;
After the application of Goldstein algorithm to the previous phase
maps, the absolute tridimensional phase map was obtained, and is
represented in Figure 15:

5
Figure 15 – Tridimensional absolute phase maps obtained with Goldstein
algorithm: (a) first subset; (b) second subset;
Considering the sensitivity calibration algorithm expressed in [9],
the distance map was obtained. This map is represented in Figure 16:
Figure 16 – Distance map obtained from the absolute phase maps (larger
scale)
The results obtained by this variation of the classic technique were
very similar to the ones obtained by its classic counterpart.
The resulting error from this technique compared to the classic
version is exposed in Figure 17:
Figure 17 – Error between the results obtained with classic Shadow Moiré and
its two projectors variant
From the analysis of Figure 17, it is visible that the maximum error
obtained between the two variations of the Shadow Moiré technique is
of 0.085 mm. Therefore, it can be concluded that the Shadow Moiré
technique with two projectors is also a valid technique for distance
measurement.
B. Shadow Moiré with Double Parallel Grating
This variation of the classic technique consists on the use of two
gratings with parallel fringes between them. The objective is to
understand the effect created by the interaction between the two
gratings on the object, and the correspondent phase shift. Another
objective was to check if a reliable distance map could be obtained
without noise interference. The experiment was assembled following
the scheme represented in Figure 18.
Figure 18 – Scheme representation of Shadow Moiré technique with two
projectors
Since the objective is to evaluate the effect of the double grating, all
the other parameters have to remain the same. Therefore, the materials
and values of the distances and angles remain the same as the ones
stated in Chapter IV. Also, since the experiment consists on the
placement of two parallel gratings between the same glasses, the
assemble is the same as seen in Figure 4.
During the experiment, a set of 11 images were obtained. Each one
of these images were captured with a uniform shift of Δh=0.5 mm
compared to the previous image. This set is represented in Figure 19:
Figure 19 – Image set of Shadow Moiré experiment with double parallel
grating
After this set was obtained, another set resulted from image
processing techniques, which were the same as the ones applied in
Chapter IV. After obtaining this new set of images, the algorithm
expressed in [9] was again followed. Considering it, the set of Figure
19 was divided in two different subsets: the first subset contained the
images from (a) to (j); the second subset contained the images from (b)
to (k). From these subsets resulted the corresponding non-absolute
phase maps after the application of PCA algorithm, represented in
Figure 20:
Figure 20 – Non-absolute phase maps obtained from Figure 19: (a) first
subset; (b) second subset;
After the application of Goldstein algorithm to the previous phase
maps, the absolute tridimensional phase map was obtained, and is

6
represented in Figure 21:
Figure 21 – Tridimensional absolute phase maps obtained with Goldstein
algorithm: (a) first subset; (b) second subset;
Considering the sensitivity calibration algorithm expressed in [9],
the distance map was obtained. This map is represented in Figure 22:
Figure 22 – Distance map obtained from the absolute phase maps
The results obtained by this variation of the classic technique were
very different to the ones obtained by its classic counterpart. This is
due to the noise caused by the double grid, whose interference caused
The resulting error from this technique compared to the classic
version is exposed in Figure 23:
Figure 23 – Error between the results obtained with classic Shadow Moiré and
its double parallel grating variation
From the analysis of Figure 23, it is visible that the maximum error
obtained between the two variations of the Shadow Moiré technique is
of 1.5 mm. This result is very inaccurate, since it is very different from
the original shape of the object. Therefore, it can be concluded that the
Shadow Moiré technique with double parallel grating is not a valid
technique for distance measurement.
C. Shadow Moiré with Double Perpendicular Grating
This variation of the classic technique consists on the use of two
gratings with the fringes placed perpendicularly between gratings. Due
to the similarities with the experiment conducted in subchapter B, the
physical parameters and assembly of the present experiment are
identical to that experiment. Therefore, the scheme of the experiment
is represented in Figure 18 as well.
Since the objective is to evaluate the effect of light intensity, all the
other parameters have to remain the same. Therefore, the materials and
values of the distances and angles remain the same as the ones stated
in Chapter IV. Also, since the experiment consists on the placement of
two perpendicular gratings between the same glasses, the assemble is
the same as seen in Figure 4.
During the experiment, a set of 11 images were obtained. Each one
of these images were captured with a uniform shift of Δh=0.5 mm
compared to the previous image. This set is represented in Figure 24:
Figure 24 – Image set of Shadow Moiré experiment with double
perpendicular grating
After this set was obtained, another set resulted from image
processing techniques, which were the same as the ones applied in
Chapter IV. After obtaining this new set of images, the algorithm
expressed in [9] was again followed. Considering it, the set of Figure
24 was divided in two different subsets: the first subset contained the
images from (a) to (j); the second subset contained the images from (b)
to (k). From these subsets resulted the corresponding non-absolute
phase maps after the application of PCA algorithm, represented in
Figure 25:
Figure 25 – Non-absolute phase maps obtained from Figure 24: (a) first
subset; (b) second subset;
After the application of Goldstein algorithm to the previous phase
maps, the absolute tridimensional phase map was obtained, and is
represented in Figure 26:
Figure 26 – Tridimensional absolute phase maps obtained with Goldstein
algorithm: (a) first subset; (b) second subset;
Considering the sensitivity calibration algorithm expressed in [9],
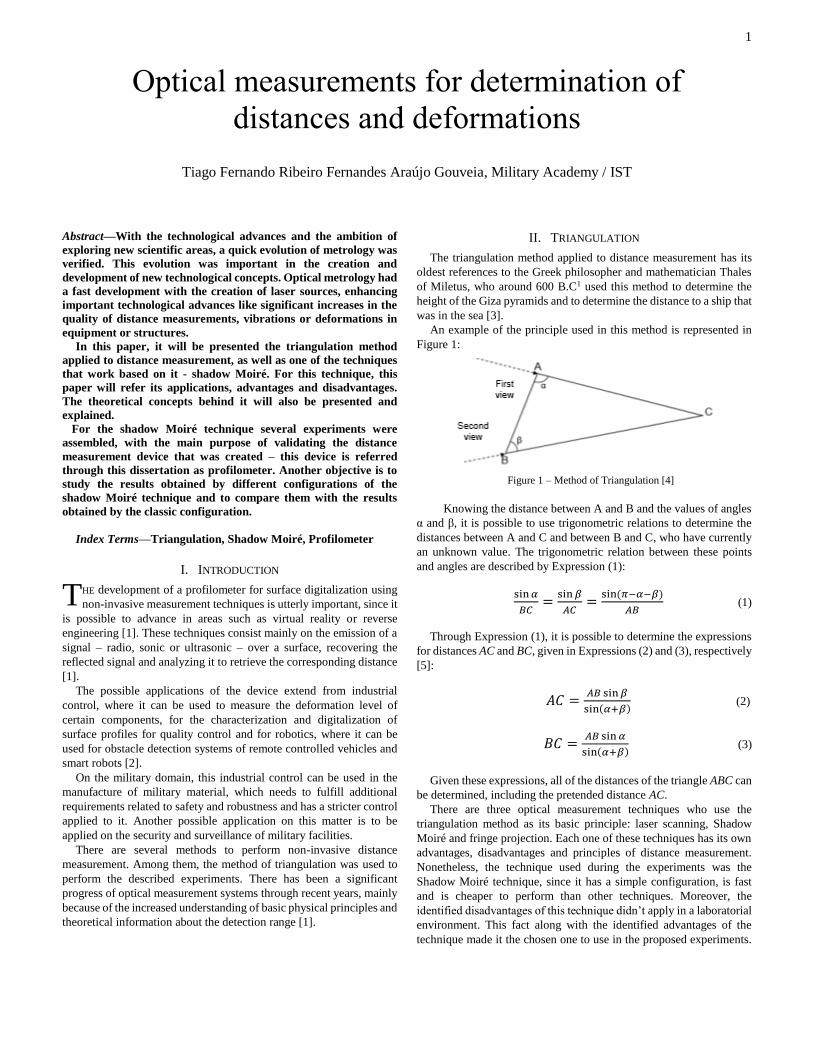
the distance map was obtained. This map is represented in Figure 27:
7
Figure 27 – Distance map obtained from the absolute phase maps
The resulting error from this technique compared to the classic
version is exposed in Figure 28:
Figure 28 – Error between the results obtained with classic Shadow Moiré and
its double parallel grating variation
From the analysis of Figure 28, it is visible that the maximum error
obtained between the two variations of the Shadow Moiré technique is
of 1.5 mm. Although the result obtained by this variation allows to see
some features of the object, the result is not accurate when comparing
with the classic version of Shadow Moiré technique. Therefore, it can
be concluded that the Shadow Moiré technique with double
perpendicular grating is not a valid technique for distance
measurement.
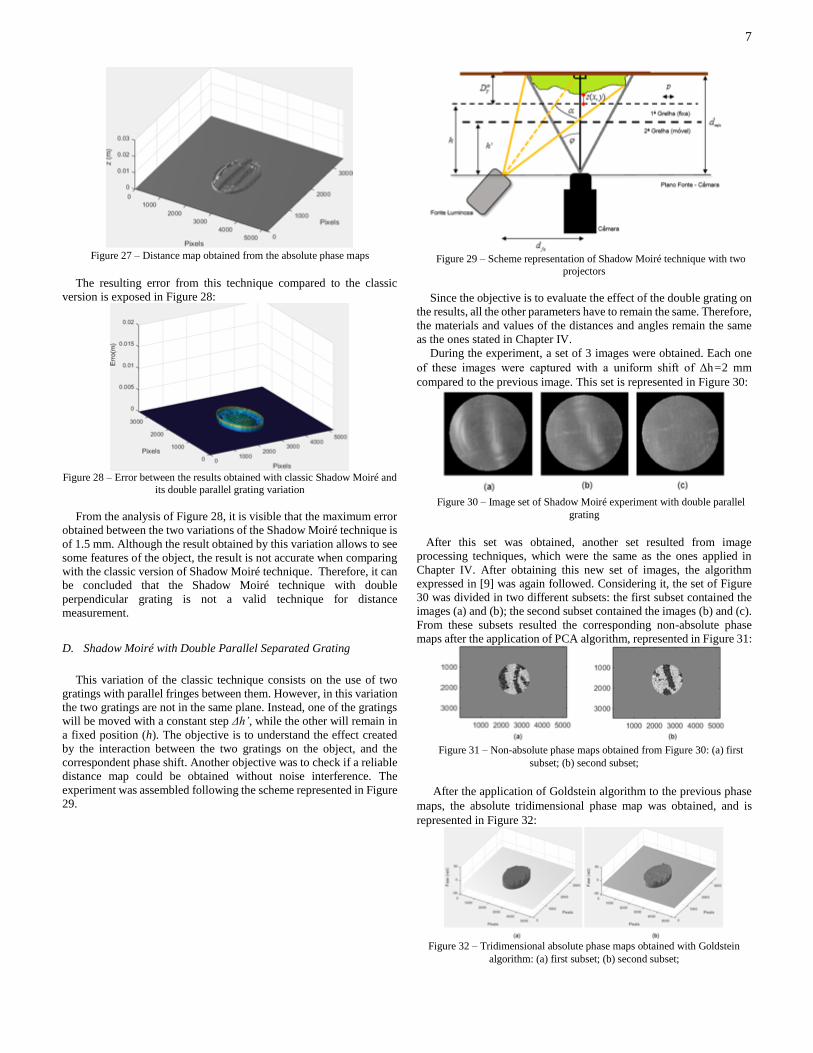
D. Shadow Moiré with Double Parallel Separated Grating
This variation of the classic technique consists on the use of two
gratings with parallel fringes between them. However, in this variation
the two gratings are not in the same plane. Instead, one of the gratings
will be moved with a constant step Δh’, while the other will remain in
a fixed position (h). The objective is to understand the effect created
by the interaction between the two gratings on the object, and the
correspondent phase shift. Another objective was to check if a reliable
distance map could be obtained without noise interference. The
experiment was assembled following the scheme represented in Figure
29.
Figure 29 – Scheme representation of Shadow Moiré technique with two
projectors
Since the objective is to evaluate the effect of the double grating on
the results, all the other parameters have to remain the same. Therefore,
the materials and values of the distances and angles remain the same
as the ones stated in Chapter IV.
During the experiment, a set of 3 images were obtained. Each one
of these images were captured with a uniform shift of Δh=2 mm
compared to the previous image. This set is represented in Figure 30:
Figure 30 – Image set of Shadow Moiré experiment with double parallel
grating
After this set was obtained, another set resulted from image
processing techniques, which were the same as the ones applied in
Chapter IV. After obtaining this new set of images, the algorithm
expressed in [9] was again followed. Considering it, the set of Figure
30 was divided in two different subsets: the first subset contained the
images (a) and (b); the second subset contained the images (b) and (c).
From these subsets resulted the corresponding non-absolute phase
maps after the application of PCA algorithm, represented in Figure 31:
Figure 31 – Non-absolute phase maps obtained from Figure 30: (a) first
subset; (b) second subset;
After the application of Goldstein algorithm to the previous phase
maps, the absolute tridimensional phase map was obtained, and is
represented in Figure 32:
Figure 32 – Tridimensional absolute phase maps obtained with Goldstein
algorithm: (a) first subset; (b) second subset;

8
Considering the sensitivity calibration algorithm expressed in [9],
the distance map was obtained. This map is represented in Figure 33:
Figure 33 – Distance map obtained from the absolute phase maps
The resulting error from this technique compared to the classic
version is exposed in Figure 34:
Figure 34 – Error between the results obtained with classic Shadow Moiré and
its double parallel grating variation
From the analysis of Figure 34, it is visible that the maximum error
obtained between the two variations of the Shadow Moiré technique is
of 6 mm. This result is the most inaccurate so far, since it is very
different from the original shape of the object. This is due to several
factors: first, the double grating that introduces much noise and
interference; second, the successive layers of glass contribute for the
reduced visibility of the object; third, the reduced number of images
from the set contributes for the bad quality of the distance map.
Therefore, it can be concluded that the Shadow Moiré technique with
double parallel separated grating is not a valid technique for distance
measurement.
E. Shadow Moiré with Double Perpendicular Separated Grating
This variation of the classic technique consists on the use of two
gratings with perpendicular fringes between them. However, in this
variation the two gratings are not in the same plane. Instead, one of the
gratings will be moved with a constant step Δh’, while the other will
remain in a fixed position (h). This experiment is identical to the one
described in subchapter D. The objective is to understand the effect
created by the interaction between the two gratings on the object, and
the correspondent phase shift. Another objective was to check if a
reliable distance map could be obtained without noise interference.
Since the scheme of this experiment is identical to the one described
previously, the same is represented in Figure 29.
Since the objective is to evaluate the effect of the double grating on
the results, all the other parameters have to remain the same. Therefore,
the materials and values of the distances and angles remain the same
as the ones stated in Chapter IV.
During the experiment, a set of 3 images were obtained. Each one
of these images were captured with a uniform shift of Δh=2 mm
compared to the previous image. This set is represented in Figure 35:
Figure 35 – Image set of Shadow Moiré experiment with double parallel
grating
After this set was obtained, another set resulted from image
processing techniques, which were the same as the ones applied in
Chapter IV. After obtaining this new set of images, the algorithm
expressed in [9] was again followed. Considering it, the set of Figure
35 was divided in two different subsets: the first subset contained the
images (a) and (b); the second subset contained the images (b) and (c).
From these subsets resulted the corresponding non-absolute phase
maps after the application of PCA algorithm, represented in Figure 36:
Figure 36 – Non-absolute phase maps obtained from Figure 35: (a) first
subset; (b) second subset;
After the application of Goldstein algorithm to the previous phase
maps, the absolute tridimensional phase map was obtained, and is
represented in Figure 37:
Figure 37 – Tridimensional absolute phase maps obtained with Goldstein
algorithm: (a) first subset; (b) second subset;
Considering the sensitivity calibration algorithm expressed in [9],
the distance map was obtained. This map is represented in Figure 38:
Figure 38 – Distance map obtained from the absolute phase maps
The resulting error from this technique compared to the classic
version is exposed in Figure 39:

9
Figure 39 – Error between the results obtained with classic Shadow Moiré and
its double parallel grating variation
From the analysis of Figure 39, it is visible that the maximum error
obtained between the two variations of the Shadow Moiré technique is
of 6 mm. This result is the most inaccurate so far, since it is very
different from the original shape of the object. This is due to several
factors: first, the double grating that introduces much noise and
interference; second, the successive layers of glass contribute for the
reduced visibility of the object; third, the reduced number of images
from the set contributes for the bad quality of the distance map.
Therefore, it can be concluded that the Shadow Moiré technique with
double parallel separated grating is not a valid technique for distance
measurement.
F. Effect of Image Processing Techniques on the Results
This experiment consists on changing the parameters used in image
processing techniques that were applied to the image set. The objective
is to observe and understand the effect that the image processing
techniques have in the obtained results with Shadow Moiré technique.
To evaluate this, two experiments were assembled, each one of them
related to one of the image processing techniques used during the
experiment of Chapter IV – contrast enhancement and noise filtering.
The results of the experiments are expressed throughout this
subchapter.
To evaluate the effect caused by the contrast enhancement
technique, the experiment assembled used the image set of Figure 5.
From there, two different distance maps were obtained: to obtain the
first map, the contrast enhancement technique was used, but the second
map did not use this technique. Apart this single difference, all the
remaining procedures used to obtain the distance map are identical to
the ones used in Chapter IV. The results are expressed in Figure 40:
Figure 40 – Effect of contrast enhancement technique: (a) distance map with
contrast enhancement; (b) distance map without contrast enhancement
Through Figure 40, it can be seen that the results obtained are not
very different from each other in this case. However, it was observed
that the contrast enhancement technique allowed the distance map to
have a smaller difference between consecutive phase values, which
results in a brighter and smoother profile distance map on the first case.
For the noise filtering technique, the assembled experiment
obtained four different distance maps. Each of these maps used a
different area for noise filtering: no filter, 30x30, 60x60 and 90x90
pixels. All the remaining processes were followed identically to
Chapter IV. The results are expressed in Figures 41 and 42:
Figure 41 – Distance maps obtained with different filtering areas: (a) no filter;
(b) 30x30 pixel filter

10
Figure 42 – Distance maps obtained with different filtering areas: (a) 60x60
pixel filter; (b) 90x90 pixel filter
Through Figures 41 and 42, it is possible to observe the effect of the
filtering area in the results. As expected, the non-application of noise
filtering techniques originates errors in the determination of the
distance map. This effect is visible in Figure 41(a), where the noise
existence prevented the correct determination of the distance map.
Atop of this, the steps caused by the fringe interference are very clear
in the obtained map of Figure 41(a). These steps are created by the
difference between the pixels associated to the grating and the object.
The progressive loss of spatial resolution is very clear with the increase
of the filtering area. However, the decrease of fringe effect in the
distance map is also visible. It is also comprehensible that, when the
filtering area increases, the phase values tend to lose the differences
between them. In an extreme situation, the phase values might even be
identical throughout the whole image, thus the whole spatial resolution
being lost. Therefore, the filtering area shall always be defined with a
commitment between noise filtering and spatial resolution.
VI. CONCLUSIONS
The possible applications for optical measurement devices comprise
several areas. From industrial control applications, where they can be
used for detection of irregularities or deformations in parts, to military
applications, where they can be used to control the remote vehicles
used for vigilance and security of military units.
Throughout this paper the method of triangulation was described,
as well as the distance measurement technique that works based on it
- the Shadow Moiré technique.
The Shadow Moiré technique is known as a cheap technique,
because it has a simple configuration. It is a fast measurement
technique, but it needs a previous preparation of the experiment, since
the grating must be placed first in front of the target.
To validate the proposed configuration, an experiment was
assembled. The experiment employed the Shadow Moiré technique to
measure a target object. The results show that the technique is precise
and can determine the profile of objects correctly.
Furthermore, some experiments to evaluate the effects of the several
components of Shadow Moiré technique were conducted. These
experiments reveal that only one of the tested variations acquired
results as precise as its classic counterpart.
In short, all the objectives were successfully completed.
REFERENCES
[1] M.-C. Amann, T. Bosch, M. Lescure, R. Myllyla, and M. Rioux, “Laser
ranging: a critical review of usual techniques for distance measurement,”
Opt. Eng., vol. 40, no. 1, pp. 10–19, 2001. [2] F. Chen, G. Brown, and M. Song, “Overview of three-dimensional shape
measurement using optical methods,” Optical Eng., vol. 39, no. 1, pp. 10–
22, 2000 [3] G. Berkovic & E. Shafir, “Optical methods for distance and displacement
measurements,” Advances in Optics and Photonics 4, pp. 441-471, 11
Sep-2012. [4] João Fonseca, Sistemas de medida de distância utilizando laseres e as suas
aplicações, Masters Dissertation, Instituto Superior Técnico, 2016.
[5] R. Farcy, Applications des lasers - Principle optiques avec problèmes
commentés, Paris: Masson, 1992.
[6] R.A.B. Jr, "Moiré Tutorial", [Online]. Disponível:
http://www.deg.ufla.br/site/_adm/upload/file/Roberto/TutorialMOIRE.pdf. [Acedido em 04 Novembro 2016].
[7] A. J. Avilaq and A. H. Rezaie, “3D Face reconstruction using modified shadow moiré,” 2013 21st Iran. Conf. Electr. Eng. ICEE 2013, pp. 3–7,
2013.
[8] K. Creath, J. Schmit, and J. C. Wyant, Optical Metrology of Diffuse Surfaces. 2006.
[9] H. Du, J. Wang, H. Zhao et al., “Calibration of the high sensitivity shadow
moiré system using random phase-shifting technique”, Optics and Lasers in Engineering, vol. 63, pp. 70-75, 2014.
[10] J. Vargas, J. Quiroga e T.Belenguer, “Phase-shifting interferometry based
on principal component analysis”, Optics Letters, vol. 36, no. 8, p. 1326, 2011.
[11] Gonçalo Matias, Radar Interferometry: 2D Phase Unwrapping via Graph
Cuts, Masters Dissertation, Instituto Superior Técnico, 2006. [12] R. Goldstein, H. Zebker, C. Werner, “Satellite radar interferometry: Two-
dimensional phase unwrapping”, Radio Science, vol. 23, no. 4, pp. 713-
720, 1988. [13] D. Ghiglia, M. Pritt, Two-Dimensional Phase Unwrapping: Theory,
Algorithms and Software, New York: Wiley, 1998.
[14] Bruce Spottiswoode, Javier Vargas, “Goldstein 2D Phase Unwrapping Algorithm”, [Online]. Available in
http://www.mathworks.com/matlabcentral/fileexchange/22504 [Acessed
in March 11, 2017]. [15] Epson, “EB-S03 LCD Light Projector” [Online]. Available in
https://www.epson.pt/products/projectors/mobile/eb-s03#specifications
[Acessed in September 09, 2017]. [16] Canon, “Canon EOS 700D – Technical Characteristics” [Online].
https://www.canon.pt/for_home/product_finder/cameras/digital_slr/eos_
700d/specification.aspx [Acessed in September 09, 2017].