operation manual for frequency response function...operation manual for frequency response function...
TRANSCRIPT

DS-3000 Series Data Station
Operation Manual
for Frequency Response Function
ONO SOKKI CO., LTD.
Contents
1. Flowchart in Preparation for Measurement 2. Connecting the Devices 3. Setting Up the DS-3000 4. Starting Measurement
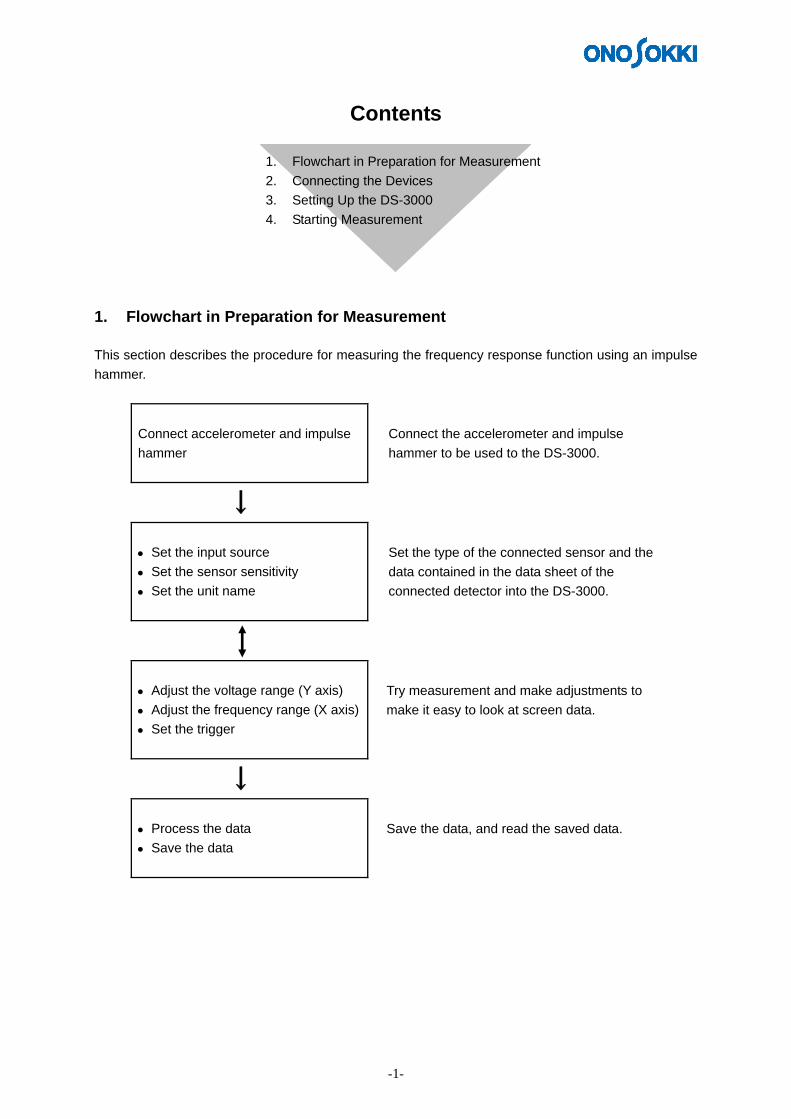
1. Flowchart in Preparation for Measurement This section describes the procedure for measuring the frequency response function using an impulse hammer.
Connect accelerometer and impulse hammer
Connect the accelerometer and impulse hammer to be used to the DS-3000.
↓ • Set the input source • Set the sensor sensitivity • Set the unit name
Set the type of the connected sensor and the data contained in the data sheet of the connected detector into the DS-3000.
• Adjust the voltage range (Y axis) • Adjust the frequency range (X axis)• Set the trigger
Try measurement and make adjustments to make it easy to look at screen data.
↓ • Process the data • Save the data
Save the data, and read the saved data.
-1-
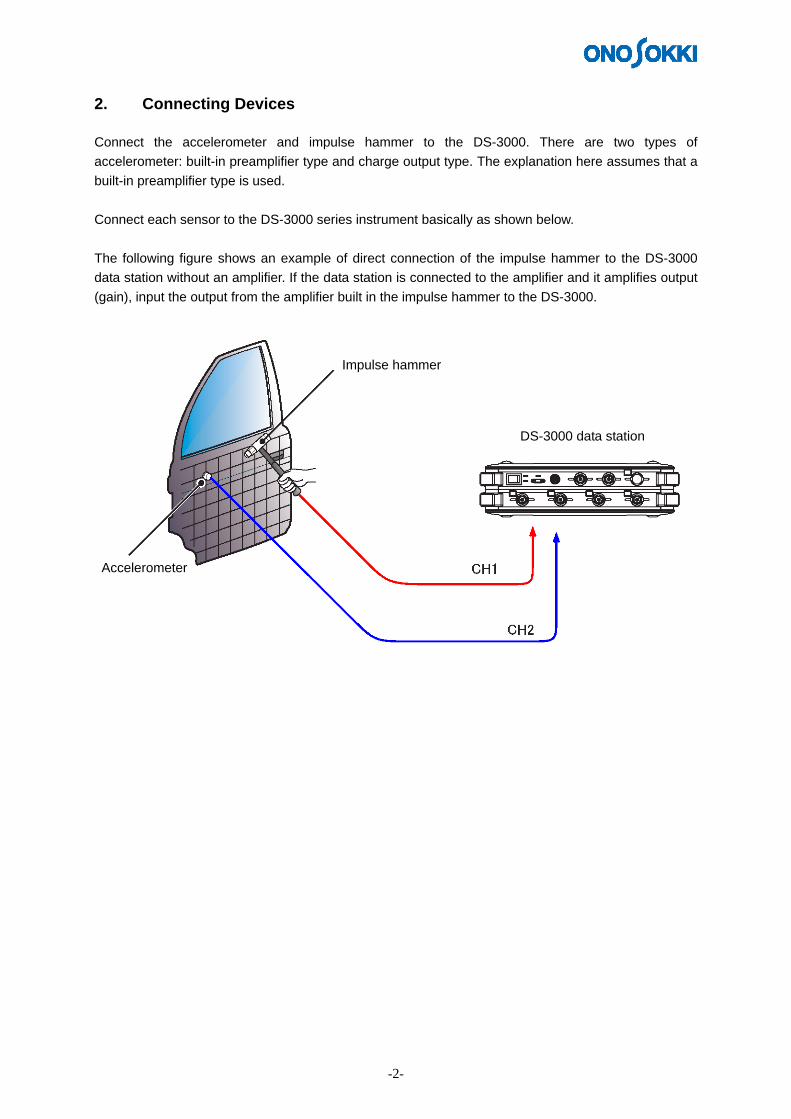
2. Connecting Devices Connect the accelerometer and impulse hammer to the DS-3000. There are two types of accelerometer: built-in preamplifier type and charge output type. The explanation here assumes that a built-in preamplifier type is used. Connect each sensor to the DS-3000 series instrument basically as shown below. The following figure shows an example of direct connection of the impulse hammer to the DS-3000 data station without an amplifier. If the data station is connected to the amplifier and it amplifies output (gain), input the output from the amplifier built in the impulse hammer to the DS-3000.
Impulse hammer
DS-3000 data station
Accelerometer
-2-

3. Setting Up the DS-3000 3-1 Preparing for Setting To enable the connected impulse hammer and accelerometer to normal work and display data, set the operating conditions and sensitivity of the detector in the FFT analyzer. The sensitivity and operating conditions to be set are described in the “Calibration Chart” attached to the accelerometer.
Calibration Chart attached to built-in preamplifier type accelerometer NP-3110 In the Calibration Chart, the data shown in (1) above should be set in the FFT analyzer.
‘20××/××/××
××××××××
(1)
-3-

(1) Voltage sensitivity: Describes what voltage the detector outputs at acceleration of 1 m/s2. This example shows that a voltage of 0.492 mV is output.
In the document attached to the impulse hammer GK-3100, necessary data is described as shown below.
An extender (a weight for weight adjustment) is attached to the hammer.
Plastic and PVC tips are used.
This indicates that the voltage output per 1 N (newton) varies depending on whether an extender is attached to the rear of the impulse hammer.
To maintain a constant excitation force, it is necessary to blow the hammer using the weight of the hammer itself rather than the power of the arm or hand. This is why the use of the hammer with an extender attached to the rear is recommended. Here, confirm an voltage output of 2.38 mV/N.
Tip of hammer
The frequency of the excitation force by the impulse hammer can be roughly adjusted by changing the material of the tip of the hammer. ■ HARD TIP (metal) The rise of the impulse is steep to enable excitation up to high frequency. However, double hammering could occur, and power spectrum density is small. ■ SOFT TIP (PVC) The power spectrum density is large and excitation energy is concentrated in the low frequency. However, excitation of several Hz or less is difficult. ■ MEDIUM TIP (plastics) This tip has intermediate characteristics between the metal tip and PVC tip.
-4-
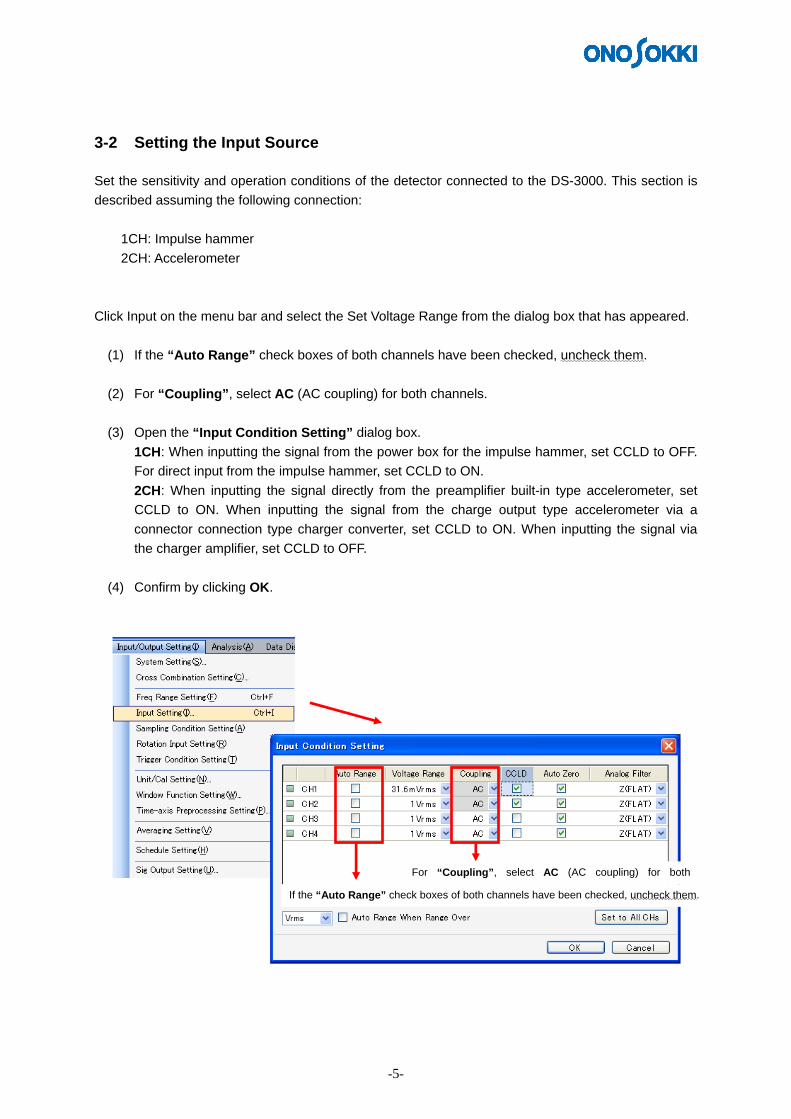
3-2 Setting the Input Source Set the sensitivity and operation conditions of the detector connected to the DS-3000. This section is described assuming the following connection:
1CH: Impulse hammer 2CH: Accelerometer
Click Input on the menu bar and select the Set Voltage Range from the dialog box that has appeared.
(1) If the “Auto Range” check boxes of both channels have been checked, uncheck them.
(2) For “Coupling”, select AC (AC coupling) for both channels.
(3) Open the “Input Condition Setting” dialog box. 1CH: When inputting the signal from the power box for the impulse hammer, set CCLD to OFF. For direct input from the impulse hammer, set CCLD to ON. 2CH: When inputting the signal directly from the preamplifier built-in type accelerometer, set CCLD to ON. When inputting the signal from the charge output type accelerometer via a connector connection type charger converter, set CCLD to ON. When inputting the signal via the charger amplifier, set CCLD to OFF.
(4) Confirm by clicking OK.
For “Coupling”, select AC (AC coupling) for both
If the “Auto Range” check boxes of both channels have been checked, uncheck them.
-5-
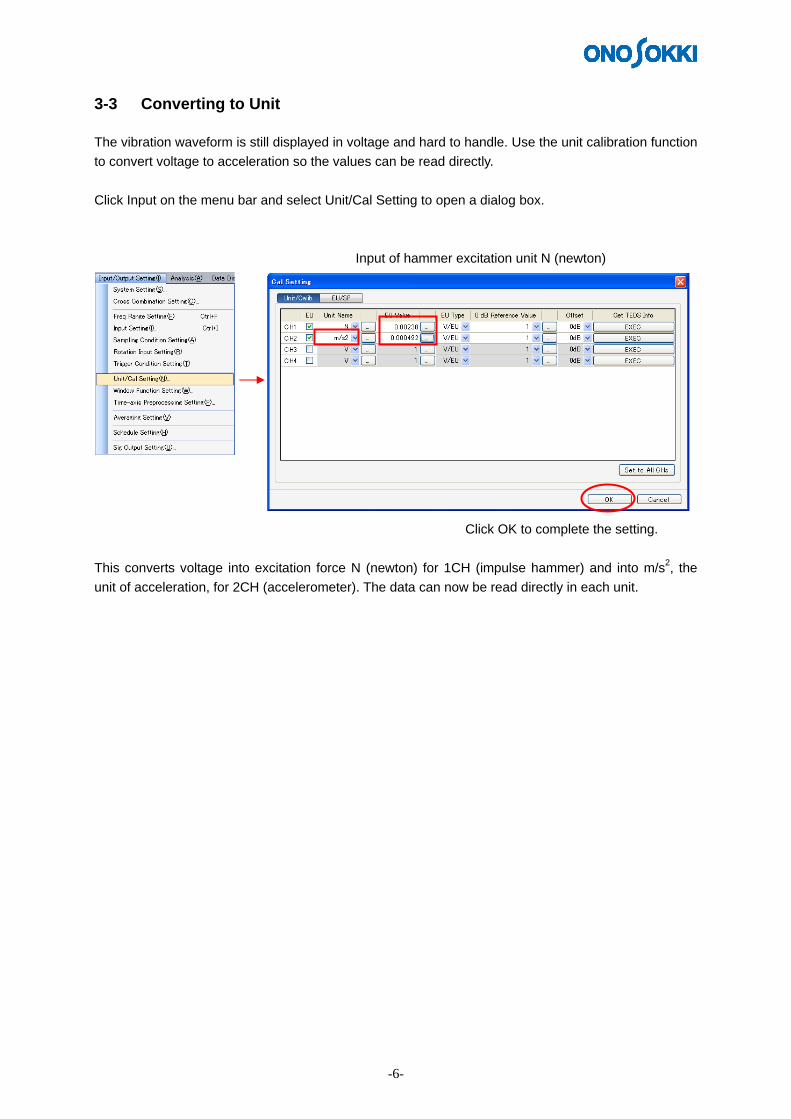
3-3 Converting to Unit The vibration waveform is still displayed in voltage and hard to handle. Use the unit calibration function to convert voltage to acceleration so the values can be read directly. Click Input on the menu bar and select Unit/Cal Setting to open a dialog box. Input of hammer excitation unit N (newton)
Click OK to complete the setting. This converts voltage into excitation force N (newton) for 1CH (impulse hammer) and into m/s2, the unit of acceleration, for 2CH (accelerometer). The data can now be read directly in each unit.
-6-
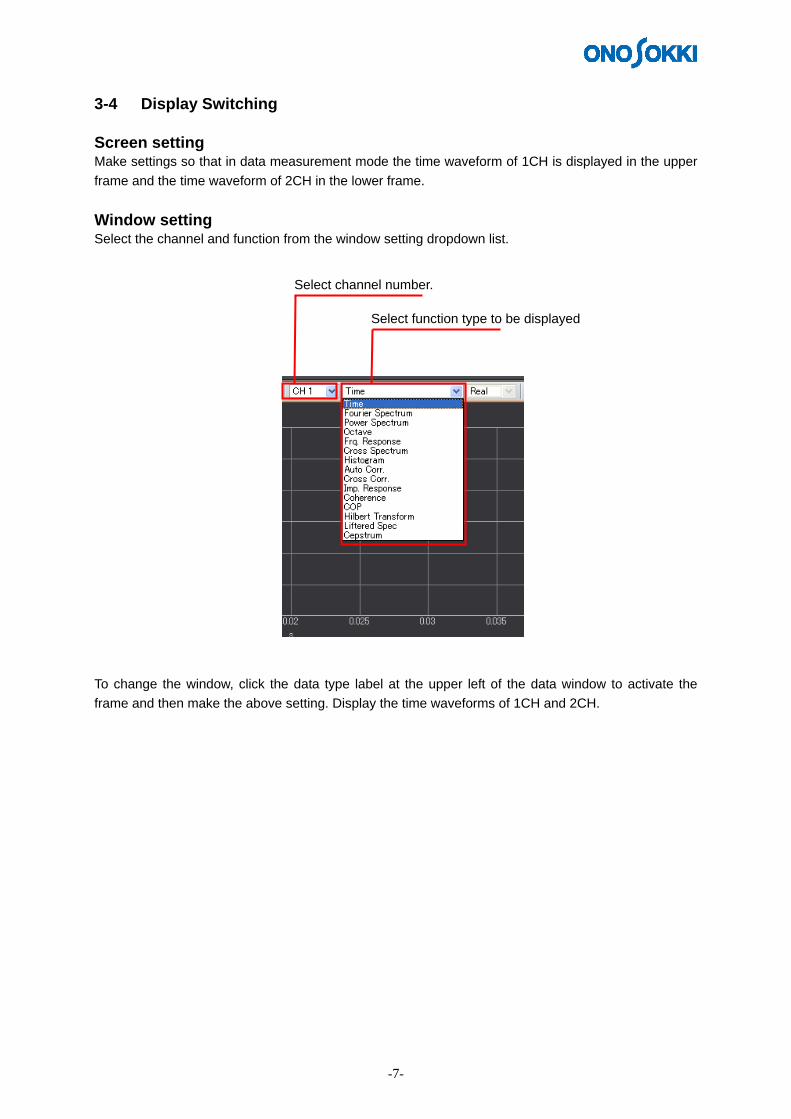
3-4 Display Switching Screen setting Make settings so that in data measurement mode the time waveform of 1CH is displayed in the upper frame and the time waveform of 2CH in the lower frame. Window setting Select the channel and function from the window setting dropdown list.
Select channel number.
Select function type to be displayed
To change the window, click the data type label at the upper left of the data window to activate the frame and then make the above setting. Display the time waveforms of 1CH and 2CH.
-7-
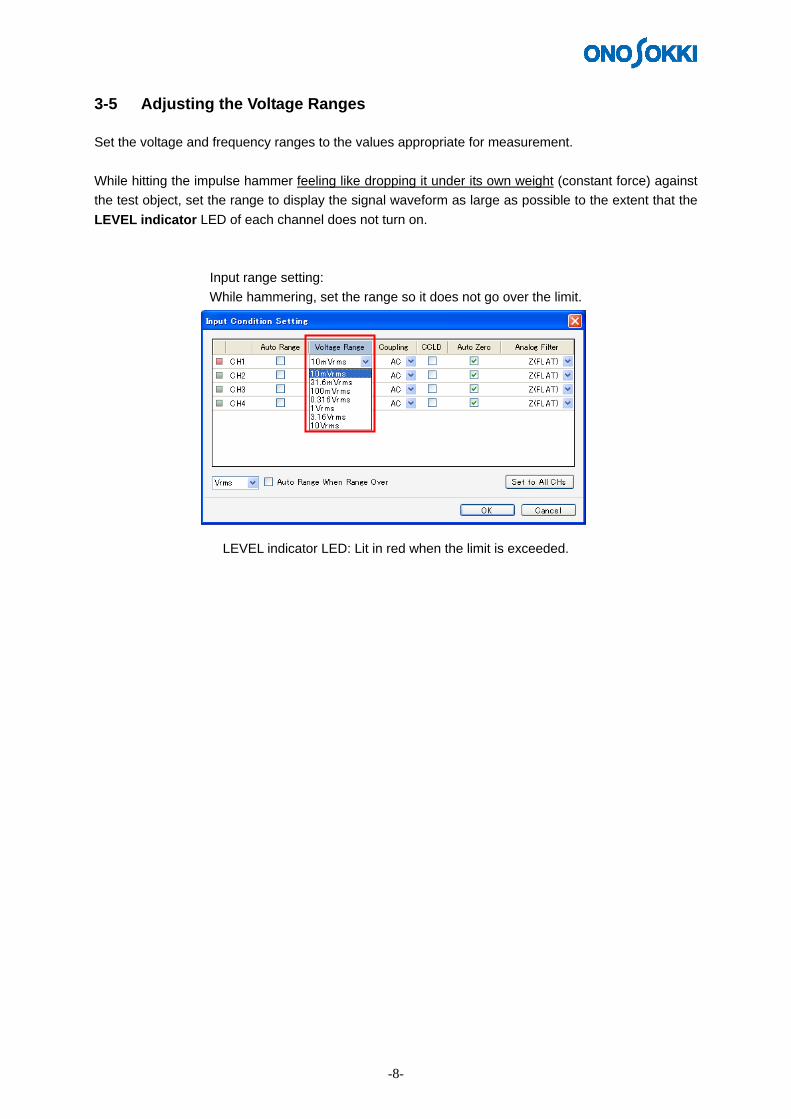
3-5 Adjusting the Voltage Ranges Set the voltage and frequency ranges to the values appropriate for measurement. While hitting the impulse hammer feeling like dropping it under its own weight (constant force) against the test object, set the range to display the signal waveform as large as possible to the extent that the LEVEL indicator LED of each channel does not turn on.
Input range setting: While hammering, set the range so it does not go over the limit.
LEVEL indicator LED: Lit in red when the limit is exceeded.
-8-

3-6 Applying a Trigger To make it easy to observe the waveform, use the trigger function to stop the waveform at the appropriate position in the window. In the configuration window, select “Input/Output Setting” > “Trigger Condition Setting” > “Internal Trigger”, and click the “Open” button. While hammering, apply a trigger to the waveform of 1CH (impulse hammer). Set the trigger position as close to the left side as possible in the window to not interfere waveform observation.
Select Internal Trigger. Use the hammer input signal to apply a trigger.
Click the mouse button in the window to set the trigger level and position. Set the trigger as close to the left end as possible in the window.
Leave the Y-axis scale to the default. If the scale is changed, the scale and level (%) axis will not match.
Click OK to complete the setting.
-9-

Click the TRIG button in the window to be ready to trigger.
Upper partition: Impulse hammer waveform Lower partition: Accelerometer waveform
Hammer the test object. If the waveform stops at the specified position, triggering is successful.
-10-

3-7 Window Setting As the signal of the impulse hammer is a sporadic impact signal, switch over to the rectangular window without correction. In the configuration window, select “Input/Output Setting” > “Window Function Setting”, and click the “Open” button to open the window function setting window. Set the window function for each channel. In this example, Rectangular is selected for each channel.
Set Rectangular for every channel.
-11-
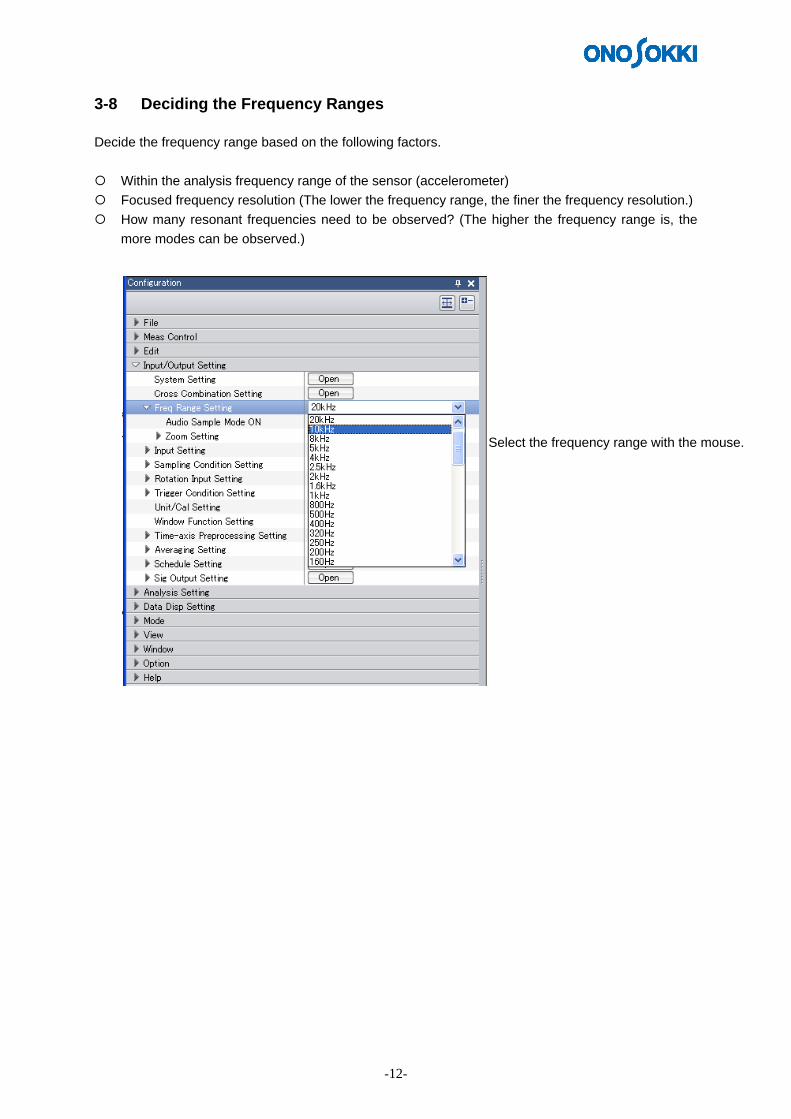
3-8 Deciding the Frequency Ranges Decide the frequency range based on the following factors.
Within the analysis frequency range of the sensor (accelerometer) Focused frequency resolution (The lower the frequency range, the finer the frequency resolution.) How many resonant frequencies need to be observed? (The higher the frequency range is, the
more modes can be observed.)
Select the frequency range with the mouse.
-12-

3-9 Setting A/D Over Cancel This is a function which, if hammering is so strong that the input signal voltage goes over the limit, automatically excludes from data. In the configuration window, select “Input/Output Setting” > “Sampling Condition Setting”. First, confirm data with A/D Over Cancel set to OFF. If the voltage goes over with the function set to ON, data is no longer updated, thus making it hard to do adjustment. Set A/D Over Cancel to ON after confirming that the trigger activates correctly.
Check A/D Over Cancel.
-13-

3-10 Setting the Number of Times of Averaging Data needs to be averaged to minimize the measurement error. Spectrum averaging is used for this purpose. (This is selected by default. If it has been changed, however, select it.) The number of times of averaging is normally 4 or 8. In the configuration window, select “Input/Output Setting” > “Averaging Setting”. Select “Power Sum”.
Enter 8.
-14-

-15-
4. Starting Measurement 4-1 Executing Averaging and Starting Measurement Execute averaging and start measurement.
Click the AVG (average) button.
Confirm that the TRIG (trigger) button is ON.
Click the START button. The signal is input and averaging begins automatically. Start hammering. After the signal (hammering) is input by the preset number of times of averaging, averaging stops automatically. Execute measurement while checking the waveform for double hammering on the monitor screen displaying two partitions of time waveforms from the impulse hammer and accelerometer.
Number of trigger times

-16-
4-2 Checking the Frequency Response Function Data Observed Here, check data while displaying the frequency response function in the upper partition and the coherence function in the lower partition.
* The coherence function represents the correlation of the input and output signals. Coherence is bad when there is a non-linear element such as noise mixture or backlash between input and output. When coherence is high, the reliability of the frequency response function can be said to be high. The level of coherence is displayed in the Y-axis range from 0 to 1. (The coherence function must be averaged before calculation.)
Frequency response function
Coherence function
Notes: 1. The copyright of this procedure manual is owned by ONO SOKKI CO., LTD. 2. Reproduction without permission is prohibited. 3. This operation manual describes the procedure for general measurement and the publisher has
no responsibility for data obtained by the customer during operation.