operating environment factors (oefs) energy - frontier... · operating environment factors (oefs) 1...
TRANSCRIPT

© Frontier Economics Pty. Ltd., Australia.
Operating Environment Factors (OEFs) A REPORT PREPARED FOR ESSENTIAL ENERGY
April 2018
i Frontier Economics | April 2018
Contents 18-04-26 - OEFs report - revised - final - STC
Operating Environment Factors (OEFs)
1 Introduction 1
2 Subtransmission 3
2.1 Importance of accounting for differences in feeder configuration 5
2.2 Importance of accounting for differences in voltage levels 7
3 Diversity of weather 10
3.1 Lightning 11
3.2 Wind 18
3.3 Heavy rain and floods 26
3.4 Bushfire 32
4 Fauna 34
5 Proportion of timber poles 39
6 Additional OEFs yet to be assessed in detail 44
7 Recommendations for the AER 46
7.1 Need for further consultation 46
7.2 Need for bespoke methodology for each OEF 47
7.3 Need for further data collection 47
7.4 Need to re-consider how OEFs are applied 48
7.5 Need to interpret benchmarking results with due caution 49
8 Appendix A: Data provided by Essential Energy 51

April 2018 | Frontier Economics iii
Operating Environment Factors (OEFs)
Figures
Figure 1: Subtransmission circuit length by DNSP 3
Figure 2: Proportion of subtransmission circuit length by DNSP 4
Figure 3: Essential Energy’s subtransmission lines by voltage 5
Figure 4: Essential Energy feeders by configuration type and voltage 6
Figure 5: Subtransmission circuit length by voltage 8
Figure 6: Key climate groups within Australia 10
Figure 7: Average annual thunder-days, 1990-1999 12
Figure 8: Essential Energy’s lightning analysis 13
Figure 9: Estimated lightning-related opex by DNSP 15
Figure 10: Estimated lightning OEF by DNSP 16
Figure 11: Proportions of observations by wind band 19
Figure 12: Proportions of observations (daily averages) by wind band 20
Figure 13: Estimate of number of wind-related outages per year 22
Figure 14: Estimated average annual wind-related opex by DNSP 24
Figure 15: Estimated wind OEF 25
Figure 16: Proportion of days by band of average daily rainfall (mm) 27
Figure 17: Days with average daily rainfall in exceess of the 75th percentile 28
Figure 18: Number of outages due to heavy rain and floods 29
Figure 19: Estimated heavy rain and flood-related opex 30
Figure 20: Estimated heavy rain and flood OEF 31
Figure 21: Essential Energy’s fire risk prioritisation zones 33
Figure 22: Number of fauna-related outages by DNSP 35
Figure 23: Estimated average fauna-related opex 36
Figure 24: Estimated fauna OEF 37
Figure 25: Proportion of poles by pole type 40
Figure 26: CSIRO hazard zones for timber in-ground 41
Figure 27: CSIRO hazard zones for timber above-ground 42
Figure 28: Essential Energy’s timber poles classified by CSIRO’s timber in-
ground decay hazard zones 43

April 2018 | Frontier Economics iv
Tables
Table 1: Estimation of number of wind-related outages by band 21

April 2018 | Frontier Economics 1
Introduction
1 Introduction
On 11 December 2017, the AER initiated a review of the operating environment
factor (OEF) adjustments to be included in its benchmarking analysis. Frontier
Economics welcomes the AER’s review of its approach to economic
benchmarking, and its dedicated review of how OEFs should be accounted for
when conducting economic benchmarking. In our view, it is not possible to draw
meaningful conclusions about the relative efficiency of regulated DNSPs unless
OEFs are controlled for appropriately. Failure to control properly for OEFs would
defeat the objective of conducting economic benchmarking: namely, to identify
the true scope for efficiency improvements for the DNSPs. Therefore, we
welcome the AER’s attention towards this issue, and consider that this is an
important opportunity to make lasting improvements to the way the AER
conducts economic benchmarking to promote the long-term interest of
consumers.
The AER sought responses to its December 2017 OEFs consultation1 by February
2018. Alongside its response to the AER, Essential Energy submitted a report
prepared by Frontier Economics, henceforth referred to as our ‘February 2018
OEFs report’,2 outlining our recommended framework for accounting for
operating environment factors in the AER’s economic benchmarking analysis. We
noted in our February 2018 OEFs report that, given the complexity and
importance of identifying the relevant OEFs for use within the AER’s
benchmarking analysis, it is unlikely that this consultation can be concluded within
a few months. In the interest of developing a sound approach that all stakeholders
can have confidence in, we recommended that the AER take the time necessary to
consult fully and comprehensively with all stakeholders on this issue.
This report builds on our February 2018 OEFs report, in which we recommend
that the AER start by consulting afresh on the list of OEFs it should potentially
account for when benchmarking DNSPs. We have therefore set aside past
decisions that the AER has made to date about the relevance or materiality of
individual OEFs and begun with a blank slate.
1 Australian Energy Regulator, Independent review of Operating Environment Factors used to adjust
efficient operating expenditure for economic benchmarking, December 2017.
https://www.aer.gov.au/system/files/SapereMerz%20review%20of%20operating%20environment
%20factors%20-%20December%202017.pdf
2 See Attachment C of Essential Energy’s submission to the AER:
https://www.aer.gov.au/system/files/Essential%20Energy%20-
%20Submission%20on%20review%20of%20Operating%20Environment%20Factors%20for%20Di
stribution%20Network%20Service%20Providers%20-%2016%20February%202018.pdf
April 2018 | Frontier Economics 2
Introduction
In this report we present our preliminary and illustrative assessment of OEFs in
relation to subtransmission (Section 2), diversity of weather (Section 3), fauna
(Section 4) and timber poles (Section 5). Where possible with the available data
and within the available timeframes, we have attempted to quantify the potential
cost impact of this subset of OEFs for Essential Energy and other DNSPs. Where
it has not been possible to quantify cost impacts, we have outlined the factors that
we consider the AER should have regard to when collecting further data going
forward to facilitate further quantification.
We emphasise strongly that our assessment of OEFs presented in this report is
preliminary and illustrative, and can be improved substantially in consultation with
other DNSPs and stakeholders, with support from the AER. Therefore, by
presenting this analysis, we do not claim to have identified a proposed set of OEF
adjustments that can be applied mechanistically to the AER’s benchmarking
models. Nor do we claim to have assessed the full extent of true differences in
operating environment factors between the Australian DNSPs, as there are a
number of additional OEFs which we were not able to assess within the
timeframes for this project (these are briefly discussed in Section 6).
We recommend that our assessment of the OEFs in this report be seen as a starting
point for discussion. Our illustrative quantification of OEFs in Sections 2 to 5 can
be improved significantly through the process identified in Section 7, in
consultation with other DNSPs and stakeholders, and with further data collection
and support from the AER. Furthermore, we recommend that with further data
collection and time, bespoke methodologies be developed for quantifying the
OEFs in Section 6 which are yet to be assessed in detail. Our broader
recommendations for the AER are set out in Section 7.

April 2018 | Frontier Economics 3
Subtransmission
2 Subtransmission
The present day ownership of subtransmission assets by distribution networks in
different jurisdictions is to a large extent a legacy of different policy decisions taken
when state-level electricity markets were restructured and reformed in the 1990s.3
This is outside the control of the current management of DNSPs and not
accounted for in the AER’s preferred econometric benchmarking model.
Figure 2 below shows that Essential Energy and Ergon Energy have significantly
more subtransmission circuit than any other DNSP in the NEM. While Essential
Energy and Ergon Energy own over 190,000 km and over 150,000 km of
subtransmission circuit, respectively, all other DNSPs in the NEM own less than
90,000 km of subtransmission circuit, and some DNSPs, such as CitiPower, own
less than 5,000 km of subtransmission circuit.
Figure 1: Subtransmission circuit length by DNSP
Source: Frontier Economics’ analysis of 2016 Economic Benchmarking RIN data.
Note: Subtransmission is defined as all overhead lines and underground cables at or above 33kV.
3 For instance, in NSW, following the market reforms, the issue of whether 132kV assets should be
owned by Transgrid (the transmission network operator) or the various distributors was hotly
contested in a number of market reviews. The outcomes of those reviews meant that Transgrid took
ownership of some 132kV assets, whilst the distributors took ownership of other subtransmission
assets. (See, for example: Distribution Review Group, Electricity Distribution Structure Review,
August 1995.) In other States, such as Victoria, the ownership of subtransmission assets was less
controversial. When the Victorian electricity supply industry was vertically separated during reforms
in the early 1990s, five separate distribution networks, and one transmission operator, were
established. Network separation occurred according to network functions, and distribution activities
were defined as those involving 66kV assets and below (see, for example: Office of the State Owned
Enterprises, Department of the Treasury, Reforming Victoria’s Electricity Industry, December 1994).
April 2018 | Frontier Economics 4
Subtransmission
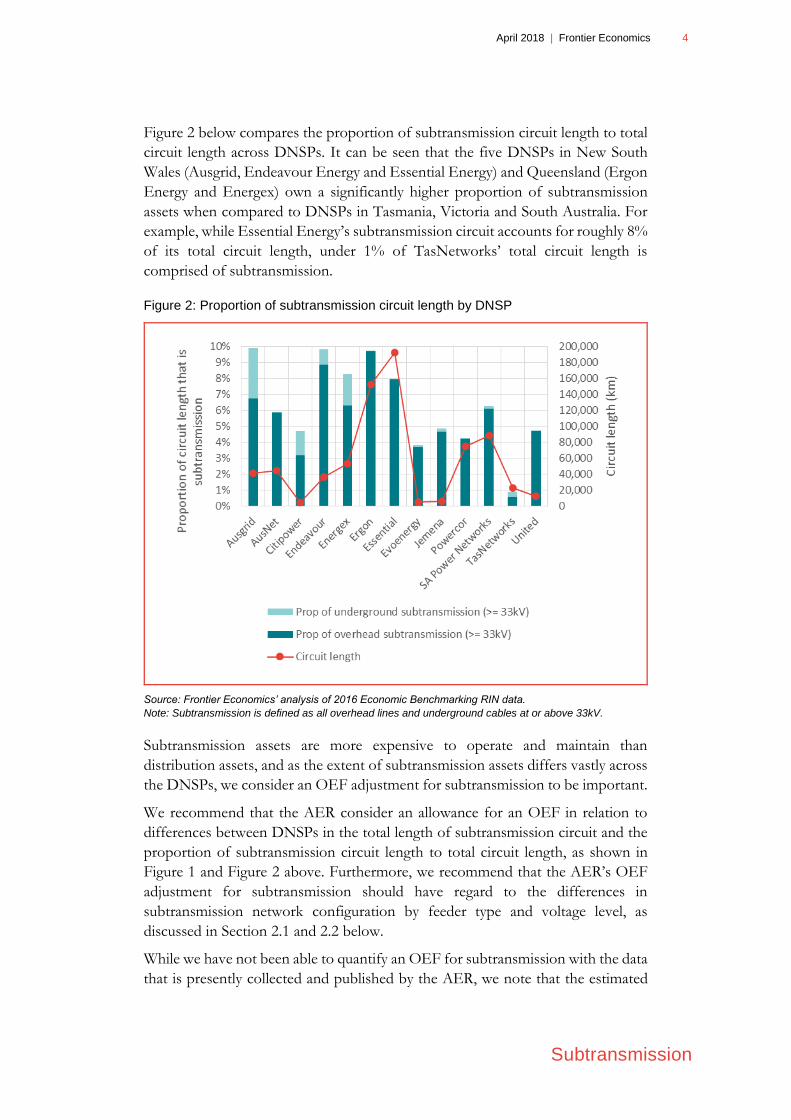
Figure 2 below compares the proportion of subtransmission circuit length to total
circuit length across DNSPs. It can be seen that the five DNSPs in New South
Wales (Ausgrid, Endeavour Energy and Essential Energy) and Queensland (Ergon
Energy and Energex) own a significantly higher proportion of subtransmission
assets when compared to DNSPs in Tasmania, Victoria and South Australia. For
example, while Essential Energy’s subtransmission circuit accounts for roughly 8%
of its total circuit length, under 1% of TasNetworks’ total circuit length is
comprised of subtransmission.
Figure 2: Proportion of subtransmission circuit length by DNSP
Source: Frontier Economics’ analysis of 2016 Economic Benchmarking RIN data.
Note: Subtransmission is defined as all overhead lines and underground cables at or above 33kV.
Subtransmission assets are more expensive to operate and maintain than
distribution assets, and as the extent of subtransmission assets differs vastly across
the DNSPs, we consider an OEF adjustment for subtransmission to be important.
We recommend that the AER consider an allowance for an OEF in relation to
differences between DNSPs in the total length of subtransmission circuit and the
proportion of subtransmission circuit length to total circuit length, as shown in
Figure 1 and Figure 2 above. Furthermore, we recommend that the AER’s OEF
adjustment for subtransmission should have regard to the differences in
subtransmission network configuration by feeder type and voltage level, as
discussed in Section 2.1 and 2.2 below.
While we have not been able to quantify an OEF for subtransmission with the data
that is presently collected and published by the AER, we note that the estimated

April 2018 | Frontier Economics 5
Subtransmission
cost of Essential Energy’s radial subtransmission inspection program alone is
roughly $1.2m per annum, (roughly 0.3% of Essential Energy’s opex), as discussed
in Section 2.1.
2.1 Importance of accounting for differences in
feeder configuration
The AER’s benchmarking and OEF analysis does not account for differences in
DNSP feeder configurations, which are influenced by exogenous factors such a
differences in population density (customers per square km of service territory). A
high population density generally facilitates a more meshed network, whilst a low
density results in a radial network design as driven by economics.
Essential Energy has a subtransmission network that has been designed to service
the needs of sparsely distributed customers at the lowest capital cost. This design
includes long, radial feeders operating at higher voltage to transport electricity over
long distances. This can be seen from Figure 3 and Figure 4 below.
Figure 3: Essential Energy’s subtransmission lines by voltage
Source: Frontier Economics’ analysis of data provided by Essential Energy.

April 2018 | Frontier Economics 6
Subtransmission
Figure 4: Essential Energy feeders by configuration type and voltage
Source: Frontier Economics’ analysis of data provided by Essential Energy.
The extent of Essential Energy’s radial network configuration can be seen in Figure
3 and Figure 4 above.
Figure 3 shows that 43% of Essential Energy’s subtransmission feeder lines
(kms) are radial.
Figure 4 shows that 26% of Essential Energy’s subtransmission feeders
(numbers) are radial.
We understand from Essential Energy that radial feeders are more expensive to
operate as they have no alternative source of supply if there is a fault that causes
an outage. This means power on a radial line cannot be re-routed or switched to
restore power during supply interruptions. In addition when rectifying defects on
radial feeders most utilities will utilise live line techniques which is at a much higher
cost. On the other hand, ring feeders can be fed from the same source substation
via another feeder or ‘loop’ of the feeder (hence the term ring), and a fault on an
alternate feed feeder (A-feed) can be restored in most instances via an alternate
feed from another substation. Furthermore, we understand that it is often difficult
to locate and repair radial line faults due to the travel distance involved in locating
the fault.
To mitigate the risk of failure on its radial network, we understand that Essential
Energy has a separate program of radial subtransmission line inspection in addition
to the nominal inspection programs. This separate program is comprised of hi-res

April 2018 | Frontier Economics 7
Subtransmission
photography, live line inspections, drones, and in some cases LiDAR (an airborne
3-D imaging technique). We understand that the cost of this program is
approximately $1.2m per annum on average, (roughly 0.3% of Essential Energy’s
opex).
While we do not have data on the extent of the radial network configuration of the
other DNSPs, we understand from Essential Energy that, as radial subtransmission
feeders are used by rural utilities to supply sparsely distributed customer bases and
to traverse long distances, a radial network design is more prevalent in rural utilities
such as Ergon Energy and Essential Energy.
For the reasons outlined above, we recommend that the AER’s quantification of
an OEF for subtransmission should have regard to both the length of circuit by
feeder configuration (which we understand to be a key driver of fault and
emergency costs) and the number of feeders by feeder configuration (we
understand that the number of assets is a key driver of routine maintenance costs).
We recommend that the AER include these two variables in its RIN data collection
templates to obtain information on these variables from all DNSPs and facilitate a
more meaningful assessment of subtransmission OEFs.
Finally, it can be seen in Figure 3 and Figure 4 above that a significant proportion
of Essential Energy’s network is designed to operate at higher voltages.
Figure 3 shows that 0.02%, 17%, 0.2%, 64% and 18% of Essential Energy’s
subtransmission circuit kms operates at 220kV, 132kV, 110kV, 66kV and
33kV, respectively.
Figure 4 shows that 0.1%, 8%, 0.2%, 57% and 25% of Essential Energy’s
subtransmission feeders operate at 220kV, 132kV, 110kV, 66kV and 33kV,
respectively.
As we have RIN data on the length of subtransmission cables at difference voltage
levels for all DNSPs, we provide a discussion on the need to consider differences
in the mix of subtransmission voltages in Section 2.2 below.
2.2 Importance of accounting for differences in
voltage levels
We understand from Essential Energy that as subtransmission voltages increase,
the required skill set to manage and maintain these assets becomes more
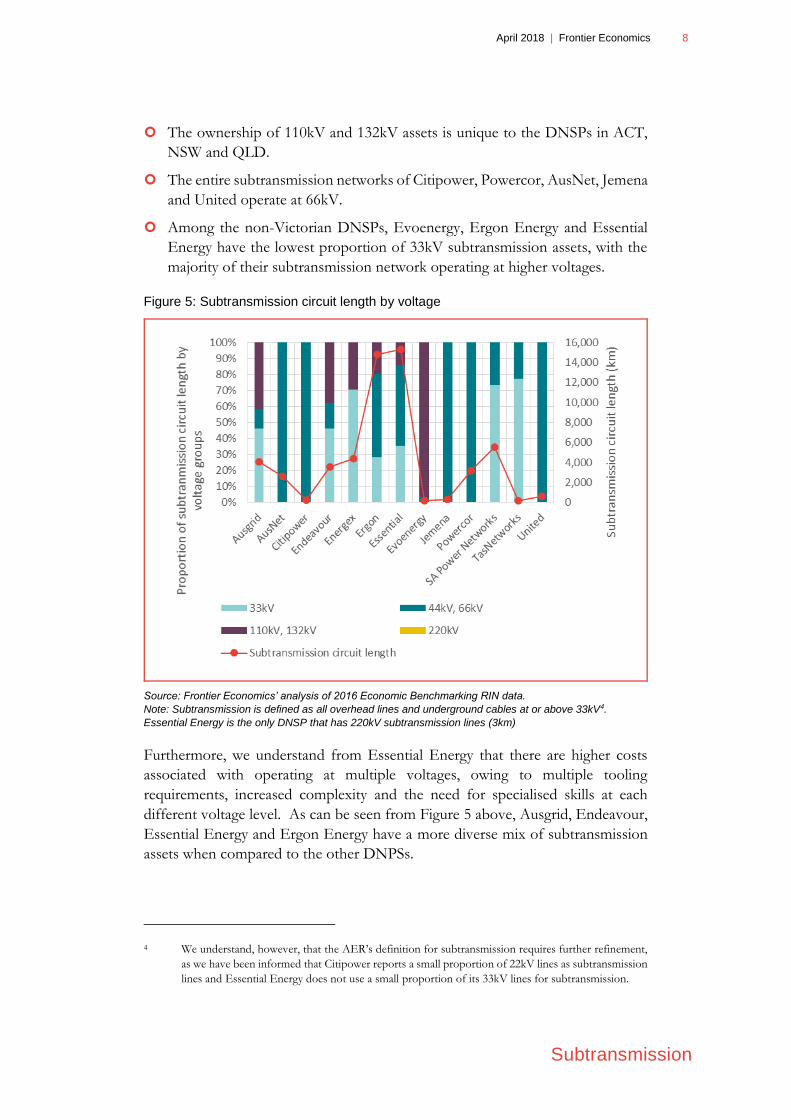
specialised. Figure 5 below shows that the mix of subtransmission assets at
different voltage levels varies considerably across DNSPs.
Essential Energy is the only network with 220kV assets. These assets were
constructed by the transmission authority and as such have the same cost base
as a transmission asset.
April 2018 | Frontier Economics 8
Subtransmission
The ownership of 110kV and 132kV assets is unique to the DNSPs in ACT,
NSW and QLD.
The entire subtransmission networks of Citipower, Powercor, AusNet, Jemena
and United operate at 66kV.
Among the non-Victorian DNSPs, Evoenergy, Ergon Energy and Essential
Energy have the lowest proportion of 33kV subtransmission assets, with the
majority of their subtransmission network operating at higher voltages.
Figure 5: Subtransmission circuit length by voltage
Source: Frontier Economics’ analysis of 2016 Economic Benchmarking RIN data.
Note: Subtransmission is defined as all overhead lines and underground cables at or above 33kV4.
Essential Energy is the only DNSP that has 220kV subtransmission lines (3km)
Furthermore, we understand from Essential Energy that there are higher costs
associated with operating at multiple voltages, owing to multiple tooling
requirements, increased complexity and the need for specialised skills at each
different voltage level. As can be seen from Figure 5 above, Ausgrid, Endeavour,
Essential Energy and Ergon Energy have a more diverse mix of subtransmission
assets when compared to the other DNPSs.
4 We understand, however, that the AER’s definition for subtransmission requires further refinement,
as we have been informed that Citipower reports a small proportion of 22kV lines as subtransmission
lines and Essential Energy does not use a small proportion of its 33kV lines for subtransmission.

April 2018 | Frontier Economics 9
Subtransmission
For the reasons outlined above, we recommend that the AER’s quantification of
an OEF for subtransmission should have regard to the mix of subtransmission
assets at different voltage levels.
April 2018 | Frontier Economics 10
Diversity of weather
3 Diversity of weather
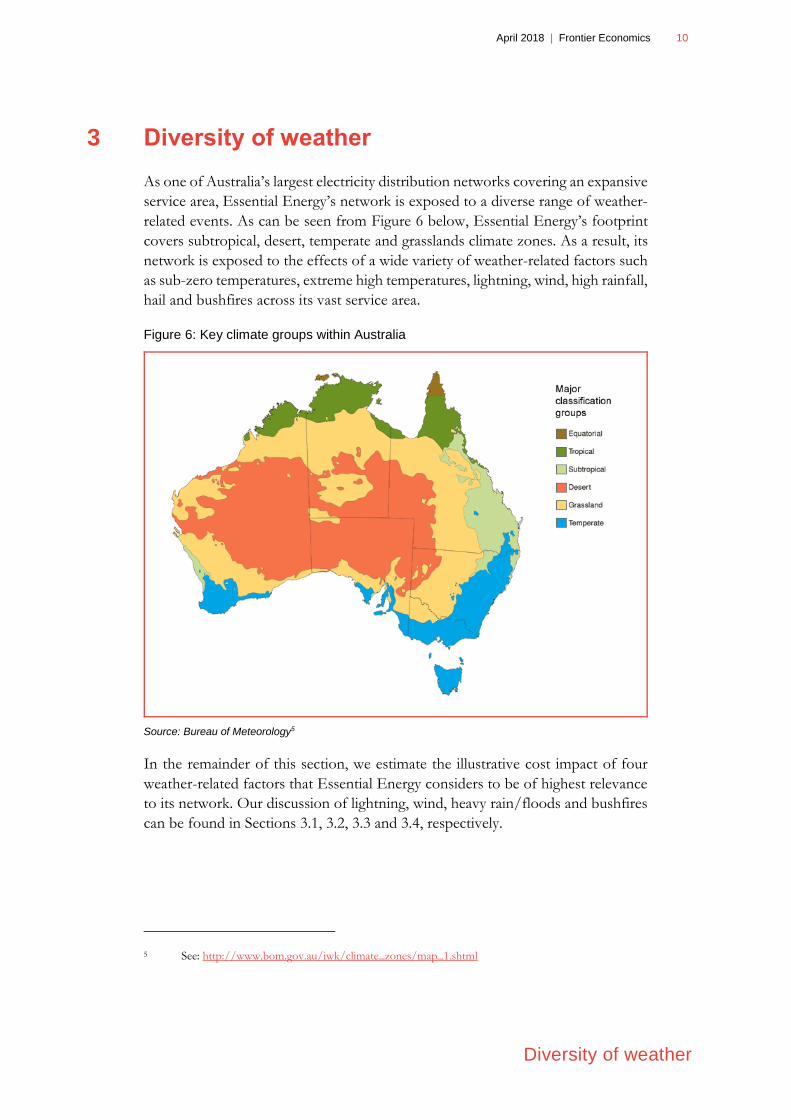
As one of Australia’s largest electricity distribution networks covering an expansive
service area, Essential Energy’s network is exposed to a diverse range of weather-
related events. As can be seen from Figure 6 below, Essential Energy’s footprint
covers subtropical, desert, temperate and grasslands climate zones. As a result, its
network is exposed to the effects of a wide variety of weather-related factors such
as sub-zero temperatures, extreme high temperatures, lightning, wind, high rainfall,
hail and bushfires across its vast service area.
Figure 6: Key climate groups within Australia
Source: Bureau of Meteorology5
In the remainder of this section, we estimate the illustrative cost impact of four
weather-related factors that Essential Energy considers to be of highest relevance
to its network. Our discussion of lightning, wind, heavy rain/floods and bushfires
can be found in Sections 3.1, 3.2, 3.3 and 3.4, respectively.
5 See: http://www.bom.gov.au/iwk/climate_zones/map_1.shtml

April 2018 | Frontier Economics 11
Diversity of weather
3.1 Lightning
Our analysis in this section demonstrates that lightning strikes are an important
candidate OEF.
Section 3.1.1 below shows that the number of thunder days varies significantly
across different parts of Australia.
Section 3.1.2 summarises Essential Energy’s estimates of the number of direct
lightning strikes expected to hit each DNSP’s network every year; these are
based on Essential Energy’s publicly available submission to the AER. This
summary shows that Essential Energy’s network is significantly more exposed
to lightning strikes than any other DNSP in the NEM.
Section 3.1.3 presents our estimate of the average cost per lightning-related
outage, using data provided by Essential Energy.
Section 3.1.4 provides our estimate of the total opex per annum associated
with lightning-related outages, using evidence on the estimated number of
lightning strikes from Section 3.1.2 and the estimated cost per lightning-related
outage from Section 3.1.3.
Section 3.1.5 summarises our estimated OEF for lightning for each DNSP,
which is calculated by dividing our estimate of annual lightning-related opex
(Section 3.1.4) by the annual average annual revealed opex over 2006-2016 for
each DNSP.
Using the approach described above, our illustrative estimate of the OEF for
lightning for Essential Energy is between 2.03% and 3.12%.
3.1.1 Geographic variation in exposure to lightning strikes
Figure 7 below illustrates the average annual number of thunder days experienced
in Australia over a ten year period (1990-1999). Using published equations, the
relationship between thunder days and lightning strikes can be derived.6 It can be
seen that the number of thunder days varies significantly across different parts of
Australia. In particular, the map indicates that the northern parts of Australia are
more exposed to lightning than the central, southern, and western parts of
Australia. Of the NEM states, Queensland and New South Wales are the most
exposed to lightning strikes. This is not surprising given the high storm activity
experienced in these states. As the exposure to lightning strikes shows marked
variation geographically, the incidence of lightning strikes, and the impact on opex,
are likely to vary significantly across DNSPs.
6 IEC 62305 2012 Protection against lightning

April 2018 | Frontier Economics 12
Diversity of weather
Figure 7: Average annual thunder-days, 1990-1999
Source: Bureau of Meteorology7
3.1.2 Essential Energy’s estimate of the number of direct
lightning strikes per year, by DNSP
A DNSP’s exposure to lightning-related damage depends both on the geographic
location of its network and on the volume of assets exposed to lightning. DNSPs
with a higher volume of overhead lines located in geographic areas that are more
exposed to lightning strikes, are likely to experience a higher number of lightning-
related outages. By contrast, DNSPs with fewer assets in geographic areas that are
more exposed to lightning strikes are likely to experience a lower number of
lightning-related outages.
In its published January 2015 lightning analysis8 submitted to the AER, Essential
Energy showed that, owing to its high customer density on the eastern seaboard,
which has the highest annual average thunder days in NSW (40 days,9 as circled in
red in Figure 7 above), its network is significantly more susceptible to lightning
strikes than any other DNSP in the NEM. Notwithstanding the high thunder day
7 Product code IDCJCM0007 retrieved on 17 April 2018 from
http://www.bom.gov.au/jsp/ncc/climate_averages/thunder-lightning/index.jsp
8 Essential Energy, Attachment 4.2 – STPIS Lightning Analysis, January 2015.
9 However, we understand that in order to model the entire network, Essential Energy used a
conservative average thunder day figure of 25.
April 2018 | Frontier Economics 13
Diversity of weather
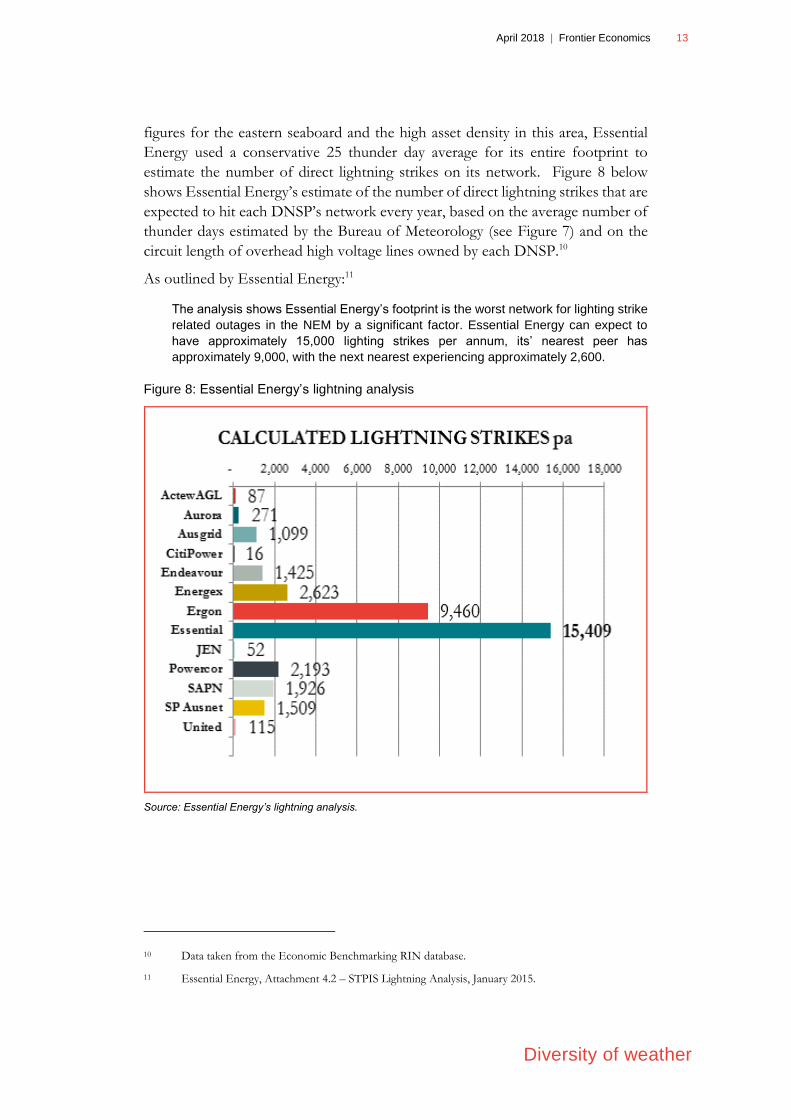
figures for the eastern seaboard and the high asset density in this area, Essential
Energy used a conservative 25 thunder day average for its entire footprint to
estimate the number of direct lightning strikes on its network. Figure 8 below
shows Essential Energy’s estimate of the number of direct lightning strikes that are
expected to hit each DNSP’s network every year, based on the average number of
thunder days estimated by the Bureau of Meteorology (see Figure 7) and on the
circuit length of overhead high voltage lines owned by each DNSP.10
As outlined by Essential Energy:11
The analysis shows Essential Energy’s footprint is the worst network for lighting strike
related outages in the NEM by a significant factor. Essential Energy can expect to
have approximately 15,000 lighting strikes per annum, its’ nearest peer has
approximately 9,000, with the next nearest experiencing approximately 2,600.
Figure 8: Essential Energy’s lightning analysis
Source: Essential Energy’s lightning analysis.
10 Data taken from the Economic Benchmarking RIN database.
11 Essential Energy, Attachment 4.2 – STPIS Lightning Analysis, January 2015.
April 2018 | Frontier Economics 14
Diversity of weather
3.1.3 Estimate of the average cost per lightning-related outage
In order to quantify an OEF for lightning, we used data provided to us by Essential
Energy on roughly 50,000 lightning-related outages that affected its network from
1 July 2013 to 12 March 2018. The data included a mapping by Essential Energy
of “Fault and Emergency” (F&E) costs, and associated on-costs and overhead
costs, for over 43,000 of these outages.12 Using this data, we calculated the average
cost per lightning-related outage to be $758.9 (real FY2016 AUD).
3.1.4 Estimate of the total opex per annum associated with
lightning-related outages
To illustrate the likely cost impact of lightning strikes, we have applied an estimated
average cost per lightning-related outage of $758.9 (Section 3.1.3) to two
alternative estimates of the number of lightning strikes per annum for each DNSP.
The first is Essential Energy’s estimate of the number of lightning strikes per
annum for each DNSP (shown in Figure 8 in Section 3.1.2 above).
The second is Essential Energy’s estimate above, scaled downwards by 35%
for all DNSPs. This is to account for the fact that Essential Energy recorded
an average of 10,056 lightning-related outages per annum its network in the
historical data it provided to Frontier Economics. This is roughly 35% lower
than its estimated 15,409 lightning-related outages per annum for its network
in Figure 8.13 We have scaled Essential Energy estimated lightning-related
outages for all DNSPs downwards to provide a more conservative lower
estimate of likely costs.
Our estimated lightning-related opex per year by DNSP is shown in Figure 9
below. It can be seen that our estimate of lightning-related opex varies considerably
across DNSPs. We estimate the lightning-related outage costs to be between $7.6m
and $11.7m per annum for Essential Energy, between $4.7m and $7.2m per annum
for Ergon Energy, and less than $1m per annum for some other DNSPs including
CitiPower.
12 Refer to Appendix A for a detailed description of the dataset used in the analysis and how it was
generated.
13 We understand from Essential Energy that this is due to the fact that, on attendance, field crews
cannot always readily identify a lightning instigated outage from other causes.

April 2018 | Frontier Economics 15
Diversity of weather
Figure 9: Estimated lightning-related opex by DNSP
Source: Frontier Economics’ analysis of cost data provided by Essential Energy, Essential Energy’s
lightning analysis, AER/Economic Insights 2017 annual benchmarking RIN dataset.
3.1.5 Estimated OEF for lightning-related outages
To calculate a % OEF for lightning for each DNSP, we have divided our estimates
of average lightning-related opex per year (Section 3.1.4) by the average annual
revealed opex over the period 2006-2016 for each DNSP. Our estimated % OEFs
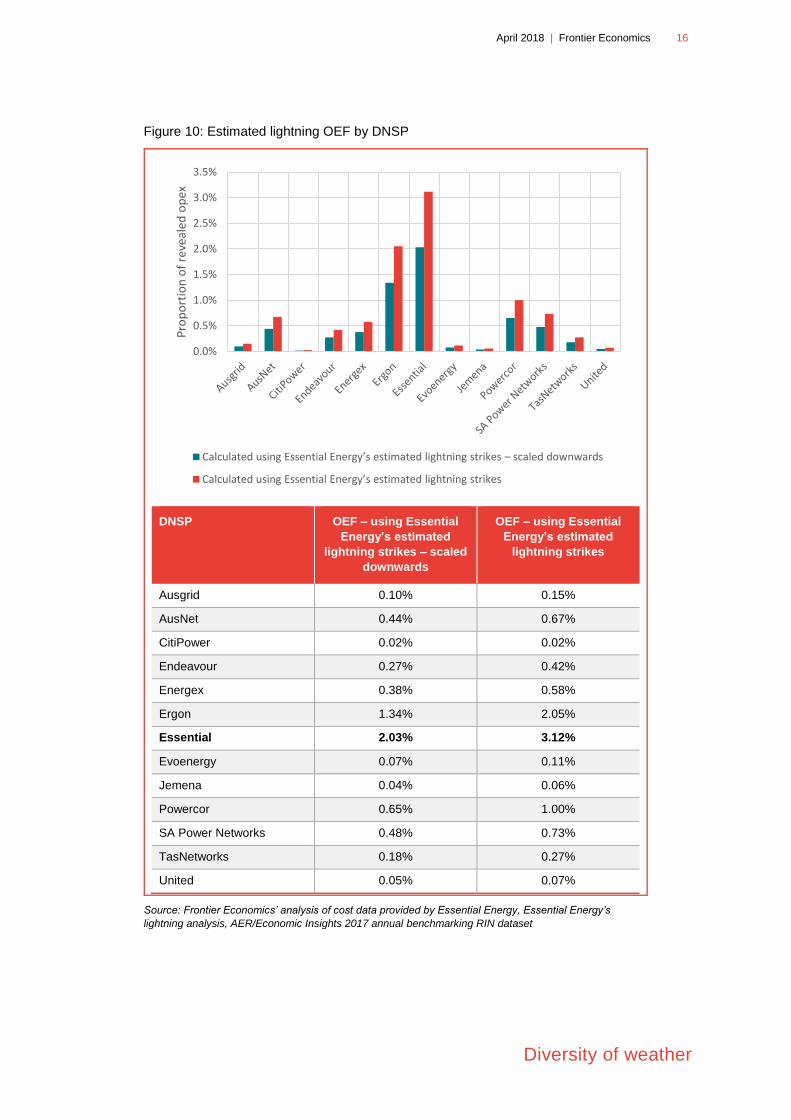
for lightning are shown in Figure 10 below. Our illustrative estimate of the OEF
for lightning for Essential Energy is between 2.03% and 3.12%, for Ergon Energy
it is between 1.34% and 2.05%, and for some DNSPs it is as low as 0.02%. On
average, Essential Energy incurs higher costs (as a proportion of its opex) than all
other DNSPs.
0
2,000
4,000
6,000
8,000
10,000
12,000
14,000Es
tim
ated
lota
l op
ex p
er a
nn
um
ass
oci
ated
wit
h
ligh
tnin
g re
late
d o
uta
ges
(FY2
01
6 A
UD
) ('
00
0)
Calculated using Essential Energy’s estimated lightning strikes – scaled downwards
Calculated using Essential Energy’s estimated lightning strikes
April 2018 | Frontier Economics 16
Diversity of weather
Figure 10: Estimated lightning OEF by DNSP
DNSP OEF – using Essential
Energy’s estimated
lightning strikes – scaled
downwards
OEF – using Essential
Energy’s estimated
lightning strikes
Ausgrid 0.10% 0.15%
AusNet 0.44% 0.67%
CitiPower 0.02% 0.02%
Endeavour 0.27% 0.42%
Energex 0.38% 0.58%
Ergon 1.34% 2.05%
Essential 2.03% 3.12%
Evoenergy 0.07% 0.11%
Jemena 0.04% 0.06%
Powercor 0.65% 1.00%
SA Power Networks 0.48% 0.73%
TasNetworks 0.18% 0.27%
United 0.05% 0.07%
Source: Frontier Economics’ analysis of cost data provided by Essential Energy, Essential Energy’s
lightning analysis, AER/Economic Insights 2017 annual benchmarking RIN dataset
0.0%
0.5%
1.0%
1.5%
2.0%
2.5%
3.0%
3.5%P
rop
ort
ion
of
reve
aled
op
ex
Calculated using Essential Energy’s estimated lightning strikes – scaled downwards
Calculated using Essential Energy’s estimated lightning strikes


April 2018 | Frontier Economics 18
Diversity of weather
3.2 Wind
Our analysis in this section demonstrates that exposure to wind is an important
candidate OEF.
Section 3.2.1 shows that exposure to wind varies significantly across DNSPs.
Section 3.2.2 presents our estimate of the average number of wind-related
outages per day per km of overhead lines according to the average maximum
wind gust speed.
Section 3.2.3 presents our estimate of the average number of wind-related
outages per year by DNSP, using the estimate of number of outages per day
per km from Section 3.2.2 and the exposure to wind from Section 3.2.1. This
analysis shows that Essential Energy is the DNSP with the highest number of
wind-related outages.
Section 3.2.4 provides our estimate of the average cost per wind-related outage,
using data provided by Essential Energy.
Section 3.2.5 provides our estimate of the total opex per annum associated
with wind-related outages by DNSP, using the estimated number of wind-
related outages per year from Section 3.2.3 and the estimate of the cost per
outage from Section 3.2.4.
Section 3.2.6 summarises our estimates of the OEF for wind for each DNSP,
which is calculated by dividing, for each DNSP, our estimate of average wind-
related opex (Section 3.2.5) by the average annual revealed opex over the
period 2006-2016.
Using the approach described above, our illustrative estimate of the OEF for wind
for Essential Energy is 0.79%.
3.2.1 Geographic variation in exposure to wind
We understand from Essential Energy that wind can cause system outages either
through direct damage, or through debris and tree branches being blown into and
onto assets. Wind also causes conductors to clash and places additional load on
structures which can lead to premature asset failure.
A DNSP’s exposure to wind-related damage depends both on the geographic
location of its network and on the volume of assets exposed to high wind. DNSPs
with a higher volume of overhead lines located in geographic areas that are more
exposed to high wind events, are likely to experience a higher number of wind-
related outages. By contrast, DNSPs with fewer assets in geographic areas that are
exposed to high wind are likely to experience a lower number of wind-related
outages. Furthermore, rural networks are more likely to be exposed to the effects
of wind than urban networks, which are more shielded by built environments.
April 2018 | Frontier Economics 19
Diversity of weather
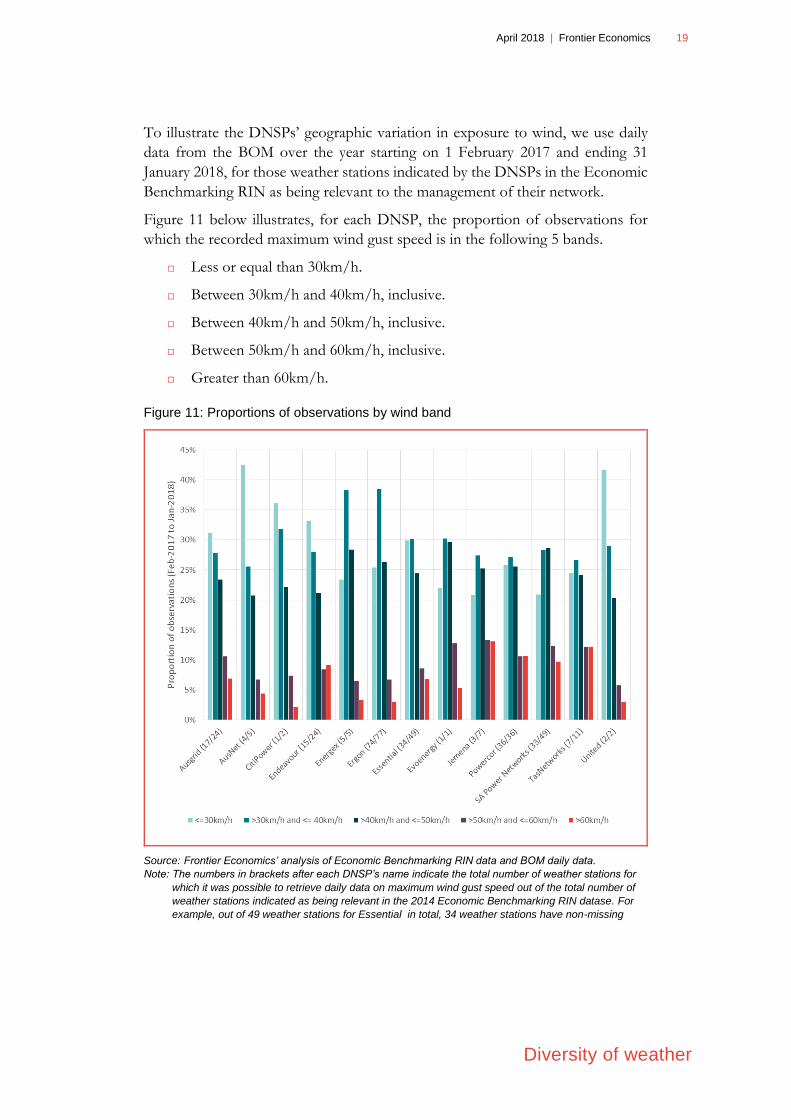
To illustrate the DNSPs’ geographic variation in exposure to wind, we use daily
data from the BOM over the year starting on 1 February 2017 and ending 31
January 2018, for those weather stations indicated by the DNSPs in the Economic
Benchmarking RIN as being relevant to the management of their network.
Figure 11 below illustrates, for each DNSP, the proportion of observations for
which the recorded maximum wind gust speed is in the following 5 bands.
Less or equal than 30km/h.
Between 30km/h and 40km/h, inclusive.
Between 40km/h and 50km/h, inclusive.
Between 50km/h and 60km/h, inclusive.
Greater than 60km/h.
Figure 11: Proportions of observations by wind band
Source: Frontier Economics’ analysis of Economic Benchmarking RIN data and BOM daily data.
Note: The numbers in brackets after each DNSP’s name indicate the total number of weather stations for
which it was possible to retrieve daily data on maximum wind gust speed out of the total number of
weather stations indicated as being relevant in the 2014 Economic Benchmarking RIN datase. For
example, out of 49 weather stations for Essential in total, 34 weather stations have non-missing

April 2018 | Frontier Economics 20
Diversity of weather
daily data on maximum wind gust speed over the year starting on 1 February 2017 and ending 31
January 2018.
Figure 11 shows that Jemena, TasNetworks, Powercor, and SA Power Networks
have the highest proportion of observations in the highest wind speed band
(>60km/h). Ergon Energy, Energex, CitiPower and Essential Energy have the
highest proportion of observations in the 30-40km/h band.
Another comparison across DNSPs is shown in Figure 12 below, which shows the
proportion of daily average maximum wind gust speed in each band, where the
average is taken across all the weather stations nominated by each DNSP. When
comparing the proportions illustrated in Figure 11 and Figure 12, it can be seen
that the proportion of events in the most extreme bands are lower after averaging
across weather stations (Figure 12). This is particularly true for the larger DNSPs
(Ergon Energy and Essential Energy). In order to develop a conservative estimate
of OEFs (and avoid any bias in favour of Essential Energy), we use the proportions
presented in Figure 12 as the basis of the remainder of our analysis.
Figure 12: Proportions of observations (daily averages) by wind band
Source: Frontier Economics’ analysis of Economic Benchmarking RIN data and BOM daily data.
Note: The numbers in brackets after each DNSP’s name indicate the total number of weather stations for
which it was possible to retrieve daily data on maximum wind gust speed out of the total number of
weather stations indicated as being relevant in the 2014 Economic Benchmarking RIN datase. For
example, out of 49 weather stations for Essential in total, 34 weather stations have non-missing

April 2018 | Frontier Economics 21
Diversity of weather
daily data on maximum wind gust speed over the year starting on 1 February 2017 and ending 31
January 2018.
3.2.2 Estimate of number of wind-related outages per day per
km of overhead lines, by average maximum wind gust
speed
In order to quantify an OEF for wind, we have used data provided to us by
Essential Energy on about 10,000 wind-related outages affecting its network from
1 July 2013 to 12 March 2018.
Using this data we calculated the average number of wind-related outages per day
within each of the 5 bands identified in Figure 12 above, by dividing the total
number of wind-related outages in that band by the total number of days in that
band. The results are summarised in Table 1.
As different DNSPs have a different amount of overhead lines exposed to wind
events, in order to quantify an OEF for all DNSPs it is necessary to normalise the
estimate of the number of wind-related outages per day by the amount of overhead
lines exposed.
Table 1: Estimation of number of wind-related outages by band
Average maximum
wind gust speed
Total number
of wind-
related
outages
Total number
of days
Total number
of wind-
related
outages per
day
Total number
of wind-
related
outages per
day per 1000
km of
overhead
lines
<=30km/h 468 354 1.32 0.007
>30km/h and <=40km/h 2494 756 3.30 0.018
>40km/h and <=50km/h 3705 457 8.11 0.044
>50km/h and <=60km/h 2306 123 18.75 0.102
>60km/h 1438 26 55.31 0.301
Source; Frontier Economics’ analysis of Essential Energy’s data.
Note: Calculation performed over number of outages incurred between 1 July 2013 and 12 March 2018.
The table above shows that for Essential Energy the number of wind-related
outages increases with higher average maximum wind gust speed, going from 1.32
outages per day on days when the average wind gust speed is at or below 30km/h,
to 55 outages per day on days when the average maximum wind gust speed is more
than 60km/h. The table also shows that, on average, one can expect between 0.007
outages per day per 1,000 km of overhead lines on days with an average maximum
April 2018 | Frontier Economics 22
Diversity of weather
wind gust speed at or below 30km/h, and 0.301 outages per day per 1,000 km of
overhead lines on days with an average maximum wind gust speed greater than
60km/h.
3.2.3 Estimate of the number of wind-related outages per year,
by DNSP
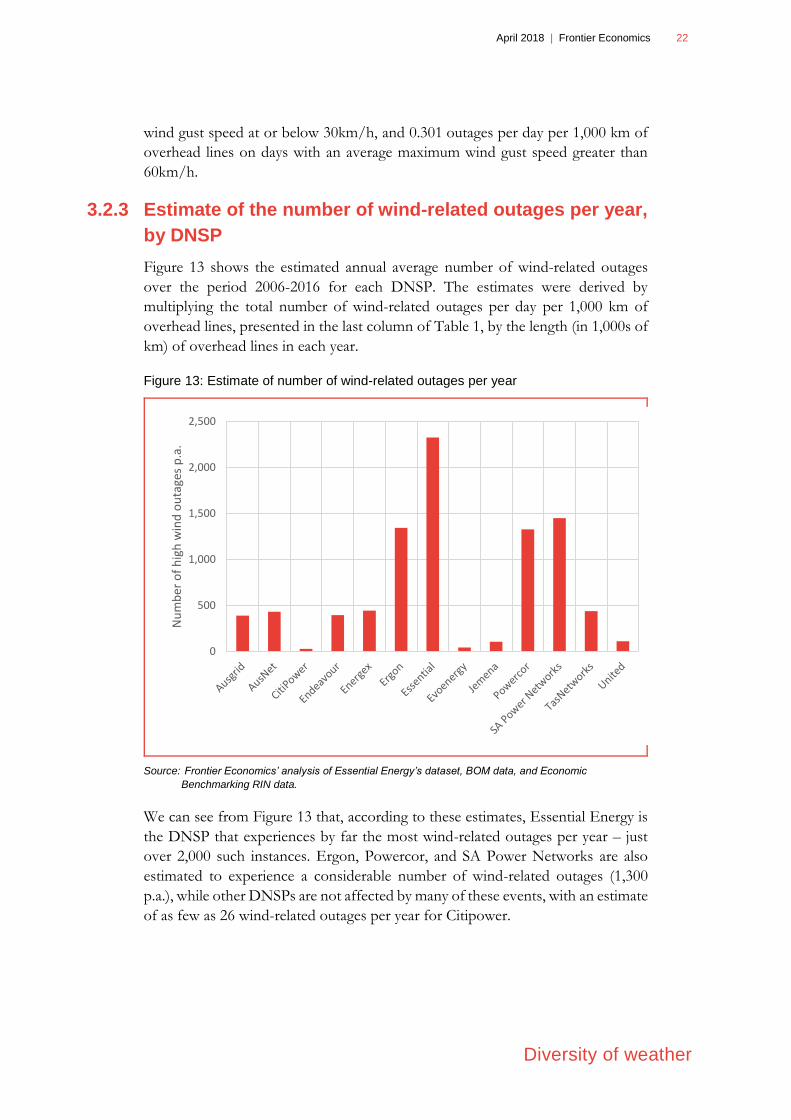
Figure 13 shows the estimated annual average number of wind-related outages
over the period 2006-2016 for each DNSP. The estimates were derived by
multiplying the total number of wind-related outages per day per 1,000 km of
overhead lines, presented in the last column of Table 1, by the length (in 1,000s of
km) of overhead lines in each year.
Figure 13: Estimate of number of wind-related outages per year
Source: Frontier Economics’ analysis of Essential Energy’s dataset, BOM data, and Economic
Benchmarking RIN data.
We can see from Figure 13 that, according to these estimates, Essential Energy is
the DNSP that experiences by far the most wind-related outages per year – just
over 2,000 such instances. Ergon, Powercor, and SA Power Networks are also
estimated to experience a considerable number of wind-related outages (1,300
p.a.), while other DNSPs are not affected by many of these events, with an estimate
of as few as 26 wind-related outages per year for Citipower.
0
500
1,000
1,500
2,000
2,500
Nu
mb
er o
f h
igh
win
d o
uta
ges
p.a
.

April 2018 | Frontier Economics 23
Diversity of weather
3.2.4 Estimate of the average cost per wind-related outage
In order to quantify an OEF for wind, we used data provided to us by Essential
Energy on about 10,000 wind-related outages that affected its network from 1 July
2013 to 12 March 2018. The data provided included Essential Energy’s mapping
of F&E costs and associated on-costs and overhead costs for over 9,000 of these
outages.14 Using this data, we calculated the average cost per wind-related outage
to be $1,272.85 (real FY2016 AUD).15
3.2.5 Estimate of the total opex per annum associated with
wind-related outages
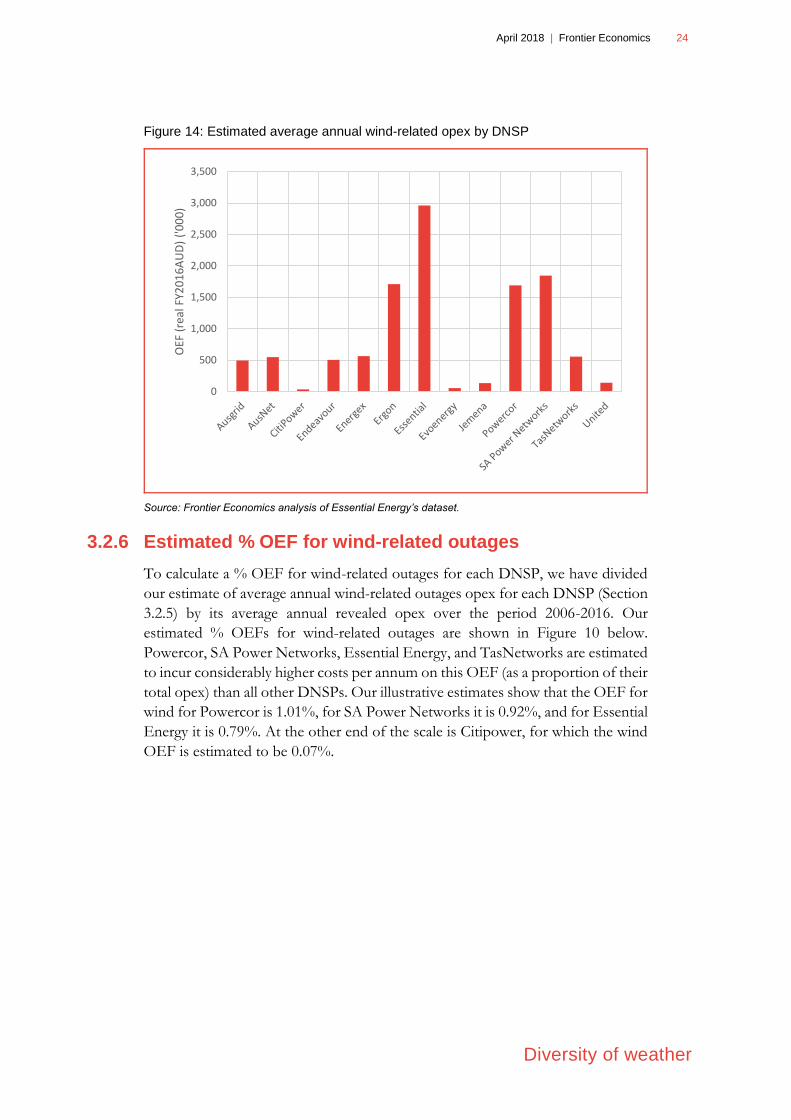
In order to illustrate the cost impact of wind-related outages on opex, we have
used the estimated number of wind-related outages by DNSP by year (the average
over time is shown in Figure 13 above, Section 3.2.3), and applied an estimated
average cost per wind-related outage of $1,272.85 (Section 3.2.4). Our estimated
average annual wind-related opex for each DNSP over the period 2006-2016 is
shown in Figure 9 below. It can be seen that our estimates of wind-related opex
vary considerably across DNSPs. We estimate wind-related outage costs to be
more than $2.5m per annum for Essential Energy, over $1.5m per annum for
Ergon Energy, Powercor, and SA Power Networks, and less than $150k per annum
for some of the other DNSPs, including CitiPower, Evoenergy, Jemena, and
United.
14 Refer to Appendix A for a detailed description of the dataset used in the analysis and how it was
generated.
15 We use a single average cost per outage for every band of wind gust speed, as the cost per outage does
not vary significantly across the bands.
April 2018 | Frontier Economics 24
Diversity of weather
Figure 14: Estimated average annual wind-related opex by DNSP
Source: Frontier Economics analysis of Essential Energy’s dataset.
3.2.6 Estimated % OEF for wind-related outages
To calculate a % OEF for wind-related outages for each DNSP, we have divided
our estimate of average annual wind-related outages opex for each DNSP (Section
3.2.5) by its average annual revealed opex over the period 2006-2016. Our
estimated % OEFs for wind-related outages are shown in Figure 10 below.
Powercor, SA Power Networks, Essential Energy, and TasNetworks are estimated
to incur considerably higher costs per annum on this OEF (as a proportion of their
total opex) than all other DNSPs. Our illustrative estimates show that the OEF for
wind for Powercor is 1.01%, for SA Power Networks it is 0.92%, and for Essential
Energy it is 0.79%. At the other end of the scale is Citipower, for which the wind
OEF is estimated to be 0.07%.
0
500
1,000
1,500
2,000
2,500
3,000
3,500O
EF (
real
FY2
01
6A
UD
) ('
00
0)

April 2018 | Frontier Economics 25
Diversity of weather
Figure 15: Estimated wind OEF
Source: Frontier Economics’ analysis of Essential Energy’s dataset.
0.09%
0.32%
0.07%
0.19%0.16%
0.49%
0.79%
0.09%
0.20%
1.01%
0.92%
0.74%
0.12%
0.0%
0.2%
0.4%
0.6%
0.8%
1.0%
1.2%P
rop
ort
ion
of
reve
aled
op
ex

April 2018 | Frontier Economics 26
Diversity of weather
3.3 Heavy rain and floods
Our analysis in this section demonstrates that different DNSPs are exposed to
different amounts of rain throughout the year, and that the impact of floods on
Essential Energy’s costs vary considerably from year to year.
Section 3.2.1 shows that exposure to rain varies significantly across DNSPs.
Section 3.3.2 explains how floods affect Essential Energy’s network.
Section 3.3.3 shows the number of heavy rain and flood-related outages for
Essential Energy between 1 July 2013 and 12 March 2018.
Section 3.3.4 provides our estimate of the average cost per heavy rain and
flood-related outage, using data provided by Essential Energy.
Section 3.3.5 provides our estimate of the total opex per annum associated
with heavy rain and flood-related outages, using data provided by Essential
Energy.
Section 3.3.6 summarises our estimates of the OEF for heavy rain and floods
for Essential Energy over the period 2014-2017. The OEF is calculated by
dividing the estimate of opex associated with heavy rain and flood-related
outages in each year (Section 3.3.5) by the revealed opex for each year.
Using the approach described above, our illustrative estimate of the OEF for heavy
rain and floods for Essential Energy over the period 2014-2017 is between 0.06%
in 2014 and 0.32% in 2017.
3.3.1 Geographic variation in exposure to rain
Figure 12 below illustrates, for each DNSP, the proportion of days in a year16
during which the average daily rainfall (mm)17 is in any of the following 5 bands
based on the average daily rainfall distribution across all days and DNSPs:18
less than or equal to the median rainfall (0.16mm)
between the 50th percentile (0.16mm) and the 75th percentile (1.64mm),
inclusive
16 We have used daily data from the BOM over the year starting on 1 February 2017 and ending 31
January 2018.
17 The average daily rainfall for each day of the year was derived by averaging the daily rainfalls for that
day across a set of weather stations. The weather stations considered are those weather stations
indicated by the DNSPs in the Economic Benchmarking RIN as being relevant to the management
of their network.
18 For the reasons discussed in Section 3.2.1, we present averages across weather stations in order to
avoid any bias in favour of Essential Energy.
April 2018 | Frontier Economics 27
Diversity of weather
between the 75th percentile (1.64mm) and the 90th percentile(5.85mm),
inclusive
between the 90th percentile (5.85mm) and the 95th percentile (9.75mm),
inclusive
greater than the 95th percentile (9.75mm).
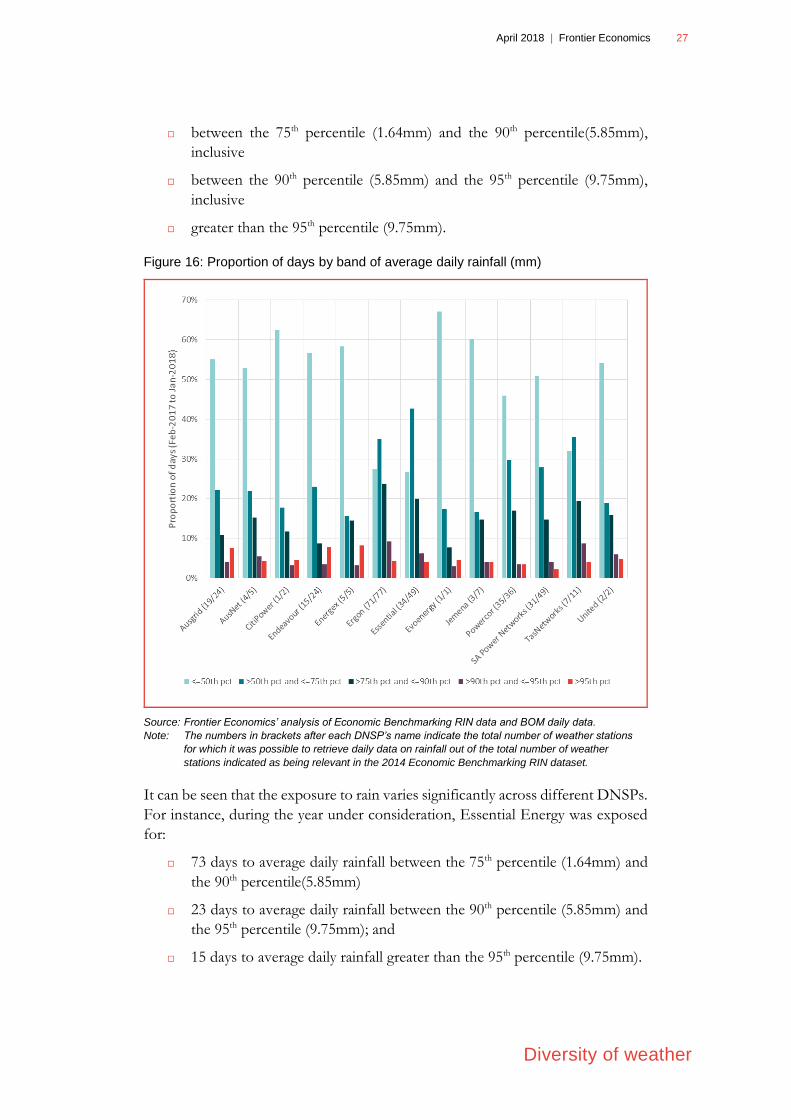
Figure 16: Proportion of days by band of average daily rainfall (mm)
Source: Frontier Economics’ analysis of Economic Benchmarking RIN data and BOM daily data.
Note: The numbers in brackets after each DNSP’s name indicate the total number of weather stations
for which it was possible to retrieve daily data on rainfall out of the total number of weather
stations indicated as being relevant in the 2014 Economic Benchmarking RIN dataset.
It can be seen that the exposure to rain varies significantly across different DNSPs.
For instance, during the year under consideration, Essential Energy was exposed
for:
73 days to average daily rainfall between the 75th percentile (1.64mm) and
the 90th percentile(5.85mm)
23 days to average daily rainfall between the 90th percentile (5.85mm) and
the 95th percentile (9.75mm); and
15 days to average daily rainfall greater than the 95th percentile (9.75mm).

April 2018 | Frontier Economics 28
Diversity of weather
DNSPs with a greater exposure than Essential Energy to average daily rainfall
greater than the 95th percentile (9.75mm) include Energex, Endeavour, and
Ausgrid, with at least 28 days per year with such events. By contrast, SA Power
Network had only 8 days with an average daily rainfall greater than the 95th
percentile (9.75mm).
Figure 17 summarises the average number of days per year for which the average
daily rainfall exceeds the 75th percentile of 1.64mm per day for each DNSP. It is
clear from the chart that Ergon, TasNetworks and Essential are the DNSPs with
the greatest exposure to rain above 1.64mm, having at least 111 days per year with
an average daily rainfall above 1.64mm.
Figure 17: Days with average daily rainfall in exceess of the 75th percentile
Source: Frontier Economics’ analysis of Economic Benchmarking RIN data and BOM daily data.
3.3.2 Impact of floods on Essential Energy’s network
We are informed by Essential Energy that episodes of heavy rain may result in
floods, which, within Essential Energy’s region, generally occur in populated areas
where there is a concentration of underground assets. We understand that flood
events have a significant impact on Essential Energy’s underground assets. Flood
waters can enter underground installations along with mud and debris, and this
water can at times be contaminated. Deposited mud and debris can conduct
electricity, making the installation unsafe during and after the flood. An installation
that has been inundated with flood water requires careful inspection and repair
before supply can be restored. Clean-up is often extensive, consuming large

April 2018 | Frontier Economics 29
Diversity of weather
amounts of resources to restore supply. Essential Energy, in recognition of the
frequency of these events on its network, has a dedicated policy for the restoration
of flood-affected underground assets (CEOP2481).
We are advised that while the impact of flooding is smaller on Essential Energy’s
overhead assets, flood-related erosion can affect pole foundations. Flood waters
can also lead to corrosion of electrical connections and significantly increase the
risk of connections failing or causing a fire, which could also lead to longer outages.
3.3.3 Number of outages due to heavy rains and floods
Figure 18 summarises the number of outages that Essential Energy reported to be
caused by heavy rain and floods between 1 July 2014 and 12 March 2018.19 The
figure below shows that the number of flood-related outages in Essential Energy’s
network varies considerably over time. For example, while 136 outages were
reported to be caused by floods in the year 2017, only 7 flood-related outages were
reported in 2016. By contrast, a significantly higher number of outages are reported
to be caused by rain in each year (at least 300 outages in each year since 2014), and
this is less variable over time.
Figure 18: Number of outages due to heavy rain and floods
Source: Essential Energy’s dataset
19 By financial year.

April 2018 | Frontier Economics 30
Diversity of weather
3.3.4 Estimate of the average cost per heavy rain and flood-
related outage
In order to estimate the cost per rain and flood event, we use data provided to us
by Essential Energy on roughly 1,600 heavy rain-related outages and 160 flood-
related outages that affected its network from 1 July 2013 to 12 March 2018, and
for which Essential Energy provided a mapping of corresponding “Fault and
Emergency” (F&E) costs, including on-costs and overhead costs.20 Using this data,
we calculate the average cost per heavy rain-related outage to be $1,027.10 (real
FY2016 AUD) and the average cost per flood-related outage to be $4,312.84 (real
FY2016 AUD).
3.3.5 Estimate of the total opex per annum associated with
heavy rain and flood-related outages
To illustrate the cost impact of heavy rain and floods we multiply the estimated
average costs per outage (Section 3.3.4) by the number of events in each year
(3.3.3). Results are reported in Figure 19.
Figure 19: Estimated heavy rain and flood-related opex
Source: Frontier Economics’s analysis of Essential Energy’s data.
20 Refer to Appendix A for a detailed description of the dataset used in the analysis and how it was
generated.
April 2018 | Frontier Economics 31
Diversity of weather
The chart shows that total costs associated with heavy rain do not change
considerably over time, at around $400k p.a. By contrast, total costs associated
with floods vary significantly over time. Over the period 2014-2017, flood-related
costs were as low as $1,000 in 2014 and as high to $601,000 in 2017.
We are advised by Essential Energy that the impact of flood events on costs
depends on the amount of underground equipment that needs to be restored and
on the concurrence of multiple flood-events which can restrain capacity. For
instance, Essential Energy informed us that the 2017 floods occurred in the high
density areas of Northern New South Wales and that floods in Lismore and Tweed
Heads occurred at the same time.
3.3.6 Estimated OEF for heavy rain and flood-related outages
To calculate a % OEF for heavy rain and flood-related outages for Essential
Energy by year, we have divided our estimate of opex associated with heavy rain
and flood-related outages (Section 3.3.5) by Essential Energy’s revealed opex for
each year of the period 2014-2017. Our estimated % OEFs are shown in Figure
20 below.
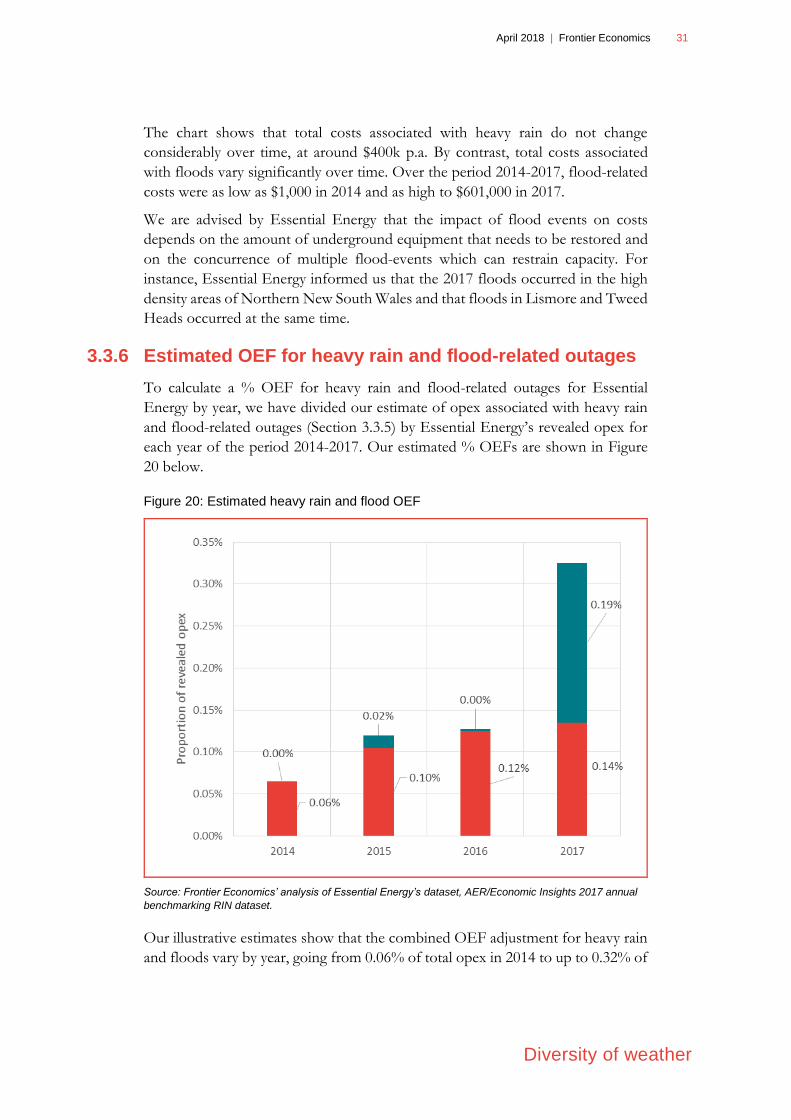
Figure 20: Estimated heavy rain and flood OEF
Source: Frontier Economics’ analysis of Essential Energy’s dataset, AER/Economic Insights 2017 annual
benchmarking RIN dataset.
Our illustrative estimates show that the combined OEF adjustment for heavy rain
and floods vary by year, going from 0.06% of total opex in 2014 to up to 0.32% of
April 2018 | Frontier Economics 32
Diversity of weather
total opex in 2017. The yearly variations appear to be mainly driven by costs
associated with flood-related outages.
3.4 Bushfire
Bushfire risk, like exposure to lighting, wind and rain, is an exogenous weather-
related operating environment factor. However, we note that while costs
associated with lightning, wind and rain are predominantly related to the costs of
repairing the network following the impact of an outage on assets, the costs
associated with bushfires predominantly relate to asset inspection and maintenance
in order to prevent bushfires. We understand that the estimated cost of Essential
Energy’s bushfire mitigation pre-summer inspection program for 2017/18 is
$1.4m, which is roughly 0.4% of Essential Energy estimated total opex for the year.
We understand that this cost only covers Essential Energy’s inspection program.
Additional costs associated with bushfires, including defect rectification costs are
not included in this estimate.
As outlined in Essential Energy’s annual bushfire risk management report
2016/17:21
Essential Energy operates a predominantly rural network generally considered to be
bushfire prone environments with different degrees of risk to the public from low to
high. The combination of oil-bearing eucalyptus trees, dry grass, low humidity, and
hot, gusty winds result in periods of high fire risk. Fires can cause enormous property,
livestock and wildlife losses and pose a real threat to human life
Essential Energy has identified locations which are considered to be generally bushfire
prone. The bushfire prone lands are further segmented into fire risk classifications
based on fire risk modelling. Fire risk priority classifications (P1, P2, P3, P4) are used
to determine fire mitigation work priorities, presummer inspection requirements,
investment program priorities, and operational procedures.
21 Essential Energy annial bushfire management report (2016/17): This can be found here:
file:///C:/Users/sucheta/Downloads/IPART%20Bushfire%20Report%202017.pdf

April 2018 | Frontier Economics 33
Diversity of weather
Figure 21: Essential Energy’s fire risk prioritisation zones
Source: Essential Energy’s annual bushfire risk management report 2016/17
April 2018 | Frontier Economics 34
Fauna
4 Fauna
Our analysis in this section demonstrates that fauna is an important candidate
OEF.
Section 4.1.1 summarises the Category Analysis RIN data on the number of
fauna-related outages reported by each DNSP between 2009 and 2016. It can
be seen that Essential Energy experienced the second-highest annual average
number of fauna-related outages during this period.
Section 4.1.2 presents our estimate of the average cost per fauna-related
outage, using data provided by Essential Energy.
Section 4.1.3 provides our estimate of the total opex per annum associated
with fauna-related outages by DNSP, using the number of fauna-related
outages from Section 4.1.1 and the estimated cost per fauna-related outage
from Section 4.1.2.
Section 4.1.4 summarises our estimated OEF for fauna for each DNSP, which
is calculated by dividing the estimated annual average fauna-related opex over
2009-2016 (Section 4.1.3) by the average annual revealed opex over 2009-2016
for each DNSP.
Using the approach described above, our illustrative estimate of the OEF for fauna
for Essential Energy is 0.65%.
4.1.1 Number of fauna-related outages per year by DNSP
Figure 8 below shows the average number of fauna-related outages reported by
DNSPs in the Category Analysis RIN data from 2009 to 2016.22
22 Calendar years for the Victorian DNSPs, financial years for the remaining DNSPs. Category RINs are
not available before 2009.
April 2018 | Frontier Economics 35
Fauna
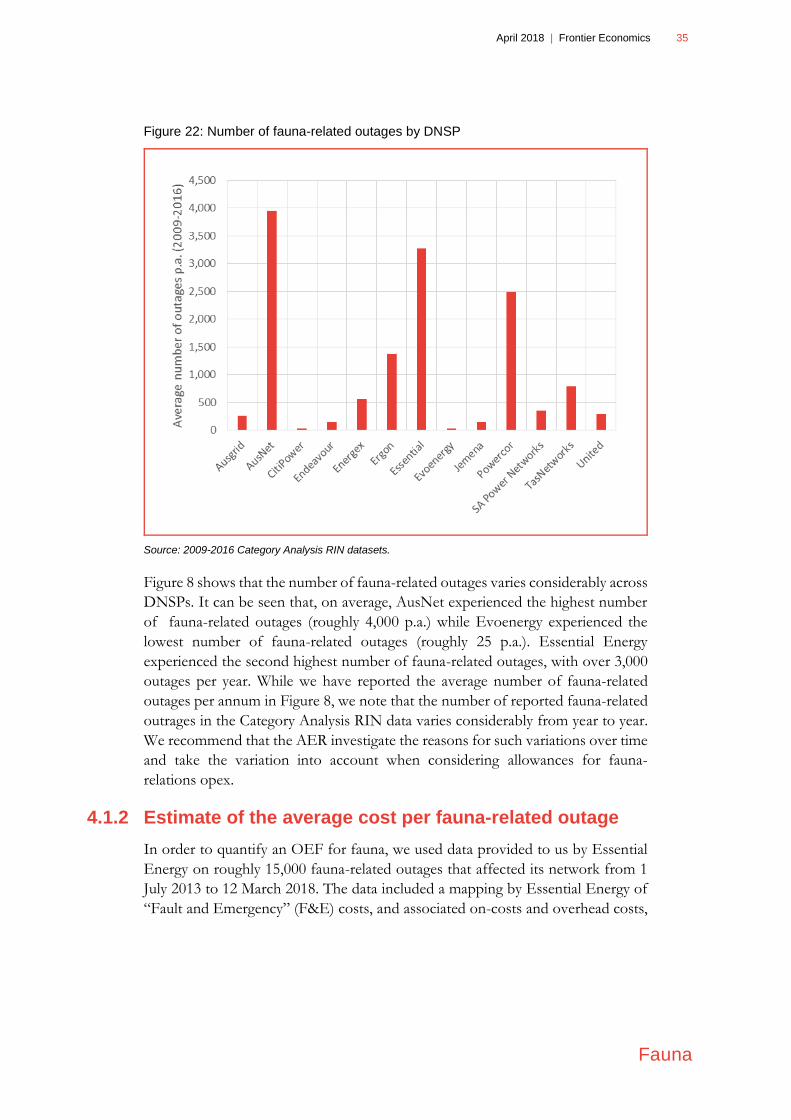
Figure 22: Number of fauna-related outages by DNSP
Source: 2009-2016 Category Analysis RIN datasets.
Figure 8 shows that the number of fauna-related outages varies considerably across
DNSPs. It can be seen that, on average, AusNet experienced the highest number
of fauna-related outages (roughly 4,000 p.a.) while Evoenergy experienced the
lowest number of fauna-related outages (roughly 25 p.a.). Essential Energy
experienced the second highest number of fauna-related outages, with over 3,000
outages per year. While we have reported the average number of fauna-related
outages per annum in Figure 8, we note that the number of reported fauna-related
outrages in the Category Analysis RIN data varies considerably from year to year.
We recommend that the AER investigate the reasons for such variations over time
and take the variation into account when considering allowances for fauna-
relations opex.
4.1.2 Estimate of the average cost per fauna-related outage
In order to quantify an OEF for fauna, we used data provided to us by Essential
Energy on roughly 15,000 fauna-related outages that affected its network from 1
July 2013 to 12 March 2018. The data included a mapping by Essential Energy of
“Fault and Emergency” (F&E) costs, and associated on-costs and overhead costs,
April 2018 | Frontier Economics 36
Fauna
to about 14,500 of these outages.23 Using this data, we calculated the average cost
per fauna-related outage to be $782.64 (real FY2016 AUD).
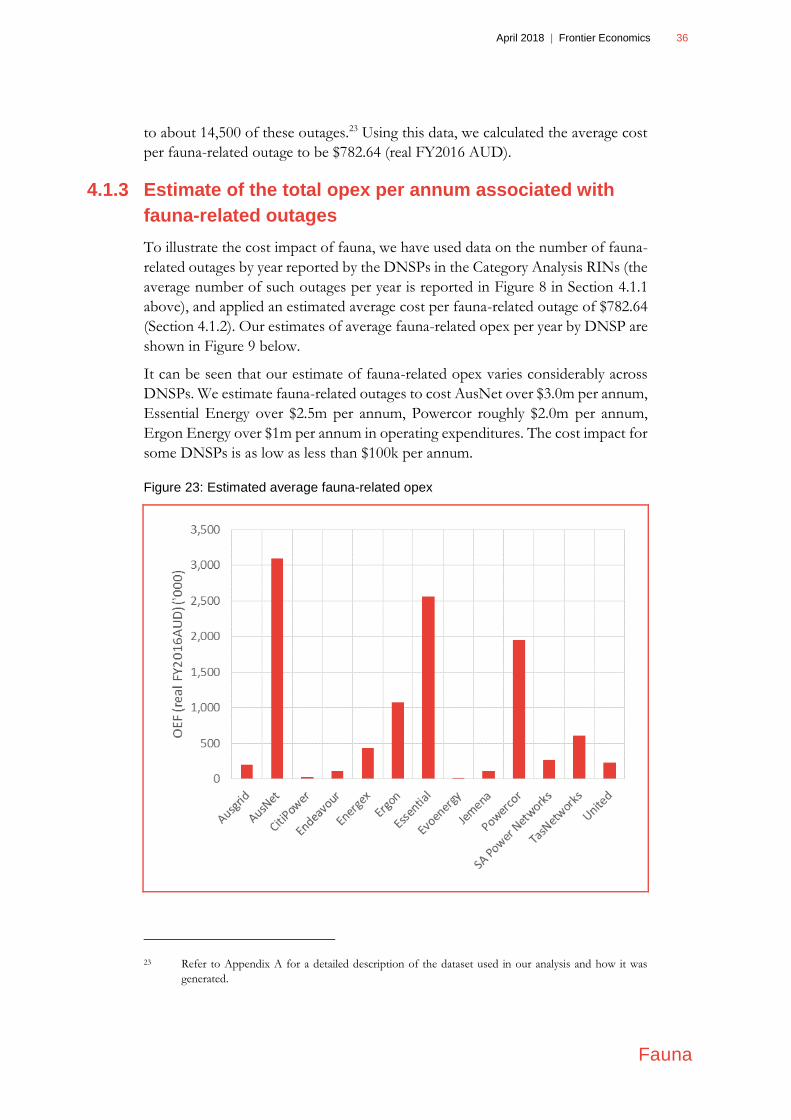
4.1.3 Estimate of the total opex per annum associated with
fauna-related outages
To illustrate the cost impact of fauna, we have used data on the number of fauna-
related outages by year reported by the DNSPs in the Category Analysis RINs (the
average number of such outages per year is reported in Figure 8 in Section 4.1.1
above), and applied an estimated average cost per fauna-related outage of $782.64
(Section 4.1.2). Our estimates of average fauna-related opex per year by DNSP are
shown in Figure 9 below.
It can be seen that our estimate of fauna-related opex varies considerably across
DNSPs. We estimate fauna-related outages to cost AusNet over $3.0m per annum,
Essential Energy over $2.5m per annum, Powercor roughly $2.0m per annum,
Ergon Energy over $1m per annum in operating expenditures. The cost impact for
some DNSPs is as low as less than $100k per annum.
Figure 23: Estimated average fauna-related opex
23 Refer to Appendix A for a detailed description of the dataset used in our analysis and how it was
generated.

April 2018 | Frontier Economics 37
Fauna
Source: Frontier Economics’ analysis of cost data provided by Essential Energy, 2009-2016 Category RIN
datasets.
4.1.4 Estimated OEF for fauna-related outages
To calculate a % OEF for fauna for each DNSP, we have divided our estimate of
average annual fauna-related opex over the period 2009-2016 (Section 4.1.3) by the
average annual revealed opex over the period 2009-2016 for each DNSP. Our
illustrative estimated % OEFs for fauna by DNSP are shown in Figure 10 below.
Our illustrative estimate of the OEF for fauna is 1.67% for AusNet, 1.12% for
Powercor, 0.65% for Essential Energy, and as low as 0.03% for Evoenergy.
Figure 24: Estimated fauna OEF
Source: Frontier Economics’ analysis of cost data provided by Essential Energy, 2009-2016 Category RIN
datasets.


April 2018 | Frontier Economics 39
Proportion of timber poles
5 Proportion of timber poles
Our analysis in this section demonstrates that timber poles are an important
candidate OEF.
Section 5.1.1 below shows that there is considerable heterogeneity in the
configuration of poles across the Australian DNSPs. It can be seen that
Essential Energy has a relatively high proportion of timber poles when
compared to the majority other networks.
Section 5.1.2 summarises evidence from the CSIRO which shows that there is
significant geographic variation in the risk of exposure to fungi that cause
timber decay. It can be seen that Essential Energy has a larger proportion of
its service area in high risk zones for such fungi compared to the majority of
other service providers.
Section 5.1.3 shows that over 23% of Essential Energy’s poles are located in
zones where the risk of attack by decay-causing fungi is higher than the timber
poles owned by the Victorian DNSPs.
Section 5.1.4 provides Essential Energy’s estimate of the additional opex per
annum, applying its serviceability criteria, associated with the ownership of
timber poles compared to non-timber poles.
Section 5.1.5 summarises our estimated OEF for timber poles for Essential
Energy, which is calculated by dividing Essential Energy’s estimate of the
additional opex per annum associated with the ownership of timber poles
(Section 5.1.4) by the average annual revealed opex over the period 2006-2016
for each DNSP.
Using the approach described above, our illustrative estimate of the OEF for
timber poles for Essential Energy is 0.7%.
5.1.1 Variation in proportion for timber poles across DNSPs
Figure 25 summarises the types of poles used by DNSPs in the NEM. It can be
seen that there is considerable heterogeneity in the types of poles used across
DNSPs, with the six DNSPs in New South Wales, Queensland and Tasmania
having a higher proportion of timber poles (close to 90% and above) than DNSPs
in Victoria and South Australia.

April 2018 | Frontier Economics 40
Proportion of timber poles
Figure 25: Proportion of poles by pole type
Source: Frontier Economics’ calculations using Category Analysis RIN data. 2015 Category Analysis RIN
data for Victorian DNSPs except AusNet, 2014 Category Analysis RIN data for AusNet, and 2016 Category
Analysis RIN data for the remaining DNSPs.
5.1.2 Geographic variation in exposure to timber decay fungi
The prevelance of timber decay in a DNSP’s network area depends on the
proportion of its pole configuration that is timber, the type of timber, and the
intensity of factors causing timber decay in its network area. Section 5.1.1 showed
that Essential Energy has a relatively high proportion of timber poles when
compared to the majority of the other networks. In this section we demonstrate
that it is more exposed to the factors causing timber decay than other service
providers, with the exception of Energex and Ergon Energy.
Figure 26 below presents CSIRO’s hazard map of Australia for the intensity of in-
ground timber attack by fungi decay. The map divides Australia into four distinct
hazard zones. Zone A is least hazardous, and Zone D is the most hazardous. It
can be seen that the area along the NSW coastline, which is serviced by Essential
Energy, has been classified by the CSIRO as Zone C, which is the second most
hazardous area.

April 2018 | Frontier Economics 41
Proportion of timber poles
Figure 26: CSIRO hazard zones for timber in-ground
Source: CSIRO Forest and Timber Products Australia, Manual 324
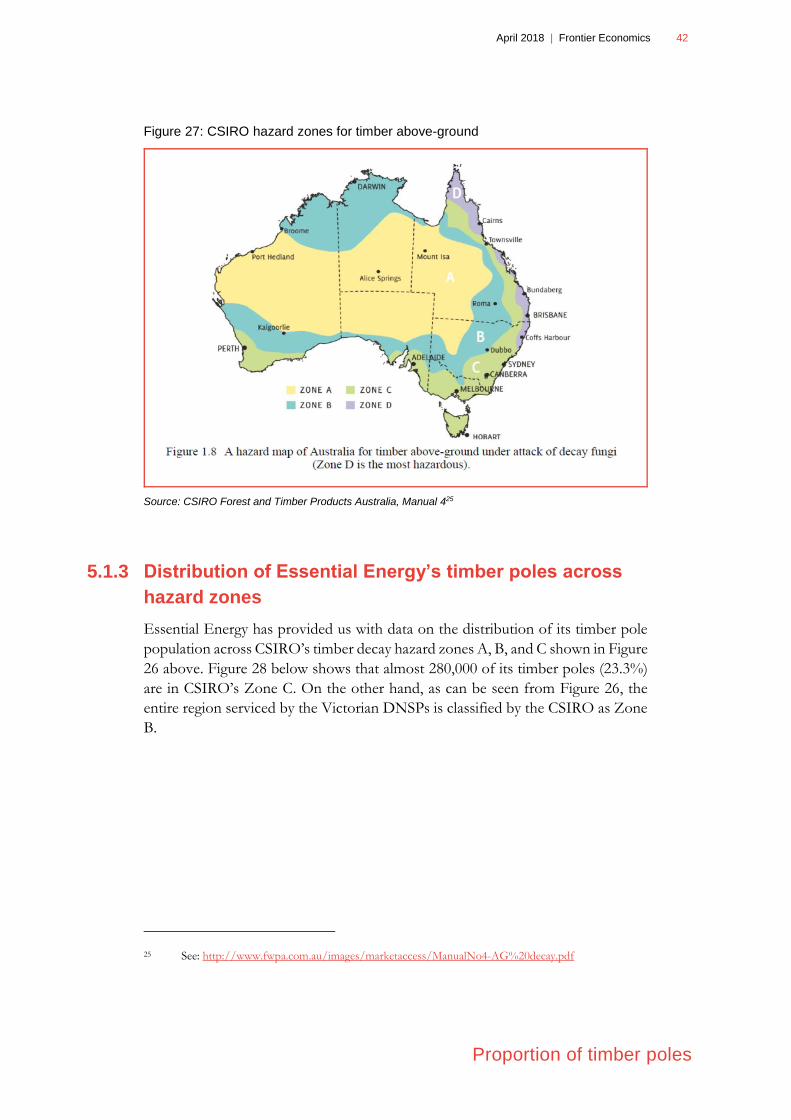
Figure 27 below presents CSIRO’s hazard map of Australia for attack of above-
ground timber by decay fungi, which is applicable to the above-ground timber arms
of poles. It can be seen that the area around Tweed Head and Coffs Harbour,
which is serviced by Essential Energy, has been classified by the CSIRO as Zone
D, which is the most hazardous area.
24 See:http://www.fwpa.com.au/images/marketaccess/ManualNo3-IG%20Decay.pdf
April 2018 | Frontier Economics 42
Proportion of timber poles
Figure 27: CSIRO hazard zones for timber above-ground
Source: CSIRO Forest and Timber Products Australia, Manual 425
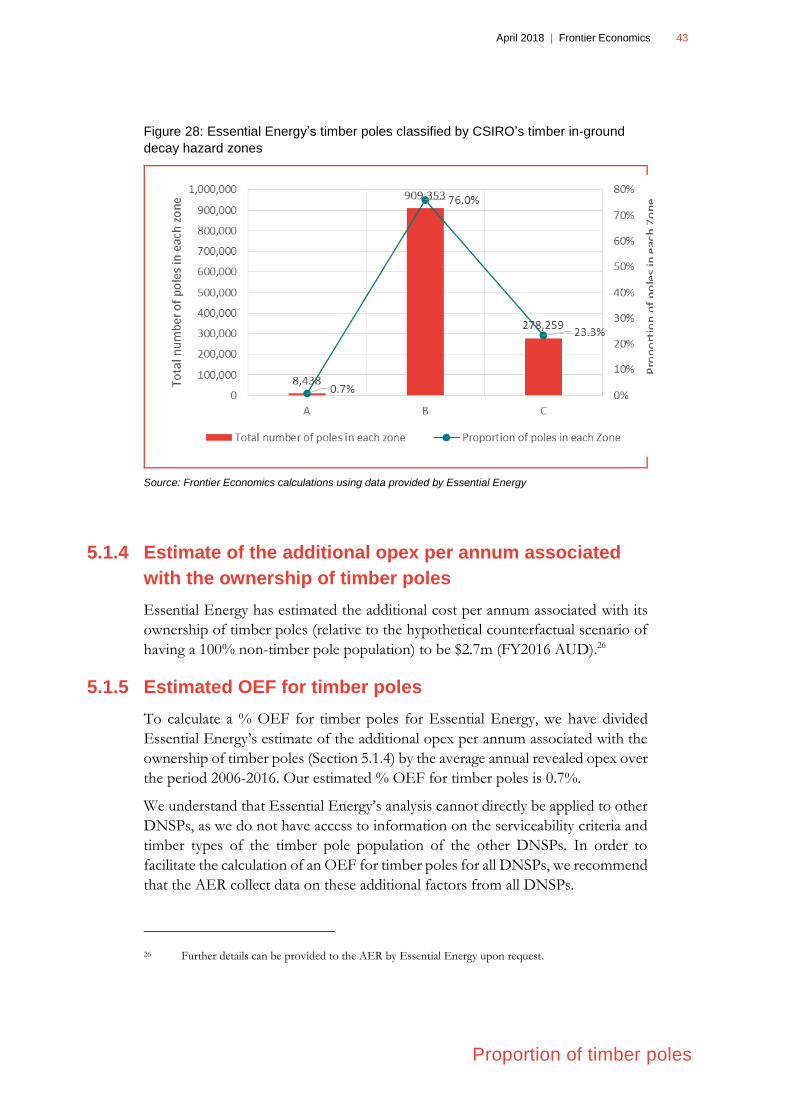
5.1.3 Distribution of Essential Energy’s timber poles across
hazard zones
Essential Energy has provided us with data on the distribution of its timber pole
population across CSIRO’s timber decay hazard zones A, B, and C shown in Figure
26 above. Figure 28 below shows that almost 280,000 of its timber poles (23.3%)
are in CSIRO’s Zone C. On the other hand, as can be seen from Figure 26, the
entire region serviced by the Victorian DNSPs is classified by the CSIRO as Zone
B.
25 See: http://www.fwpa.com.au/images/marketaccess/ManualNo4-AG%20decay.pdf
April 2018 | Frontier Economics 43
Proportion of timber poles
Figure 28: Essential Energy’s timber poles classified by CSIRO’s timber in-ground
decay hazard zones
Source: Frontier Economics calculations using data provided by Essential Energy
5.1.4 Estimate of the additional opex per annum associated
with the ownership of timber poles
Essential Energy has estimated the additional cost per annum associated with its
ownership of timber poles (relative to the hypothetical counterfactual scenario of
having a 100% non-timber pole population) to be $2.7m (FY2016 AUD).26
5.1.5 Estimated OEF for timber poles
To calculate a % OEF for timber poles for Essential Energy, we have divided
Essential Energy’s estimate of the additional opex per annum associated with the
ownership of timber poles (Section 5.1.4) by the average annual revealed opex over
the period 2006-2016. Our estimated % OEF for timber poles is 0.7%.
We understand that Essential Energy’s analysis cannot directly be applied to other
DNSPs, as we do not have access to information on the serviceability criteria and
timber types of the timber pole population of the other DNSPs. In order to
facilitate the calculation of an OEF for timber poles for all DNSPs, we recommend
that the AER collect data on these additional factors from all DNSPs.
26 Further details can be provided to the AER by Essential Energy upon request.
April 2018 | Frontier Economics 44
Additional OEFs yet to be assessed in
detail
6 Additional OEFs yet to be assessed in detail
The OEFs that we attempted to assess in detail over the course of our work are
set out in Sections 2 to 5 above. We note that there are a number of additional
OEFs which may create material differences between the DNSPs and are not
accounted for in the AER’s econometric benchmarking model. As set out in
Section 2.1 of our February 2018 OEFs report, differences in the operating
expenditures incurred by the DNSPs can arise from a number of potential sources,
including (but not necessarily limited to) differences in:
● core cost drivers (e.g., network scale, demand);
● operating environment (e.g., density, climate, topography, soil properties,
vegetation, and the urban/rural nature of certain areas);
● regulatory obligations;
● scope of activities (e.g., sharing of vegetation management roles with local
councils);
● input prices (e.g., labour rates);
● cost allocation policies and reporting practices;
● past (legacy) network configuration decisions (e.g., ownership of
subtransmission assets, historical choices in the way networks were
constructed) and planning constraints that cannot be altered easily or efficiently
within a short period of time; and
● current managerial and operating efficiency.
All of these factors can influence (increase or reduce) a DNSP’s actual or reported
opex compared to other DNSPs. However, for the purposes of determining
efficiency adjustments in regulatory proceedings, it is only excess cost due to the
last type of underlying difference in the above list – genuine differences in current
managerial and operating efficiency – that should be measured. Differences in
measured performance due to the other factors mentioned above should not be
used to justify the imposition of efficiency adjustments.
Of the factors listed above, Essential Energy has attempted to gather evidence in
relation to the following.
● Vegetation management
● Jurisdictional differences, such as differences in licence conditions
● Corrosion
● Termites
● Competition from mining
● Sparsity

April 2018 | Frontier Economics 45
Additional OEFs yet to be assessed in
detail
● Network accessibility
● Cyclones
● Materials availability
● Smart meters
● Backyard reticulation
While some of Essential Energy’s work in relation to the above has been shared
with Frontier Economics, we have been unable to review and comment on
Essential Energy’s work in all these areas within the timeframes for this project.
We note, however, that evidence from external sources such as the BOM and
CSIRO suggests that there is genuine heterogeneity in circumstance in relation to
a number of the factors above, warranting their further investigation.
We recommend that the AER allow more time for Essential Energy to make
further submissions in relation to additional OEFs that are not discussed in
Sections 2 to 5 above. Furthermore, we recommend that with further data
collection and time, a bespoke methodology be developed for assessing the OEFs
listed above, and any additional OEFs that are considered to be material by the
AER, the other DNSPs and relevant stakeholders. The types of bespoke
approaches that may be applied are illustrated in our assessment of the OEFs for
subtransmission (Section 2), diversity of weather (Section 3), fauna (Section 4) and
timber poles (Section 5). Our recommended process for the assessment of such
additional OEFs is set out in Section 7 below.
April 2018 | Frontier Economics 46
Recommendations for the AER
7 Recommendations for the AER
In our February 2018 OEFs report,27 we set out in detail our proposed framework
for accounting for OEFs in the AER’s benchmarking. The analysis presented in
the present report is our first attempt at developing a bespoke methodology for
the quantification of a small subset of OEFs that are relevant for Essential Energy.
In the remainder of this section, we summarise the key recommendations for the
AER set out in our February 2018 OEFs report, and outline how the analysis
presented in this report can be improved in collaboration with the AER, other
DNSPs and key stakeholders.
7.1 Need for further consultation
At present, there is little agreement on which OEFs should be accounted for within
the benchmarking analysis. Whilst the AER’s current consultation process takes a
step towards addressing this question, in our view a much more extensive
consultation and engagement process (between the AER and relevant
stakeholders) is required in order to determine the most important factors that
could be driving differences in DNSPs’ opex that are not accounted for within the
AER’s benchmarking models.
Clearly, the factors not accounted for in the AER’s benchmarking models will
depend on how those models are specified. The AER itself has indicated that more
work needs to be done to improve its benchmarking models and techniques.
Therefore, the question of what OEFs should be quantified and adjusted for
cannot be divorced from the process of reviewing and improving the AER’s
benchmarking models: these two processes need to occur together.
We recommend that efforts to improve the AER’s benchmarking analysis and
approach to OEFs should not be viewed by DNSPs or the AER as a one-off
investment but, rather, as an iterative process that improves gradually the quality
of information and analysis available to the regulator, the businesses and
consumers as a means of promoting better regulatory outcomes. Our analysis
presented in this report should be seen as a preliminary step in this process.
27 See Attachment C of Essential Energy’s submission to the AER:
https://www.aer.gov.au/system/files/Essential%20Energy%20-
%20Submission%20on%20review%20of%20Operating%20Environment%20Factors%20for%20Di
stribution%20Network%20Service%20Providers%20-%2016%20February%202018.pdf

April 2018 | Frontier Economics 47
Recommendations for the AER
7.2 Need for bespoke methodology for each OEF
Once agreement is reached on the most important OEFs to be accounted for, a
process will be required to decide how each of these OEFs should be quantified
in a systematic and reliable manner.
As shown from our preliminary analysis in Sections 2 to 5, owing to the wide-
ranging characteristics of relevant OEFs, there is unlikely to be a ‘standard’
approach that can be applied to quantifying all (or even some) OEFs. It is more
likely that the quantification of each OEF will require a bespoke calculation. The
process for agreeing how each OEF should be quantified would entail:
● developing an appropriate methodology for quantification;
● identifying the data required to apply each method, including the data that can
be sourced from preferred third-party sources such as the BOM, CSIRO;
● agreeing on the sources of data that should be used; and
● developing data templates and detailed, standardised data definitions if (as is
likely) some of the data are to be collected from DNSPs.
We note that our illustrative quantification of OEFs in Sections 2 to 5 can be
improved significantly through the process identified above. Our bespoke
methodology for calculating each OEF should and can be improved with further
consultation with stakeholders, further data collection, and support from the AER.
Furthermore, we believe that analogous to the approaches illustrated in Sections 2
to 5, a bespoke methodology can be developed for quantifying each of the OEFs
in Section 6, which we are yet to assess in detail.
7.3 Need for further data collection
There are, at present, major gaps in the data required to quantify and adjust
appropriately for the most material OEFs. Reliance on only the data presently
available to the AER has two major disadvantages:
● Firstly, the data are limited in their scope and coverage, which in turn may limit
considerably and unreasonably the OEFs that the AER can quantify. This
could result in important OEFs being omitted from the analysis, or being
adjusted for in an ad hoc fashion.
● Secondly, as the data currently available to the AER have not been tested
thoroughly and corrected for errors, there can be little confidence that the data
are reliable or reported consistently (e.g., if some DNSPs have misinterpreted

April 2018 | Frontier Economics 48
Recommendations for the AER
the data that should be reported).28 If the data are of poor quality or are
unreliable, the resulting OEF adjustments will not provide a true indication of
the DNSPs’ relative efficiencies.
In order to overcome and avoid these problems, we recommend that the AER
work closely with DNSPs to identify the data required, and undertake a rigorous
process of checking and improving the veracity of the data, before making OEF
adjustments.
Further, we recommend that this data collection and auditing process be
undertaken in a collaborative way between the AER and the industry. This would:
● Ensure better consistency of data, as all DNSPs develop a common
understanding of the information the AER is seeking and the uses to which it
will be put;
● Help the AER to identify early any potential inconsistencies in how data are
being reported between DNSPs or over time; and
● Provide the AER with valuable opportunities to learn more about individual
businesses and their operations, which would aid its regulatory determinations
and its interpretation of the quantitative benchmarking analysis.
7.4 Need to re-consider how OEFs are applied
To date, prior to determining efficiency adjustments in regulatory proceedings, the
AER has attempted to account for OEFs only after the raw efficiency scores of its
benchmarking models have been estimated (i.e., the ex-post adjustment approach).
The key disadvantage of the ex-post approach is that the data to which the
benchmarking model is applied is not made more comparable between DNSPs
before the raw efficiency scores are estimated. As a result, the true relationship
between the DNSPs’ costs and cost drivers will be distorted by the inclusion of
non-comparable opex data.29 As a consequence the estimates of raw relative
efficiency (including the efficiency of the comparison point) will be distorted. Ex-
post adjustments for OEFs do not address the fact that the true cost relationship
by the benchmarking model will have been mis-estimated by the inclusion of non-
comparable data.
28 As discussed in Section Error! Reference source not found. of our February 2018 report, Sapere-
Merz has expressed reservations about the quality and consistency of the data available to quantify
some OEFs.
29 Technically, the omission of relevant explanatory variables leads to inconsistent estimates of the
coefficients of the model. As a result, the raw estimates of efficiency will also be biased.

April 2018 | Frontier Economics 49
Recommendations for the AER
In Section 3.2 of our February 2018 report, we described a number of alternative
approaches that could be considered, which do not suffer from the weakness
associated with the application of ex-post adjustments. These include the following.
● Including additional explanatory variables in the benchmarking model to
control for differences in OEFs.
● Making ex-ante adjustments for OEFs to the data, before those data are applied
to the benchmarking model.
● Making second-stage adjustments for OEFs after efficiency scores are
estimated.
Our recommended approach for the AER is a combination of:
● Investigating the inclusion of some additional cost driver variables in its model,
which should become more feasible over time as the sample size increases; and
● Making ex-ante adjustments for any costs associated with OEFs that are
unexplained, or poorly explained, by the cost driver variables that are included
in the model – as Ofgem does.
Second-stage adjustments could be considered as the next available option to
account for any additional factors not accounted for through the combination of
approaches above. In our view, all three of these approaches are superior to the
AER/Sapere-Merz ex-post OEF approach.
7.5 Need to interpret benchmarking results with due
caution
Finally, we note that even if the AER successfully undertakes a significant program
of ongoing improvements to its approach to benchmarking and OEFs, along the
lines we recommend, there will still be a need to treat its benchmarking results with
appropriate caution. This is because it will never be possible to account perfectly
for OEFs due to data and methodological limitations. However, this should not
deter the AER from embarking on a program to improve significantly its existing
approach to OEFs. It is clear to us that with cooperation between the AER, the
DNSPs and other stakeholders, the usefulness of the AER’s economic
benchmarking analysis can be enhanced greatly.


April 2018 | Frontier Economics 51
Appendix A: Data provided by Essential
Energy
8 Appendix A: Data provided by Essential
Energy
We are advised that Essential Energy’s asset management, network operations and
financial systems are not fully integrated. In order to provide the data required for
our targeted assessment of weather-related and fauna-related OEFs in Sections 3
and 4, respectively, we understand that Essential Energy has amalgamated a
number of disparate datasets from different sources. Below is a brief description
of Essential Energy’s matching of data from different sources, which has been
provided to us by Essential Energy. Further details in relation to this data can be
provided by Essential Energy to the AER upon request.
Matching of costs to outages
Data was obtained from three systems to enable matching of outages to costs:
● Outage data was obtained from Essential Energy’s reliability database
which captures causes of outages as identified by field staff on site, or by
system operators.
● the Single Point of Contact (SPOC) officers called to engage resources to
attend to an outage out of Essential Energy’s Distribution Management
System; and
● timesheet data for employees booked to Fault and Emergency tasks out of
Essential Energy’s finance system.
For each outage the ‘home’ depot of the outage was identified as follows
● Fault and emergency project codes in the finance system are classified to
the depot that would normally service that area. However, in fault and
emergency situations, staff from different ‘home’ depots may attend
outages in a different depot area. This means the nominal home depot list
of employees cannot be used to match to the outage. A separate list of
employees mapped to fault and emergency since 2013 was constructed
listing the ‘home’ depot they worked in for outages.
● The above list was mapped to the outages permitting a mapping between
employees who worked in the area since 2013 and any outage.
Using the above employee mapping, the cost data was mapped to outages as
follows for different working times;
● Ordinary Time: Essential Energy’s finance system only captures total hours
worked on fault and emergency during normal business hours against the
‘home’ depot fault and emergency project code. For example, an employee
may record 4 hours of fault and emergency work during the day but it is
not known what time they worked or on how many outages they worked.

April 2018 | Frontier Economics 52
Appendix A: Data provided by Essential
Energy
● To match these costs, the ‘home’ depot of the outage and employees who
worked in the ‘home’ depot for the date of the outage in normal business
hours was used to match to the outages on that day. This matching on
occasion would result in more than one outage being matched, in these
cases the costs were averaged by the number of outages and allocated to
the outages accordingly.
● Overtime: In the case of overtime, the start time (punch-in time) and finish
time (punch-out time) is recorded in Essential Energy’s financial system
along with the ‘home’ depot via the project code. However, it is not known
how many outages an employee may have attended in that time. In
addition, there is a minimum call out rate of 2 hours paid to all employees30.
To match these costs to outages, the ‘home’ depot and employees who
worked in these depots were mapped to the outages using the punch-in
time. If the punch-in time was between the start time of the outage and the
end time of the outage, then the costs were mapped to the outage. For
multiple outage hits the costs were averaged using the same method as used
for ordinary time.
● Allowances: There are allowance payable on for on-call, or for leading
hand, or for meals. These allowances are directly matched to the overtime
costs noted above and the matching to outages is identical to the method
used for overtime costs.
The match process did not provide costs for all outages, nor were all the costs
obtained from the finance system mapped to outages. There are several reasons
for this lack of matching. As an example not all outages require field staff
attendance, they can be restored remotely.
Allocation of on-costs and overhead costs
The cost matching exercise discussed above was performed using unloaded
nominal labour costs to which on costs and overheads need to be applied to reflect
total costs incurred by Essential Energy.
On Costs
On costs reflect the costs associated with labour covering superannuation, annual
leave, and other employee entitlements such as long service leave valued as
mandated by NSW treasury. On cost rates are influenced by the prevailing bond
rates during the fiscal year and the adjustments vary accordingly.
30 Essential Energy’s 2017 Enterprise Agreement introduced a minimum call out pay from 4 hours to 2
hours. To reflect this change, the costs for fault and emergency overtime were recalculated to the 2
hour minimum call out such that the historical data set is reflective of current costs.
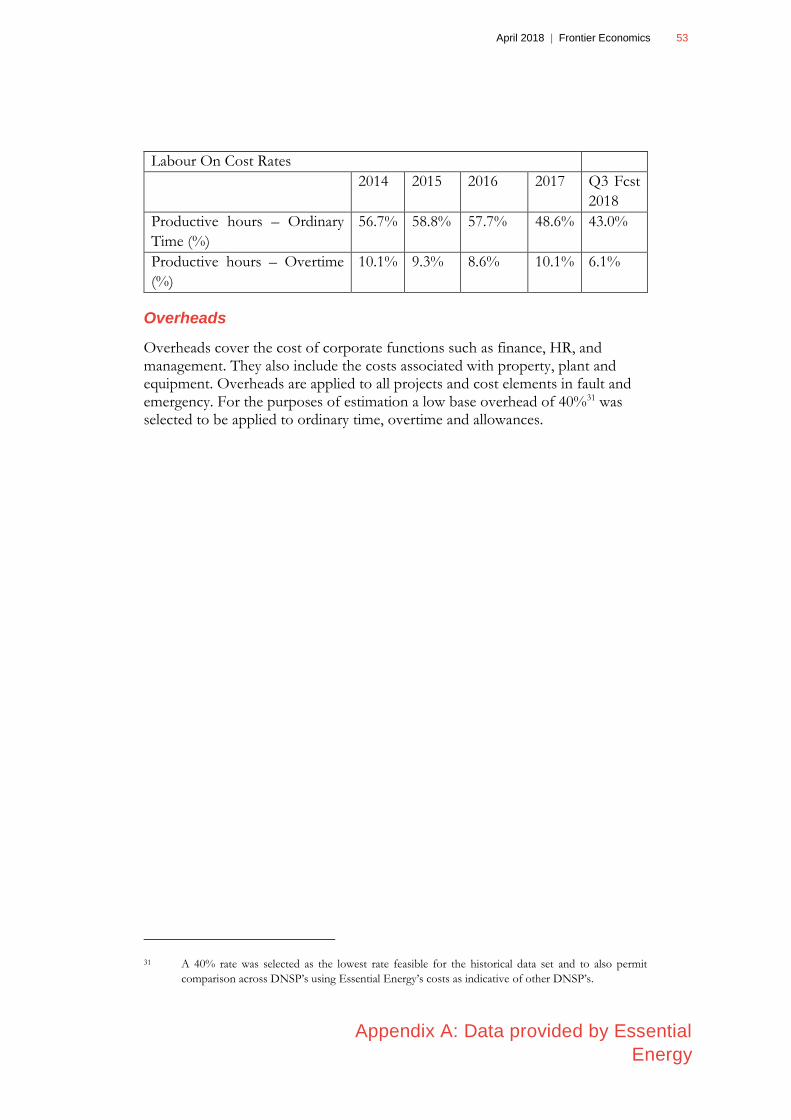
April 2018 | Frontier Economics 53
Appendix A: Data provided by Essential
Energy
Labour On Cost Rates
2014 2015 2016 2017 Q3 Fcst
2018
Productive hours – Ordinary
Time (%)
56.7% 58.8% 57.7% 48.6% 43.0%
Productive hours – Overtime
(%)
10.1% 9.3% 8.6% 10.1% 6.1%
Overheads
Overheads cover the cost of corporate functions such as finance, HR, and management. They also include the costs associated with property, plant and equipment. Overheads are applied to all projects and cost elements in fault and emergency. For the purposes of estimation a low base overhead of 40%31 was selected to be applied to ordinary time, overtime and allowances.
31 A 40% rate was selected as the lowest rate feasible for the historical data set and to also permit
comparison across DNSP’s using Essential Energy’s costs as indicative of other DNSP’s.


Frontier Economics Pty Ltd in Australia is a member of the Frontier Economics network, and consists of companies based in Australia (Melbourne, Sydney & Brisbane) and Singapore. Our sister company, Frontier Economics Ltd, operates in Europe (Brussels, Cologne, Dublin, London & Madrid). The companies are independently owned, and legal commitments entered into by any one company do not impose any obligations on other companies in the network. All views expressed in this document are the views of Frontier Economics Pty Ltd.
Disclaimer
None of Frontier Economics Pty Ltd (including the directors and employees) make any representation or warranty as to the accuracy or completeness of this report. Nor shall they have any liability (whether arising from negligence or otherwise) for any representations (express or implied) or information contained in, or for any omissions from, the report or any written or oral communications transmitted in the course of the project.

FRONTIER ECONOMICS
BRISBANE | MELBOURNE | SINGAPORE | SYDNEY
Frontier Economics Pty Ltd 395 Collins Street Melbourne Victoria 3000
Tel: +61 (0)3 9620 4488 Fax: +61 (0)3 9620 4499 www.frontier-economics.com.au
ACN: 087 553 124 ABN: 13 087 553 124