opensees three-dimensional computational modeling of ground...
TRANSCRIPT

Computer Modeling in Engineering & Sciences CMES, vol.120, no.3, pp.629-656, 2019
CMES. doi: 10.32604/cmes.2019.05759 www.techscience.com/cmes
OpenSees Three-Dimensional Computational Modeling of Ground-Structure Systems and Liquefaction Scenarios
Zhijian Qiu1, Jinchi Lu1, Ahmed Elgamal1, *, Lei Su2, Ning Wang3 and
Abdullah Almutairi1
Abstract: The OpenSees computational platform has allowed unprecedented opportunities for conducting seismic nonlinear soil-structure interaction simulations. On the geotechnical side, capabilities such as coupled solid-fluid formulations and nonlinear incremental-plasticity approaches allow for representation of the involved dynamic/seismic responses. This paper presents recent research that facilitated such endeavors in terms of response of ground-foundation-structure systems using advanced material modeling techniques and high-performance computing resources. Representative numerical results are shown for large-scale soil-structure systems, and ground modification liquefaction countermeasures. In addition, graphical user interface enabling tools for routine usage of such 3D simulation environments are presented, as an important element in support of wider adoption and practical applications. In this context, Performance-Based Earthquake Engineering (PBEE) analysis of bridge-ground systems is highlighted as an important topical application. Keywords: Numerical simulation, OpenSees, geotechnical, earthquake, soil liquefaction, seismic response.
1 Introduction With the recent developments in material modeling techniques and high-speed computing, three-dimensional (3D) nonlinear Finite Element (FE) simulations are becoming increasingly feasible for geotechnical earthquake engineering applications [Elgamal, Yan, Yang et al. (2008); Kwon and Elnashai (2008); Asgari, Oliaei and Bagheri (2013); Torabi and Rayhani (2014); McGann and Arduino (2014, 2015); Rayamajhi, Nguyen, Ashford et al. (2013); Rayamajhi, Ashford, Boulanger et al. (2016a); Rayamajhi, Boulanger, Ashford et al. (2016b); Su, Lu, Elgamal et al. (2017)]. Calibration, on the basis of data from field case histories as well as centrifuge and shake table experiments, is gradually allowing for more accurate computational modeling efforts [Lu, Elgamal, Yan et al. (2011); Chang, Boulanger, Brandenberg et al. (2013); Karimi and Dashti (2015, 2016); He, Ramirez, Lu et al. (2017); Su, Wan, Li et al. (2018)]. As such, calibrated FE simulations are increasingly
1 Department of Structural Engineering, UC San Diego, La Jolla, CA 92093-0085, USA. 2 School of Civil Engineering, Qingdao University of Technology, Qingdao, 266033, China. 3 Institute of Geophysics, China Earthquake Administration, Beijing, 100081, China. * Corresponding Author: Ahmed Elgamal. Email: [email protected].
630 CMES, vol.120, no.3, pp.629-656, 2019
providing a reliable environment for modeling geotechnical earthquake problems, such as soil liquefaction, soil-structure interaction (SSI), and ground modification. Particularly suited to seismic applications, the open-source computational platform OpenSees [Mazzoni, McKenna and Fenves (2006); McKenna (2011)] provides such 3D simulation capabilities. Implemented in OpenSees [Yang (2000); Yang and Elgamal (2002)] is an analysis framework for saturated soil response as a two-phase material following the u-p formulation of Chan (1988) and Zienkiewicz et al. (1990) [Chan (1988); Zienkiewicz, Chan, Pastor et al. (1990)], where u is displacement of the soil skeleton, and p is pore pressure. As such, the soil domain (in 3D) is represented by effective-stress solid-fluid fully coupled brick elements [Parra (1996); Yang (2000); Lu (2006); Yang, Lu and Elgamal (2008)] to describe the solid translational degrees of freedom (DOFs) and the fluid pressure (e.g., OpenSees 20_8_BrickUP element, brickUP and bbarBrickUP elements). The OpenSees framework also includes a number of pressure-independent and pressure-dependent soil constitutive models [Parra (1996); Yang and Elgamal (2002); Elgamal, Yang, Parra et al. (2003); Yang, Elgamal and Parra (2003); Yang, Lu and Elgamal (2008)], developed based on the multi-surface-plasticity theory [Mroz (1967); Iwan (1967); Prevost (1977, 1978, 1985)]. The pressure-independent models [Elgamal (2008); Yang, Lu and Elgamal (2008); Lu, Elgamal, Yan et al. (2011)] simulate the nonlinear cyclic hysteresis material response (e.g., undrained clay-type loading conditions). The pressure-dependent material models (typically used with the above mentioned solid-fluid fully coupled brick elements) mainly aim at simulating the liquefaction-induced shear strain accumulation mechanism in cohesionless soils [Yang and Elgamal (2002); Elgamal, Yang, Parra et al. (2003); Yang, Elgamal and Parra (2003); Yang, Lu and Elgamal (2008)]. Currently, the above modeling tools have been used by the co-authors and researchers worldwide in numerous reported studies [Elgamal, Yan, Yang et al. (2008); Elgamal, Lu and Forcellini (2009); Zhang, Conte, Yang et al. (2008); Kwon and Elnashai (2008); Aygün, Dueñas-Osorio, Padgett et al. (2009, 2010); Ilankatharan and Kutter (2008, 2010); Atik and Sitar (2010); Lu, Elgamal, Yan et al. (2011); Asgari et al. 2013; Chang, Boulanger, Brandenberg et al. (2013); Torabi and Rayhani (2014); McGann and Arduino (2014, 2015); Hashash, Dashti, Romero et al. (2015); Tang, Cong, Ling et al. (2015); Rayamajhi, Nguyen, Ashford et al. (2013); Rayamajhi, Ashford, Boulanger et al. (2016a); Rayamajhi, Boulanger, Ashford et al. (2016b); Karimi and Dashti (2015, 2016); He, Ramirez, Lu et al. (2017); Su, Lu, Elgamal et al. (2017); Su, Wan, Li et al. (2018)]. In order to facilitate the OpenSees analysis pre- and post-processing phases, the graphical user interfaces OpenSeesPL [Lu, Yang and Elgamal (2006); Elgamal and Lu 2009)], BridgePBEE [Mackie, Lu and Elgamal (2012)] and MSBridge [Elgamal, Lu and Mackie (2014)] were developed and employed. OpenSeesPL allows for execution of push-over and seismic SSI pile-ground simulations [Lu, Yang and Elgamal (2006); Elgamal and Lu (2009)]. In addition, various ground modification scenarios may be studied in OpenSeesPL by appropriate specification of the material within the pile zone. BridgePBEE is a user-interface for conducting performance-based earthquake engineering (PBEE) studies for 2-span single-column bridge-ground systems [Mackie, Lu and Elgamal (2012)]. MSBridge focuses on efficiently conducting nonlinear FE studies for a wide range of multi-span

OpenSees Three-Dimensional Computational Modeling of Ground-Structure 631
bridge systems [Elgamal, Lu and Mackie (2014)], with a recently added PBEE analysis option [Elgamal, Lu, Almutairi et al. (2017); Almutairi, Lu, Elgamal et al. (2018)]. To illustrate the above analysis components, this paper presents representative ground and ground-structure studies including a large-scale pile group, a ground-bridge system, a pile-supported wharf, a stone-column liquefaction countermeasure, and bridge PBEE analysis applications. In the following sections, the pressure-independent and pressure-dependent soil constitutive models are briefly described, followed by the above-mentioned representative computational studies. Salient characteristics of the soil models are highlighted, and key results of the numerical studies are presented.
2 Soil constitutive models The pressure-independent models exhibit plasticity in the deviatoric response and the volumetric response is linear-elastic, independent of the deviatoric response. The related OpenSees materials include PressureIndependMultiyield [Elgamal, Yan, Yang et al. (2008); Lu, Elgamal, Yan et al. (2011)] and PressureIndependMultiyieldSoftening [Qiu (2020)]. The pressure-dependent material models simulate the essential characteristics of pressure sensitive soil response under general loading conditions. As such, soil is simulated by the implemented OpenSees materials PressureDependMultiYield [Parra (1996); Yang (2000); Yang and Elgamal (2002); Elgamal, Yang, Parra et al. (2003)], PressureDependMultiYield02 [Yang, Elgamal and Parra et al. (2003)], PressureDependMultiYield03 [Khosravifar, Elgamal, Lu et al. (2018)], and LadeDuncanMultiYield [Yang and Elgamal (2008); Qiu (2020)].
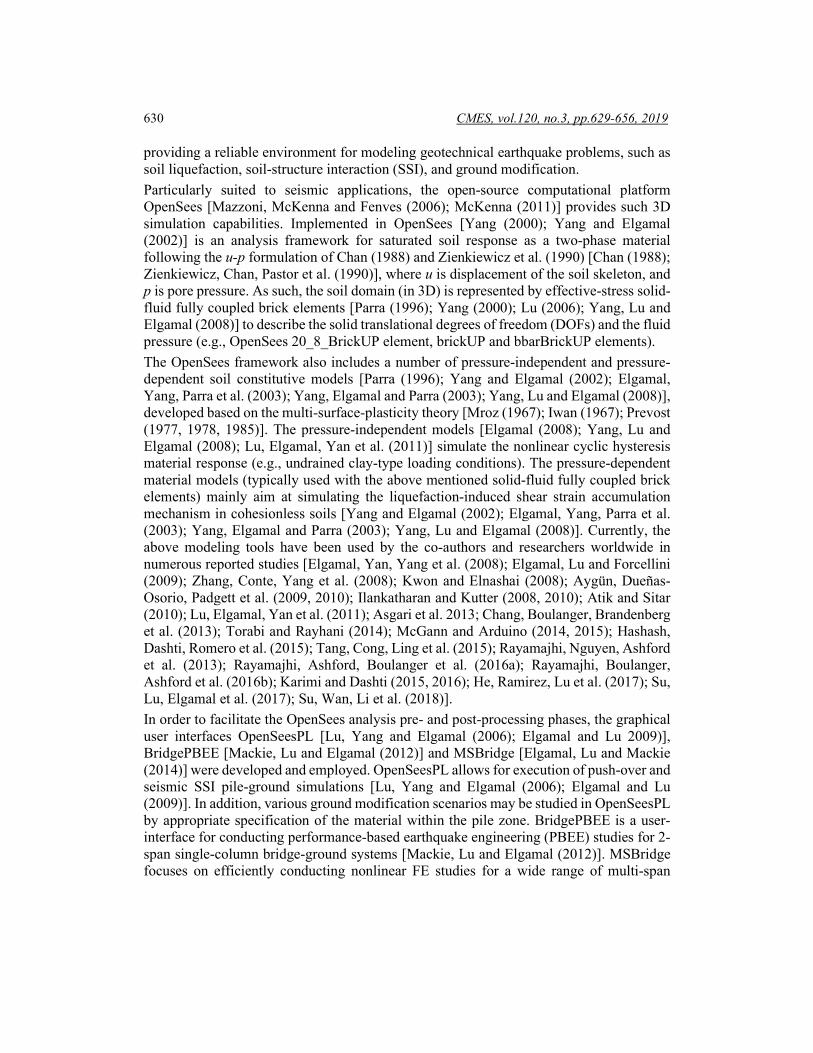
2.1 PressureIndependMultiYieldSoftening material Based on the existing multi-yield surface J2 associative plasticity formulation [Prevost (1977); Elgamal, Yan, Yang et al. (2008); Lu, Elgamal, Yan et al. (2011)], the PressureIndependMultiYield material (Fig. 1) has been implemented in OpenSees for simulating elasto-plastic undrained clay-type shear response. In this model, a hyperbolic
backbone curve 1 / r
Gγτγ γ
=+
can be employed to describe the backbone shear stress-
strain curve (Fig. 1(b)), where G is the low-strain shear modulus, τ and γ denote the octahedral shear stress and shear strain, respectively, and rγ is the reference shear strain
(computed as ( )max max max maxr Gγ γ τ γ τ= − , in which maxτ is the peak shear strength that
corresponds to the shear strain maxγ ). Alternatively, conventional shear modulus reduction (G/Gmax) curves may be conveniently employed for the specification of yield surfaces and their characteristics. Further details and model implementation specifics can be found in Prevost [Prevost (1977)] and Gu et al. [Gu, Conte, Elgamal et al. (2009); Gu, Conte, Yang et al. (2011); Gu, Qiu and Huang (2015)].
632 CMES, vol.120, no.3, pp.629-656, 2019
Figure 1: PressureIndependMultiYield material [Elgamal, Yan, Yang et al. (2008); Lu, Elgamal, Yan et al. (2011)]
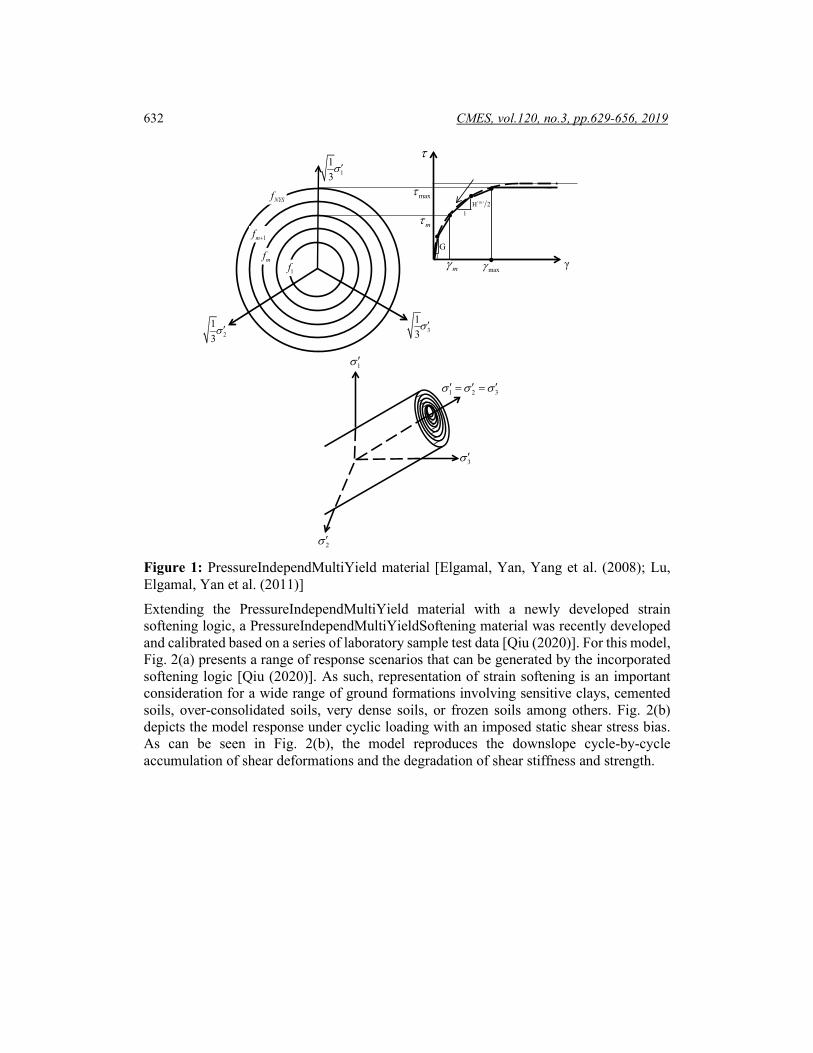
Extending the PressureIndependMultiYield material with a newly developed strain softening logic, a PressureIndependMultiYieldSoftening material was recently developed and calibrated based on a series of laboratory sample test data [Qiu (2020)]. For this model, Fig. 2(a) presents a range of response scenarios that can be generated by the incorporated softening logic [Qiu (2020)]. As such, representation of strain softening is an important consideration for a wide range of ground formations involving sensitive clays, cemented soils, over-consolidated soils, very dense soils, or frozen soils among others. Fig. 2(b) depicts the model response under cyclic loading with an imposed static shear stress bias. As can be seen in Fig. 2(b), the model reproduces the downslope cycle-by-cycle accumulation of shear deformations and the degradation of shear stiffness and strength.
113σ ′
NYSf
τ
213σ ′ 3
13σ ′
maxτ
maxγmγG
1
mH 2( )
1
γ
mτ1mf +
mf1f
1 2 3σ σ σ′ ′ ′= =
1σ ′
2σ ′
3σ ′
OpenSees Three-Dimensional Computational Modeling of Ground-Structure 633
(a) (b)
Figure 2: Model simulation of PressureIndependMultiYieldSoftening material [Qiu (2020)]: (a) Monotonic loading; (b) Cyclic loading with static shear stress bias
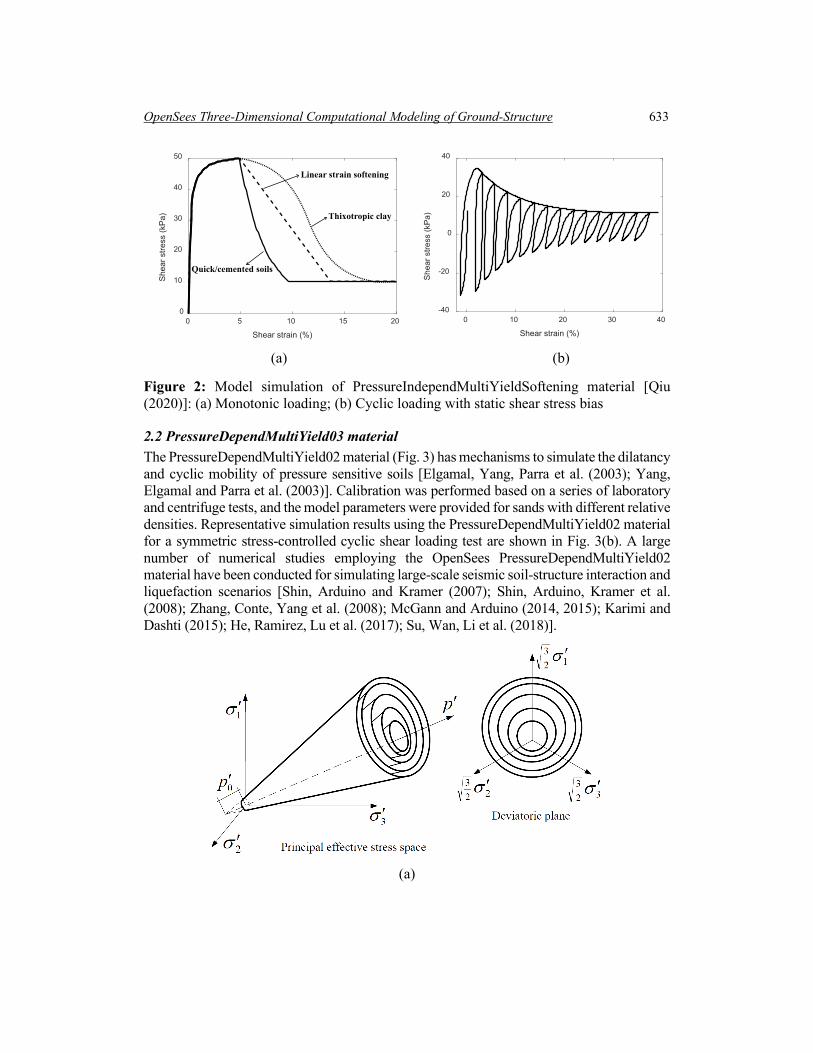
2.2 PressureDependMultiYield03 material The PressureDependMultiYield02 material (Fig. 3) has mechanisms to simulate the dilatancy and cyclic mobility of pressure sensitive soils [Elgamal, Yang, Parra et al. (2003); Yang, Elgamal and Parra et al. (2003)]. Calibration was performed based on a series of laboratory and centrifuge tests, and the model parameters were provided for sands with different relative densities. Representative simulation results using the PressureDependMultiYield02 material for a symmetric stress-controlled cyclic shear loading test are shown in Fig. 3(b). A large number of numerical studies employing the OpenSees PressureDependMultiYield02 material have been conducted for simulating large-scale seismic soil-structure interaction and liquefaction scenarios [Shin, Arduino and Kramer (2007); Shin, Arduino, Kramer et al. (2008); Zhang, Conte, Yang et al. (2008); McGann and Arduino (2014, 2015); Karimi and Dashti (2015); He, Ramirez, Lu et al. (2017); Su, Wan, Li et al. (2018)].
(a)
0 5 10 15 20
Shear strain (%)
0
10
20
30
40
50S
hear
stre
ss (k
Pa)
Quick/cemented soils
Thixotropic clay
Linear strain softening
0 10 20 30 40
Shear strain (%)
-40
-20
0
20
40
She
ar s
tress
(kP
a)
634 CMES, vol.120, no.3, pp.629-656, 2019
(b)
Figure 3: PressureDependMultiYield02 material [Yang, Elgamal and Parra et al. (2003)]: (a) Yield surfaces; (b) Model response under stress-controlled, undrained cyclic shear loading
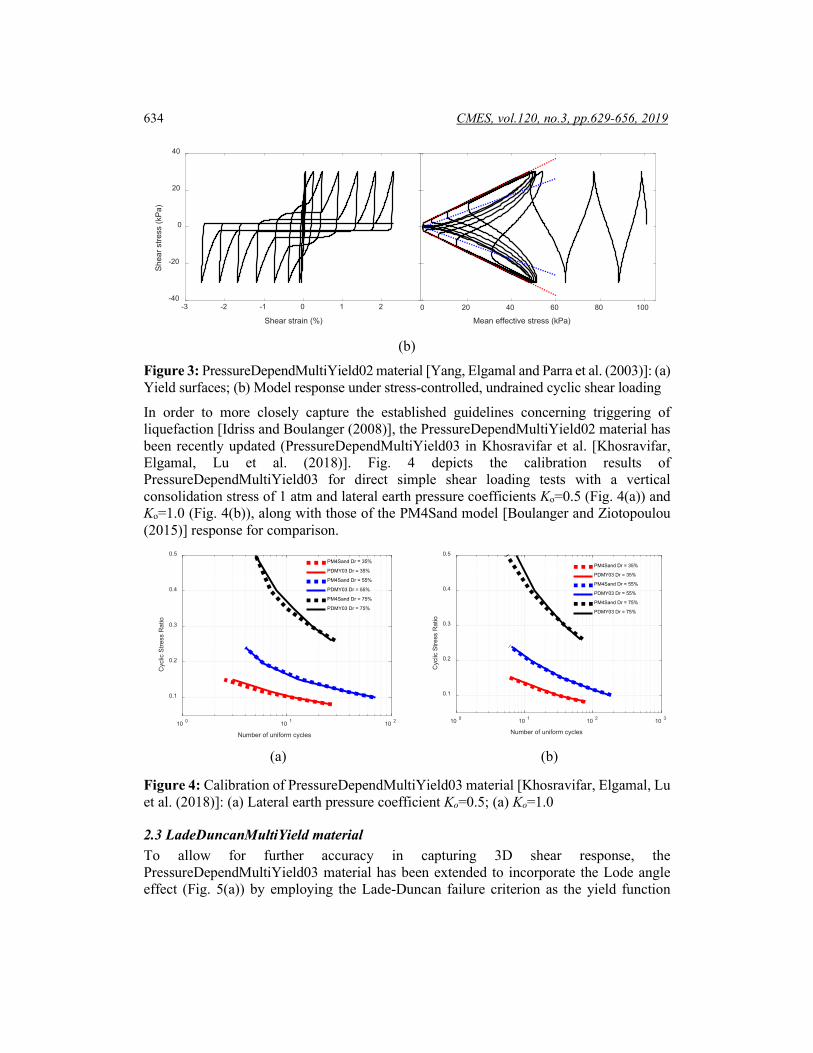
In order to more closely capture the established guidelines concerning triggering of liquefaction [Idriss and Boulanger (2008)], the PressureDependMultiYield02 material has been recently updated (PressureDependMultiYield03 in Khosravifar et al. [Khosravifar, Elgamal, Lu et al. (2018)]. Fig. 4 depicts the calibration results of PressureDependMultiYield03 for direct simple shear loading tests with a vertical consolidation stress of 1 atm and lateral earth pressure coefficients Ko=0.5 (Fig. 4(a)) and Ko=1.0 (Fig. 4(b)), along with those of the PM4Sand model [Boulanger and Ziotopoulou (2015)] response for comparison.
(a) (b)
Figure 4: Calibration of PressureDependMultiYield03 material [Khosravifar, Elgamal, Lu et al. (2018)]: (a) Lateral earth pressure coefficient Ko=0.5; (a) Ko=1.0
2.3 LadeDuncanMultiYield material To allow for further accuracy in capturing 3D shear response, the PressureDependMultiYield03 material has been extended to incorporate the Lode angle effect (Fig. 5(a)) by employing the Lade-Duncan failure criterion as the yield function
-3 -2 -1 0 1 2
Shear strain (%)
-40
-20
0
20
40S
hear
stre
ss (k
Pa)
0 20 40 60 80 100
Mean effective stress (kPa)
10 0 10 1 10 2
Number of uniform cycles
0.1
0.2
0.3
0.4
0.5
Cyc
lic S
tress
Rat
io
PM4Sand Dr = 35%
PDMY03 Dr = 35%
PM4Sand Dr = 55%
PDMY03 Dr = 55%
PM4Sand Dr = 75%
PDMY03 Dr = 75%
10 0 10 1 10 2 10 3
Number of uniform cycles
0.1
0.2
0.3
0.4
0.5
Cyc
lic S
tress
Rat
io
PM4Sand Dr = 35%
PDMY03 Dr = 35%
PM4Sand Dr = 55%
PDMY03 Dr = 55%
PM4Sand Dr = 75%
PDMY03 Dr = 75%

OpenSees Three-Dimensional Computational Modeling of Ground-Structure 635
[Lade and Duncan (1975); Yang and Elgamal (2008); Qiu (2020)]. This failure criterion is represented by Chen et al. [Chen and Mizuno (1990)]:
33 1 2 1
1
1 1 1( ) 03 27
J I J Ik
− + − = (1)
where, I1 is volumetric stress, J2 and J3 are second and third deviatoric stress invariants, respectively, parameter k1 (>27) is related to soil shear strength (or friction angle φ). A typical yield surface fm (Fig. 5(a)) is defined by Yang et al. [Yang and Elgamal (2008)]:
( ) ( )33 1 2 1 1
1 03m m mf J I J a Iη η= − + = (2)
where ηm is a normalized yield surface size (0<ηm<1) and material parameter 𝑎𝑎1 = 127− 1
𝑘𝑘1
[Yang and Elgamal (2008)]. In Eq. (2), 21 :2
J = S S and ( )31 :2
J = ⋅S S S , where,
p′= −S S a and 2p′= −S σ I is the deviatoric stress tensor, 1
3Ip′ = is mean effective
stress ( 1 3I p′= ), 2I is 2nd unit tensor, deviatoric tensor a is back stress (yield surface center), and the operators “·”and “:” denote single and double contraction of two tensors, respectively.
(a)
Experimental
-10 0 10
Axial strain (%)
-100
-50
0
50
100
Dev
iato
r stre
ss (k
Pa)
636 CMES, vol.120, no.3, pp.629-656, 2019
(b)
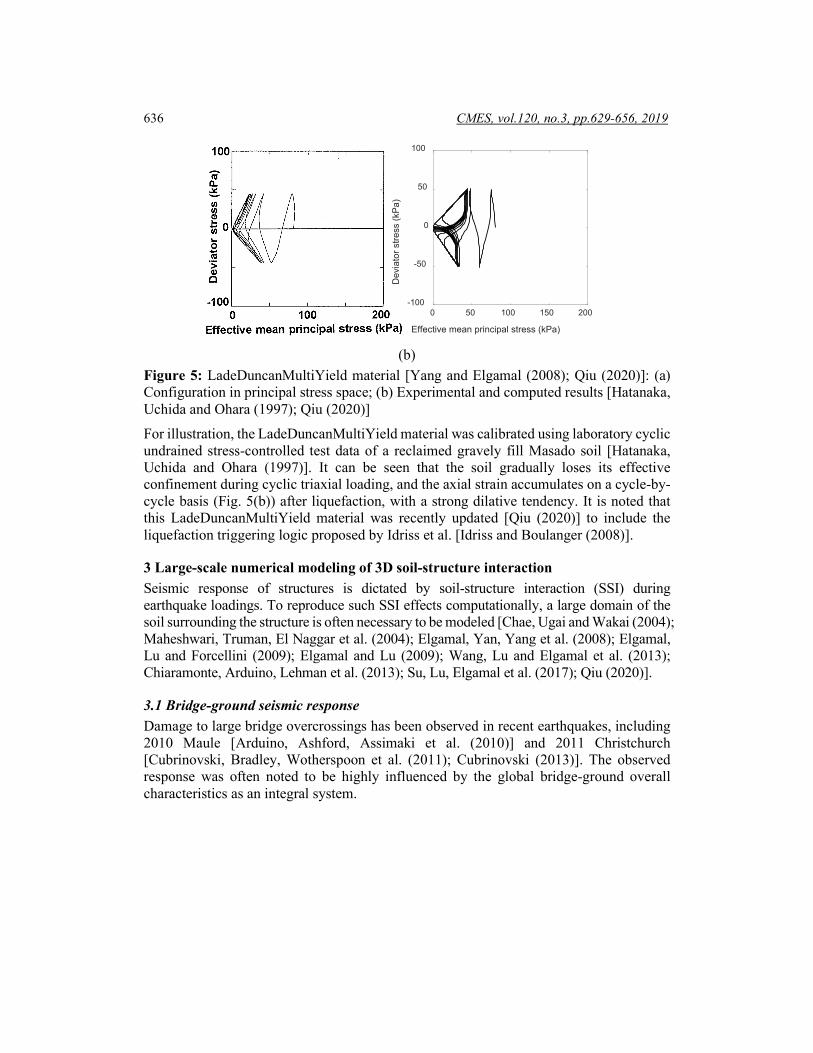
Figure 5: LadeDuncanMultiYield material [Yang and Elgamal (2008); Qiu (2020)]: (a) Configuration in principal stress space; (b) Experimental and computed results [Hatanaka, Uchida and Ohara (1997); Qiu (2020)]
For illustration, the LadeDuncanMultiYield material was calibrated using laboratory cyclic undrained stress-controlled test data of a reclaimed gravely fill Masado soil [Hatanaka, Uchida and Ohara (1997)]. It can be seen that the soil gradually loses its effective confinement during cyclic triaxial loading, and the axial strain accumulates on a cycle-by-cycle basis (Fig. 5(b)) after liquefaction, with a strong dilative tendency. It is noted that this LadeDuncanMultiYield material was recently updated [Qiu (2020)] to include the liquefaction triggering logic proposed by Idriss et al. [Idriss and Boulanger (2008)].
3 Large-scale numerical modeling of 3D soil-structure interaction Seismic response of structures is dictated by soil-structure interaction (SSI) during earthquake loadings. To reproduce such SSI effects computationally, a large domain of the soil surrounding the structure is often necessary to be modeled [Chae, Ugai and Wakai (2004); Maheshwari, Truman, El Naggar et al. (2004); Elgamal, Yan, Yang et al. (2008); Elgamal, Lu and Forcellini (2009); Elgamal and Lu (2009); Wang, Lu and Elgamal et al. (2013); Chiaramonte, Arduino, Lehman et al. (2013); Su, Lu, Elgamal et al. (2017); Qiu (2020)].
3.1 Bridge-ground seismic response Damage to large bridge overcrossings has been observed in recent earthquakes, including 2010 Maule [Arduino, Ashford, Assimaki et al. (2010)] and 2011 Christchurch [Cubrinovski, Bradley, Wotherspoon et al. (2011); Cubrinovski (2013)]. The observed response was often noted to be highly influenced by the global bridge-ground overall characteristics as an integral system.
0 50 100 150 200
Effective mean principal stress (kPa)
-100
-50
0
50
100
Dev
iato
r stre
ss (k
Pa)
OpenSees Three-Dimensional Computational Modeling of Ground-Structure 637
(a)
(b)
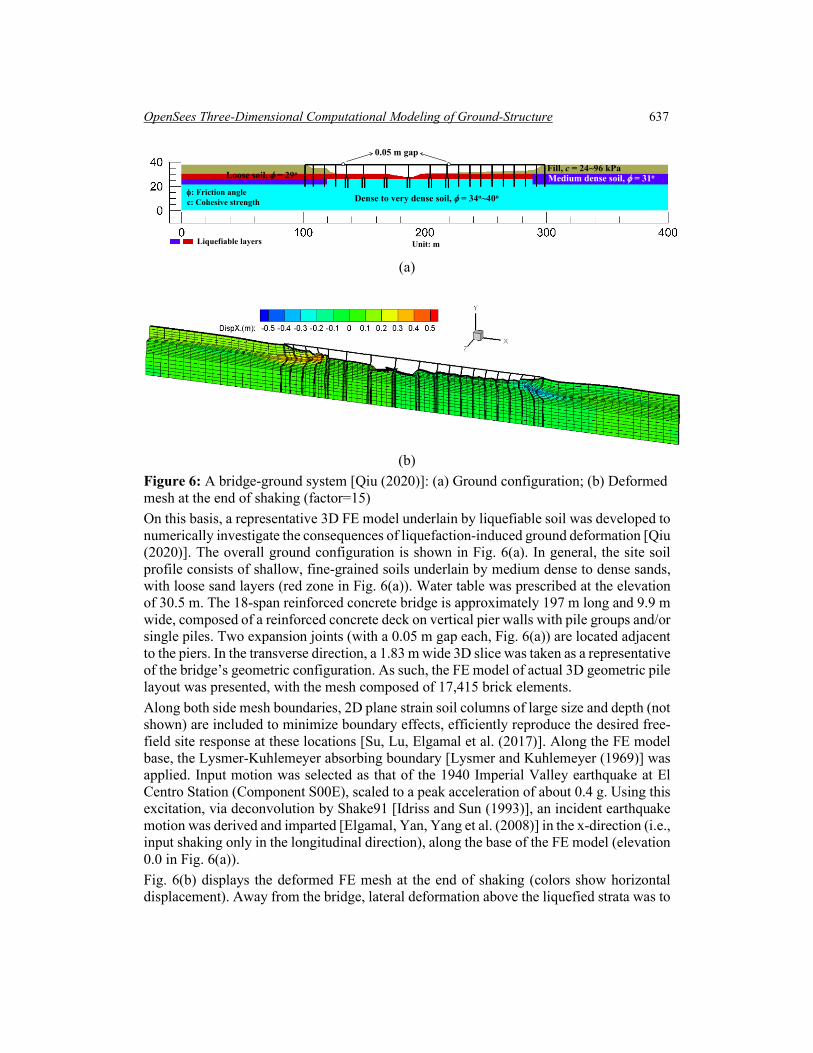
Figure 6: A bridge-ground system [Qiu (2020)]: (a) Ground configuration; (b) Deformed mesh at the end of shaking (factor=15) On this basis, a representative 3D FE model underlain by liquefiable soil was developed to numerically investigate the consequences of liquefaction-induced ground deformation [Qiu (2020)]. The overall ground configuration is shown in Fig. 6(a). In general, the site soil profile consists of shallow, fine-grained soils underlain by medium dense to dense sands, with loose sand layers (red zone in Fig. 6(a)). Water table was prescribed at the elevation of 30.5 m. The 18-span reinforced concrete bridge is approximately 197 m long and 9.9 m wide, composed of a reinforced concrete deck on vertical pier walls with pile groups and/or single piles. Two expansion joints (with a 0.05 m gap each, Fig. 6(a)) are located adjacent to the piers. In the transverse direction, a 1.83 m wide 3D slice was taken as a representative of the bridge’s geometric configuration. As such, the FE model of actual 3D geometric pile layout was presented, with the mesh composed of 17,415 brick elements. Along both side mesh boundaries, 2D plane strain soil columns of large size and depth (not shown) are included to minimize boundary effects, efficiently reproduce the desired free-field site response at these locations [Su, Lu, Elgamal et al. (2017)]. Along the FE model base, the Lysmer-Kuhlemeyer absorbing boundary [Lysmer and Kuhlemeyer (1969)] was applied. Input motion was selected as that of the 1940 Imperial Valley earthquake at El Centro Station (Component S00E), scaled to a peak acceleration of about 0.4 g. Using this excitation, via deconvolution by Shake91 [Idriss and Sun (1993)], an incident earthquake motion was derived and imparted [Elgamal, Yan, Yang et al. (2008)] in the x-direction (i.e., input shaking only in the longitudinal direction), along the base of the FE model (elevation 0.0 in Fig. 6(a)). Fig. 6(b) displays the deformed FE mesh at the end of shaking (colors show horizontal displacement). Away from the bridge, lateral deformation above the liquefied strata was to
Dense to very dense soil, φ = 34o~40o
Medium dense soil, φ = 31oFill, c = 24~96 kPa
Loose soil, φ = 29o
Unit: m
φ: Friction anglec: Cohesive strength
0.05 m gap
Liquefiable layers
638 CMES, vol.120, no.3, pp.629-656, 2019
the right, about 0.2 m on the left-side and only 0.008 m on the right-side. Superposed on this global displacement pattern (to the right), local downslope deformations are seen at both ends of the bridge (Fig. 6(b)). Near the abutments, additional downslope deformation relative to the surrounding ground was about 0.35 m (left-side), and 0.4 m (right-side). Due to the downslope deformations at both ends, expansion joint gaps were closed, with the bridge deck through its piers and foundations acting as a strut that provides added restraint to the slope deformations.
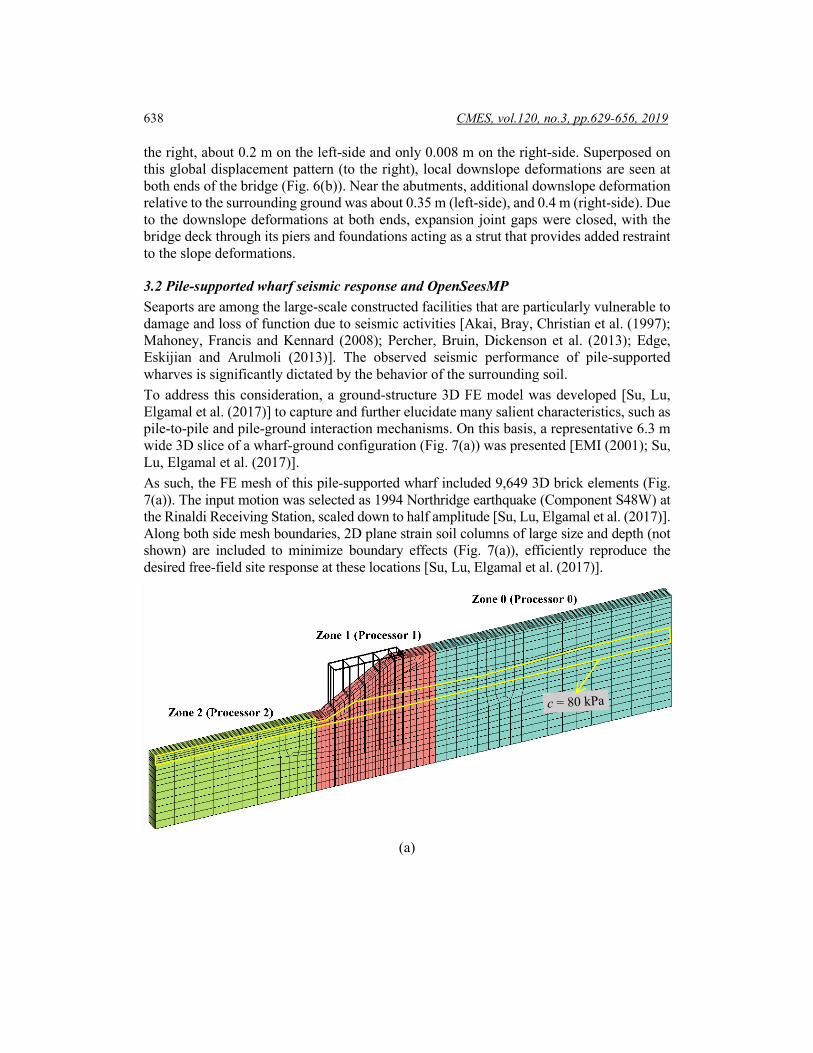
3.2 Pile-supported wharf seismic response and OpenSeesMP Seaports are among the large-scale constructed facilities that are particularly vulnerable to damage and loss of function due to seismic activities [Akai, Bray, Christian et al. (1997); Mahoney, Francis and Kennard (2008); Percher, Bruin, Dickenson et al. (2013); Edge, Eskijian and Arulmoli (2013)]. The observed seismic performance of pile-supported wharves is significantly dictated by the behavior of the surrounding soil. To address this consideration, a ground-structure 3D FE model was developed [Su, Lu, Elgamal et al. (2017)] to capture and further elucidate many salient characteristics, such as pile-to-pile and pile-ground interaction mechanisms. On this basis, a representative 6.3 m wide 3D slice of a wharf-ground configuration (Fig. 7(a)) was presented [EMI (2001); Su, Lu, Elgamal et al. (2017)]. As such, the FE mesh of this pile-supported wharf included 9,649 3D brick elements (Fig. 7(a)). The input motion was selected as 1994 Northridge earthquake (Component S48W) at the Rinaldi Receiving Station, scaled down to half amplitude [Su, Lu, Elgamal et al. (2017)]. Along both side mesh boundaries, 2D plane strain soil columns of large size and depth (not shown) are included to minimize boundary effects (Fig. 7(a)), efficiently reproduce the desired free-field site response at these locations [Su, Lu, Elgamal et al. (2017)].
(a)
OpenSees Three-Dimensional Computational Modeling of Ground-Structure 639
(b)
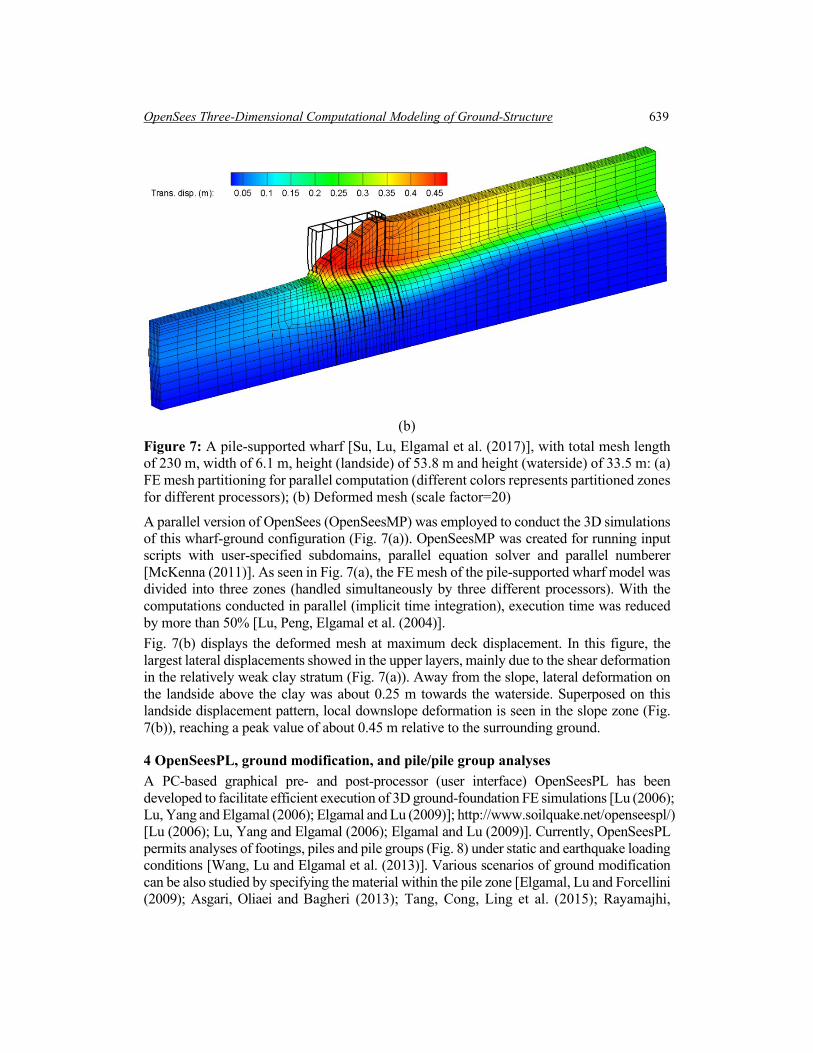
Figure 7: A pile-supported wharf [Su, Lu, Elgamal et al. (2017)], with total mesh length of 230 m, width of 6.1 m, height (landside) of 53.8 m and height (waterside) of 33.5 m: (a) FE mesh partitioning for parallel computation (different colors represents partitioned zones for different processors); (b) Deformed mesh (scale factor=20)
A parallel version of OpenSees (OpenSeesMP) was employed to conduct the 3D simulations of this wharf-ground configuration (Fig. 7(a)). OpenSeesMP was created for running input scripts with user-specified subdomains, parallel equation solver and parallel numberer [McKenna (2011)]. As seen in Fig. 7(a), the FE mesh of the pile-supported wharf model was divided into three zones (handled simultaneously by three different processors). With the computations conducted in parallel (implicit time integration), execution time was reduced by more than 50% [Lu, Peng, Elgamal et al. (2004)]. Fig. 7(b) displays the deformed mesh at maximum deck displacement. In this figure, the largest lateral displacements showed in the upper layers, mainly due to the shear deformation in the relatively weak clay stratum (Fig. 7(a)). Away from the slope, lateral deformation on the landside above the clay was about 0.25 m towards the waterside. Superposed on this landside displacement pattern, local downslope deformation is seen in the slope zone (Fig. 7(b)), reaching a peak value of about 0.45 m relative to the surrounding ground.
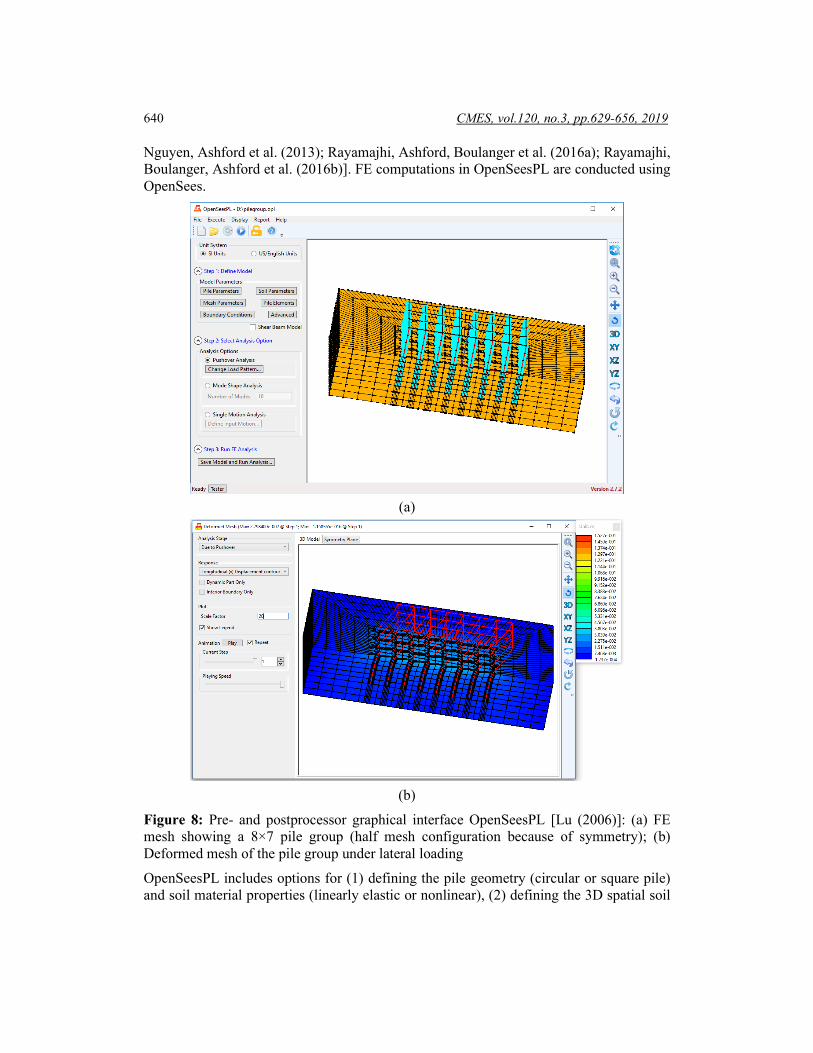
4 OpenSeesPL, ground modification, and pile/pile group analyses A PC-based graphical pre- and post-processor (user interface) OpenSeesPL has been developed to facilitate efficient execution of 3D ground-foundation FE simulations [Lu (2006); Lu, Yang and Elgamal (2006); Elgamal and Lu (2009)]; http://www.soilquake.net/openseespl/) [Lu (2006); Lu, Yang and Elgamal (2006); Elgamal and Lu (2009)]. Currently, OpenSeesPL permits analyses of footings, piles and pile groups (Fig. 8) under static and earthquake loading conditions [Wang, Lu and Elgamal et al. (2013)]. Various scenarios of ground modification can be also studied by specifying the material within the pile zone [Elgamal, Lu and Forcellini (2009); Asgari, Oliaei and Bagheri (2013); Tang, Cong, Ling et al. (2015); Rayamajhi,
640 CMES, vol.120, no.3, pp.629-656, 2019
Nguyen, Ashford et al. (2013); Rayamajhi, Ashford, Boulanger et al. (2016a); Rayamajhi, Boulanger, Ashford et al. (2016b)]. FE computations in OpenSeesPL are conducted using OpenSees.
(a)
(b)
Figure 8: Pre- and postprocessor graphical interface OpenSeesPL [Lu (2006)]: (a) FE mesh showing a 8×7 pile group (half mesh configuration because of symmetry); (b) Deformed mesh of the pile group under lateral loading
OpenSeesPL includes options for (1) defining the pile geometry (circular or square pile) and soil material properties (linearly elastic or nonlinear), (2) defining the 3D spatial soil
OpenSees Three-Dimensional Computational Modeling of Ground-Structure 641
domain, (3) defining the boundary conditions and ground input excitation or push-over analysis parameters, and (4) selecting soil materials from an available menu of cohesive and cohesionless soil materials. The menu of soil materials includes a complementary set of soil modeling parameters representing soft, medium, and stiff cohesive soils, and loose, medium, and dense cohesionless soils (with gravel, sand, or silt permeability). OpenSeesPL also allows convenient postprocessing and graphical visualization of the FE analysis results including ground response time histories, pile responses (profiles and time histories), and the deformed mesh (Fig. 8(b)). The user interface makes it possible for users to quickly build a FE model, run the FE analysis, and evaluate the performance of the ground-foundation system [Lu, Yang and Elgamal (2006)]. Representative studies employing OpenSeesPL are presented below.
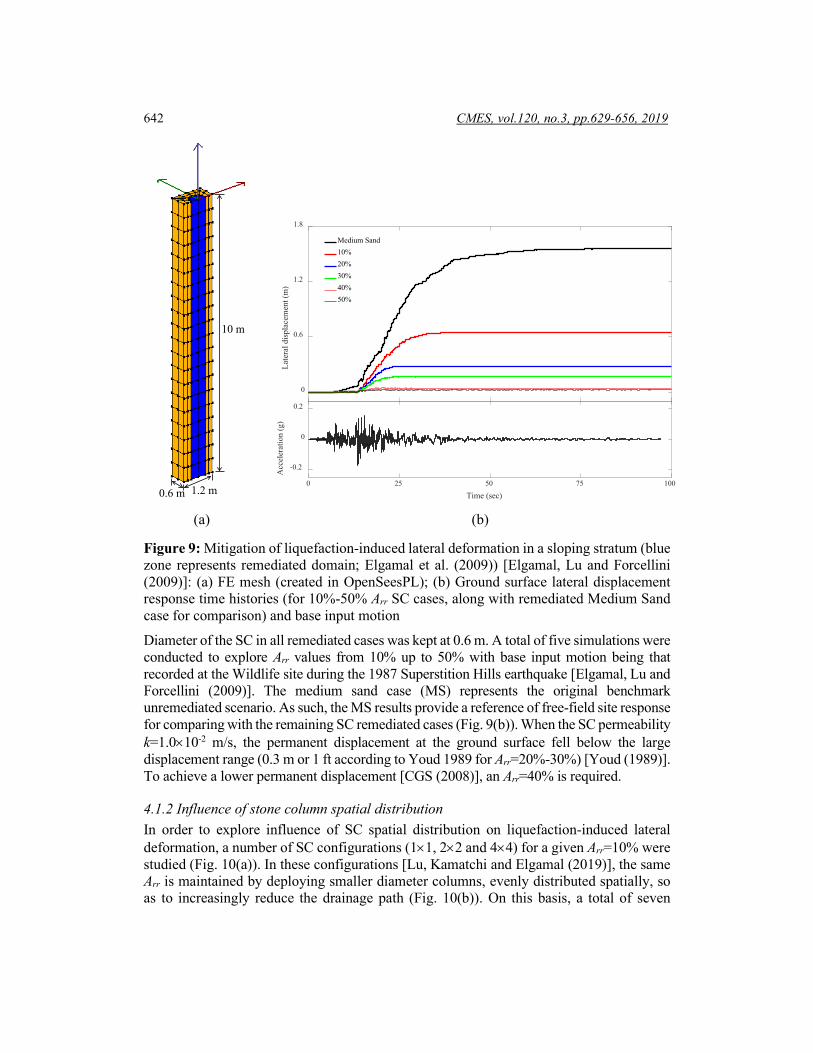
4.1 Stone column mitigation of liquefaction-induced lateral ground deformations Liquefaction-induced lateral spreading may result in disruption of function, significant damage, and considerable replacement cost for existing foundations, buildings, and structures. This type of adverse response has been observed in many earthquakes, such as Niigata, Japan 1964 [Seed and Idriss (1967)], Chi-Chi, Taiwan 1999 [EERI (2000)], Kocaeli, Turkey 1999 [EERI (2001)] and Christchurch, New Zealand 2011 [Cubrinovski, Bradley, Wotherspoon et al. (2011); Cubrinovski (2013)]. The risk of liquefaction and associated ground deformation may be reduced by ground improvement approaches including solidification (cementation), densification, and gravel drains or stone columns (SCs). Use of gravel drains/SCs is a relatively recent development compared with more traditional soil remediation approaches [Elgamal, Lu and Forcellini (2009)].
4.1.1 Mitigation by stone columns Using OpenSeesPL, a mildly inclined 4° saturated sand layer of 10 m thickness was studied (permeability k=6.6×10⁻⁵ m/s), based on Nevada sand properties at a relative density Dr of about 40% [Yang, Elgamal and Parra et al. (2003); Elgamal, Yang, Parra et al. (2003); Elgamal, Lu and Forcellini (2009)]. Dense sand properties with a representative gravel permeability k=1.0×10⁻² m/s were employed to represent the SC properties. In the remediated cases, the area replacement ratio 𝐴𝐴𝑟𝑟𝑟𝑟 = 𝐴𝐴𝑟𝑟
𝐴𝐴= 𝜋𝜋𝑑𝑑2
4𝑠𝑠2 is conventionally defined as
the ratio of the SC area Ar over the tributary area A (Fig. 9(a)), where d=diameter of the SC, and s=distance (spacing) between SC centers.
642 CMES, vol.120, no.3, pp.629-656, 2019
(a) (b)
Figure 9: Mitigation of liquefaction-induced lateral deformation in a sloping stratum (blue zone represents remediated domain; Elgamal et al. (2009)) [Elgamal, Lu and Forcellini (2009)]: (a) FE mesh (created in OpenSeesPL); (b) Ground surface lateral displacement response time histories (for 10%-50% Arr SC cases, along with remediated Medium Sand case for comparison) and base input motion
Diameter of the SC in all remediated cases was kept at 0.6 m. A total of five simulations were conducted to explore Arr values from 10% up to 50% with base input motion being that recorded at the Wildlife site during the 1987 Superstition Hills earthquake [Elgamal, Lu and Forcellini (2009)]. The medium sand case (MS) represents the original benchmark unremediated scenario. As such, the MS results provide a reference of free-field site response for comparing with the remaining SC remediated cases (Fig. 9(b)). When the SC permeability k=1.0×10⁻² m/s, the permanent displacement at the ground surface fell below the large displacement range (0.3 m or 1 ft according to Youd 1989 for Arr=20%-30%) [Youd (1989)]. To achieve a lower permanent displacement [CGS (2008)], an Arr=40% is required.
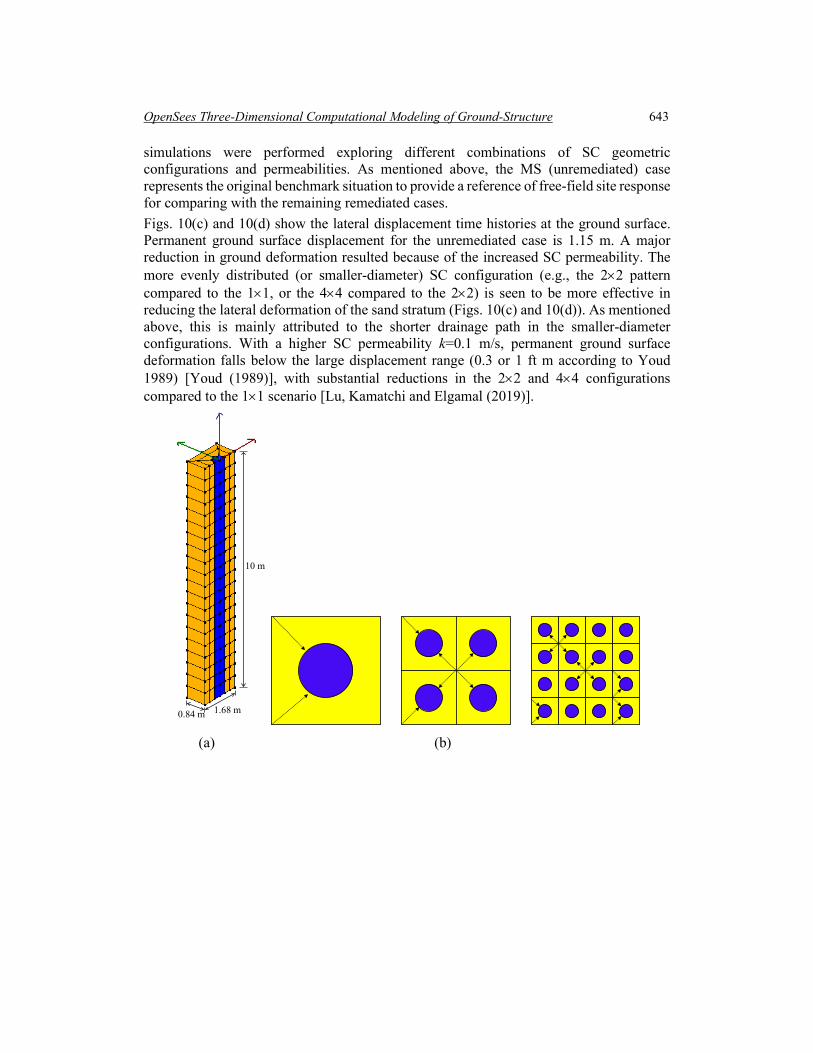
4.1.2 Influence of stone column spatial distribution In order to explore influence of SC spatial distribution on liquefaction-induced lateral deformation, a number of SC configurations (1×1, 2×2 and 4×4) for a given Arr=10% were studied (Fig. 10(a)). In these configurations [Lu, Kamatchi and Elgamal (2019)], the same Arr is maintained by deploying smaller diameter columns, evenly distributed spatially, so as to increasingly reduce the drainage path (Fig. 10(b)). On this basis, a total of seven
1.2 m0.6 m
10 m
0 25 50 75 100
Time (sec)
-0.2
0
0.2
Acc
eler
atio
n (g
)
0
0.6
1.2
1.8
Late
ral d
ispl
acem
ent (
m)
Medium Sand10%20%30%40%50%
OpenSees Three-Dimensional Computational Modeling of Ground-Structure 643
simulations were performed exploring different combinations of SC geometric configurations and permeabilities. As mentioned above, the MS (unremediated) case represents the original benchmark situation to provide a reference of free-field site response for comparing with the remaining remediated cases. Figs. 10(c) and 10(d) show the lateral displacement time histories at the ground surface. Permanent ground surface displacement for the unremediated case is 1.15 m. A major reduction in ground deformation resulted because of the increased SC permeability. The more evenly distributed (or smaller-diameter) SC configuration (e.g., the 2×2 pattern compared to the 1×1, or the 4×4 compared to the 2×2) is seen to be more effective in reducing the lateral deformation of the sand stratum (Figs. 10(c) and 10(d)). As mentioned above, this is mainly attributed to the shorter drainage path in the smaller-diameter configurations. With a higher SC permeability k=0.1 m/s, permanent ground surface deformation falls below the large displacement range (0.3 or 1 ft m according to Youd 1989) [Youd (1989)], with substantial reductions in the 2×2 and 4×4 configurations compared to the 1×1 scenario [Lu, Kamatchi and Elgamal (2019)].
(a) (b)
1.68 m0.84 m
10 m
644 CMES, vol.120, no.3, pp.629-656, 2019
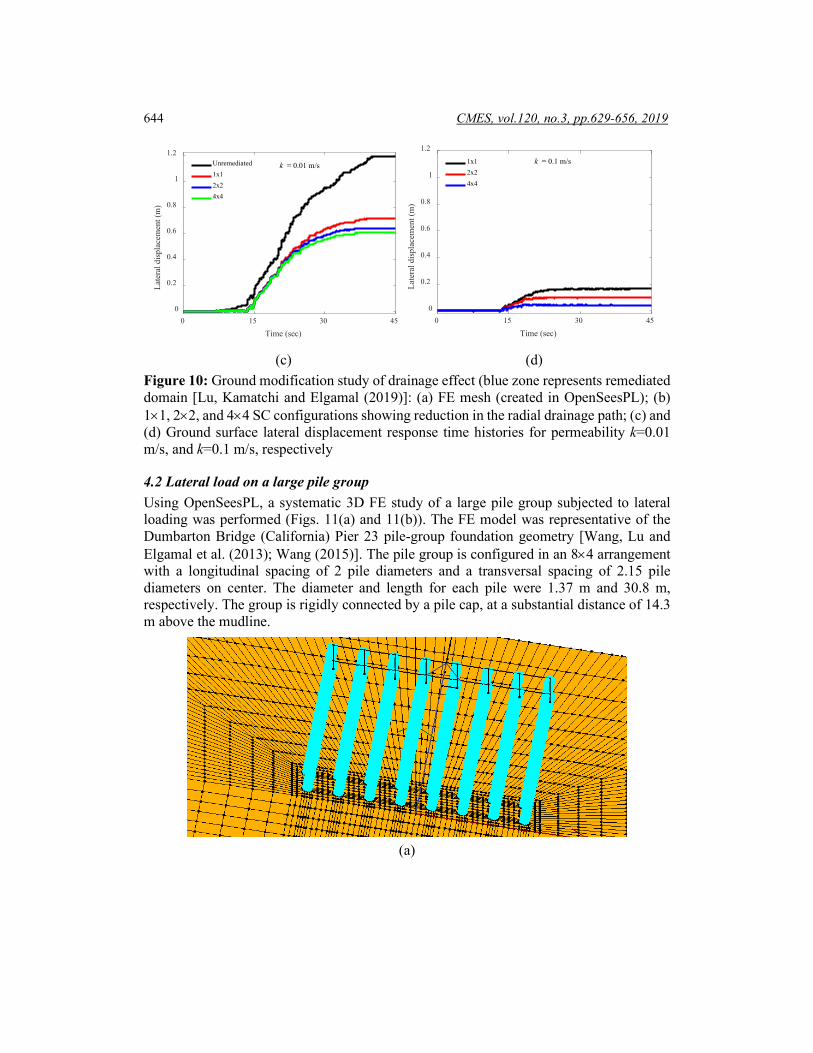
(c) (d) Figure 10: Ground modification study of drainage effect (blue zone represents remediated domain [Lu, Kamatchi and Elgamal (2019)]: (a) FE mesh (created in OpenSeesPL); (b) 1×1, 2×2, and 4×4 SC configurations showing reduction in the radial drainage path; (c) and (d) Ground surface lateral displacement response time histories for permeability k=0.01 m/s, and k=0.1 m/s, respectively
4.2 Lateral load on a large pile group Using OpenSeesPL, a systematic 3D FE study of a large pile group subjected to lateral loading was performed (Figs. 11(a) and 11(b)). The FE model was representative of the Dumbarton Bridge (California) Pier 23 pile-group foundation geometry [Wang, Lu and Elgamal et al. (2013); Wang (2015)]. The pile group is configured in an 8×4 arrangement with a longitudinal spacing of 2 pile diameters and a transversal spacing of 2.15 pile diameters on center. The diameter and length for each pile were 1.37 m and 30.8 m, respectively. The group is rigidly connected by a pile cap, at a substantial distance of 14.3 m above the mudline.
(a)
0 15 30 45
Time (sec)
0
0.2
0.4
0.6
0.8
1
1.2La
tera
l dis
plac
emen
t (m
) k = 0.01 m/sUnremediated
1x12x24x4
0 15 30 45
Time (sec)
0
0.2
0.4
0.6
0.8
1
1.2
Late
ral d
ispl
acem
ent (
m)
k = 0.1 m/s1x12x24x4
OpenSees Three-Dimensional Computational Modeling of Ground-Structure 645
(b)
(c)
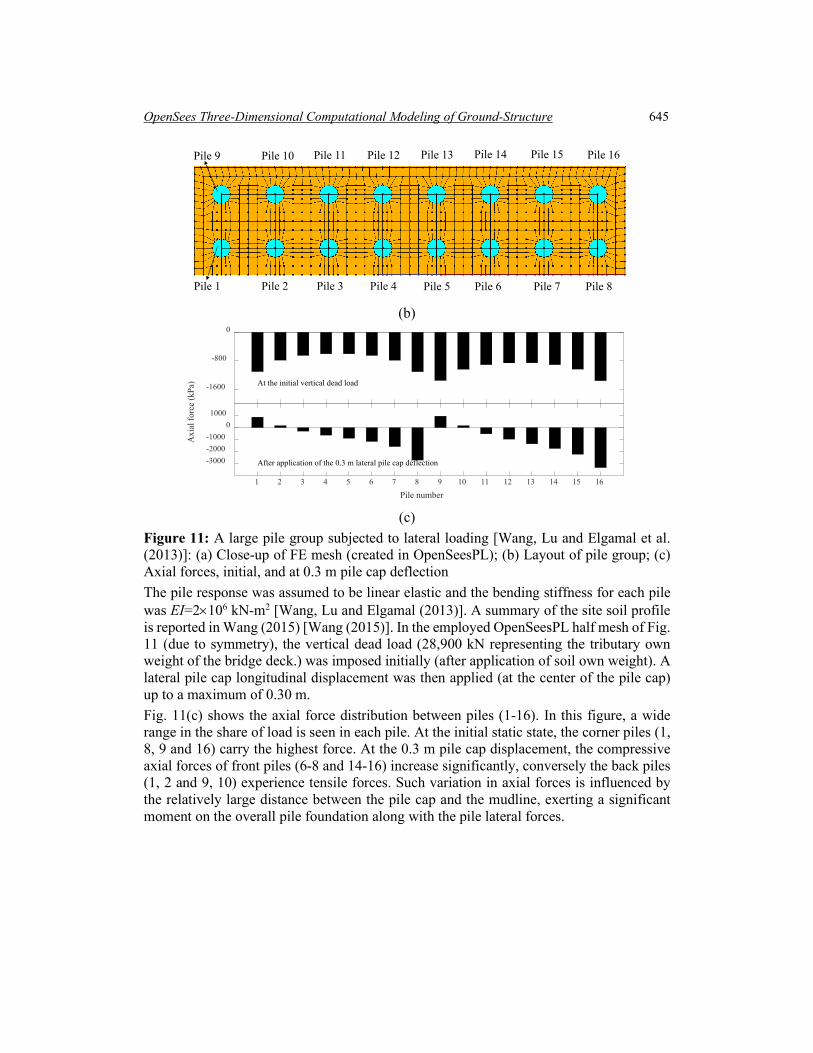
Figure 11: A large pile group subjected to lateral loading [Wang, Lu and Elgamal et al. (2013)]: (a) Close-up of FE mesh (created in OpenSeesPL); (b) Layout of pile group; (c) Axial forces, initial, and at 0.3 m pile cap deflection The pile response was assumed to be linear elastic and the bending stiffness for each pile was EI=2×10⁶ kN-m2 [Wang, Lu and Elgamal (2013)]. A summary of the site soil profile is reported in Wang (2015) [Wang (2015)]. In the employed OpenSeesPL half mesh of Fig. 11 (due to symmetry), the vertical dead load (28,900 kN representing the tributary own weight of the bridge deck.) was imposed initially (after application of soil own weight). A lateral pile cap longitudinal displacement was then applied (at the center of the pile cap) up to a maximum of 0.30 m. Fig. 11(c) shows the axial force distribution between piles (1-16). In this figure, a wide range in the share of load is seen in each pile. At the initial static state, the corner piles (1, 8, 9 and 16) carry the highest force. At the 0.3 m pile cap displacement, the compressive axial forces of front piles (6-8 and 14-16) increase significantly, conversely the back piles (1, 2 and 9, 10) experience tensile forces. Such variation in axial forces is influenced by the relatively large distance between the pile cap and the mudline, exerting a significant moment on the overall pile foundation along with the pile lateral forces.
Pile 9
Pile 1
Pile 16
Pile 8Pile 2 Pile 3 Pile 4 Pile 5 Pile 6 Pile 7
Pile 10 Pile 11 Pile 12 Pile 13 Pile 14 Pile 15
At the initial vertical dead load
1 2 3 4 5 6 7 8 9 10 11 12 13 14 15 16
-1600
-800
0
After application of the 0.3 m lateral pile cap deflection
1 2 3 4 5 6 7 8 9 10 11 12 13 14 15 16
Pile number
-3000-2000-1000
01000
Axi
al fo
rce
(kPa
)
646 CMES, vol.120, no.3, pp.629-656, 2019
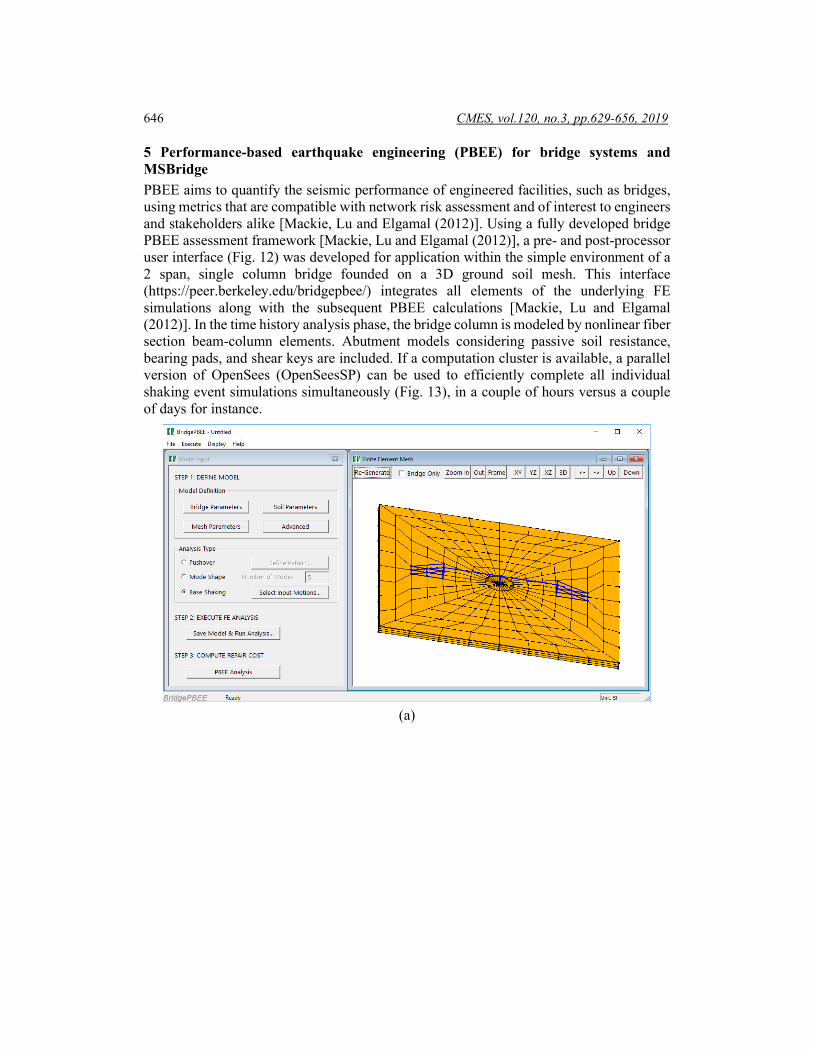
5 Performance-based earthquake engineering (PBEE) for bridge systems and MSBridge PBEE aims to quantify the seismic performance of engineered facilities, such as bridges, using metrics that are compatible with network risk assessment and of interest to engineers and stakeholders alike [Mackie, Lu and Elgamal (2012)]. Using a fully developed bridge PBEE assessment framework [Mackie, Lu and Elgamal (2012)], a pre- and post-processor user interface (Fig. 12) was developed for application within the simple environment of a 2 span, single column bridge founded on a 3D ground soil mesh. This interface (https://peer.berkeley.edu/bridgepbee/) integrates all elements of the underlying FE simulations along with the subsequent PBEE calculations [Mackie, Lu and Elgamal (2012)]. In the time history analysis phase, the bridge column is modeled by nonlinear fiber section beam-column elements. Abutment models considering passive soil resistance, bearing pads, and shear keys are included. If a computation cluster is available, a parallel version of OpenSees (OpenSeesSP) can be used to efficiently complete all individual shaking event simulations simultaneously (Fig. 13), in a couple of hours versus a couple of days for instance.
(a)
OpenSees Three-Dimensional Computational Modeling of Ground-Structure 647
(b)
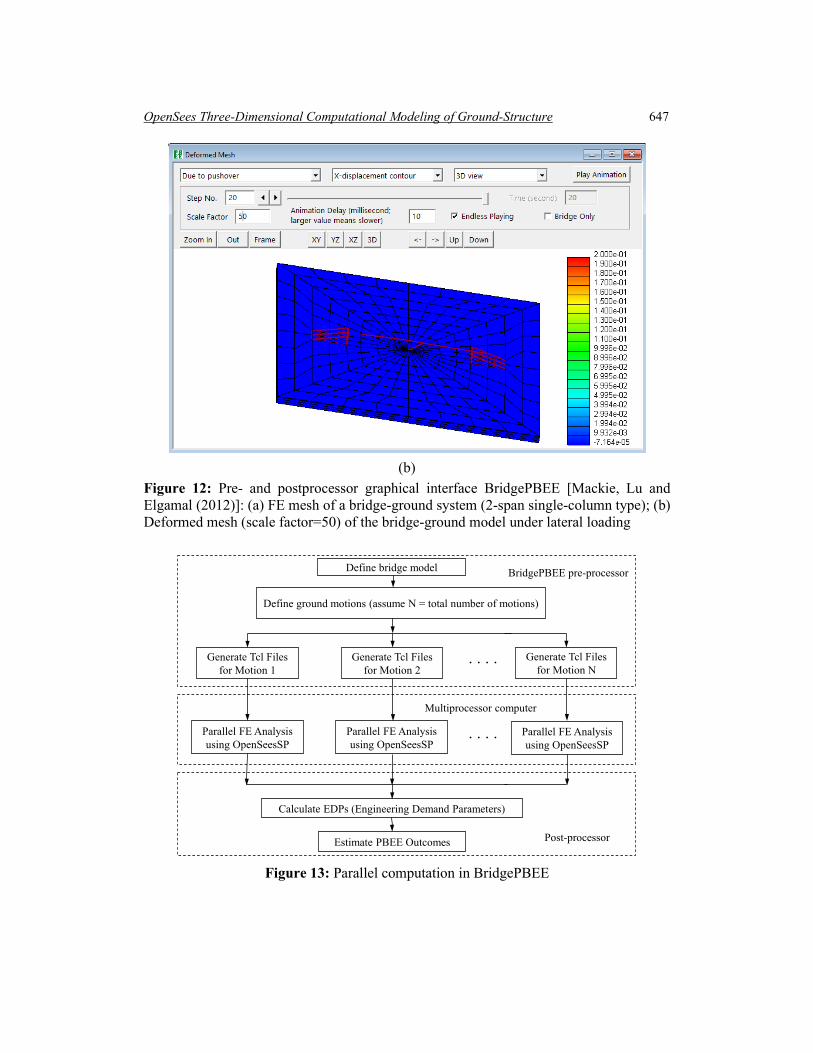
Figure 12: Pre- and postprocessor graphical interface BridgePBEE [Mackie, Lu and Elgamal (2012)]: (a) FE mesh of a bridge-ground system (2-span single-column type); (b) Deformed mesh (scale factor=50) of the bridge-ground model under lateral loading
Figure 13: Parallel computation in BridgePBEE
Define bridge model
Generate Tcl Files for Motion 1
Parallel FE Analysis using OpenSeesSP
Generate Tcl Files for Motion 2
Generate Tcl Files for Motion N
Calculate EDPs (Engineering Demand Parameters)
Estimate PBEE Outcomes
Define ground motions (assume N = total number of motions)
BridgePBEE pre-processor
Post-processor
Multiprocessor computer
Parallel FE Analysis using OpenSeesSP
Parallel FE Analysis using OpenSeesSP
648 CMES, vol.120, no.3, pp.629-656, 2019
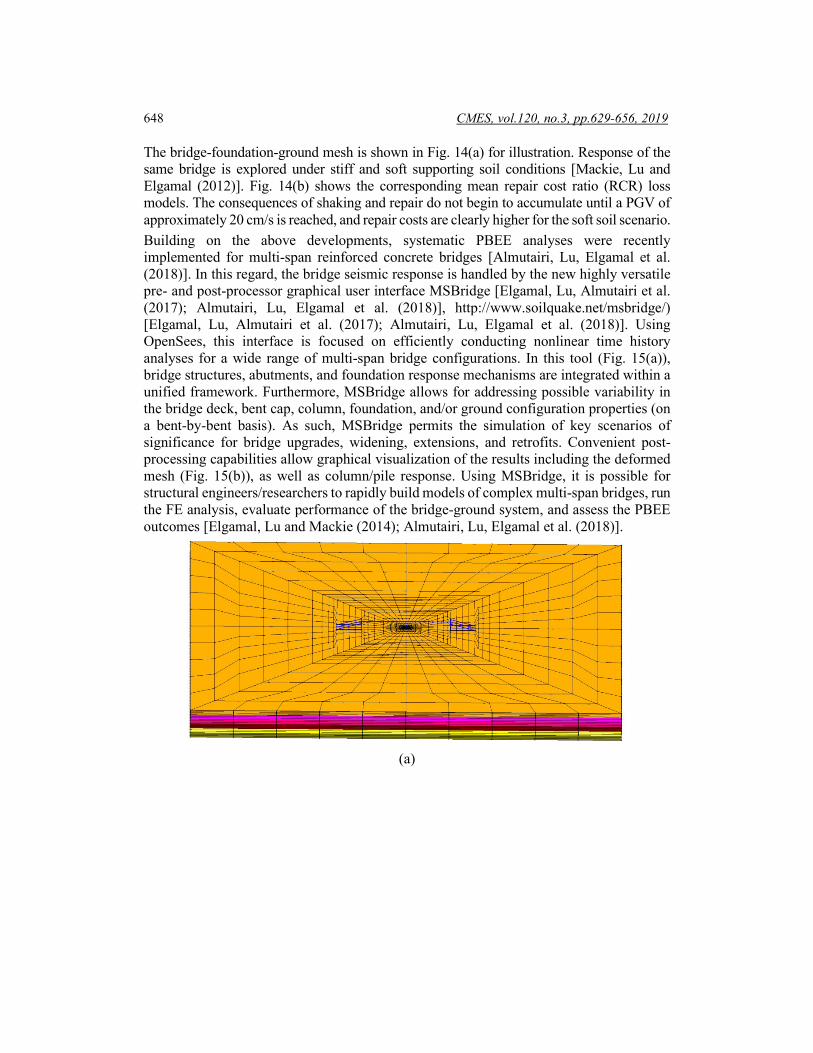
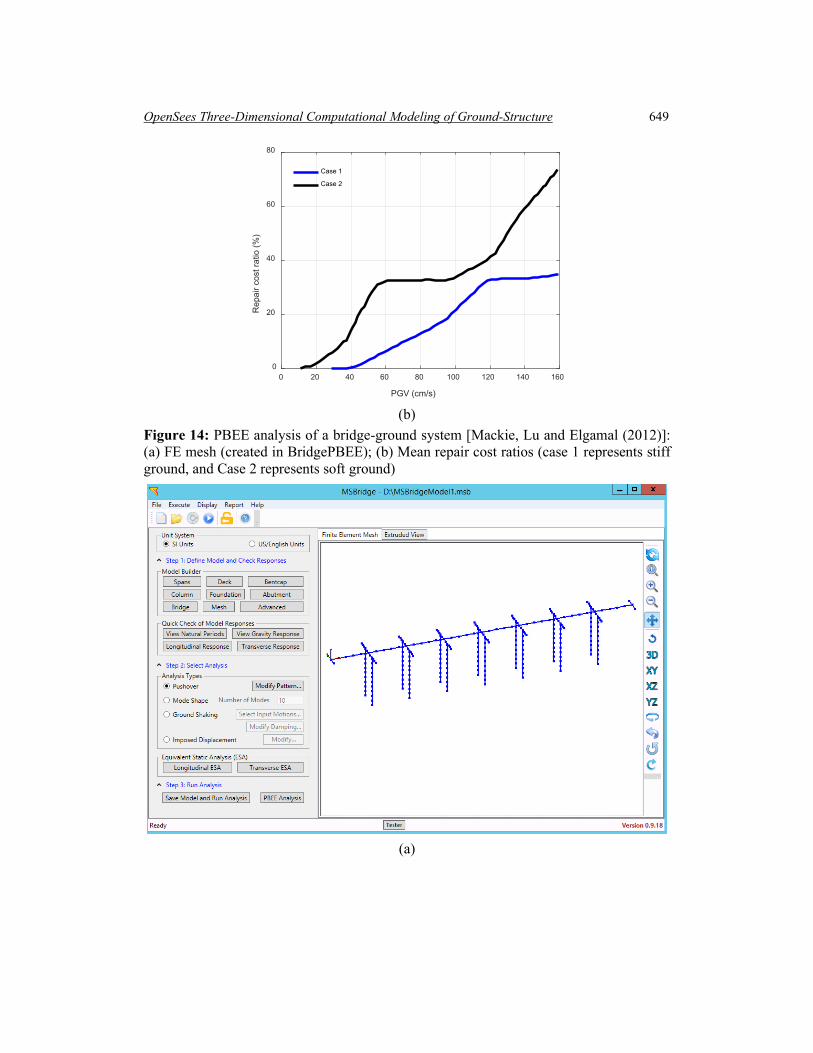
The bridge-foundation-ground mesh is shown in Fig. 14(a) for illustration. Response of the same bridge is explored under stiff and soft supporting soil conditions [Mackie, Lu and Elgamal (2012)]. Fig. 14(b) shows the corresponding mean repair cost ratio (RCR) loss models. The consequences of shaking and repair do not begin to accumulate until a PGV of approximately 20 cm/s is reached, and repair costs are clearly higher for the soft soil scenario. Building on the above developments, systematic PBEE analyses were recently implemented for multi-span reinforced concrete bridges [Almutairi, Lu, Elgamal et al. (2018)]. In this regard, the bridge seismic response is handled by the new highly versatile pre- and post-processor graphical user interface MSBridge [Elgamal, Lu, Almutairi et al. (2017); Almutairi, Lu, Elgamal et al. (2018)], http://www.soilquake.net/msbridge/) [Elgamal, Lu, Almutairi et al. (2017); Almutairi, Lu, Elgamal et al. (2018)]. Using OpenSees, this interface is focused on efficiently conducting nonlinear time history analyses for a wide range of multi-span bridge configurations. In this tool (Fig. 15(a)), bridge structures, abutments, and foundation response mechanisms are integrated within a unified framework. Furthermore, MSBridge allows for addressing possible variability in the bridge deck, bent cap, column, foundation, and/or ground configuration properties (on a bent-by-bent basis). As such, MSBridge permits the simulation of key scenarios of significance for bridge upgrades, widening, extensions, and retrofits. Convenient post-processing capabilities allow graphical visualization of the results including the deformed mesh (Fig. 15(b)), as well as column/pile response. Using MSBridge, it is possible for structural engineers/researchers to rapidly build models of complex multi-span bridges, run the FE analysis, evaluate performance of the bridge-ground system, and assess the PBEE outcomes [Elgamal, Lu and Mackie (2014); Almutairi, Lu, Elgamal et al. (2018)].
(a)
OpenSees Three-Dimensional Computational Modeling of Ground-Structure 649
(b)
Figure 14: PBEE analysis of a bridge-ground system [Mackie, Lu and Elgamal (2012)]: (a) FE mesh (created in BridgePBEE); (b) Mean repair cost ratios (case 1 represents stiff ground, and Case 2 represents soft ground)
(a)
0 20 40 60 80 100 120 140 160
PGV (cm/s)
0
20
40
60
80
Rep
air c
ost r
atio
(%)
Case 1
Case 2

650 CMES, vol.120, no.3, pp.629-656, 2019
(b)
Figure 15: Pre- and postprocessor graphical interface MSBridge [Elgamal, Lu, Almutairi et al. (2017); Almutairi, Lu, Elgamal et al. (2018)]: (a) FE mesh of a multi-span bridge; (b) Deformed mesh of the bridge model under lateral loading (scale factor=50) In summary, the main capabilities of MSBridge include: i) horizontal and vertical alignments, with different skew angles for bents/ abutments; ii) beam-column element with fiber section for bridge columns and piles; iii) deck hinges, isolation bearings, steel jackets, and abutment models; iv) foundation represented by Foundation Matrix or soil springs (p-y, t-z and q-z); v) analysis for suites of ground motions (built-in and/or user-defined); vi) PBEE outcomes in terms of repair cost, time and carbon footprint; and vii) pushover and mode shape analysis options.
6 Summary and conclusions Recent research efforts that address the static and dynamic/seismic response of ground-foundation-structure systems have been presented. Specifically, developments within the computational platform OpenSees were outlined. Representative numerical results were included for the response of large foundation-ground-structure systems, ground modification liquefaction countermeasures, and PBEE analyses. To facilitate 3D computations, graphical user interfaces (OpenSeesPL, BridgePBEE and MSBridge) were shown to be useful tools for conducting simulations of ground modification, ground-pile SSI, and multi-span bridge-ground systems with PBEE assessments. Overall, the presented studies aim to illustrate the potential for further reliance on computer simulation in the assessment of nonlinear SSI response. Challenges in calibration and in high fidelity modeling are being gradually overcome. With careful attention to the involved modeling details, effective insights may be gleaned for a wide range of practical applications.
OpenSees Three-Dimensional Computational Modeling of Ground-Structure 651
Acknowledgments: This research was supported by the Pacific Earthquake Engineering Research (PEER) Center, Caltrans, and the National Science Foundation (Grant CMMI-1201195, OISE-1445712). Additional support was provided by National Science Foundation (NSF) through computing resources provided by San Diego Supercomputer Center (SDSC) and Texas Advanced Computing Center (TACC). The Wharf layout information was provided by Dr. Arul K. Arulmoli, Principal, Earth Mechanics, Inc.
References Al Atik, L; Sitar, N. (2010): Seismic earth pressures on cantilever retaining structures. Journal of Geotechnical and Geoenvironmental Engineering, vol. 136, no. 10, pp. 1324-1333. Almutairi, A.; Lu, J.; Elgamal, A.; Mackie, K. (2018): MSBridge: OpenSees pushover and earthquake analysis of multi-span bridges-user manual. Structural Systems Research Project Report No. SSRP-16/05. University of California at San Diego, La Jolla, USA. Asgari, A.; Oliaei, M.; Bagheri, M. (2013): Numerical simulation of improvement of a liquefiable soil layer using stone column and pile-pinning techniques. Soil Dynamics and Earthquake Engineering, vol. 51, pp. 77-96. Aygün, B.; Dueñas-Osorio, L.; Padgett, J. E.; DesRoches, R. (2009): Seismic vulnerability of bridges susceptible to spatially distributed soil liquefaction hazards. Structures Congress 2009: Don't Mess with Structural Engineers: Expanding Our Role, pp. 1-10. Aygün, B.; Dueñas-Osorio, L.; Padgett, J. E.; DesRoches, R. (2010): Efficient longitudinal seismic fragility assessment of a multispan continuous steel bridge on liquefiable soils. Journal of Bridge Engineering, vol. 16, no. 1, pp. 93-107. Akai, K.; Bray, J. D.; Christian, J. T.; Boulanger, R. W. (1997): Geotechnical Reconnaissance of the Effects of the January 17, 1995, Hyogoken-Nanbu Earthquake, Japan. DIANE Publishing. Arduino, P.; Ashford, S.; Assimaki, D.; Bray, J.; Eldridge, T. et al. (2010): Geo-engineering reconnaissance of the 2010 maule, chile earthquake. GEER Association Report No. GEER-022, 1. Boulanger, R. W.; Ziotopoulou, K. (2015): PM4Sand (Version 3): A Sand Plasticity Model for Earthquake Engineering Applications. Center for Geotechnical Modeling Report No. UCD/CGM-15/01, Department of Civil and Environmental Engineering, University of California, Davis, Calif, USA. Chiaramonte, M. M.; Arduino, P.; Lehman, D. E.; Roeder, C. W. (2013): Seismic analyses of conventional and improved marginal wharves. Earthquake Engineering & Structural Dynamics, vol. 42, no. 10, pp. 1435-1450. CGS, California Geological Survey (2008): Guidelines for evaluating and mitigating seismic hazards in California. California Geological Survey. http://www.consrv.ca.gov/cgs/shzp/webdocs/Documents/ sp117.pdf. Chae, K. S.; Ugai, K.; Wakai, A. (2004): Lateral resistance of short single piles and pile groups located near slopes. International Journal of Geomechanics, vol. 4, no. 2, pp. 93-103.

652 CMES, vol.120, no.3, pp.629-656, 2019
Chan, A. H. C. (1988): A Unified Finite Element Solution to Static and Dynamic Problems in Geomechanics (Ph.D. Thesis). University College of Swansea, U.K. Chang, D.; Boulanger, R.; Brandenberg, S.; Kutter, B. (2013): FEM analysis of dynamic soil-pile-structure interaction in liquefied and laterally spreading ground. Earthquake Spectra, vol. 29, no. 3, pp. 733-755. Chen, W. F.; Mizuno, E. (1990): Nonlinear Analysis in Soil Mechanics: Theory and Implementation. Elsevier Science Publisher, Netherlands. Cubrinovski, M.; Bradley, B.; Wotherspoon, L.; Green, R.; Bray, J. et al. (2011): Geotechnical aspects of the 22 February 2011 Christchurch earthquake. https://ir.canterbury.ac.nz/bitstream/handle/10092/6393/12636868_Cubrinovski_GeotechnicalAspectsFeb22Eq_BNZSEE_11.pdf?sequence=1&isAllowed=y. Cubrinovski, M. (2013): Liquefaction-induced damage in the 2010-2011 Christchurch (New Zealand) Earthquakes. International Conference on Case Histories in Geotechnical Engineering. Earthquake Engineering Research Institute (EERI) (2000): Kocaeli. Turkey, earthquake of august 17, 1999 reconnaissance report. Earthquake Spectra. Earthquake Engineering Research Institute (EERI) (2001): Chi-chi, Taiwan, earthquake of September 21, 1999, reconnaissance report. Earthquake Spectra. Edge, B. E.; Eskijian, M.; Arulmoli, K. (2013): Chile Earthquake and Tsunami of 2010, Performance of Coastal Infrastructure Report by the COPRI Chile Earthquake Investigation Team. American Society of Civil Engineers. Elgamal, A.; Yang, Z.; Parra, E.; Ragheb, A. (2003): Modeling of cyclic mobility in saturated cohesionless soils. International Journal of Plasticity, vol. 19, no. 6, pp. 883-905. Elgamal, A.; Yan, L.; Yang, Z.; Conte, J. P. (2008): Three-dimensional seismic response of Humboldt Bay bridge-foundation-ground system. Journal of Structural Engineering, vol. 134, no. 7, pp. 1165-1176. Elgamal, A.; Lu, J. (2009): A framework for 3D finite element analysis of lateral pile system response. Contemporary Topics in in Situ Testing, Analysis, and Reliability of Foundations, pp. 616-623. Elgamal, A.; Lu, J.; Forcellini, D. (2009): Mitigation of liquefaction-induced lateral deformation in a sloping stratum: 3D numerical simulation. Journal of Geotechnical and Geoenvironmental Engineering, vol. 135, no. 11, pp. 1672-1682. Elgamal, A.; Lu, J.; Mackie, K. (2014): MSBridge: OpenSees Pushover and Earthquake Analysis of Multi-Span Bridges-User Manual. Structural Systems Research Project SSRP-14/03, University of California at San Diego, La Jolla, USA. Elgamal, A.; Lu, J.; Almutairi, A.; Mackie, K. (2017): MSBridge: OpenSees Pushover and Earthquake Analysis of Multi-Span Bridges-User Manual, Beta 1.0. University of California at San Diego, La Jolla, USA. EMI (2001): Final geotechnical and seismic analyses and design report berth 100 container wharf, west basin Port of Los Angeles, San Pedro, California. California: Prepared by Earth Mechanics, Inc. (EMI) [submitted to Port of Los Angeles].
OpenSees Three-Dimensional Computational Modeling of Ground-Structure 653
Gu, Q.; Conte, J. P.; Elgamal, A.; Yang, Z. (2009): Finite element response sensitivity analysis of multi-yield-surface J2 plasticity model by direct differentiation method. Computer Methods in Applied Mechanics and Engineering, vol. 198, no. 30-32, pp. 2272-2285. Gu, Q.; Conte, J. P.; Yang, Z.; Elgamal, A. (2011): Consistent tangent moduli for multi-yield-surface J2 plasticity model. Computational Mechanics, vol. 48, no. 1, pp. 97-120. Gu, Q.; Qiu, Z.; Huang, S. (2015): A modified multi-yield-surface plasticity model: sequential closest point projection method. Computers and Geotechnics, vol. 69, pp. 378-395. Hashash, Y. M.; Dashti, S.; Romero, M. I.; Ghayoomi, M.; Musgrove, M. (2015): Evaluation of 1-D seismic site response modeling of sand using centrifuge experiments. Soil Dynamics and Earthquake Engineering, vol. 78, pp. 19-31. Hatanaka, M.; Uchida, A.; Ohara, J. (1997): Liquefaction characteristics of a gravelly fill liquefied during the 1995 Hyogo-Ken Nanbu earthquake. Soils and Foundations, vol. 37, no. 3, pp. 107-115. He, L.; Ramirez, J.; Lu, J.; Tang, L.; Elgamal, A. et al. (2017). Lateral spreading near deep foundations and influence of soil permeability. Canadian Geotechnical Journal, vol. 54, no. 6, pp. 846-861. Idriss, I. M.; Sun, J. I. (1993): User’s Manual for SHAKE91: A Computer Program for Conducting Equivalent Linear Seismic Response Analyses of Horizontally Layered Soil Deposits. Center for Geotechnical Modeling, Deptartment of Civil and Environmental Engineering, University of California Press, Davis, CA. Idriss, I. M.; Boulanger, R. W. (2008): Soil liquefaction during earthquakes. Earthquake Engineering Research Institute. Iwan, W. D. (1967): On a class of models for the yielding behavior of continuous and composite systems. Journal of Applied Mechanics, vol. 34, pp. 612-617. Ilankatharan, M.; Kutter, B. (2008): Numerical simulation of a soil model-model container-centrifuge shaking table system. Geotechnical Earthquake Engineering and Soil Dynamics IV, pp. 1-10. Ilankatharan, M.; Kutter, B. (2010): Modeling input motion boundary conditions for simulations of geotechnical shaking table tests. Earthquake Spectra, vol. 26, no. 2, pp. 349-369. Khosravifar, A.; Elgamal, A.; Lu, J.; Li, J. (2018): A 3D model for earthquake-induced liquefaction triggering and post-liquefaction response. Soil Dynamics and Earthquake Engineering, vol. 110, pp. 43-52. Karimi, Z.; Dashti, S. (2015): Numerical and centrifuge modeling of seismic soil-foundation-structure interaction on liquefiable ground. Journal of Geotechnical and Geoenvironmental Engineering, vol. 142, no. 1, 04015061. Karimi, Z.; Dashti, S. (2016): Seismic performance of shallow founded structures on liquefiable ground: validation of numerical simulations using centrifuge experiments. Journal of Geotechnical and Geoenvironmental Engineering, vol. 142, no. 6, 04016011. Kwon, O. S.; Elnashai, A. S. (2008): Seismic analysis of Meloland road overcrossing using multiplatform simulation software including SSI. Journal of Structural Engineering, vol. 134, no. 4, pp. 651-660.
654 CMES, vol.120, no.3, pp.629-656, 2019
Lade, P. V.; Duncan, J. M. (1975): Elastoplastic stress-strain theory for cohesionless soil. Journal of Geotechnical and Geoenvironmental Engineering, pp. 1037-1053. Lu, J.; Peng, J.; Elgamal, A.; Yang, Z.; Law, K. H. (2004): Parallel finite element modeling of earthquake ground response and liquefaction. Earthquake Engineering and Engineering Vibration, vol. 3, no. 1, pp. 23. Lu, J. (2006): Parallel Finite Element Modeling of Earthquake Site Response and Liquefaction (Ph.D. Thesis). Department of Structural Engineering, University of California, San Diego, USA. Lu, J.; Yang, Z.; Elgamal, A. (2006): OpenSeesPL three-dimensional lateral pile-ground interaction version 1.00 user’s manual. Report No. SSRP-06/03. Department of Structural Engineering, University of California, San Diego, USA. Lu, J.; Elgamal, A.; Yan, L.; Law, K. H.; Conte, J. P. (2011): Large-scale numerical modeling in geotechnical earthquake engineering. International Journal of Geomechanics, vol. 11, no. 6, pp. 490-503. Lu, J.; Kamatchi, P.; Elgamal, A. (2019): Using stone columns to mitigate lateral deformation in uniform and stratified liquefiable soil strata. International Journal of Geomechanics, vol. 19, no. 5, 04019026. Lysmer, J.; Kuhlemeyer, R. L. (1969): Finite dynamic model for infinite media. Journal of Engineering Mechanics Division, vol. 95, pp. 859-878. Mackie, K. R.; Lu, J.; Elgamal, A. (2012): Performance-based earthquake assessment of bridge systems including ground-foundation interaction. Soil Dynamics and Earthquake Engineering, vol. 42, pp. 184-196. Mahoney, M.; Francis, M.; Kennard, D. (2008): Performance of the Kawaihae harbor port facility resulting from the October 2006 earthquake. Solutions to Coastal Disasters, pp. 925-938. Maheshwari, B. K.; Truman, K. Z.; El Naggar, M. H.; Gould, P. L. (2004): Three- dimensional nonlinear analysis for seismic soil-pile-structure interaction. Soil Dynamics and Earthquake Engineering, vol. 24, no. 4, pp. 343-356. Mazzoni, S.; McKenna, F.; Fenves, G. L. (2006): Open System for Earthquake Engineering Simulation User Manual. Pacific Earthquake Engineering Research Center, University of California, Berkeley, CA. McGann, C. R.; Arduino, P. (2014): Numerical assessment of three-dimensional foundation pinning effects during lateral spreading at the Mataquito River Bridge. Journal of Geotechnical and Geoenvironmental Engineering, vol. 140, no. 8, 04014037. McGann, C. R.; Arduino, P. (2015): Numerical assessment of the influence of foundation pinning, deck resistance, and 3D site geometry on the response of bridge foundations to demands of liquefaction-induced lateral soil deformation. Soil Dynamics and Earthquake Engineering, vol. 79, pp. 379-390. McKenna, F. (2011): OpenSees: a framework for earthquake engineering simulation. Computing in Science and Engineering, vol. 3, no. 4, pp. 58-66. Mroz, Z. (1967): On the description of anisotropic work hardening. Journal of the Mechanics and Physics of Solids, vol. 15, no. 3, pp. 163-175.
OpenSees Three-Dimensional Computational Modeling of Ground-Structure 655
Parra, E. (1996): Numerical Modeling of Liquefaction and Lateral Ground Deformation Including Cyclic Mobility and Dilation Response in Soil Systems (Ph.D. Thesis). Rensselaer Polytechnic Institute, USA. Percher, M.; Bruin, W.; Dickenson, S.; Eskijian, M.; Oritatsu, Y. et al. (2013): Performance of port and harbor structures impacted by the March 11, 2011 Great Tohoku Earthquake & Tsunami. Ports 2013: Success Through Diversification, pp. 610-619. Prevost, J. H. (1977): Mathematical modelling of monotonic and cyclic undrained clay behaviour. International Journal for Numerical and Analytical Methods in Geomechanics, vol. 1, no. 2, pp. 195-216. Prevost, J. H. (1978): Plasticity theory for soil stress-strain behavior. Journal of the Engineering Mechanics Division, vol. 104, no. 5, pp. 1177-1194. Prevost, J. H. (1985): A simple plasticity theory for frictional cohesionless soils. Soil Dynamics and Earthquake Engineering, vol. 4, no. 1, pp. 9-17. Qiu, Z. (2020): Constitutive Modeling and Numerical Simulation of Soil-Structure Interaction Due to Liquefaction (Ph.D. Thesis). Department of Structural Engineering, University of California, San Diego, La Jolla, USA. Rayamajhi, D.; Nguyen, T. V.; Ashford, S. A.; Boulanger, R. W.; Lu, J. et al. (2013): Numerical study of shear stress distribution for discrete columns in liquefiable soils. Journal of Geotechnical and Geoenvironmental Engineering, vol. 140, no. 3, 04013034. Rayamajhi, D.; Ashford, S. A.; Boulanger, R. W.; Elgamal, A. (2016a): Dense granular columns in liquefiable ground. I: shear reinforcement and cyclic stress ratio reduction. Journal of Geotechnical and Geoenvironmental Engineering, vol. 142, no. 7, 04016023. Rayamajhi, D.; Boulanger, R. W.; Ashford, S. A.; Elgamal, A. (2016b): Dense granular columns in liquefiable ground. II: effects on deformations. Journal of Geotechnical and Geoenvironmental Engineering, vol. 142, no. 7, 04016024. Seed, H. B.; Idriss, I. M. (1967): Analysis of soil liquefaction: Niigata earthquake. Journal of the Soil Mechanics and Foundations Division, vol. 93, no. 3, pp. 83-108. Shin, H.; Arduino, P.; Kramer, S. L. (2007): Performance-based evaluation of bridges on liquefiable soils. Structural Engineering Research Frontiers, pp. 1-16. Shin, H.; Arduino, P.; Kramer, S. L.; Mackie, K. (2008): Seismic response of a typical highway bridge in liquefiable soil. Geotechnical Earthquake Engineering and Soil Dynamics IV, pp. 1-11. Su, L.; Lu, J.; Elgamal, A.; Arulmoli, A. K. (2017): Seismic performance of a pile-supported wharf: three-dimensional finite element simulation. Soil Dynamics and Earthquake Engineering, vol. 95, pp. 167-179. Su, L.; Wan, H. P.; Li, Y.; Ling, X. Z. (2018): Soil-pile-quay wall system with liquefaction-induced lateral spreading: experimental investigation, numerical simulation, and global sensitivity analysis. Journal of Geotechnical and Geoenvironmental Engineering, vol. 144, no. 11, 04018087. Tang, L.; Cong, S.; Ling, X.; Lu, J.; Elgamal, A. (2015): Numerical study on ground improvement for liquefaction mitigation using stone columns encased with geosynthetics. Geotextiles and Geomembranes, vol. 43, no. 2, pp. 190-195.
656 CMES, vol.120, no.3, pp.629-656, 2019
Torabi, H.; Rayhani, M. T. (2014): Three-dimensional finite element modeling of seismic soil-structure interaction in soft soil. Computers and Geotechnics, vol. 60, pp. 9-19. Wang, N.; Lu, J.; Elgamal, A. (2013): Lateral load on a large pile group: a 3D finite element model. IACGE 2013: Challenges and Recent Advances in Geotechnical and Seismic Research and Practices, pp. 677-684. Wang, N. (2015): Three-Dimensional Modeling of Ground-Pile Systems and Bridge Foundations (Ph.D. Thesis). University of California San Diego, USA. Yang, Z. (2000): Numerical Modeling of Earthquake Site Response Including Dilation and Liquefaction (Ph.D. Thesis). Columbia University, USA. Yang, Z.; Elgamal, A. (2002): Influence of permeability on liquefaction-induced shear deformation. Journal of Engineering Mechanics, vol. 128, no. 7, pp. 720-729. Yang, Z.; Elgamal, A.; Parra, E. (2003): Computational model for cyclic mobility and associated shear deformation. Journal of Geotechnical and Geoenvironmental Engineering, vol. 129, no. 12, pp. 1119-1127. Yang, Z.; Elgamal, A. (2008): Multi-surface cyclic plasticity sand model with Lode angle effect. Geotechnical and Geological Engineering, vol. 26, no. 3, pp. 335-348. Yang, Z.; Lu, J.; Elgamal, A. (2008): OpenSees Soil Models and Solid-Fluid Fully Coupled Elements: User’s Manual. Department of Structural Engineering, University of California, San Diego, USA. Youd, T. L. (1989). Ground failure damage to buildings during earthquakes. Foundation Engineering: Current Principles and Practices, pp. 758-770. Zhang, Y.; Conte, J. P.; Yang, Z.; Elgamal, A.; Bielak, J. et al. (2008): Two-dimensional nonlinear earthquake response analysis of a bridge-foundation-ground system. Earthquake Spectra, vol. 24, no. 2, pp. 343-386. Zienkiewicz, O. C.; Chan, A. H. C.; Pastor, M.; Paul, D. K.; Shiomi, T. (1990): Static and dynamic behaviour of soils: a rational approach to quantitative solutions. I. Fully saturated problems. Proceedings of the Royal Society of London. Series A, Mathematical and Physical Sciences, pp. 285-309.