open source intelligence from web 2.0 media osint web2.pdf · open source intelligence from web 2.0...
TRANSCRIPT

Open Source Intelligence from Web 2.0 Media
1
Miltos Kandias, Vasilis Stavrou
November 2014

Open Source Intelligence from Web 2.0 Media
Miltos Kandias, Vasilis Stavrou
Information Security & Critical Infrastructure Protection Laboratory Dept. of Informatics, Athens University of Economics & Business, Greece
2
Technical Report AUEB/INFOSEC/Rev-1114/v.1.1 INFOSEC Laboratory, Dept. of Informatics Athens University of Economics & Business November 2014

Outline
• Web 2.0 and Online Social Networks (OSN)
• Open Source Intelligence (OSINT)
• Threats and Opportunities
• Behavior prediction capabilities
Case 1: Success story - Insider detection and narcissism
Case 2: Success story - Predisposition towards law enforcement
Case 3: Success story - Detecting stress levels
Case 4: Horror story - Revealing political beliefs
• Conclusions
3

Web 2.0 & Online Social Networks
• OSN and Web 2.0 enable users add online content.
• Content can be crawled and utilized for:
- personalized advertising,
- personalized content promotion and
- user/usage profiling
• Users are not really aware of the reach of the info the share.
• Can content be crawled and utilized for:
- User behavior prediction?
- User psychosocial characteristics extraction?
- Proactive cyber defense?
4 Source: http://socialmediatoday.com/

Open Source Intelligence
• Open Source Intelligence is produced from publicly available information, which is: – collected, exploited and disseminated in a timely manner,
– offered to an appropriate audience and
– used for the purpose of addressing a specific intelligence requirement.
• Publicly available information refers to (not only): – traditional media (e.g. television, newspapers, radio),
– web-based communities (e.g. social networking sites, blogs),
– public data (e.g. government reports, official data, hearings) and
– amateur observation and reporting (e.g. amateur spotters, radio monitors).
• OSINT defined by DoD (Public Law 109-163, sec. 931,"National Defense Authorization Act for Fiscal Year 2006“).
5
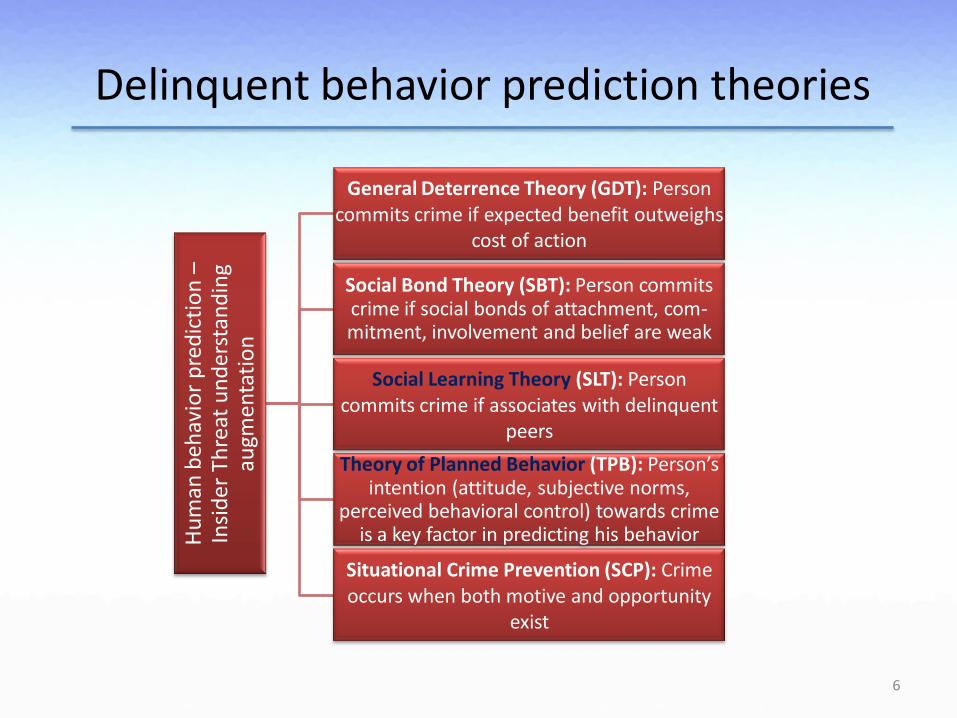
Delinquent behavior prediction theories
Hu
man
beh
avio
r p
red
icti
on
–
Insi
der
Th
reat
un
der
stan
din
g au
gmen
tati
on
General Deterrence Theory (GDT): Person commits crime if expected benefit outweighs
cost of action
Social Bond Theory (SBT): Person commits crime if social bonds of attachment, com-mitment, involvement and belief are weak
Social Learning Theory (SLT): Person commits crime if associates with delinquent
peers
Theory of Planned Behavior (TPB): Person’s intention (attitude, subjective norms,
perceived behavioral control) towards crime is a key factor in predicting his behavior
Situational Crime Prevention (SCP): Crime occurs when both motive and opportunity
exist
6

Open Source Intelligence from Web 2.0 Media
7

Case 1 Scope: Insider threat prediction
based on Narcissism
8
OSINT OSN: Twitter
Tools used for the analysis
Science Theory
Computing Graph Theory
Sociology Psychology
Theory of Planned Behavior
Social Learning Theory
Application: insider threat detection/prediction, influential users detection, means of communication evaluation.

Insider Threat
• Trade secrets
• Account numbers
• Social Security Numbers
• Intellectual property
Data
• Network storage
• Shared folders
• Removable devices
• Transmitted data
can leak •Competitor
•Regulator
•Unauthorized personnel
•Press or media
to outsider
•Company defamation
•Monetary expenses
•Legal liabilities
•Asset loss
•Customer relations
•End business
impact
• The insider threat is a severe problem in cyber/corporate security, which originates from persons who:
- are legitimately given access rights to information systems,
- misuse privileges and
- violate security policy.
9

In a nutshell
10

Case 1: Insider threat prediction based on Narcissism
Narcissistic behavior detection
Study: Motive, ego/self-image, entitlement
Means: Usage Intensity, Influence valuation,
Klout score
• Individuals tend to transfer offline behavior online.
• Trait of narcissism directly relates to insider threats, OSN popularity & influence.
• Utilize graph theoretic tools to perform analysis.
• Valuation of social media popularity and usage intensity.
• Twitter data to become open. • Trait of narcissism relates to
delinquent behavior via : – sense of entitlement, – lack of empathy, – anger and “revenge” syndrome, – inflated self-image.
11

Dataset: General parameters
• Focus on a Greek Twitter community: – Context sensitive research.
– Utilize ethnological features rooted in locality.
– Extract and analyze results.
• Analysis of content and measures of user influence and usage intensity.
• User categories: follower, following and retweeter.
• Graph: – Each user is a node.
– Every interaction is a directed edge.
• 41.818 fully crawled users (personal and statistical data) – Name, ID, personal description, URL, language, geolocation, profile
state, lists, # of following/followers, tweets, # of favorites, # of mentions, # of retweets.
12
7.125.561 connections among them
Twitter (Greece, 2012-13)

• Strongly connected components:
– There exists 1 large component (153.121 nodes connected to each other) and several smaller ones
• Node Loneliness:
– 99% of users connected to someone
• Small World Phenomenon:
– Every user lies <6 hops away from anyone
• Indegree Distribution:
– # of users following each user
– Average 13.2 followers/user
• Outdegree Distribution:
– # of users each user follows
– Average 11 followers/user
• Usage Intensity Distribution:
Weighted aggregation of {# of followers, #of followings, tweets, retweets, mentions, favorites, lists}
Graph Theoretical approach
13
Important cluster of users
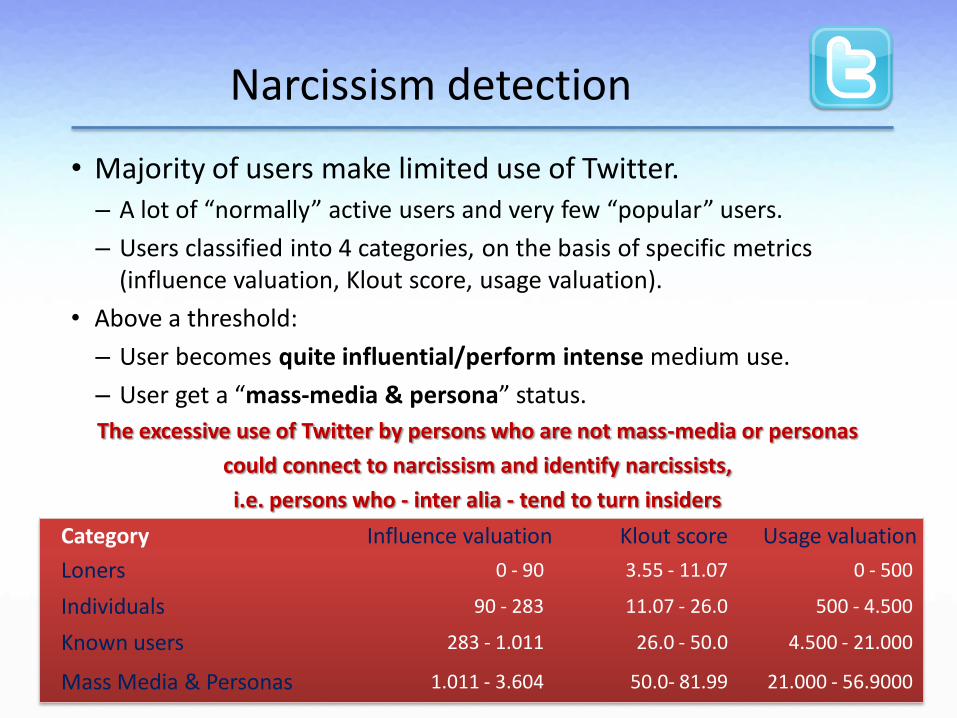
• Majority of users make limited use of Twitter. – A lot of “normally” active users and very few “popular” users.
– Users classified into 4 categories, on the basis of specific metrics (influence valuation, Klout score, usage valuation).
• Above a threshold:
– User becomes quite influential/perform intense medium use.
– User get a “mass-media & persona” status.
The excessive use of Twitter by persons who are not mass-media or personas
could connect to narcissism and identify narcissists,
i.e. persons who - inter alia - tend to turn insiders
Narcissism detection
14
Category Influence valuation Klout score Usage valuation
Loners 0 - 90 3.55 - 11.07 0 - 500
Individuals 90 - 283 11.07 - 26.0 500 - 4.500
Known users 283 - 1.011 26.0 - 50.0 4.500 - 21.000
Mass Media & Personas 1.011 - 3.604 50.0- 81.99 21.000 - 56.9000

Group dynamics
• Create reliable graphs of interconnection, i.e. visualization of groups of people according to their relationships and common interests.
• Compare deviating usage behavior according to a set of parameters, maximize efficiency.
15
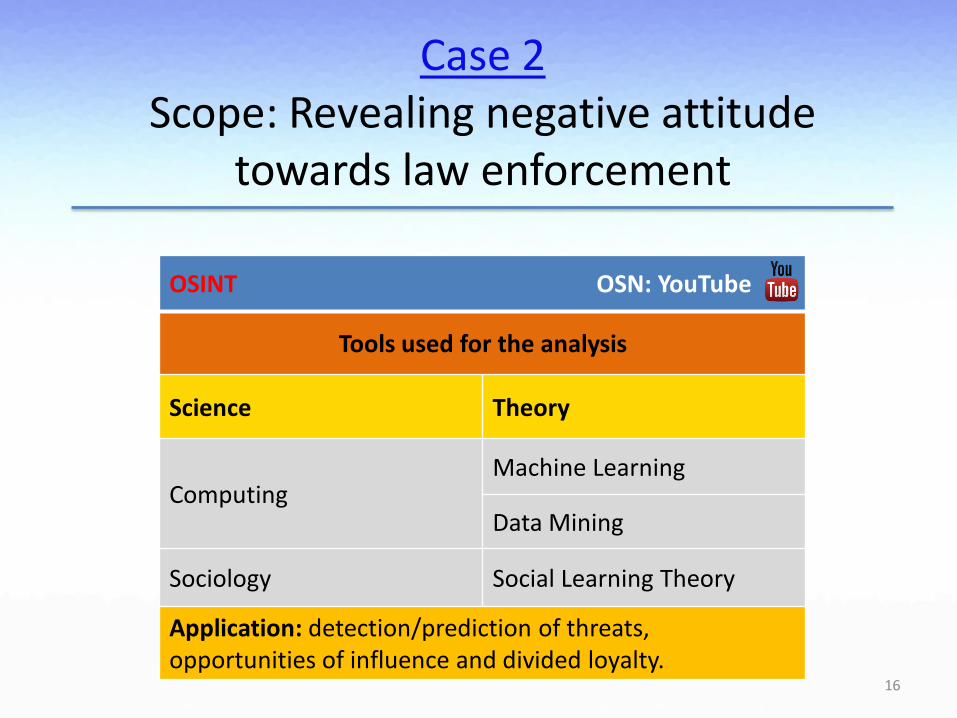
Case 2 Scope: Revealing negative attitude
towards law enforcement
16
OSINT OSN: YouTube
Tools used for the analysis
Science Theory
Computing Machine Learning
Data Mining
Sociology Social Learning Theory
Application: detection/prediction of threats, opportunities of influence and divided loyalty.

In a nutshell
17
Flat data path
Co
mm
ents classificatio
n p
ath

Case 2: Revealing negative attitude towards law enforcement
Law enforcement
predisposition
Study: Motive, anger, frustrations,
predisposition towards law enforcement
Means: Machine Learning, comment
classification, flat data classification.
• Individuals tend to transfer offline behavior online.
• Extract results about users’ negative attitude towards law enforcement and authorities (government, army, police, hierarchy).
• Trait of negative attitude towards law enforcement is connected to delinquent behavior via:
– sense of entitlement,
– lack of empathy,
– anger and revenge syndrome and
– inflated self-image. 18

Dataset: General parameters
• Crawled YouTube and created dataset consists solely of Greek users.
• Utilized YouTube REST-based API (developers.google.com/youtube/): – Only publicly available data collected.
– Quote limitations (posed by YouTube) were respected.
• Collected data were classified into three categories: – user-related information (profile, uploaded videos, subscriptions, favorite
videos, playlists),
– video-related information (license, # of likes, # of dislikes, category, tags) and
– comment-related information (comment content, # of likes, # of dislikes).
• Time span of collected data covered 7 years (Nov 2005 - Oct 2012).
• A basic anonymization layer added to the collected data: – MD5 hashes instead of usernames.
19
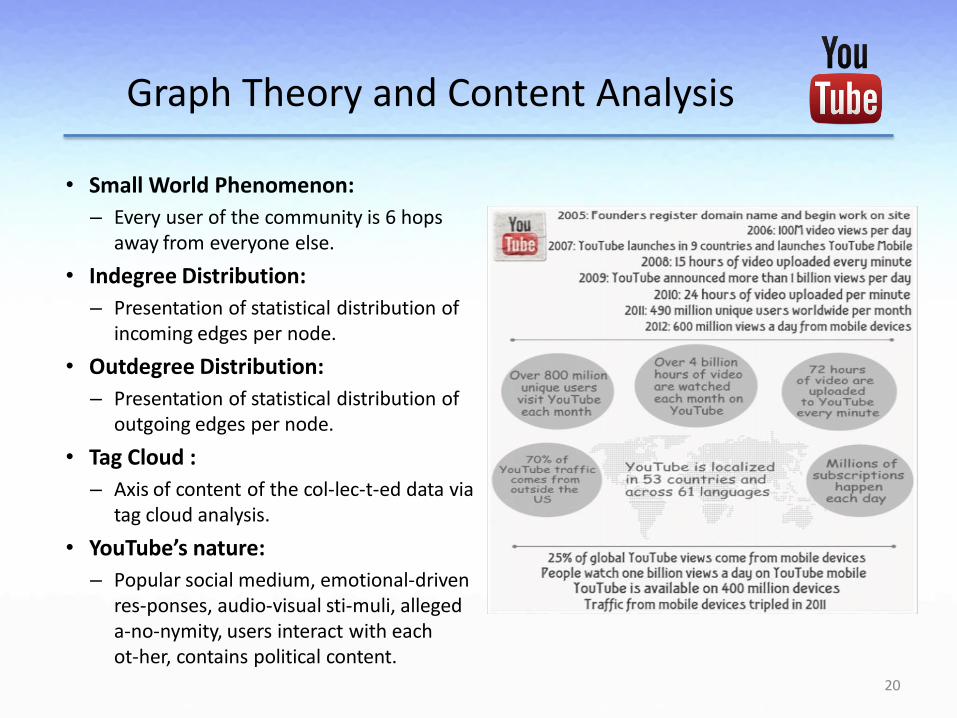
• Small World Phenomenon:
– Every user of the community is 6 hops away from everyone else.
• Indegree Distribution:
– Presentation of statistical distribution of incoming edges per node.
• Outdegree Distribution:
– Presentation of statistical distribution of outgoing edges per node.
• Tag Cloud :
– Axis of content of the collected data via tag cloud analysis.
• YouTube’s nature:
– Popular social medium, emotional-driven responses, audio-visual stimuli, alleged anonymity, users interact with each other, contains political content.
Graph Theory and Content Analysis
20

• Comment classified into categories of interest: – Process performed as text classification.
– Machine trained with text examples and the category each one belongs to.
– Excessive support by field expert (Sociologist).
• Test set used to evaluate efficiency of resulting classifier: – Contains pre-labeled data fed to machine, labeled by field expert.
– Check if initial assigned label is equal to predicted one.
– Testing set labels assigned by field expert.
• Most comments are written in Greek – greeklish comments exist.
• Training sets (greeklish, greek) were merged – One classifier was trained.
• Two categories of content were defined: – Users with a negative attitude (Predisposed negatively (P)).
– Users with a not negative attitude (Not-predisposed negatively (N)).
Machine Learning (1)
21
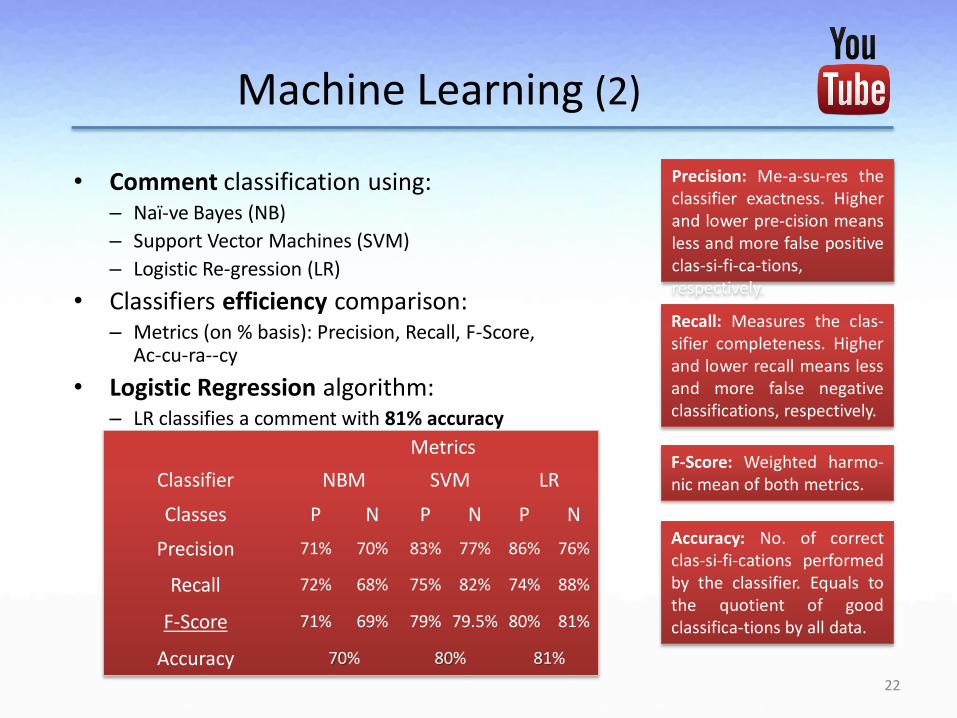
• Comment classification using: – Naïve Bayes (NB)
– Support Vector Machines (SVM)
– Logistic Regression (LR)
• Classifiers efficiency comparison: – Metrics (on % basis): Precision, Recall, F-Score,
Accuracy
• Logistic Regression algorithm: – LR classifies a comment with 81% accuracy
Machine Learning (2)
Precision: Measures the classifier exactness. Higher and lower precision means less and more false positive classifications, respectively.
Recall: Measures the clas-sifier completeness. Higher and lower recall means less and more false negative classifications, respectively.
F-Score: Weighted harmo-nic mean of both metrics.
Accuracy: No. of correct classifications performed by the classifier. Equals to the quotient of good classifica-tions by all data.
Metrics
Classifier NBM SVM LR
Classes P N P N P N
Precision 71% 70% 83% 77% 86% 76%
Recall 72% 68% 75% 82% 74% 88%
F-Score 71% 69% 79% 79.5% 80% 81%
Accuracy 70% 80% 81%
22

• Video classification: – Examination of a video on the basis of its comments.
– Voter process to determine category classification.
• (Video) Lists classification: – Voter process to determine category classification (same threshold).
• Conclusions about user behavior: – If there is at least one category P attribute then the user is classified into
category P.
Machine Learning (3)
User Uploads
Comments Favorites
Playlists
23

Flat Data
• Addressing the problem from a different perspective: – assumption-free and easy-to-scale method,
– verify (or not) the results of the Machine Learning approach,
– machine trained by a set of users of categories P and N.
• Data transformation: – User represented by a tuple (username, content of comment, video ID the
comment refers to, country, age, genre, # of subscribers, # of video views).
• Machine trained by a user test set (Sociologist served as field expert).
24
• Connection between users of category P and confidence of accuracy of comments belonging to category P. Blue: Users of category P classified on the basis of the comment-oriented tuple (Flat Data).
Red: Users of category P classified on the basis of their comments-only (Machine Learning).
1721 users are (almost certainly) negatively predisposed towards
law enforcement
Metrics
Approach Machine Learning Flat Data
Classifier Logistic Regression Naïve Bayes
Classes P N P N
Precision 86% 76% 72% 93%
Recall 74% 88% 92% 73%
F-Score 80% 81% 81% 82%
Accuracy 81% 81%

Case 3 Scope: Detecting stress level usage
patterns (overall and over time)
25
OSINT OSN: Facebook
Tools used for the analysis
Science Tool
Computing Machine Learning
Data Mining
Psychiatry-Psychology BAI stress test
Application: detection/prediction of vulnerable individuals & potential threats, momentum of engagement etc.

In a nutshell
26

Case 3: Detecting stress level usage pattern (overall and over time)
Stress level detection
Study: User’s overall and over time stress level
Means: Machine Learning, flat data
classification, chronicity analysis.
• Individuals tend to transfer offline behavior online.
• Extract results about usage pattern depicted stress level.
• Analyze each user under the prism of stress level both overall and over time (chronicity analysis).
• High stress has been found to:
– Make individuals vulnerable to fall prey to third parties.
– Overcome moral inhibitions.
• Analysis is based on Social Learning Theory and stress correlations are based on Beck’s Anxiety Inventory stress test.
27

405 users 12.346 user
groups 98.256 liked
objects 171.054 statuses
250.027 comments
Dataset: General parameters
• Crawled Facebook & created dataset solely by Greek users. • Users offered informed consent. • Utilized Facebook’s Graph API: – Only publicly available data collected. – De facto respect of users’ privacy settings.
• Collected data were classified into four categories: – User information (friends list and profile description), – user-generated content (statuses, comments and links), – groups of interest (communities, events and activities) and – interests (music, actors, sports, books etc.).
• A basic anonymization layer added to the collected data: – MD5 hashes instead of usernames.
• Opt-out ability integrated, delete all user data upon selection. • Dataset statistical analysis proved its efficiency and absence of bias.
28

Flat classification (overall indicators)
• Goal: extract correlations between usage patterns and users who share same stress valuation (according to BAI test).
• Transformed relational database into a single tuple record containing solely users’ comments and statuses.
• Flat data tuple subjected to stemming process.
• EM algorithm produced 3 clusters: – Cluster 0 has too few users.
– Cluster 1 includes users with high and medium-to-high stress score.
– Cluster 2 includes users with low and medium-to-low stress score.
29
0%
10%
20%
30%
40%
50%
Cluster 0 Cluster 1 Cluster 2
High Stress
Medium Stress
Low Stress

Chronicity analysis (indicators over time)
• Goal: detect differentiations of OSN usage patterns over time related to depicted stress level.
• Split users’ usage pattern into time periods (from one day to one month). – Time period of one week produced best results.
• Chronicity analysis system consists of 2 modules: – Preprocessing data module (responsible for the processing of input data).
– Usage pattern analysis module (responsible for analyzing usage patterns based on a set of metrics).
• Usage pattern fluctuations depict differentiated medium usage.
30

Chronicity analysis steps Step 1: Classify user gene-rated content into 4 prede-fined categories (‘S’ stands for sports, ‘M’ for music, ‘P’ for politics and ‘Mi’ for mis-cellaneous).
Step 2: Calculate following metrics for each user and time period (metrics deve-loped on an ad-hoc basis according to our observati-ons).
Step 3: Transform metrics results into arithmetic vec-tors and perform data min-ing on them using (a) K-means, (b) EM, and (c) Ca-nopy algorithms. Utilize vo-ter to decide fluctuations.
31
Classifier NBM SVM MLR
Classes S M P Mi S M P Mi S M P Mi
Precision 71 92 79 74 79 97 87 70 89 96 85 68
Recall 77 86 85 67 72 89 75 88 72 89 75 86
F-Score 74 89 81 70 75 93 81 78 79 93 80 76
Accuracy 79 81 80
Frequency of posts regarding sports
Frequency of posts regarding music
Frequency of posts regarding politics
Frequency of posts regarding miscellaneous
Interest shift per interest pair
Average frequency of posting
Average frequency of commenting
Major interests
Minor interest shift frequency
Frequency of uploading photos
CommentedBy ratio
StatusVarianceFlattened
CommentVarianceFlattened
User Content
Data Processing Chronicity Analysis
SVM K-means
Canopi
EM
Cluster 1
Cluster n
.
.
Cluster 1
Cluster m
.
.
Cluster 1
Cluster k
.
.
Deviating period selection
process
Deviating period selection
process
Deviating period selection
process
Voter
Deviating usage pattern cluster
selection process
Deviating usage pattern cluster
selection process
Deviating usage pattern cluster
selection process
Final deviating
period selection process
Clustering Voter
Content Classification

Chronicity analysis results
• Metrics results per detected cluster.
• Visual representation of users belonging to each cluster.
• Clusters 0 and 3 contain mainly users classified in high stress category.
• In cluster 0, users post mainly photos.
• In cluster 3 users post photos, discuss about music, whereas a small fraction of the content is referring to miscellaneous information.
• Clusters 1 and 7 contain many users classified in medium or low stress category.
• Clusters 1 and 7 refer mainly to music and miscellaneous content and also contain limited content referring to sports.
32
Cluster id 1 2 3 4 5 6 7
Population 7% 16% 8% 3% 1% 7% 9%
TotalComments 3 78 93 5 79 410 44
TotalPosts 588 227 513 185 704 914 292
SportsFreq 0,00 0,01 0,00 0,00 0,00 0,02 0,03
MusicFreq 0,02 0,34 0,61 0,05 0,17 0,43 0,28
PoliticsFreq 0,00 0,06 0,02 0,00 0,04 0,05 0,15
MiscellaneousFreq 0,02 0,22 0,09 0,04 0,13 0,18 0,22
PhotosFreq 0,68 0,08 0,06 0,39 0,40 0,10 0,13
CommentsFreq 0,05 0,41 0,57 0,03 0,61 2,42 0,26
StatusesFreq 10,39 1,36 3,32 1,56 6,33 5,29 1,99
MinorInterestSift_Freq
0,01 0,18 0,13 0,02 0,12 0,16 0,24
CommentedBy ratio 0,08 1,25 0,73 0,27 0,65 1,52 0,88
StatusDispersalFlattened
34,89 3,01 4,93 7,85 15,20 7,98 6,28
CommentDispersalFlattened
0,01 1,52 0,95 0,06 1,08 5,95 0,60

Case 4 Scope: Identifying Political Beliefs
33
OSINT OSN: YouTube
Tools used for the analysis
Science Theory
Computing Machine Learning
Data Mining
Political Sociology
Horror story

In a nutshell
34

Horror story
Case 4: Horror story – Identifying Political Beliefs
Divided loyalty
Study: Motive, ideology, divided/reduced loyalty, predisposition towards
law enforcement
Means: Machine Learning, Content Analysis, comment
classification
• Same YouTube dataset.
• Political beliefs profiling-clustering.
• Three (indicative, local context based) clusters: Radical – Neutral – Conservative.
• Machine Learning and Content Analysis methods used.
• Massive ethical issues.
• Goal: raise community awareness.
35

• Three (indicative) categories: Radical, Neutral, Conservative:
– Assumptions are local-context-dependent (Greece, 2007-12).
– Test case consists of an indicative subset of the local community.
– Analysis reflects the current local political scene.
• Defined (indicative) classes:
– Radical political affiliation: center-left, left, far-left.
– Neutral political affiliation: neutral or non-specified political affiliation disclosed.
– Conservative political affiliation: center-right, right, far-right.
• Comments classification:
– Comments classification performed as text classification.
– Machine trained with text examples and the category each one belongs to.
– Assistance of field expert (Sociologist).
Methodology
36

• Comment classification by: – Naïve Bayes Multinomial (NBM)
– Support Vector Machines (SVM)
– Multinomial Logistic Regression (MLR)
• Each classifier’s efficiency was compared by: – Metrics (%): Precision, Recall, F-Score, Accuracy
• Multinomial Logistic Regression was chosen: – MLR classifies appropriately a comment with 87% accuracy.
– Use of precision, recall and f-score to further examine classifiers' efficiency.
Precision: Measures the classifier exactness. Higher and lower precision means less and more false positive classifications, respectively.
Recall: Measures the clas-sifier completeness. Higher /lower recall means less/ more false negative classify-cations, respectively.
F-Score: Weighted harmo-nic mean of both metrics.
Accuracy: No. of correct classifications performed by the classifier. Equals to the quotient of good classifica-tions by all the data.
Metrics
Classifier NBM SVM MLR
Classes R N C R N C R N C
Precision 65% 93% 55% 75% 91% 74% 83% 91% 77%
Recall 83% 56% 85% 80% 89% 73% 77% 93% 78%
F-Score 73% 70% 60% 76% 89% 73% 80% 92% 77%
Accuracy 68% 84% 87%
Analysis of results
37

2% of comments demonstrate political affiliation (0.7% Radical, 1.3% Conservative)
– 2% means that almost 41.000 comments (of the 2.000.000 collected) include political
content.
7% of videos classified into a specific category (2% Radical, 5% Conservative)
– 7% means that almost 14.000 videos (of the 200.000 collected) include political content.
12% of users express Radical political affiliation and 40% Conservative
affiliation
– 52% means that 6.760 users reveal - one way or another - their political beliefs.
Basic observations
38
Radical 12%
Conservative 40%
Neutral 48%

Some general conclusions
Web 2.0 produces vast amounts of crawlable information and OSINT
may transform this information into intelligence.
OSINT can assist in detecting narcissistic behavior, predisposition
towards law enforcement, divided political loyalty, etc.
OSINT can be a proactive cyber-defense tool and predict threats,
predict delinquent behavior, assist in law enforcement and assess
influence opportunities.
OSINT may lead to unwanted horror stories.
OSINT intrusive nature dictates limited use, e.g. security officers
selection, critical infrastructure protection, national security. 39

References
1. Gritzalis D., Stavrou V., Kandias M., Stergiopoulos G., “Insider Threat: Εnhancing BPM through Social Media”, in Proc. of the 6th IFIP International Conference on New Technologies, Mobility and Security (NMTS-2014), Springer, UAE, 2014.
2. Gritzalis D., “Insider threat prevention through Open Source Intelligence based on Online Social Networks”, Keynote address, 13th European Conference on Cyber Warfare and Security (ECCWS-2014), Greece, 2014.
3. Gritzalis D., Kandias M., Stavrou V., Mitrou L., "History of Information: The case of Privacy and Security in Social Media", in Proc. of the History of Information Conference, Law Library Publications, Athens, 2014.
4. Kandias M., Mitrou L., Stavrou V., Gritzalis D., “Which side are you on? A new Panopticon vs. privacy”, in Proc. of the 10th International Conference on Security and Cryptography (SECRYPT-2013), pp. 98-110, Iceland, 2013.
5. Kandias M., Galbogini K., Mitrou L., Gritzalis D., "Insiders trapped in the mirror reveal themselves in social media", in Proc. of the 7th International Conference on Network and System Security (NSS-2013), pp. 220-235, Springer (LNCS 7873), Spain, June 2013.
6. Kandias M., Virvilis N., Gritzalis D., "The Insider Threat in Cloud Computing", in Proc. of the 6th International Conference on Critical Infrastructure Security (CRITIS-2011), pp. 93-103, Springer (LNCS 6983), United Kingdom, 2013.
7. Kandias M., Stavrou V., Bozovic N., Mitrou L., Gritzalis D., "Can we trust this user? Predicting insider’s attitude via YouTube usage profiling", in Proc. of 10th IEEE International Conference on Autonomic and Trusted Computing (ATC-2013), pp. 347-354, IEEE Press, Italy, 2013.
8. Kandias M., Stavrou V., Bosovic N., Mitrou L., Gritzalis D., “Proactive insider threat detection through social media: The YouTube case”, in Proc. of the 12th Workshop on Privacy in the Electronic Society (WPES-2013), pp. 261-266, ACM Press, Germany, 2013.
9. Kandias M., Virvilis N., Gritzalis D., “The Insider Threat in Cloud Computing”, in Proc. of the 6th International Workshop on Critical Infrastructure Security (CRITIS-2011), Bologna S., et al (Eds.), pp. 93-103, Springer (LNCS 6983), Switzerland, 2011.
10. Kandias M., Mylonas A., Virvilis N., Theoharidou M., Gritzalis D., “An Insider Threat Prediction Model”, in Proc. of the 7th International Conference on Trust, Privacy, and Security in Digital Business (TrustBus-2010), pp. 26-37, Springer (LNCS-6264), Spain, 2010.
11. Mitrou L., Kandias M., Stavrou V., Gritzalis D., "Social media profiling: A Panopticon or Omniopticon tool?", in Proc. of the 6th Conference of the Surveillance Studies Network, Spain, 2014.
12. Pipyros K., Mitrou L., Gritzalis D., Apostolopoulos T., "A Cyber Attack Evaluation Methodology", in Proc. of the 13th European Conference on Cyber Warfare and Security (ECCWS-2014), Greece, 2014.
13. Stavrou V., Kandias M., Karoulas G., Gritzalis D., "Business Process Modeling for Insider threat monitoring and handling", in Proc. of the 11th International ConferenceTheoharidou M., Kotzanikolaou P., Gritzalis D., "Towards a Criticality Analysis Methodology: Redefining Risk Analysis for Critical Infrastructure Protection", in Proc. of the 3rd IFIP International Conference on Critical Infrastructure Protection (CIP-2009), Springer, USA, 2009. 40