open research onlineoro.open.ac.uk/42100/3/2936-13776-2-pb.pdf · real time data and live actors....
TRANSCRIPT

Open Research OnlineThe Open University’s repository of research publicationsand other research outputs
The use of 3D visualisation for urban development,regeneration, and Smart City demonstration projects:Bath, Buckinghamshire, and Milton KeynesJournal ItemHow to cite:
Bailey, Stewart; Deshpande, Advait and Miller, Alby (2014). The use of 3D visualisation for urban development,regeneration, and Smart City demonstration projects: Bath, Buckinghamshire, and Milton Keynes. Bollettino DelCentro Calza Bini (BDC), 14(2) pp. 423–435.
For guidance on citations see FAQs.
c© [not recorded]
Version: Version of Record
Link(s) to article on publisher’s website:http://dx.doi.org/doi:10.6092/2284-4732/2936http://www.serena.unina.it/index.php/bdc/article/view/2936
Copyright and Moral Rights for the articles on this site are retained by the individual authors and/or other copyrightowners. For more information on Open Research Online’s data policy on reuse of materials please consult the policiespage.
oro.open.ac.uk


Vol. 14, 2/2014
BDC, print ISSN 1121-2918, electronic ISSN 2284-4732 241
Indice/Index
243 Editorial
Luigi Fusco Girard
251 Valuation and evaluation in complex real
systems: a synergistic mapping and policy
template
Joe Ravetz
267 “Economic democracy”, political democracy
and evaluation frameworks
Giuseppe Munda
285 Using linguistic descriptions with multi-criteria
decision aid approaches in urban energy
systems
Arayeh Afsordegan, Mónica Sánchez, Núria
Agell, Gonzalo Gamboa, Lázaro V. Cremades
301 Technological solutions aiming at recovering
metro braking energy: a multi-criteria analysis
case study
Annalia Bernardini, Ricardo Barrero, Cathy
Macharis, Joeri Van Mierlo
327 Dissesto superficiale e gestione agricola del
suolo: un’applicazione dei rough sets basati
sulla dominanza
Lucia Rocchi, Gianluca Massei, Luisa Paolotti,
Antonio Boggia
343 La valutazione per la valorizzazione del
Paesaggio Storico Urbano: una proposta per il
sito UNESCO della “Costa d’Amalfi”
Marianna D’Angiolo, Pasquale De Toro

Vol. 14, 2/2014
BDC, print ISSN 1121-2918, electronic ISSN 2284-4732 242
367 Una proposta metodologica per la valutazione
dei landscape services nel paesaggio culturale
terrazzato
Antonia Gravagnuolo
387 Investigating conditions ensuring reliability of
the priority vectors
Bice Cavallo, Livia D’Apuzzo, Luciano Basile
397 I porti di Tangeri: potenzialità per uno sviluppo
sostenibile
Paola Carone
415 Students’ perceptions of innovation in
sustainable development technologies and their
role to optimise higher education’s quality
Hella Ben Brahim Neji, Adel Besrour
423 The use of 3D visualisation for urban
development, regeneration and smart city
demonstration projects: Bath,
Buckinghamshire, and Milton Keynes
Stewart Bailey, Advait Deshpande, Alby Miller

Vol. 14, 2/2014 The use of 3D visualisation for urban development
BDC, print ISSN 1121-2918, electronic ISSN 2284-4732 423
THE USE OF 3D VISUALISATION FOR URBAN DEVELOPMENT, REGENERATION AND SMART CITY DEMONSTRATION PROJECTS: BATH, BUCKINGHAMSHIRE, AND MILTON KEYNES
Stewart Bailey, Advait Deshpande, Alby Miller
Abstract
The aim of this paper is to discuss three different case studies related to the use of 3D
visualisation for projects focussing on urban development, regeneration, and Smart City
demonstrations. With each of the case studies, the problem statement, the approach adopted
for 3D visualisation, and the outcome is covered. The paper concludes by discussing what
3D visualisation offered to each project. The paper discusses how in order to effectively use
3D visualisation the approach needs to be adapted according to the problem statement.
Depending on the project requirement, 3D visualisation is likely to serve multiple purposes
in urban development, regeneration, and Smart City demonstration projects. The paper
suggests that the use of 3D visualisation adds an extra dimension to presenting data and
also provides an effective tool for analysing the data.
Keywords: 3D visualisation, urban development and regeneration, Smart City
L’USO DELLA VISUALIZZAZIONE 3D PER PROGETTI DI SVILUPPO URBANO, RIGENERAZIONE E SMART CITY: BATH, BUCKINGHAMSHIRE, E MILTON KEYNES
Sommario
Obiettivo dell’articolo è presentare tre casi di studio relativi all’uso della visualizzazione
3D in progetti incentrati sui temi dello sviluppo urbano e della rigenerazione, e dimostrativi
del concetto di Smart City. Per ognuno dei casi studio, sono individuati la definizione del
problema, l’approccio adottato per la visualizzazione 3D ed i risultati. Nelle conclusioni
viene esaminato il contributo che la visualizzazione 3D è stata in grado di offrire a ciascun
progetto. L’articolo evidenzia come, per usare efficacemente la visualizzazione 3D, sia
necessario adeguare l’approccio al problema in esame. In base alle esigenze del progetto, la
visualizzazione 3D può servire a molteplici scopi nei progetti di sviluppo urbano,
rigenerazione e Smart City. L’articolo mostra come l’utilizzo della visualizzazione 3D
aggiunga una dimensione ulteriore alla presentazione dei dati e fornisca uno strumento
efficace per la loro analisi.
Parole chiave: visualizzazione 3D, sviluppo urbano e rigenerazione, Smart City
Vol. 14, 2/2014 The use of 3D visualisation for urban development
BDC, print ISSN 1121-2918, electronic ISSN 2284-4732 424
1. Introduction
This paper discusses three different case studies about the use of 3D visualisation for
projects concerned with urban development, regeneration, and Smart City (Caragliu et al.,
2009) demonstrations. The paper does not compare or debate the relative merits or demerits
of various methods and technologies that rely on 3D visualisation for urban development,
regeneration, and Smart City demonstration projects. The aim is to discuss Virtual
Viewing's approach for utilising 3D visualisation. For this purpose, the following case
studies are presented:
an urban development housing project in Bath, United Kingdom (UK);
the Buckinghamshire Thames Valley Local Enterprise Partnership (BTVLEP)
Geographic Information System (GIS) project;
a Smart City demonstration for Milton Keynes (MK).
For each of the above case studies, the paper covers the problem statement and the role
played by 3D visualisation in the execution of the project. Although 3D visualisation
formed an important part of the solution, the paper also considers how 3D visualisation was
combined with other methods in order to achieve the required results. The concluding
section analyses how Virtual Viewing (VV) adapted 3D visualisation to represent data in a
meaningful way. The relevance of 3D visualisation for each of the projects is also
discussed.
2. Urban development: Crest Nicholson Bath Riverside
This case study focuses on the requirements and the eventual solution offered to Crest
Nicholson for their multi-phase real estate development project in Bath, UK. Crest
Nicholson is a British house-building company listed on the London Stock Exchange and a
constituent of the FTSE 250 index (London Stock Exchange, 2014). It has building
operations mostly concentrated in the southern UK.
The problem statement
Crest Nicholson needed an interactive and innovative solution for their sales staff. In this
case, the solution was expected to be customised for their site in Bath. This site was
undergoing a multi-phase development of a riverside property including a block of flats.
The work done by Virtual Viewing was specific to the second phase of this development
project. Crest Nicholson expected the solution to combine animation of the actual site with
real time data and live actors. To enable the sales staff to sell the houses off plan, Crest
Nicholson had built a physical model (i.e. a small-scale replica) of the development site (6
ft. x 4 ft.). Crest Nicholson wanted their sales staff to interact with this physical model
along with the software application to be developed.
Although Crest Nicholson had previously used physical models on other developments, the
interactivity between the physical models and any 3D rendering of the sites was very
feature-limited. Existing systems to interact with the model had focussed on building
simple functionality such as lighting up the entire model at the same time and did not offer
any additional functionality. Crest Nicholson wanted a more sophisticated solution that
integrated the 3D visualisation with the physical model further.

Vol. 14, 2/2014 The use of 3D visualisation for urban development
BDC, print ISSN 1121-2918, electronic ISSN 2284-4732 425
The Virtual Viewing approach
Virtual Viewing’s solution combined three separate components to deliver Crest
Nicholson’s requirements (Fig 1):
1. an iPad application providing 3D visualisation;
2. a hardware interface to control individual model lights from the iPad application for
improved demonstration capabilities;
3. a traditional physical model with embedded Light Emitting Diode (LED) lights.
Fig. 1 – VV approach for the Crest Nicholson Bath Riverside project
Virtual Viewing created an iPad application that provided site plans, including detailed
information on each of the apartments, and a 3D flythrough of the development. This
solution was created with Adobe Air and C#. C# was used to develop the web services for
the application.
The hardware interface was designed to connect the iPad application with the physical
model. The iPad application interacted with the hardware interface and could control parts
of the physical model without direct contact. The intention was to allow the sales staff to
use the iPad application during customer demonstrations to light up a specific part of the
physical model. By installing LED lights inside the physical model and facilitating the
hardware interface to manipulate the LED lights, the interactiveness of the demonstration
was further enhanced.
The third part, the most innovative in this context, was the increased interactivity as a result
of the hardware interface being linked to the iPad application. The LED lights in the

Vol. 14, 2/2014 The use of 3D visualisation for urban development
BDC, print ISSN 1121-2918, electronic ISSN 2284-4732 426
physical model could be switched on and off through the use of the iPad application and the
hardware interface. These LEDs were installed on the physical model to make it stand out
and add an extra layer of interactiveness as the sales staff walked the prospective customers
through the physical model. With the LEDs, the sales staff could showcase the houses
through 3D visualisation aided by the physical model.
Although the images from the actual project cannot be included here due to a
confidentiality agreement with the client, the flowchart of Figure 2 shows the manner in
which the interaction between the customers, the sales staff, and the solution developed by
Virtual Viewing worked.
Fig. 2 – Flowchart for the Crest Nicholson Bath Riverside project
The outcome
The end-result with the integration of the iPad application, the hardware interface, and the
LED lights in the physical model was a small scale control system. Not only did the
solution fulfil the client expectations in terms of innovativeness but it also proved to be an
invaluable tool for the sales staff for demonstration purposes. The fact that such an
integrated software and hardware experience could be up-scaled for a more complex
functionality suggests that this approach has further potential.

Vol. 14, 2/2014 The use of 3D visualisation for urban development
BDC, print ISSN 1121-2918, electronic ISSN 2284-4732 427
The strength of this approach lies in the way it combined the physical model with the 3D
visualisation in the iPad application. It enhanced the sensory experience and complemented
the computer-based 3D visualisation by adding a real-world 3D counterpart (real world
objects are seen in 3D by default after all).
3. Urban development and regeneration: The BTVLEP GIS project
This case study is about a project executed for two stakeholders - Buckinghamshire county
council and the Buckinghamshire Thames Valley Local Enterprise Partnership (BTVLEP).
The Buckinghamshire county council is the governing council for the Buckinghamshire
County in the Southeast of England. The county covers an estimated area of 1874 sq. km
and has a population of 756,000 according to the latest census (ONS, 2011). BTVLEP is a
partnership project between the local government (i.e. the Buckinghamshire county
council) and the private sector intended to attract businesses and investment to the
Buckinghamshire area (http://buckstvlep.co.uk/). In consequence, BTVLEP seeks out
opportunities to showcase the infrastructural, commercial, and economic advantages of the
Buckinghamshire area to businesses. The BTVLEP GIS project was aimed to be one such
showcase.
The problem statement
The main requirement was to create a platform for displaying existing 2D geospatial
information held by the council in 3D format. Through this project BTVLEP aimed to
demonstrate its intent about attracting investment. For the Buckinghamshire county council,
the aim was to communicate data about the county in a visual, easy-to-understand manner.
The data were intended to reveal various patterns and characteristics of the county such as
voting patterns, woodland areas, parts that would be affected by the High Speed 2 (HS2)
railway service, a planned high-speed railway between London Euston, the English
Midlands, North West England, Yorkshire, and potentially North East England, and the
Central Belt of Scotland, and areas of traffic congestion. The project was split into two
phases. The first phase was about rendering the existing data through 3D visualisation and
build a platform. The second phase was to build applications on top of the platform. This
case study discusses the outcome at the end of the first phase.
The Virtual Viewing approach
At the core of Virtual Viewing’s proposed solution was the position that the 2D geospatial
data held by the council was of strategic importance. Instead of relying on Google Maps /
Earth Application Programming Interfaces (APIs) to harness this data, the Virtual Viewing
approach relied on a custom solution delivered by combining C#-based software
development with Unity, developed by Unity Technologies, a cross-platform system for
rendering the data (Fig. 3). Other approaches including Web Graphics Library (i.e. WebGL,
a JavaScript API for rendering interactive 3D graphics and 2D graphics within any
compatible web browser without the use of plug-ins, Tavares, 2012) were considered but
not used after preliminary due diligence at the time of the project revealed them to be less
flexible to programme in and difficult to maintain afterwards at their current state of
maturity.
Vol. 14, 2/2014 The use of 3D visualisation for urban development
BDC, print ISSN 1121-2918, electronic ISSN 2284-4732 428
Fig. 3 – VV approach for the BTVLEP GIS project
The existing 2D geospatial data was held in a proprietary format for use in a desktop
system. In contrast the client requirement was to render it on the web in 3D. This meant
that in order to effectively harness this data, the Virtual Viewing solution needed to import,
combine, and recut the aerial image data. This repurposed data then needed to be presented
in a compressed form. This was done by combining the existing topographical data with
aerial photos in multiple layers. The challenge lay in importing and loading the existing
geospatial data into a web application. Further complexity was due to open-ended non-
functional requirements and limited visibility of the kind of devices end-users may rely on
to access the web-based interface.
The outcome
The solution developed by Virtual Viewing delivered 3D rendering of the data providing
various statistics for different areas of the county. To do so 160 GB of images and
topographical data was reprocessed, thinned out, and compressed to about 50 MB
download size. The existing data held in PostGIS and PostgreSQL was imported for
rendering it in a grid system across multiple layers.
The use of 3D provided an extra dimension to represent the existing 2D data and enabled
the various data sets (including aerial images and SketchUp models of key towns in the
county; SketchUp is a 3D modelling software known for its capability to work with Google
Maps and Earth file formats) to be displayed simultaneously rather than requiring offline
data analysis first. Given the BTVLEP’s intention of demonstrating openness for business
and its preparedness to embrace technology for economic revival and growth, the first
phase achieved the goals defined at the outset. The following images show the final results
and how the web interface conveyed the statistical data held by the council in a geospatial
context. These images indicate how applying different filters enabled the results to be
displayed according to the end-user’s interests. As a tool for attracting investment, these
images also showcase the capabilities it offered to BTVLEP when interacting with
investors and businesses.
Figure 4 shows an example of the overlays for the traffic routes and congestion as rendered
in the web interface.
Figure 5 provides a view of the Aylesbury area. The information specifically displayed in
this image is: urban area, woodlands area, infrastructure, and voting boundaries within
Aylesbury.

Vol. 14, 2/2014 The use of 3D visualisation for urban development
BDC, print ISSN 1121-2918, electronic ISSN 2284-4732 429
Fig. 4 – BTVLEP GIS, traffic routes and congestion patterns
Source: Virtual Viewing Ltd. (2014)
Fig. 5 – BTVLEP GIS – Aylesbury area
Source: Virtual Viewing Ltd. (2014)
Vol. 14, 2/2014 The use of 3D visualisation for urban development
BDC, print ISSN 1121-2918, electronic ISSN 2284-4732 430
4. Smart City demonstration: Milton Keynes
This project was intended to be a demonstration of the Smart City concept for Milton
Keynes, a large town in the Buckinghamshire County with 89 sq. km area and a population
of 229,411 according to the latest census (ONS, 2011).
The problem statement
The main aim of this project was to display the potential of the Smart City concept to
deliver intelligent, interconnected systems and associated functionality. The demonstration
was intended for a number of potential stakeholders including government institutions,
property owners, and marketing agencies (Table 1). For building the demonstration, the 3D
visualisation was expected to rely on an existing offline software-based model of Milton
Keynes. A key characteristic of the existing offline model was that it was not connected to
any geospatial data. Thus it was important to take into consideration the offline nature of
the landscape being used as a baseline for the 3D visualisation.
The Virtual Viewing approach
The main purpose of the project was to showcase the capabilities of Virtual Viewing vis-à-
vis a Smart City demonstration. For an efficient and expedient development process,
Virtual Viewing used C++, Open Graphics Library (i.e. OpenGL, a cross-language, multi-
platform API for rendering 2D and 3D vector graphics, The Khronos Group, 2014), and C#
web services as the development platform. The resulting Smart City demonstration was
intended to facilitate further development of data driven applications and 3D models. An
important consideration was for the OpenGL-based 3D visualisation to enable future
dashboard application concepts and cater to a wide range of prospective end-users such as
housing residents, county councils, and property developers. In doing so, the demonstration
was also intended to address three potentially different markets with varying business
requirements and priorities as Table 1 shows.
Table 1 – Target audience for a Smart City demonstration
Market Business requirements and priorities
City councils and
planners
Overlay general information and statistical data with cityscapes;
Provide visual tools for strategic planning and management of smart cities.
Property owners Smart managing the estate;
Real-time tracking of data feeds;
Identification and resolution of problems.
Marketing agencies Create interactive marketing campaigns for a range of industries including
restaurants, manufacturers, and construction companies
Figure 6 shows the building blocks of the bottom-up process used by Virtual Viewing.

Vol. 14, 2/2014 The use of 3D visualisation for urban development
BDC, print ISSN 1121-2918, electronic ISSN 2284-4732 431
Fig. 6 – VV approach for the Smart City demonstration
The time taken for development of the 3D visualisation in C++, OpenGL, and C# web
services along with further updates was 18 months. The result was a desktop system
capable of running on modern Windows-based platforms with support for OpenGL and
hardware acceleration.
The outcome
The main strength of this Smart City demonstration was the interactive features it offered in
relation to understanding, exploring, and analysing a Smart City landscape. The resulting
3D visualisation allowed multiple viewing angles combined with the ability to zoom into
specific locations and retrieval of site-specific data – an indispensable feature for a Smart
City demonstration. The capability to display site-specific data was made possible by
allowing another application to be embedded within the 3D visualisation. By showing the
capability to read data feeds available at sites equipped for transmitting them, the
demonstration provided a glimpse of how real-time monitoring of sensors would function
and aide decision-making, interventions for local councils and individual owners alike. For
example, based on its capability to read sensor data, the demonstration could be made
capable of identifying the floor(s) affected in the event of a fire. Following images show
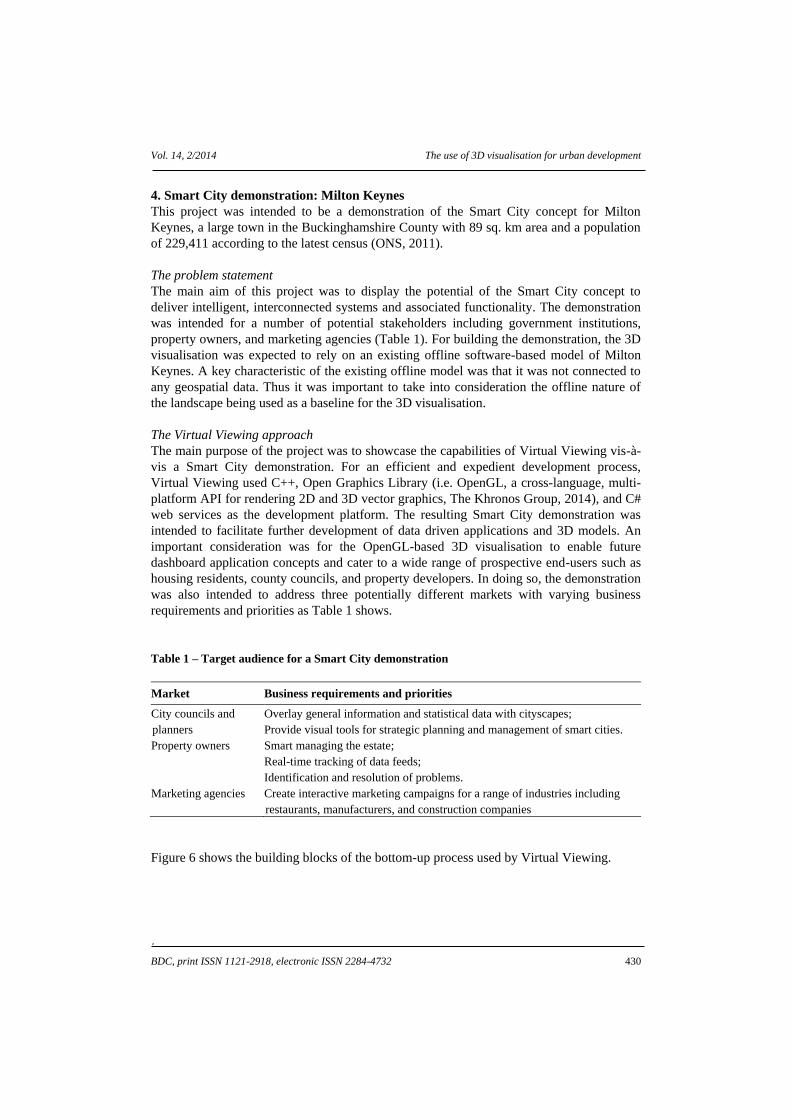
various aspects of the Smart City demonstration. Figure 7 displays energy data for the
Church of Christ the Cornerstone located in Central Milton Keynes. The demonstration also
showed the granularity of functionality the Smart City concept could achieve whether it
was in terms of providing a panoramic aerial perspective of the city locations or focussing
on a specific data set (such as power usage, fire and safety events, or live traffic data).
When combined with geospatial data, this kind of Smart City demonstration offered further
opportunity to understand, evaluate, and conceptualise the way planning and
implementation for a Smart City could take place. More crucially however, this
Vol. 14, 2/2014 The use of 3D visualisation for urban development
BDC, print ISSN 1121-2918, electronic ISSN 2284-4732 432
demonstration also provided key inputs and techniques for the next-generation Smart City
demonstration currently being developed at Virtual Viewing.
Fig. 7 – Energy data from the Church of Christ the Cornerstone
Source: Virtual Viewing Ltd. (2014)
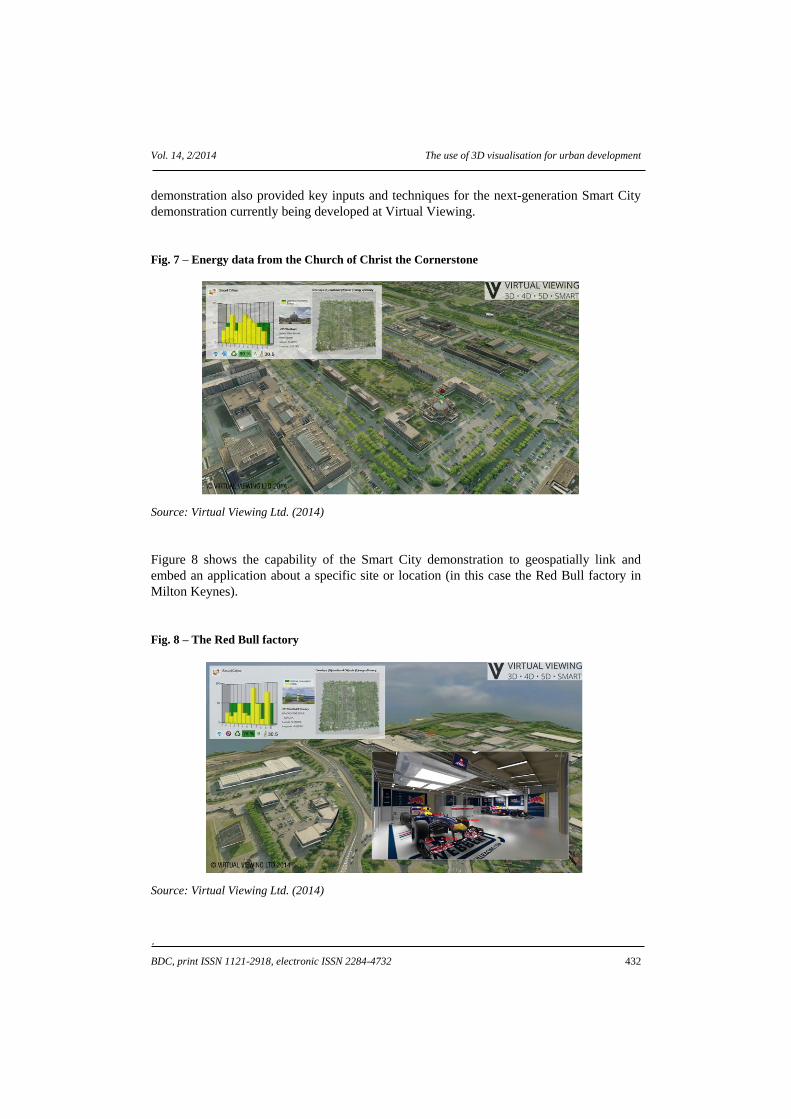
Figure 8 shows the capability of the Smart City demonstration to geospatially link and
embed an application about a specific site or location (in this case the Red Bull factory in
Milton Keynes).
Fig. 8 – The Red Bull factory
Source: Virtual Viewing Ltd. (2014)

Vol. 14, 2/2014 The use of 3D visualisation for urban development
BDC, print ISSN 1121-2918, electronic ISSN 2284-4732 433
5. Discussion and conclusions
This paper has covered three different case studies related to the use of 3D visualisation for
urban development, regeneration, and Smart City demonstration projects. In each case
study, the approach adopted by Virtual Viewing has been discussed along with the output
produced. In this section, each of these case studies, the variations in the approach taken,
and the extent to which 3D visualisation was crucial to the project execution are analysed.
Different purposes converging with 3D visualisation
With each of the case studies, 3D visualisation served a different purpose:
for the Crest Nicholson Bath Riverside project, 3D visualisation needed to be coupled
with a hardware interface and a physical model to significantly augment the existing
visualisation aides available to the sales staff;
for the BTVLEP GIS project, the 3D visualisation acted as a visual filter for large
amount of geospatial and statistical data. 3D visualisation was crucial to allow the data
to be presented and understood quickly by third party users. With the main aim of
attracting investment, the 3D visualisation also enabled BTVLEP to demonstrate its
intent about emerging and advanced technologies;
with the Smart City demonstration for Milton Keynes, 3D visualisation provided the
flexibility to experiment with various ideas about how a Smart City could and should
function. This is important given that the concept of a Smart City is still evolving
(Zygiaris, 2013). The nature of interconnected, intelligent systems that could exist in a
Smart City and the functionality that could be implemented is also part of an ongoing
discussion between the industry and academia.
Despite the different purposes, 3D visualisation was a core part of the execution strategy
adopted by Virtual Viewing. As the next section discusses, despite some of the
technological constraints and partly due to the nature of the problem statement, Virtual
Viewing employed different approaches while using 3D visualisation.
Adapting 3D visualisation to the problem statement
With the Crest Nicholson Bath Riverside project, due to the problem statement requiring an
innovative solution, only presenting 3D visualisation would not have been sufficient. The
existing physical models contained very rudimentary LED functionality. It was only by
building a small control system with a fit-for-purpose hardware interface that the criterion
for an innovative solution was fulfilled. To do so, Virtual Viewing adopted a more iterative
process than most 3D visualisation projects in order to ensure seamless integration with the
hardware interface and the LEDs installed in the physical model. As part of Virtual
Viewing's approach, the interaction between the 3D visualisation, the hardware interface,
and the physical model was central to the outcome.
With the BTVLEP GIS project, the most important requirement was to deal with a large
existing data set held in a proprietary format. Given the strategic importance of the data to
BTVLEP and its focus on urban development and regeneration, an additional important
requirement was to do so as a web application. This required a more structured, linear
approach given the complexity of the existing data set and that dictated the solution
provided by Virtual Viewing. Such an approach was also important in view of the longer-
term requirement to build scalable applications on top of the platform for the proposed
second phase of the project. Since the end-user would only interact with the 3D

Vol. 14, 2/2014 The use of 3D visualisation for urban development
BDC, print ISSN 1121-2918, electronic ISSN 2284-4732 434
visualisation presented in web application, Virtual Viewing's approach was driven by
ensuring an effective representation of the large quantity of data through 3D visualisation.
The Milton Keynes Smart City demonstration dealt with an evolving concept that could
have yielded multiple implementations. To highlight the 'Smart' aspects of the
demonstration, Virtual Viewing used multiple building blocks to create the 3D
visualisation. The existing offline model of Milton Keynes, although it did not provide
geospatial data, formed an important part of the final deliverable. The most important
aspect of the 3D visualisation however was the ability to use data feeds from sensors.
Coupled with the capability to zoom into any location and granularity of control vis-à-vis
the sensor data, the data feeds were the most important building blocks of the final
deliverable. This is reflected in Virtual Viewing’s approach and also in the ongoing work
about the next-generation Smart City demonstration.
Table 2 summarises the problem statement for each project and the way 3D visualisation
was adapted for each project.
Table 2 – Adapting 3D visualisation according to the project requirements
Project Problem statement The VV approach
Crest Nicholson
Bath Riverside
Create an interactive and innovative
solution;
Combine animation with real time data;
Provide interaction with the physical
model.
Iterative process;
iPad application for 3D visualisation;
Hardware interface between the iPad
application and the physical model;
Physical model configured with LEDs.
BTVLEP GIS Use the existing 2D geospatial data;
Deliver 3D visualisation for presenting
statistical data and attracting investment;
Create a scalable platform for further
customisation.
Linear, structured process;
Import, combine, and recut aerial
image data;
Render data in 3D in a grid system
across multiple layers;
Use C# and Unity for a customisable
web interface.
Milton Keynes
Smart City
Demonstrate the Smart City concept;
Use an existing offline model of Milton
Keynes as a baseline;
No geospatial data.
Bottom-up process with multiple
building blocks;
C++, OpenGL, and C# web services;
Granular functionality and capability to
read data feeds from sensors;
Foundation for the next-generation
Smart City demonstration being built
by Virtual Viewing.
3D visualisation – the extra dimension
In each of the case studies presented in this paper, 3D visualisation was required not only to
provide visuals but also functioned as an important tool for marketing (Crest Nicholson),
implementing a strategically important platform (BTVLEP), and conceptualisation and

Vol. 14, 2/2014 The use of 3D visualisation for urban development
BDC, print ISSN 1121-2918, electronic ISSN 2284-4732 435
analysis of an emerging, evolving concept (Milton Keynes Smart City). Although the
implemented solutions differed significantly in terms of execution and technologies used,
without 3D visualisation none of the projects could have achieved their stated goals. 3D
visualisation not only made the projects possible, it also added an extra dimension without
which their outcome would not have met the requirements set in the problem statement.
References
BTVLEP, www.buckstvlep.co.uk (accessed 27 October 2014).
Caragliu A., Del Bo C., Nijkamp P. (2009), “Smart cities in Europe”. Journal of urban
technology, vol. 18, n. 2, pp. 65-82.
London Stock Exchange (2014), FTSE 250, www.londonstockexchange.com.
ONS-The Office for National Statistics (2011), 2011 Census data for England and Wales,
www.ons.gov.uk.
SketchUp, www.sketchup.com (accessed 30 October 2014).
Tavares G. (2012), WebGL Fundamentals, www.html5rocks.com.
The Khronos Group (2014), OpenGL 4.5 specification, www.opengl.org.
Unity Technologies, www.unity3d.com/unity (accessed 27 October 2014).
Virtual Viewing Ltd. (2014), Virtual Viewing. 3D-4D-5D-Smart,
www.virtualviewing.co.uk.
Zygiaris S. (2013), “Smart City Reference Model: Assisting Planners to Conceptualize the
Building of Smart City Innovation Ecosystems”. Journal of the Knowledge Economy,
vol. 4, n. 2, pp. 217-231.
Stewart Bailey
Virtual Viewing Ltd.
Gloucester House, 399 Silbury Boulevard, Central Milton Keynes, Buckinghamshire, MK9
2AH (United Kingdom)
Tel: +44-0190-893-0300; email: [email protected]
Advait Deshpande
Department of Computing and Communications, The Open University
Walton Hall, Milton Keynes MK7 6AA (United Kingdom)
Email: [email protected]
Alby Miller
Virtual Viewing Ltd.
Gloucester House, 399 Silbury Boulevard, Central Milton Keynes, Buckinghamshire, MK9
2AH (United Kingdom)
Email: [email protected]

