open innovation and firm's survival: an empirical
TRANSCRIPT

DPRIETI Discussion Paper Series 12-E-036
Open Innovation and Firm's Survival:An empirical investigation by using a linked
dataset of patent and enterprise census
MOTOHASHI KazuyukiRIETI
The Research Institute of Economy, Trade and Industryhttp://www.rieti.go.jp/en/

1
RIETI Discussion Paper Series 12-E-036
May 2012
Open Innovation and Firm's Survival: An empirical investigation by using a linked dataset of patent and enterprise census1
MOTOHASHI Kazuyuki2
The University of Tokyo and
Research Institute of Economy, Trade and Industry
Abstract
This paper uses patent filings as an indicator of innovation and investigates the
relationship between innovation and firms’ survival, based on the linked dataset of the
Census of Establishment and Enterprise and the Institute of Intellectual Property (IIP)
Patent Database for Japanese firms. We have constructed the indicators on the
organization of innovative activities, such as external collaboration in inventions and the
type of collaborative partners, and disentangle two competing factors, i.e., technological
capability (positive influence on firms’ survival) and commercial risk (negative
influence on firms’ survival). We found that the risk factor surpasses the capability
factor, thus the impact of patenting on survival has a negative correlation with firms’
survival at the end.
JEL Classification: L25, O13
Keywords: Enterprise census, Patent database, Entry and exit of firms
RIETI Discussion Papers Series aims at widely disseminating research results in the form of professional
papers, thereby stimulating lively discussion. The views expressed in the papers are solely those of the
author(s), and do not represent those of the Research Institute of Economy, Trade and Industry.
1 This paper is based on the results of RIETI’s research project on “open innovation”. Author
would like to thank for helpful comments from the participants at the Conference on Innovation and Entrepreneurship at Stanford, particularly prof. Charles Eeseley as well as the participants at RIETI’s DP seminar. Author thanks also for as well as for prof. Masayo Kani for her efforts on linking enterprise census and patent database.
2 Professor, Department of Technology Management for Innovation, The University of Tokyo and the Research Institute of Economy, Trade and Industry e-mail: [email protected]
2
1. Introduction
Productivity increase is an important factor for economic growth in developed nations,
and it is found that 20%-40% of productivity in the OECD countries is attributable to
high-growth-rate new startups (OECD, 2003). The importance of entrepreneurship for
economic growth is stressed by Schumpeter, who defines “innovation” as a new
combination, with five types of activities such as new product development and
adaption of new process (Schumpeter, 1934). Schumpeter also argues that “creative
destruction” is an essential fact about capitalism (Schumpeter, 1942). Creative
destruction, i.e., firms that succeed in innovation increase their market share, firms with
low productivity withdraw from the market, has been making a significant contribution
to the economic expansion for long time (Baumol, 2010).
Along this line, the view that small and medium-sized enterprises (SMEs) are a source
of innovation is shared in every country of the world. However, empirical research on
firm dynamics and its contribution to economic development shows mixed results. First,
it is found that survival rate of new firms is low. According to Bartelsman et. al. (2005),
in 10 OECD countries 20%-40% of new companies disappear within two years of
establishment. Furthermore, it is also understood that there is a positive correlation
between entry and exit of firms that occurs together with macroeconomic fluctuations
(Bartelsman et. al., 2005). As a result of the churning effect resulting from market
fluctuations, generation and dissolution of small inefficient firms that have not reached
a sufficient scale occurs simultaneously. This phenomenon can be viewed as firms
simply moving through a revolving door (Santarelli and Vivarelli, 2010).
A theoretical model of firm’s exit or survival is based on new and existing players at
market, taking into account heterogeneous capabilities at firm. A passive learning model
explains industrial dynamics in firm’s learning process of its own initial capability
endowment which as not know at the time of entry (Jovanovic, 1982). In contrast, there
is also an active learning model which takes into account the fact that firm’s capability
is not only determined by its initial endowment, but subsequent investments (Ericson
and Pakes, 1995). A pattern of industrial dynamics, such as firm’s entry, growth and exit,
is quite different between two models, but the importance of firm’s capability as a
predictor of firm’s survival and growth is confirmed in both models.
In this paper, we focus on firm’s technological capability and investigate its impact on
firm’s growth by using the linked dataset of the enterprise census and a patent database

3
in Japan. Empirically, there are only mixed results about the impact of innovative
activity, such as R&D and patent, on firm’s survival. Positive relationship is found in
Esterve-Perez and Manez-Castillejo (2008) and Orgega-Argiles and Moreno (2007) and
Cockburn and Wager (2007), while negative one is found in Buddlemeyer et. al (2010),
Motohashi (2011) and Pederzoli et. al (2011). A negative factor may come from
substantial risk associated with innovative activities, particularly for small and young
firms. Therefore, we look into the organization of innovative activities, such as external
R&D collaboration, in order to make a proper understanding of the balance between the
risk factor (negative impact on firm’s survival) and the technological capability factor
(positive impact on firm’s survival).
This paper is structured as follows. First, we introduce theoretical aspects of industrial
dynamics and empirical literature to explain firm level entry, growth and exit in a real
world. Then, hypotheses of the relationship between patenting and firm’s survival by
type of the organization of inventive activities are provided. Then, a description on the
dataset in this study, i.e., the Enterprise and Establishment Census data and the JPO
patent database are provided. Next, we show the results of a quantitative analysis to test
the hypotheses developed in the section 2. Finally, we summarize our findings and
provide discussions and policy implications.
2. Theory and Hypotheses
A theoretical model of firm’s exit or survival is based on competition process of new
and existing players at market, taking into account heterogeneous capabilities at firm. A
passive learning model explains industrial dynamics in firm’s learning process of its
own initial capability endowment which as not know at the time of entry (Jovanovic,
1982). In every period a firm has to make decision on continue or exit with the belief on
its capability, based on Bayesian inference of part experience at market. When a firm
overestimates its capability, it may overinvest to grow faster, but the probability of
failure and exit from market increases. Therefore, the rate of exit decreases by firm’s
age, as it learns own capability level by market experience over time.
The active learning model, instead, takes into account the fact that firm’s capability is
not only determined by its initial endowment, but subsequent investments (Ericson and
Pakes, 1995). Here in every period, a firm has to make a decision on continue or exit
again, but it also decides the level of investment in case of continuation. In this model,
there are two state variables, the level of competency (positively correlated with firm’s

4
outcome) and the number of firms with in the same level of competency (negative
correlated with firm’ outcome). A Markov process is assumed in dynamics, in a sense
that a firm’s perception of own and its competitors’ states is based on only those in the
previous period. The level of investment for next period is determined by dynamic
optimization problem to maximize the value of firm with exit option. An exit option is
executed when the value of firm becomes less than an opportunity cost of staying in the
market (an outside value of the firm). There are also entrants in this market, when the
expected value of entry choice exceeds sunk cost of entry investment.
A pattern of industry dynamics, i.e., entry, continue and exit, looks quite different
between passive learning and active learning model. In a former model, a firm growth
pattern is described as a path of approaching to certain level of firm size, depending on
capacity endowment (larger endowment leads to larger size), with continuous flux entry
and exit, particularly for young firms, which do not know its capability, precisely.. In
contrast, active leaning model draws more dynamic picture with continuous changes of
relative position of firms and firm’s exit can happen regardless of its age. A reality is off
course in-between, although empirically, relatively persistent ranking order of
productivity over time is found (Baily et. al, 1992; Bartelsman and Doms, 2000), and
exit is likely to occur more in younger firms (Bartelsman et. al, 2005). A growth pattern
of firm cannot be determined solely by its initial endowment, but capability upgrading
efforts are serially correlated over a long time. The assumption of Markov process in
Ericson and Pakes (2005) is too strong, and to what extent the impact of investment
stays over time determines the degree of persistency of industrial dynamics.
In both model, the level of firm’s capability and market competition are important
predictors for firm’s survival. Empirically, the level of firm’s capability is measured by
firm size, such as the number of employees, or more specific type of capability such as
skill level of employees (Gimeno, et. al, 1997), financial resources (Carpenter and
Peterson, 2002) and trademarks (Buddelmeyer et. al, 2010) to see how it does matter
with firm’s survival. The results find these capability measures have positive impacts on
firm’s survival in general.
However, it is interesting to see that the impact of technological capability is not always
positive to firm’s survival. Esteve-Perez and Manez-Castillejo (2008) and
Orgega-Argiles and Moreno (2007), which use R&D as an index for technological
capability showed that the positive relationship between R&D and company survival is
particularly seen in the hi-tech industry. Moreover, Cockburn and Wagner (2007) and

5
Buddelmeyer et. al (2009) using patent as an indicator. The former literature deals with
internet service providers, again high-tech, and finds positive relationship. However,
Buddelmeyer et. al (2010), analyses the impact of patent application and patent stock
separately, and find negative impact of recent patent application on firm’s survival, after
controlling for the impact of patent stock (with positive relationship with firm’s
survival). They argue that uncertainly embodies in radical innovation activity surpasses
the capability effect, implied by patenting. A negative relationship between patent and
firm’s survival is also found in Motohashi (2011) and Pederzoli et. al (2011). Patent
filing implies that technology new to the world is developed so that the firm is
conducting substantial “exploration” over “exploitation” activities (March, 1991). It is
required more organizational learning in exploring process which is riskier to be
successful at the end (March, 1991).
In this paper, we investigate the balance between uncertainty in innovative activities and
technological capabilities in relationship with firm’s survival. Broadly speaking there
are two types of uncertainty associated with innovation activities, i.e., technological risk
and commercial risk. Technological risk is found in research and development activities,
which is not always leading to successful completion. When a firm comes to the point
of patent filing, it overcomes such technological risk, but there is still commercial risk
where not all patent leads to commercial success. Therefore, the findings in
Buddelmeyer et. al (2010), Motohashi (2011) and Pedezoli et. al (2011) are supposed to
be explained mainly by substantial commercial risk still remaining in patenting
technologies. However, a firm filing more patent is likely to be superior in its
technological capability as well. This is particularly the case when a firm’s patent is
important and high in its commercial value. It is found that a patenting entrepreneur is
more likely to receive venture capital financing so that signaling effect of patenting to
potential investors may improve its survival rate as well (Haeussler et. al, 2009). .
H1: The impact of patenting on the firm’s survival is determined by the balance of the
levels between the uncertainty in innovation activities (negative) and technological
capability.
H1a: When a filing patent is less at its commercial risk, technology capability effect
surpasses uncertainty one, so that the impact patent filing on firm’s survival is positive.
H1b: When a great commercial risk is associated with filing patent, uncertainty effect
surpasses technological capability one, so that the impact patent filing on firm’s survival
6
is negative.
In addition, it is important to distinguish exit of firm by its dissolution or acquisition. A
start-up firm with higher technological capability can be an attractive target for M&A
market. Therefore, a negative association between patenting and firm’s survival may be
attributed to the firms exited due to acquisition by other firms. The differences in
antecedents of firm’s exit between dissolution and acquisition have been investigated in
the past (Mitchell, 1994: Grilli et. al, 2010). Srinivasan et. al (2008) extends these
studies by taking into account firm’s technology management strategy, and finds the
positive relationship between the firm’s technology capability and firm exit by
acquisition, while such relationship turns into negative for firm exit by its dissolution.
Therefore, another annex to hypothesis 1 can be constructed as follows,
H1c: When a firm’s exit is driven by acquisition, instead of dissolution, the impact of
patent filing is negative.
Moreover, open innovation, i.e., external collaboration on R&D, mitigate the
uncertainly associated with innovation activities, may mitigate this commercial risk.
Zheng et. al (2010) explains two types of benefits from inter-firm network’ benefits for
entrepreneurs ’s (1) transferred benefit and (2) perceived benefit. A higher failure rate
for young firms can be explained by the fact that the routine and the policy to manage
the business uncertainty is not well developed yet. Transferred benefit refers to the
“pipe” through which information and knowledge supplement to overcome such
uncertainty from the partners may be transferred. In addition, there is a perceived
benefit from inter-firm network which works as the “prism” signaling the firm’s quality
of managing its relationship with partners (Zheng et. al, 2010).
However, R&D collaboration may also infer a firm’s limited technological capability, as
compared to panting technology developed solely by itself. Bederbos et. al (2010)
shows the negative relationship between the degree of co-patenting and the value of
firms. They argued that potential disadvantages of R&D collaboration, such as
coordination costs and reduction of potential future revenue by co-ownership of
technology, may surpass its potential benefits such as access to new technology and
lower risk in technology commercialization. This is particularly the case when a firm
collaborates with a large and established firm which has more R&D resources than
smaller firms. A coordination cost for R&D collaboration is relatively large for a firm
with smaller managerial resources, and its potential benefits from shared technology

7
with large firms are relatively small with smaller compelemtary assets. In addition, if a
firms co-patents with some particular firm, its bargaining position in post invention rent
sharing negotiation is supposed to be small. Therefore, the hypotheses related to open
innovation and firm’s survival is as follows;
H2: The impact of open innovation on the firm’s survival is determined by the balance
of factors between positive ones such as transferred and perceived benefit and negative
ones such as less technological competency signal and benefit sharing effect.
H2a: Positive factors surpass negative ones when a firm is enough capable
technologically.
H2b: Negative factors surpass positive ones when a firm collaborates with large firms.
H2c: Negative factors surpass positive ones when a firm collaborates with smaller
number of the same partners.
3. Dataset and descriptive statistics
In order to conduct an empirical analysis of patenting and firm’s survival, we have
constructed the dataset linking the Enterprise and Establishment Census by the Japanese
Government and IIP Patent Database, complied by using JPO patent information.
The Enterprise and Establishment Census encompasses all business establishments in
Japan. Along with providing base statistical data such as the number of establishments
and employees, it is also used as the survey body information set for governmental
statistical surveys. This survey has been conducted twice every five years, and was
named the Establishment Census until July 1991. From the October 1996 survey
onward, the name was changed to the Enterprise and Established Census. From the
October 1996 survey, due to the addition of “address of head office” as a survey item, it
became possible to group business establishments by company name. We used the
dataset until the survey conducted in October 2006, which is the last Enterprise and
Establishment Census. In 2009, a similar survey was conducted under the name of
“Economic Census Preparatory Survey,” and preparations are underway for a statistical
survey based on a new survey framework to commence from 2012, called “The
Economic Census.”
The IIP Database is compiled based on the Consolidated Standardized Data, which is
made public twice a month by the Japan Patent Office. The Consolidated Standardized
8
Data includes patent information recorded as a text file with SGML and XML tags. In
this study, these text files are converted to an SQL database to allow easier statistical
processing of the data. Furthermore, information that is believed to be needed most by
researchers is released as a CSV-format text file. At present, this includes information
made public from January 1964 until March 2011. The data released publicly in
CSV-format as the IIP Patent File includes patent application data (application number,
application date, examination request date, technological field, number of claims, etc.);
patent registration data (registration number, rights expiration date, etc.); applicant data
(applicant name, applicant type, country/prefecture code, etc.); rights holder data (rights
holder name, etc.); citation information (citation/cited patent number, etc.); and inventor
data (inventor name, address) (Goto and Motohashi, 2007).
Linkage between Enterprise and Establishment Census and the IIP Patent Database was
conducted by using identical company name (standardized one) and location
(municipality level). It is possible to obtain head office name and address from the
Enterprise and Establishment Census on only three occasions: 2001, 2004, and 2006
surveys. In the other years, linking by using company name is impossible so that we
decided to link panel data and the patent database for two surveys: 2001 and 2006 (2004
was a simplified survey year). In the Enterprise and Establishment Census, each
establishment are categorized as one of 1. a single unit establishment firm, 2. the head
office of multiple establishments firm, 3. a branch of multiple establishments firm.
Because patent applications are usually managed by a whole company, instead of an
individual establishment, so that applicant information from patent data should be
linked with a headquarter of multiple establishment firm or a single establishment firm.
A detail description of data linkage works can be found in Motohashi (2011). The
numbers of all firms in this dataset are 5,082,267 and 4,627,530 in 2001 and 2006,
respectively, and the numbers of the firms with patent application are 66,582 (1.32%)
and 64,640 (1.40%) in 2001 and 2006, respectively.
In this paper, we use only the samples with patent application in order to look at the
relationship between open innovation and firm’s survival in detail. In terms of the state
of open innovation at firms, we use the indicator by looking at whether a patent are
applied jointly with other firms other firms (inter-firm linkages) and/or with university
(industry-academia linkages). It should be noted that national university could not claim
its patent right before it was incorporated in 2004, so that we complement joint
invention (with industry and academic researcher) information with joint application
database. The detail description of identifying joint invention patents van be found in

9
Motohashi and Muramatsu (2012).
Table 1 is a look at the ratio of open innovation firms with respect to company patent
applications between 2001 and 2006 organized into new entrant, continuing, and exit
firms. First, eixt firms, when compared to continuing firms, had a lower ratio of open
innovation. On the other hand, new entrants also had a relatively lower index than
continuing firms, but differences as large as that with exit firms were not seen.
Empirically, it is found that low productivity firms, low in its competitive position at
market are more likely to exit (Griliches and Regev, 1995; Matsuura and Motohashi,
2005). Its open innovation activity may be less active as compared to a continuing firm.
In contrast, it is found that Schumpeterian dynamics, i.e., entry of high productivity firm
and exit of low productivity one, contributes to aggregated productivity growth (Baily et.
Al, 1992), so that open innovation at entry firms is supposed to be more active.
(Table 1)
Table 2 is a look at the open innovation index by company size. The ratio of
inter-company linkages increases along with size of the firm, and the ratio of
industry-academia linkages shows a U-shaped distribution with higher value for
large-scale and small-scale firms. This result for industry-academia linkages with
respect to company size is consistent with the results based on the survey questionnaire
on external R&D collaborations (Motohashi, 2008).
(Table 2)
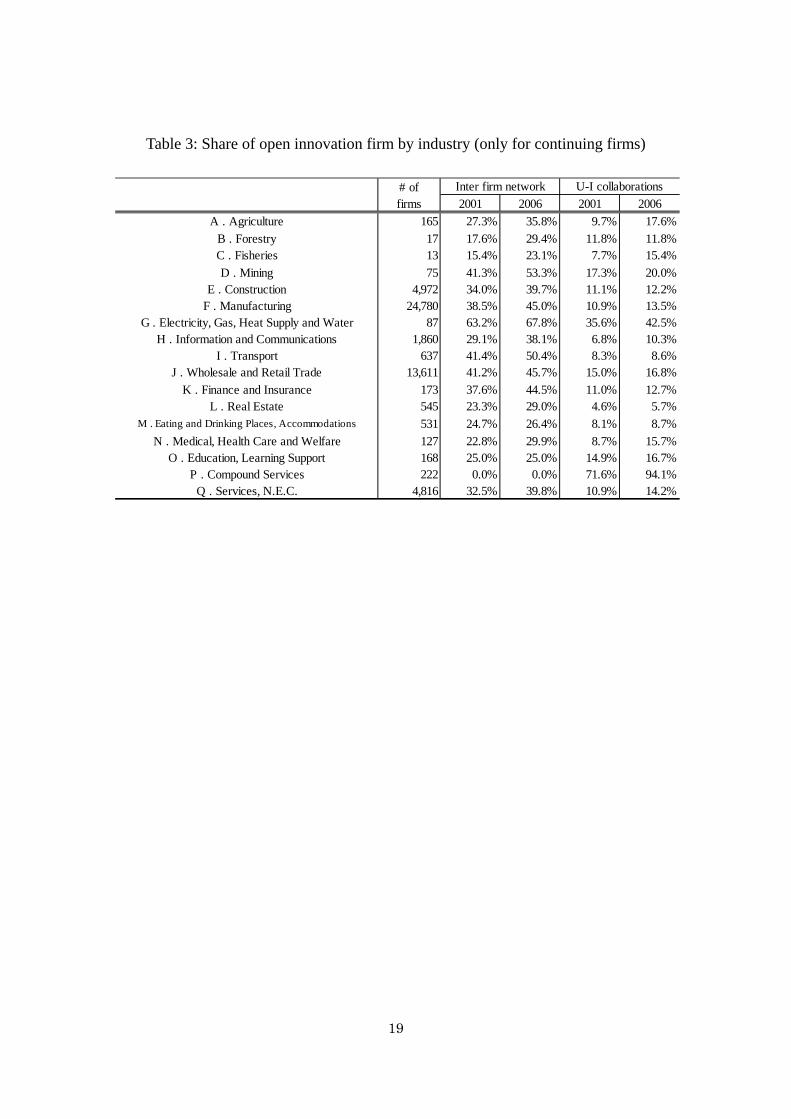
Tables 3 and 4 take a look at the distribution by industry. Furthermore, to make a time
series comparison possible, we will look at continuing firms only. Industries with a high
number of patent applications are manufacturing and wholesale/retail, but the open
innovation ratio is increasing in all industries. When we look at differences by business
category, we see that the ratio of open innovation is increasing for service industries,
such as IT as well as electricity/gas and other public utilities, and finance and insurance
industry, although the number of firms is small for these sectors. Taking a granular look
at the manufacturing industry, inter-company linkages are mostly increasing in the
machine industry, while industry-academia linkages are increasing in the chemical
industry and petro-chemistry.
(Table 3) (Table 4)

10
4. Econometric Analysis
In this chapter, an econometric analysis is conducted to test the hypotheses in the
section 2. We use the information whether the firms existed in 2001 survived until 2006
(survival) or not (exit). Therefore, the dependent variable for our econometric models is
binary variable of 1 (for survive) or 0 (for exit). In addition, we made a distinction
between acquisition and dissolution in case of exit. Since the Establishment and
Enterprise Census provides the information both for establishments and firms, so that
the identification for acquisition is made for exited firms during the period between
2001 and 2006, some of whose establishments can be found in 2006 as well. We ran
Probit estimation model with independent variable as follows.
First, log of the number of patent filings (Lpatent) is used as an independent variable. In
addition, we need to control for the size and the age of firm, by including Lemp (log of
the number of employees in 2001) and Lage (log of age in 2001), since these two
factors are found to be important predictor for firm’s survival.
In terms of open innovation activity at firm, we have constructed two types of variable
from patent database, i.e., a dummy variable for joint application with other firms
(d_firm) and a dummy variable for joint application or joint invention with universities
(d_univ). As for the degree of commercial risk associated with patent, we use the
number of forward citations and generality index of patent. The number of forward
citations is the most frequently used patent quality indicator (Nagaoka, et. al, 2010),
which reflects the size of subsequent inventions based on the original patent. In order to
control for different propensity to be cited by technology and time, we take the ratio of
the number of forward citations to its average by technology classification and
application year. Presumably, a patent with large number of subsequent patents is more
commercially viable. The generality reflects versatility of patents, which can be
calculated as follows (Hall et. al, 2001),
generality
1 ∑ # " "#
The greater the generality is, the patent is cited in broad range of technology field, and
such wider applicability is supposed to reduce the degree of commercial risk associated
with the patent.

11
In terms of the variables for the organization of R&D coloration, we use the information
whether the patent co-applied with a firm with more patent applications than itself
(Larger firms), and the Herfindahl-Hirschman Index by the number of counterparts
(HHI) to reflect the degree of concentration to some particular firms for co-application
partners. Since these indicators are created at patent level, we take averages of those for
each firm.
The results by using all firms with patent application in 2001 (57, 268 out of 5,082,267
firms) are provided in Table 5. A negative and statistically significant coefficient is
found to Lpatent, when we control for the size and the age of firms. Therefore, the risk
factor associated with innovative activities is larger than the technological capability
factor. Since we have controlled for the size (including R&D resources) and the age
(including technological accumulation by learning), the number of patent applications
tends to capture more risk factor which are left out.
(Table 5)
In Model 2, we include open innovation and patent quality indicator as an independent
variable as well, and have found that collaborating with firm decreases survival
probability of firms. As regards to hypothesis 2, it is presumed that the impact of
negative factors is greater than that of positive ones. In order to check this presumption,
we include the cross terms of collaboration variables and Lpatent in Model (3). Here,
we see positive and statistically significant coefficient to the cross term, which can be
interpreted that the impact of collaborating with firm becomes positive when the
number of patent is large. Therefore, the hypothesis 2a is supported.
In model (4), we further include cross terms of patent quality indicators and Lpatent.
While we cannot get a statistically significant coefficient to the number of forward
citations, but we find a negative and statistically significant coefficient to generality
index and positive ad statistically significant one to the cross term of generality and
Lpatent. That is, the versatility of filing patent is negatively related to firm’s survival,
but it becomes positive impact when the firm’s technological capability is large enough.
We further include cross terms of patent quality indicators and open innovation
variables, and have found that the versatility of technology is positively related to firm’s
survival when a firm collaborates with firms. Therefore, the hypotheses 1a and 1b are
partially supported. In addition, it is found that there may be some complementary
relationship between open innovation and technology versatility.

12
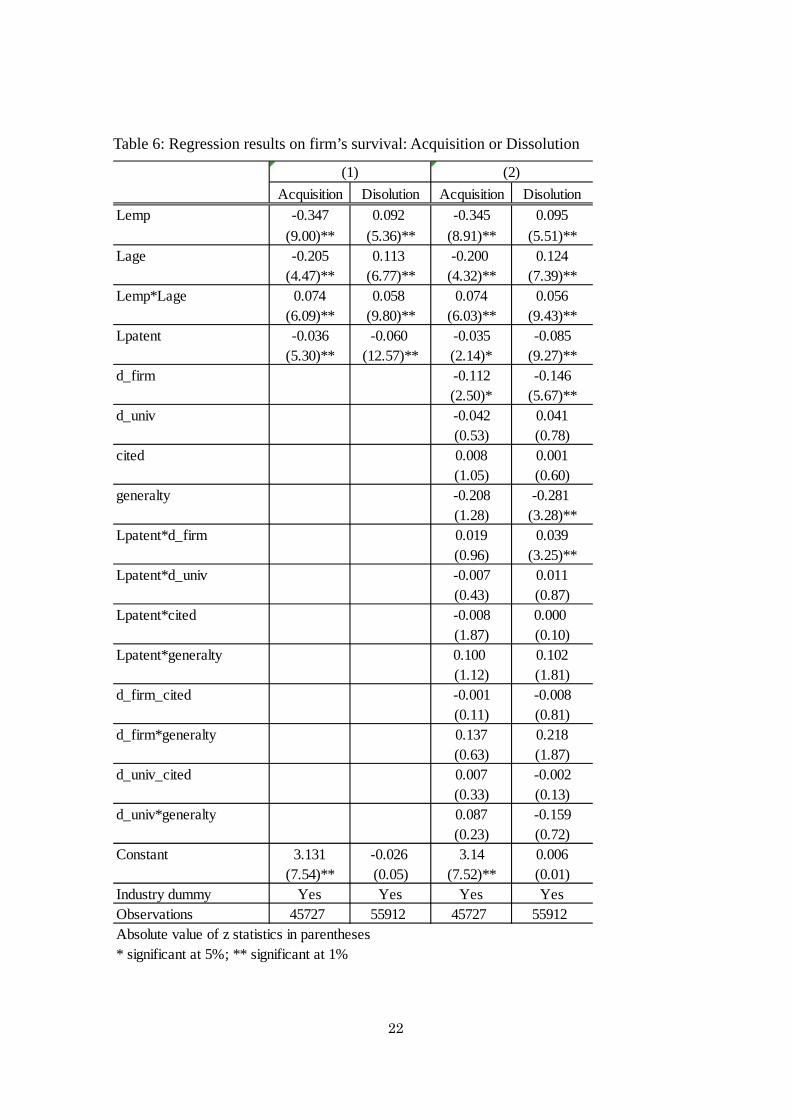
Table 6 shows the results comparing the model in Table 5 between acquisition and
dissolution samples. The model (1) in Table 6 is the same specification as the model (1)
of Table 5, and the model (2) in Table 6 corresponds to the model (5) in Table 5. We
have found that the negative and statistically significant coefficient to Lpatent in
acquisition samples, so that the hypothesis 1c is supported. However, the same pattern is
found also for dissolution samples. Therefore, it is confirmed that a risk factor surpasses
potential benefit by patent filing. In addition, we can also find the evidence to support
hypothesis 1a in positive and statistically significant coefficient to Lpatent*d_firm in
dissolution samples. A major difference in the results between acquisition and
dissolution samples is found in the opposite sign of coefficients to age and employment
size. It is found that older and larger firms are more likely acquired by other firms. This
finding is consistent to Mitchell (1994), due to increasing mismatch between owner’s
expectation and management organizational capabilities for growth over time. In
addition, a potential buyer may hesitate to acquirer new and small firms which do not
show their market competency yet (Grilli et. al, 2010).
(Table 6)
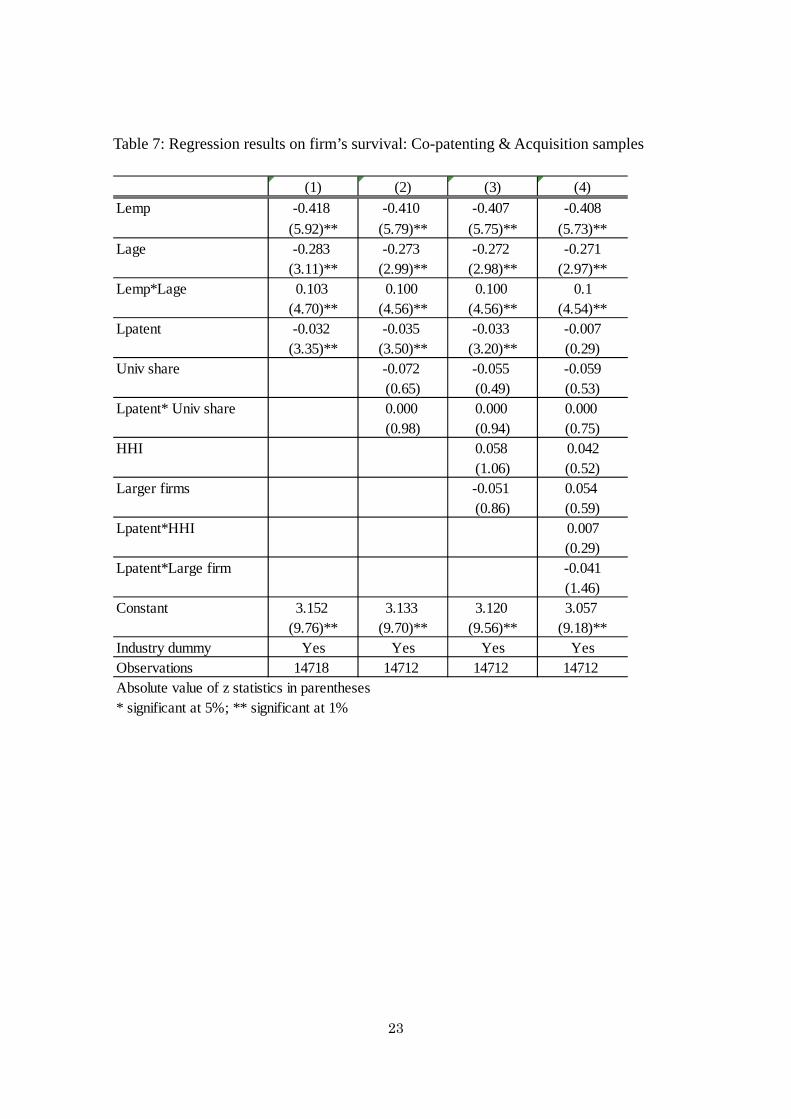
Table 7 and 8 shows the results by using the sample of firms collaborating with other
firms, since the variable of “large firm” and “hhi” can be constructed only for those
samples. In addition, the samples are further broken down into those with exit by
acquisition (Table 7) and dissolution (Table 8). We have new independent variable,
Univ_share, the share of patents jointly invented with university, here. In Model (1), we
have found the same results as are shown in Table 6. The hypothesis 2 is developed,
mainly for firms exited by dissolution so that the results in Table 8 are used here. In
model (2), a positive and statistically significant coefficient to collaborating with
university is found. A firm with collaborating with university may be superior in its
technological capability, and there may be less concern about rent dissipation by
bargaining with its co-applicant for economic valuation of patent.
(Table 7) and (Table 8)
In Model (3), we have found that “Larger firm” has negative and statistically significant
coefficients, which directly supports hypothesis 2b. In addition, “HHI”, the
concentration ratio of co-application partners, is negative correlated with firm’s survival,
since being dependent on smaller number of particular partners in open innovation
implies a firm’s weaker bargaining position (hypothesis 2c). In Model (4), interactive

13
terms of these partnership structure variables with Lpatent are included, and found that
negative impact of “hhi” are consistent over the number of patents, while a negative
effect of the share of large firms as a partner increases by the number of patent filings.
Therefore, hypothesis 2a is not supported. However, it should be noted that the
coefficient to Lpatent turns into not statistically significant in model (4), so that the risk
factor associated with patent filing is now loaded on the cross terms of Lpatent and the
partnership structure variables.
5. Discussion and conclusions
This paper uses patent filing as an indicator of innovation and investigates the
relationship between innovation and firm’s survival, based on the linked dataset of the
Census of Establishment and Enterprise and IIP Patent Database for Japanese firms. We
have constructed the indicators on the organization of innovative activities, such as
external collaboration in invention and the type of collaborative partners, and
disentangle two competing factors associated with innovative activities, i.e.
technological capability (positive influence on firm’s survival) and commercial risk
(negative influence on firm’s survival). We have found that the risk factor surpasses the
capability one, so that the impact of patenting on survival becomes negative on firm’s
survival at the end for Japanese firms. The findings in this study generally support the
argument in Buddelmeyer et. al (2010), in a sense that patenting involves counteracting
factors of “technological superiority” and “greater commercialization risk”. The results
in survival regressions can be explained by “greater commercialization risk” hypothesis,
that is, small companies are more vulnerable to risks associated with patents, so that
survival rate becomes lower.
An innovative activity is essential to firm’s growth and productivity, but a failure of
risky investment is likely to lead to a failure of the firm itself. We would expect learning
effects with innovative activities even though it ends up with failure, but when a firm
goes into dissolving, the experience of such innovative activities will be lost as well.
Therefore, we would expect substantial social welfare loss associated with exit of firms
investing in risky R&D project. In addition, the negative correlation between innovative
activities and firm’s survival may stifle hi-tech entrepreneurial activities. Therefore, we
have to reconfirm the importance of SME innovation policy, which mitigates such risk
factor in an innovation process.
Innovation and entrepreneurship is an important topic, particularly for Japan, because

14
Japan has a lower firm’s turnover rate, compared to those in the OECD countries such
as Europe and the United States. The share of entry and exit of enterprises is much
lower than that of the United States, and Japan’s ranking in the Global Entrepreneurship
Monitor for entrepreneurial spirit is near the lowest in the world (GEM, 2010). It is
difficult to cultivate startups in Japan, especially hi-tech startups with a technical
background, due to labor market rigidity, underdevelopment of venture capital activities
supplying risk money to start up projects, and other factors (Motohashi, 2010).
According to our findings, a risk associated with innovative activities may be loaded too
much on entrepreneur, instead of being shared with other parties such as venture
capitalist. Therefore, policies to activate factor market, such as labor and financial
market, are important.
In addition, a larger firm with substantial technological capability plays an important
role in Japanese national innovation system, and in-house orientation of large firm’s
R&D may hinder entrepreneurship activities. In the United States, substantial positive
spillover effects from failure of high tech startups in high-tech industry to existing firms
are observed (Knott and Posen, 2005; Hoetker and Agarwal, 2006). However, this may
not be the case for Japan, where labor market is more rigid, and technology spillovers
embodied in human capital cannot be expected to the extent in the United States.
Therefore, some coordinated mechanism to re-distribute innovative labor and assets
when mismatch with their owner’s business strategic goal becomes significant. Recent
intense international competition in high-tech product market makes large Japanese
firms to change its in-house R&D model, and seek for open innovation style (Motohashi,
2005). Therefore, public intervention to create coordinator in such innovation market, as
is found in the Innovation Cooperation Network of Japan, is justified in some areas
where market function is particularly weak.

15
References
Baily, M. N., C. Hulten and D. Campbell (1992) “Productivity Dynamics in
Manufacturing Plants” Brookings Papers on Economics Activity:
Microeconomics, Vol. 2, pp. 187-249
Bartelsman, E. & M. Doms (2000), "Understanding Productivity: Lessons from
Longitudinal Microdata", Journal of Economic Literature, 38(3): 569-594
Bartelsman, E., S. Scarpetta and F. Schivardi (2005), “Comparative analysis of firm
demographics and survival: evidence from micro-level sources in OECD
countries,” Industrial and Corporate Change, 14, 365-391
Baumol, W. J. (2010), The Microtheory of Innovative Entrepreneurship, Princeton
University Press
Belderbos, R., D. Faems, B. Lenten and B. V. Looy (2010), “Technological Activities
and Their Impact on the Financial Performance of the Firm: Exploitation and
Exploration within and between Firms, Journal of Product Innovation
Management, 27: 869-882
Buddelmeyer, H., P. Jensen and E. Wesbster (2010), Innovation and the determinants of
company survival, Oxford Economic Papers, 62, 261-285
Carpenter. R. E. and B. C. Perterson (2002), Is the growth of small firms constraints by
internal finance?, Review of Economics and Statistics, 84: 298-309
Cockburn, I. and S. Wagner (2007), Patents and the survival of internet-related IPOs,
NBER Working Paper #13146, Cambridge MA
Esterve-Perez, S. and J. A. Manez-Castillejo (2008), The resource-based theory of the
firm and firm survival, Small Business Economics, 30, 231-249
Haeussler, C., D. Harhoff, and E. Mueller (2009), To Be Financed or Not… – The Role
of Patents for Venture Capital Financing, ZEW Discussion Paper No. 09-003,
Center for European Economic Research, Manheim Germany
GEM (Global Entrepreneurship Monitor) (2010), 2010 Global Report, GEM consortium
Gimeno, J., T. Folta, A. Cooper and C. Woo (1997), Survival of the fittest?
16
Entrepreneurial human capital and the persistence of underperforming firms,
Administrative Science Quarterly, 42: 750-783
Goto A. and K. Motohashi (2007), “Construction of a Japanese Patent Database and a
first look at Japanese patenting activities,” Research Policy 36(9), 1431-1442
Griliches, Z. and H. Regev (1995) “Productivity and Firm Turnover in Israeli Industry:
1979-1988” Journal of Econometrics, Vol. 65, No.1, pp.175-203
Grilli, L. , E. Piva, and C. R. Lamastra (2010) “Firm dissolution in high-tech sectors: An
analysis of closure and M&A”, Economics Letters 109(1), : 14–16
Hall, B., Jaffe, A. and M. Trajtenberg (2001), The NBER Patent Citations Data File:
Lessons, Insights and Methodological Tools, NBER working paper 8498
Hoetker, G. and R. Agarwal (2007), Death hurts, but it isn’t fatal: The posexit diffusion
of knowledge created by innovative companies, Academy of Management
Journal, 50(2): 446-467
Knott, A. M. and H. E. Posen (2005), Is failure good? Strategic Management Journal,
26: 617-641
March, J. G. (1991), “Exploration and exploitation in organizational learning”
Organization Science, 2(1), 71-87
Matsuura, T., and K. Motohashi (2005) “Market Dynamics and Productivity in
Japanese Retail Industry in the late 1990's,” RIETI Discussion Paper Series
05-E-001, RIETI, Tokyo
Mitchell, W. (1994), The dynamics of evolving markets: The effects of business sales
and age on dissolutions and divestitures, Administrative Science Quarterly,
39(4): 572-602
Motohashi, K. (2011) “Innovation and Entrepreneurship: A first look at linkage data of
Japanese patent and enterprise census”, RIETI Discussion Paper Series
11-E-007, 2011/02
Motohashi, K. (2010), “Comparative Analysis of Biotechnology startups between Japan
and the U.S.”, a paper presented at Stanford STAJE conference on
Entrepreneurship and Innovation in Japan, February 2010, Stanford CA

17
Motohashi, K. (2008), “Growing R&D Collaboration of Japanese Firms and Policy
Implications for Reforming the National Innovation System,” Asia Pacific
Business Review 14(3), 339 - 361
Motohashi, K. (2005) “University-industry collaborations in Japan: The role of new
technology-based firms in transforming the National Innovation System,”
Research Policy 34(5), 583-594
Motohashi, K. and S. Muramatsu (2010) “Examining university industry collaboration
policy in Japan by patent analysis,” mimeo
Nagaoka, S., K. Motohashi, and A. Goto (2010),“Patent Statistics as an Innovation
Indicator”, Handbook of the Economics of Innovation Volume 2, Academic
Press, 2010/05: 1083-1128
OECD(2003), The Sources of Economic Growth in OECD countries, OECD Paris
Orgega-Argiles, R. and R. Moreno (2007), Firm competitive strategies and the
likelihood of survival: the Spanish case, Discussion Paper on Entrepreneurship,
Growth and Public Policy 2007-05, Max-Planck Institute of Economics, Jena
Germany
Pederzoli, C,. G. Thona and C. Torricelli (2011), Modeling credit risk for innovative
firms: the role of innovation measures, mimeo
Santarelli, E. and M. Vivarelli (2007), Entrepreneurship and the process of firms’ entry,
survival and growth, Industrial and Corporate Change, 16, 455-488
Schumpeter, J. A. (1934) The Theory of Economic Development, Harvard University,
MA, USA
Schumpeter, J.. A. (1942), Capitalism, Socialism, and Democracy, Harper, NY, USA
Srinivasan, R., G. L. Lilien and A. Rangaswamy (2008), Survival of high tech firms:
The effects of diversity of product-market portfolios, patents and trademarks,
International Journal of Research in Marketing, 25(2008): 119-128

18
Table 1: Entry, continue and exit of firm and open innovation
Table 2: Share of open innovation firm by size (only for continuing firms)
2001 2006 2001 2006
Entry 41.7% 13.2%
Continue 37.4% 43.4% 12.0% 14.4%Exit 33.7% 8.1%
Inter firm network U-I collaborations
2001 2006 2001 2006
0 0.0% 20.0% 10.0% 20.0%
1 23.1% 29.3% 8.7% 10.6%2 24.1% 30.1% 5.1% 7.3%3 20.6% 27.6% 4.0% 6.0%
4-5 22.5% 29.4% 4.2% 6.3%
6-10 24.0% 32.1% 4.1% 6.1%
11-100 33.6% 41.6% 8.1% 11.0%101-1000 60.1% 61.1% 26.8% 29.3%
1001- 78.4% 68.0% 55.3% 49.1%
Inter firm network U-I collaborations
19
Table 3: Share of open innovation firm by industry (only for continuing firms)
# offirms 2001 2006 2001 2006
A . Agriculture 165 27.3% 35.8% 9.7% 17.6%
B . Forestry 17 17.6% 29.4% 11.8% 11.8%C . Fisheries 13 15.4% 23.1% 7.7% 15.4%
D . Mining 75 41.3% 53.3% 17.3% 20.0%E . Construction 4,972 34.0% 39.7% 11.1% 12.2%
F . Manufacturing 24,780 38.5% 45.0% 10.9% 13.5%G . Electricity, Gas, Heat Supply and Water 87 63.2% 67.8% 35.6% 42.5%
H . Information and Communications 1,860 29.1% 38.1% 6.8% 10.3%I . Transport 637 41.4% 50.4% 8.3% 8.6%
J . Wholesale and Retail Trade 13,611 41.2% 45.7% 15.0% 16.8%
K . Finance and Insurance 173 37.6% 44.5% 11.0% 12.7%L . Real Estate 545 23.3% 29.0% 4.6% 5.7%
M . Eating and Drinking Places, Accommodations 531 24.7% 26.4% 8.1% 8.7%
N . Medical, Health Care and Welfare 127 22.8% 29.9% 8.7% 15.7%O . Education, Learning Support 168 25.0% 25.0% 14.9% 16.7%
P . Compound Services 222 0.0% 0.0% 71.6% 94.1%Q . Services, N.E.C. 4,816 32.5% 39.8% 10.9% 14.2%
Inter firm network U-I collaborations

20
Table 4: Share of open innovation firm by industry (only for continuing firms;
manufacturing in detai)
# offirms 2001 2006 2001 2006
09 Manufacture of food 1417 25.12% 29.78% 9.10% 12.00%
10 Manufacture of beverages, tobacco 366 26.78% 31.15% 11.20% 14.75%11 Manufacture of textile mill products 760 37.24% 44.21% 9.08% 11.97%
12 Manufacture of apparel 665 20.75% 26.47% 2.71% 3.91%13 Manufacture of lumber and wood products 413 29.54% 34.38% 7.75% 10.65%
14 Manufacture of furniture and fixtures 419 19.81% 26.25% 5.97% 8.35%15 Manufacture of pulp, paper and paper products 714 34.31% 41.18% 5.46% 7.42%
16 Printing and allied industries 810 28.02% 34.32% 5.06% 6.17%17 Manufacture of chemical and allied products 1169 57.31% 61.33% 26.43% 29.68%18 Manufacture of petroleum and coal products 70 52.86% 57.14% 21.43% 30.00%
19 Manufacture of plastic products 1693 42.35% 50.97% 9.45% 11.70%20 Manufacture of rubber products 327 44.65% 51.99% 11.93% 12.84%
21 Manufacture of leather tanning, leather products 183 15.85% 20.77% 1.09% 1.09%22 Manufacture of ceramic, stone and clay products 1167 40.36% 48.41% 15.77% 19.88%
23 Manufacture of iron and steel 398 46.98% 51.76% 16.58% 17.84%24 Manufacture of non-ferrous metals and products 349 54.44% 57.31% 16.62% 17.48%
25 Manufacture of fabricated metal products 2803 35.39% 43.74% 7.53% 10.31%26 Manufacture of general machinery 4809 40.53% 46.60% 10.63% 12.89%
27 Manufacture of electrical machinery, equipment 1611 46.74% 53.01% 12.04% 14.65%28 Manufacture of ICT equipment 413 44.07% 50.12% 13.32% 18.16%
29 Electronic parts and devices 935 45.35% 54.97% 12.51% 17.43%30 Manufacture of transportation equipment 1178 48.47% 54.33% 16.47% 19.02%
31 Manufacture of precision instruments and machiner 983 40.69% 46.59% 13.22% 17.50%32 Miscellaneous manufacturing industries 1128 24.20% 29.96% 4.79% 5.76%
Inter firm network U-I collaborations

21
Table 5: Regression results on firm’s survival: All samples
(1) (2) (3) (4) (5)
Lemp 0.104 0.106 0.107 0.107 0.107
(6.41)** (6.49)** (6.57)** (6.56)** (6.56)**
Lage 0.160 0.163 0.170 0.17 0.17(10.04)** (10.19)** (10.52)** (10.53)** (10.52)**
Lemp*Lage 0.032 0.032 0.030 0.03 0.03(5.83)** (5.79)** (5.53)** (5.54)** (5.55)**
Lpatent -0.063 -0.055 -0.079 -0.081 -0.079(14.83)** (10.87)** (10.21)** (9.76)** (9.19)**
d_firm -0.088 -0.146 -0.135 -0.144(5.72)** (6.63)** (6.05)** (6.00)**
d_univ 0.051 0.048 0.052 0.061(1.87) (1.15) (1.24) (1.27)
cited 0.000 0.002 0.002(0.10) (0.90) (0.95)
generalty -0.095 -0.243 -0.291(1.89) (3.13)** (3.59)**
Lpatent*d_firm 0.041 0.036 0.034(3.75)** (3.21)** (3.02)**
Lpatent*d_univ -0.007 -0.008 -0.008(0.59) (0.73) (0.67)
Lpatent*cited -0.004 -0.003(1.85) (0.94)
Lpatent*generalty 0.139 0.115(2.90)** (2.22)*
d_firm_cited -0.005(0.66)
d_firm*generalty 0.228(2.07)*
d_univ_cited -0.001(0.05)
d_univ*generalty -0.094(0.45)
Constant -0.050 -0.032 -0.024 -0.011 -0.024(0.09) (0.06) (0.04) (0.02) (0.04)
Industry dummy Yes Yes Yes Yes YesObservations 57268 57268 57268 57268 57268Absolute value of z statistics in parentheses* significant at 5%; ** significant at 1%
22
Table 6: Regression results on firm’s survival: Acquisition or Dissolution
Acquisition Disolution Acquisition Disolution
Lemp -0.347 0.092 -0.345 0.095
(9.00)** (5.36)** (8.91)** (5.51)**Lage -0.205 0.113 -0.200 0.124
(4.47)** (6.77)** (4.32)** (7.39)**Lemp*Lage 0.074 0.058 0.074 0.056
(6.09)** (9.80)** (6.03)** (9.43)**Lpatent -0.036 -0.060 -0.035 -0.085
(5.30)** (12.57)** (2.14)* (9.27)**d_firm -0.112 -0.146
(2.50)* (5.67)**d_univ -0.042 0.041
(0.53) (0.78)cited 0.008 0.001
(1.05) (0.60)generalty -0.208 -0.281
(1.28) (3.28)**Lpatent*d_firm 0.019 0.039
(0.96) (3.25)**Lpatent*d_univ -0.007 0.011
(0.43) (0.87)Lpatent*cited -0.008 0.000
(1.87) (0.10)Lpatent*generalty 0.100 0.102
(1.12) (1.81)d_firm_cited -0.001 -0.008
(0.11) (0.81)d_firm*generalty 0.137 0.218
(0.63) (1.87)d_univ_cited 0.007 -0.002
(0.33) (0.13)d_univ*generalty 0.087 -0.159
(0.23) (0.72)Constant 3.131 -0.026 3.14 0.006
(7.54)** (0.05) (7.52)** (0.01)Industry dummy Yes Yes Yes YesObservations 45727 55912 45727 55912Absolute value of z statistics in parentheses* significant at 5%; ** significant at 1%
(1) (2)
23
Table 7: Regression results on firm’s survival: Co-patenting & Acquisition samples
(1) (2) (3) (4)
Lemp -0.418 -0.410 -0.407 -0.408
(5.92)** (5.79)** (5.75)** (5.73)**Lage -0.283 -0.273 -0.272 -0.271
(3.11)** (2.99)** (2.98)** (2.97)**Lemp*Lage 0.103 0.100 0.100 0.1
(4.70)** (4.56)** (4.56)** (4.54)**Lpatent -0.032 -0.035 -0.033 -0.007
(3.35)** (3.50)** (3.20)** (0.29)Univ share -0.072 -0.055 -0.059 (0.65) (0.49) (0.53)Lpatent* Univ share 0.000 0.000 0.000
(0.98) (0.94) (0.75)HHI 0.058 0.042
(1.06) (0.52)Larger firms -0.051 0.054
(0.86) (0.59)Lpatent*HHI 0.007 (0.29)Lpatent*Large firm -0.041
(1.46)Constant 3.152 3.133 3.120 3.057
(9.76)** (9.70)** (9.56)** (9.18)**Industry dummy Yes Yes Yes YesObservations 14718 14712 14712 14712Absolute value of z statistics in parentheses* significant at 5%; ** significant at 1%

24
Table 8: Regression results on firm’s survival: Co-patenting & Dissolution samples
(1) (2) (3) (4)
Lemp 0.093 0.094 0.100 0.104
(2.59)** (2.61)** (2.77)** (2.89)**Lage 0.101 0.103 0.105 0.11
(2.73)** (2.77)** (2.84)** (2.95)**Lemp*Lage 0.060 0.060 0.058 0.056
(5.13)** (5.06)** (4.94)** (4.76)**Lpatent -0.029 -0.032 -0.040 0.021
(4.01)** (4.25)** (5.14)** (1.17)Univ share 0.187 0.181 0.17 (2.51)* (2.42)* (2.28)*Lpatent* Univ share 0.000 0.000 0.000
(0.29) (0.31) (0.07)HHI -0.100 0.016
(3.06)** (0.31)Larger firms -0.075 0.014
(2.29)* (0.27)Lpatent*HHI -0.054 (2.90)**Lpatent*Large firm -0.043
(2.10)*Constant -2.134 -2.137 -2.010 -2.167
(2.72)** (2.73)** (2.58)** (2.77)**Industry dummy Yes Yes Yes YesObservations 17468 17460 17460 17460Absolute value of z statistics in parentheses* significant at 5%; ** significant at 1%