ontario convention market analysis final report · ontario convention market analysis final report...
TRANSCRIPT

1
Ontario Convention Market AnalysisFinal Report
Ontario Ministry of Tourism
Investment and Development Office
February 2008
2
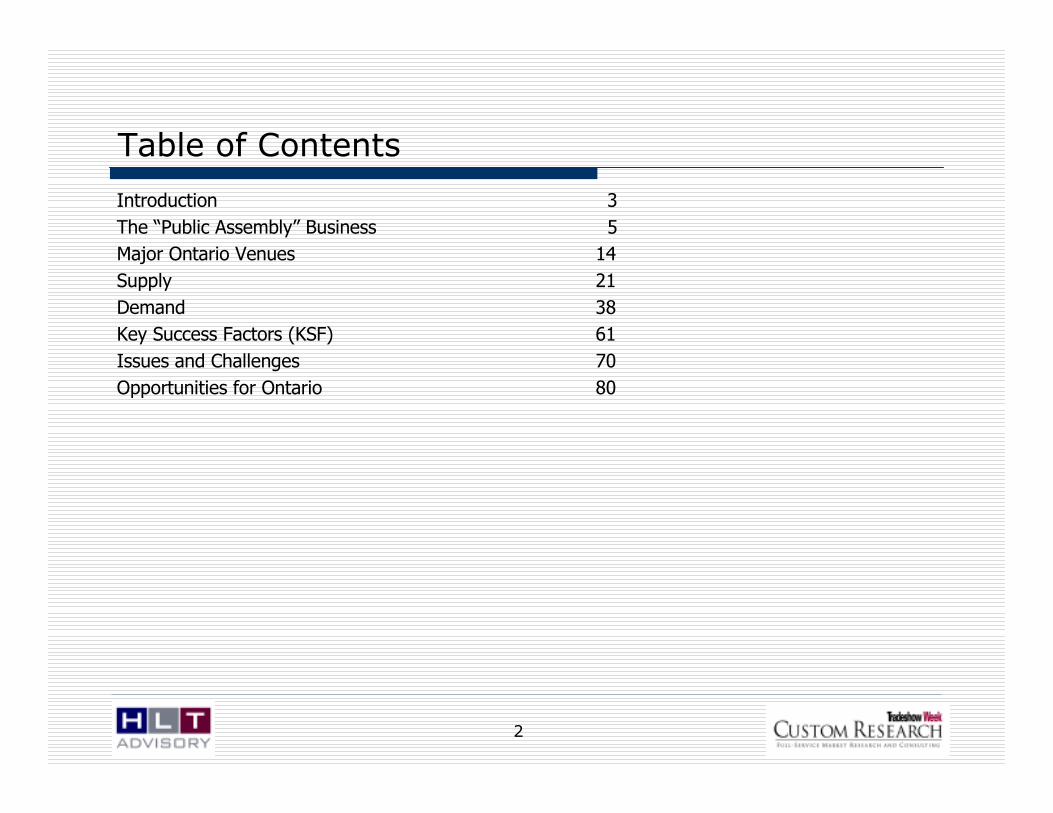
Table of Contents
Introduction 3
The “Public Assembly” Business 5
Major Ontario Venues 14
Supply 21
Demand 38
Key Success Factors (KSF) 61
Issues and Challenges 70
Opportunities for Ontario 80

3
Background
The “convention” industry is an important sector of the overall Canadian tourism industry, with Ontario receiving a considerable proportion of total spending. In 2004, visitor spending in Ontario by business convention visitors generated almost $800 million in spending on accommodation, food and beverage, recreation and entertainment facilities, and transportation service providers. This spending generated significant economic benefits across a variety of fronts ranging from direct government revenues to the impact on cultural and heritage attractions in host communities.
Competition among convention locations is fierce however. Throughout North America cities (and more senior-level jurisdictions) wishing to increase share of the convention market have expanded and upgraded exhibit and meeting space. At the same time, there has been an increase in the sophistication of the industry. Convention organizers are well aware of the economic benefits attached to convention activity and they increasingly require that potential host locations bid for their presence.
Ontario’s tourism sector faces several challenges. Effective management of these challenges for the industry requires a sustained government response built on the Ontario Tourism Strategy and its long-term, innovative plan for the sustainability and growth of Ontario’s tourism industry.
Purpose
The Investment and Development Office of the Ministry of Tourism (the “Ministry”) issued a Request for Proposals to “engage a consultant from to complete a Convention Market Analysis Study to determine the size of the North America and Ontario meeting, convention, and trade and consumer show market, including demand, supply and potential capacity.”
The Ministry’s intent is that the Study will inform a framework to better understand the meeting, convention, and trade and consumer show market and outlook. In addition the study will support Ontario Government decision-making designed to sustain the competitiveness and growth of Ontario’s tourism industry.
1. IntroductionBackground and Purpose
4
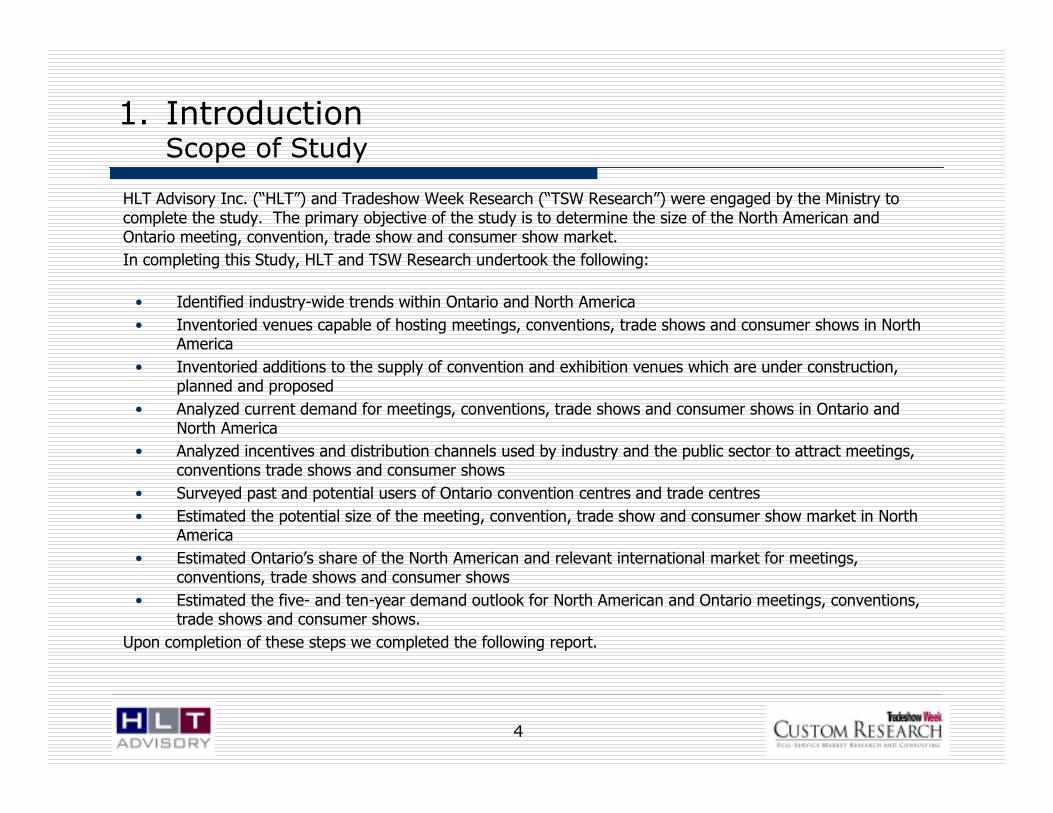
1. IntroductionScope of Study
HLT Advisory Inc. (“HLT”) and Tradeshow Week Research (“TSW Research”) were engaged by the Ministry to complete the study. The primary objective of the study is to determine the size of the North American and Ontario meeting, convention, trade show and consumer show market.
In completing this Study, HLT and TSW Research undertook the following:
• Identified industry-wide trends within Ontario and North America
• Inventoried venues capable of hosting meetings, conventions, trade shows and consumer shows in North America
• Inventoried additions to the supply of convention and exhibition venues which are under construction, planned and proposed
• Analyzed current demand for meetings, conventions, trade shows and consumer shows in Ontario and North America
• Analyzed incentives and distribution channels used by industry and the public sector to attract meetings, conventions trade shows and consumer shows
• Surveyed past and potential users of Ontario convention centres and trade centres
• Estimated the potential size of the meeting, convention, trade show and consumer show market in North America
• Estimated Ontario’s share of the North American and relevant international market for meetings, conventions, trade shows and consumer shows
• Estimated the five- and ten-year demand outlook for North American and Ontario meetings, conventions, trade shows and consumer shows.
Upon completion of these steps we completed the following report.
5
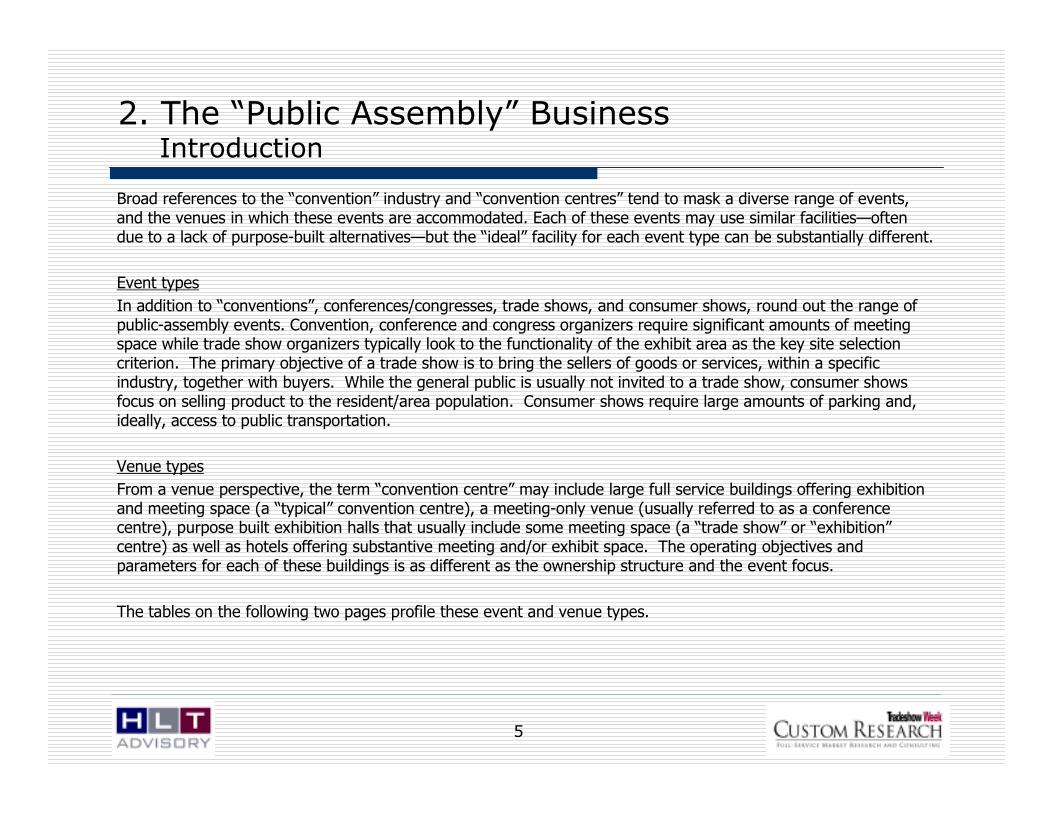
Broad references to the “convention” industry and “convention centres” tend to mask a diverse range of events, and the venues in which these events are accommodated. Each of these events may use similar facilities—often due to a lack of purpose-built alternatives—but the “ideal” facility for each event type can be substantially different.
Event types
In addition to “conventions”, conferences/congresses, trade shows, and consumer shows, round out the range of public-assembly events. Convention, conference and congress organizers require significant amounts of meeting space while trade show organizers typically look to the functionality of the exhibit area as the key site selection criterion. The primary objective of a trade show is to bring the sellers of goods or services, within a specific industry, together with buyers. While the general public is usually not invited to a trade show, consumer shows focus on selling product to the resident/area population. Consumer shows require large amounts of parking and, ideally, access to public transportation.
Venue types
From a venue perspective, the term “convention centre” may include large full service buildings offering exhibition and meeting space (a “typical” convention centre), a meeting-only venue (usually referred to as a conference centre), purpose built exhibition halls that usually include some meeting space (a “trade show” or “exhibition”centre) as well as hotels offering substantive meeting and/or exhibit space. The operating objectives and parameters for each of these buildings is as different as the ownership structure and the event focus.
The tables on the following two pages profile these event and venue types.
2. The “Public Assembly” BusinessIntroduction
6
2. The “Public Assembly” Business Event Types and Definitions
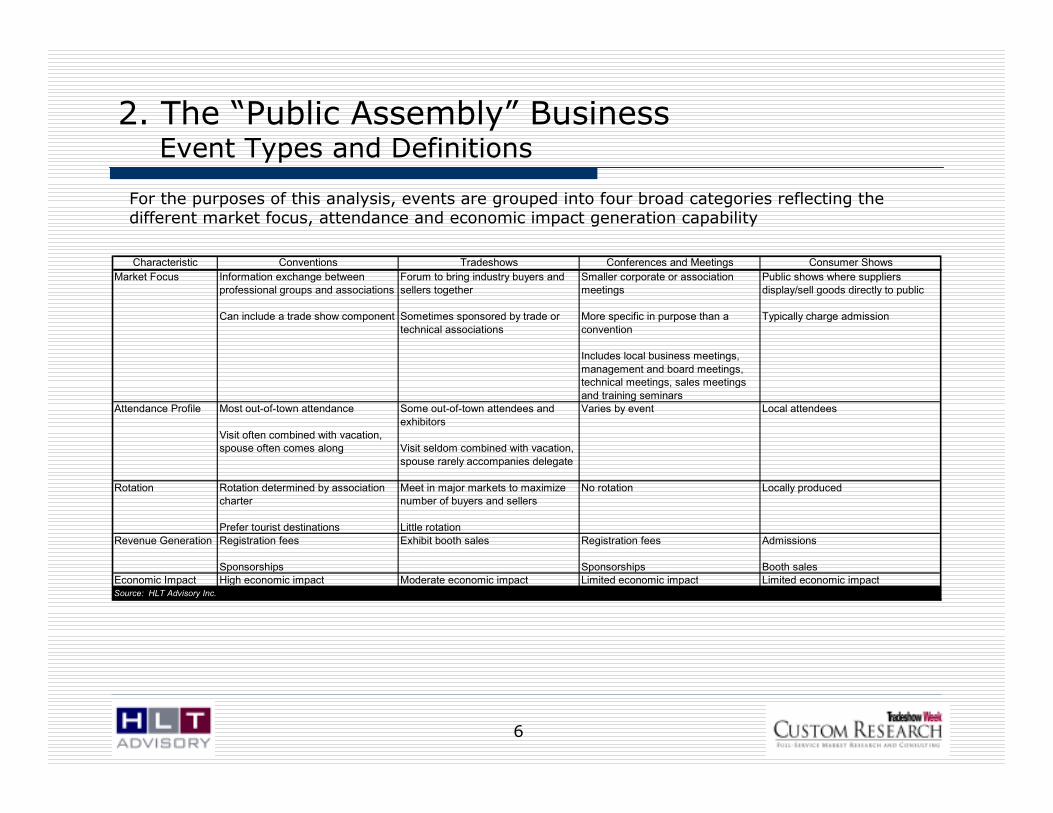
For the purposes of this analysis, events are grouped into four broad categories reflecting the different market focus, attendance and economic impact generation capability
Characteristic Conventions Tradeshows Conferences and Meetings Consumer Shows
Market Focus Information exchange between
professional groups and associations
Can include a trade show component
Forum to bring industry buyers and
sellers together
Sometimes sponsored by trade or
technical associations
Smaller corporate or association
meetings
More specific in purpose than a
convention
Includes local business meetings,
management and board meetings, technical meetings, sales meetings
and training seminars
Public shows where suppliers
display/sell goods directly to public
Typically charge admission
Attendance Profile Most out-of-town attendance
Visit often combined with vacation, spouse often comes along
Some out-of-town attendees and
exhibitors
Visit seldom combined with vacation,
spouse rarely accompanies delegate
Varies by event Local attendees
Rotation Rotation determined by association
charter
Prefer tourist destinations
Meet in major markets to maximize
number of buyers and sellers
Little rotation
No rotation Locally produced
Revenue Generation Registration fees
Sponsorships
Exhibit booth sales Registration fees
Sponsorships
Admissions
Booth salesEconomic Impact High economic impact Moderate economic impact Limited economic impact Limited economic impactSource: HLT Advisory Inc.

7
2. The “Public Assembly” Business Venues and Cities: Types and Definitions
For the purposes of this analysis, venues are grouped into four broad categories reflecting the event served and other key characteristics. Venues can be adapted to suit a variety of events or purpose built if demand warrants.
Cities are often segmented into “tiers” for classification purposes. The definition of “tier” is subjective and is based on factors such as attractiveness as a convention destination (e.g., air access, range of hotels), supply of meeting and exhibition space, population base and destination awareness. Within a Canadian context, a “Tier 1” city is typically able to attract a number of international events (in addition to national and regional events), while a Tier 2 city might focus on national events and a Tier 3 city primarily regional events. In Ontario, Toronto is the only true Tier 1 city. Ottawa, currently a Tier 2 city, has destination attributes attractive to international event planners but is underserved in terms of meeting and exhibition space (although this limitation is being addressed through the proposed expansion of the Ottawa Congress Centre). Virtually all other Ontario cities primarily service the regional market and, as such, are considered Tier 3.
Characteristic Convention Centre Conference Centre Exhibition Centre/Trade Centre Convention Hotel
Event Focus Conventions with and without exhibits Conventions without exhibits Trade and consumer shows with
limited meeting requirements
Events generating guest room
demand
Building Space Parameters
Extensive meeting and exhibiton space
Quality audio/visual
Banquet/food and beverage
Meeting space
Quality audio/visual
Banquet/food and beverage
Exhibit space/meeting space varies by building focus
Meeting space; exhibit space in largest hotels
Unique Site
Requirements
Adjacent/proximate hotels Adjacent/proximate hotels Parking Market specific
Ownership (Typical) Public sector Public sector/some private sector Private and public sector Private sectorMeasures of Success Economic impact Economic impact and P&L Depends on ownership/governance
structure
Room nights sold
P&LSource: HLT Advisory Inc.
8
2. The “Public Assembly” Business Economic impact: The focus is convention centres
Most North American convention centres were built and are operated as a means of generating economic impact in a given city and/or region. Economic impact is maximized by giving priority to those events attracting the largest number of out-of-town visitors (i.e., delegates of regional, national and international conventions). Bottom-line orientation is often not a priority, as the “success” of many convention facilities is not measured by profitability for the convention venue itself but rather on the volume of spending at the community level. As a result, convention centres are often used as low-cost attractors with competition on a “price” basis becoming much more common. In fact, some destinations (generally Tier 2 and 3 U.S. cities, but a growing number of Canadian cities as well) not only have the ability to provide the convention centre for free but also are aggressively doing so, provided the economic impact of the event is significant enough.
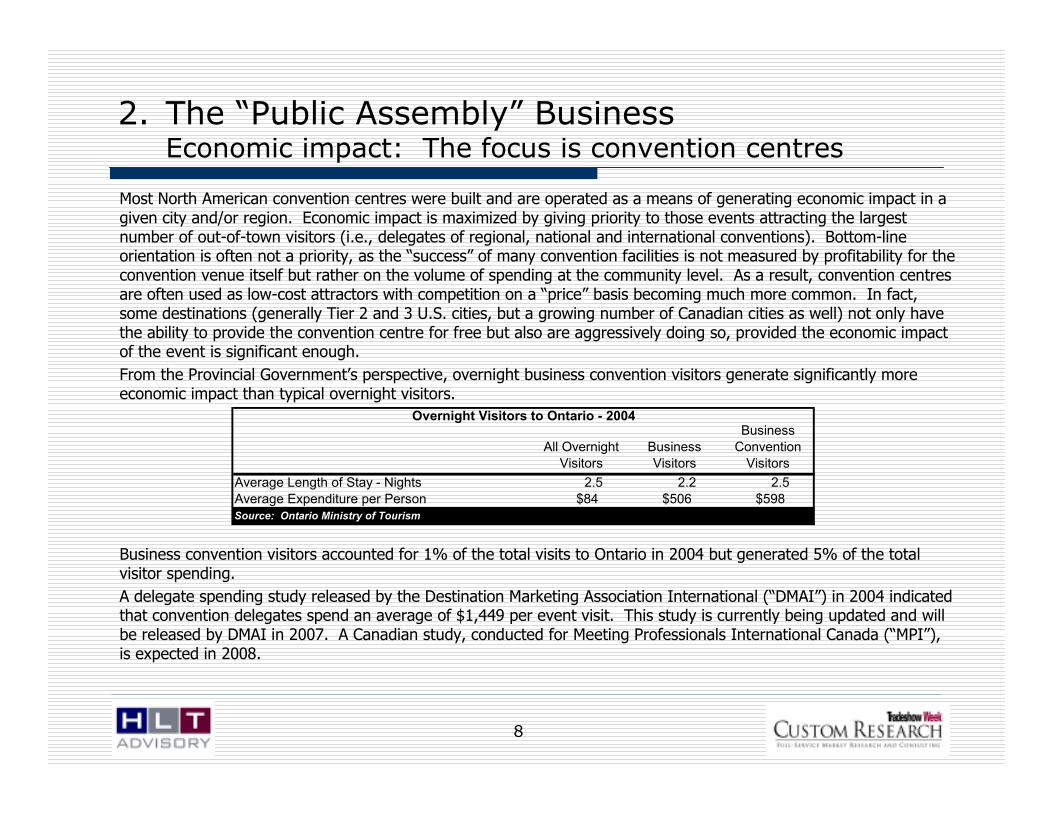
From the Provincial Government’s perspective, overnight business convention visitors generate significantly more economic impact than typical overnight visitors.
Business convention visitors accounted for 1% of the total visits to Ontario in 2004 but generated 5% of the total visitor spending.
A delegate spending study released by the Destination Marketing Association International (“DMAI”) in 2004 indicated that convention delegates spend an average of $1,449 per event visit. This study is currently being updated and will be released by DMAI in 2007. A Canadian study, conducted for Meeting Professionals International Canada (“MPI”), is expected in 2008.
All Overnight
Visitors
Business
Visitors
Business
Convention
Visitors
Average Length of Stay - Nights 2.5 2.2 2.5
Average Expenditure per Person $84 $506 $598Source: Ontario Ministry of Tourism
Overnight Visitors to Ontario - 2004

9
The focus on generating economic impact explains several characteristics of the industry, including:
• The tendency towards ownership, and often management, by local or regional governments.
• Restrictions (sometimes express) on competing for events (i.e., banquets, smaller meetings) that could be accommodated within privately-owned facilities (i.e., large hotels, privately-or publicly-owned trade show facilities).
• Exemptions from municipal property taxes.
• Recognition that success is dependent on the development and funding of a long-term marketing strategy given that lead times required to secure conventions are often 3+ years long—and often several years longer for larger, international events.
Conventions however, are just one of several types of events suitable for convention facilities. Trade shows, consumer shows and smaller-scale conferences and meetings (i.e., the corporate market) may also be held in convention facilities.
The extent to which these events are targeted by a convention facility, as opposed to a local hotel or trade/consumer show facility depends on the aggressiveness and mandate of the convention centre in a specific location—as well as the number/quality of and the relationships with these other space providers. More importantly, in markets where sufficient trade and consumer show activity occurs (e.g., Toronto), purpose-built exhibition facilities have been developed by both the public and private sectors. As trade shows are perceived, often correctly so, as not generating the same levels of economic impact as conventions dedicated exhibition/trade centres often do not receive the same incentives as convention centres (e.g., more limited marketing support; in the case of private trade centres the necessity to pay property tax). The variance in these incentives often causes friction within the broader tourism industry.
2. The “Public Assembly” Business The implications of focusing on economic impact?

10
2. The “Public Assembly” Business North America Supply/Demand Balance
From 2000 to 2006 growth in the supply of exhibit space in the United States and Canada exceeded growth in demand for business-to-business exhibition net square feet (at least 30,000 square feet of exhibit space) and business-to-business convention and exhibition attendance every year with the exception of 2005. Over this period growth in exhibit space supply averaged 4.3%/annum while growth in business-to-business exhibition square foot usage and business-to-business convention and exhibition attendance averaged 0.4% and 0.8% respectively.
This suggests that supply growth is outpacing demand growth. Further, an additional 8.6 million square feet of exhibit space is in the development pipeline representing an additional 10.1% supply growth.
Source: TSW Research
-8%
-6%
-4%
-2%
0%
2%
4%
6%
8%
10%
2000 2001 2002 2003 2004 2005 2006
Year-Over-Year Percentage Change
Exhibit Space Exhibition Net Square Feet Convention and Exhibition Attendance
11
Slowdown
1 – 2 Years
Expansion
3 – 4 Years
Peak
Recovery
2 – 3 Years
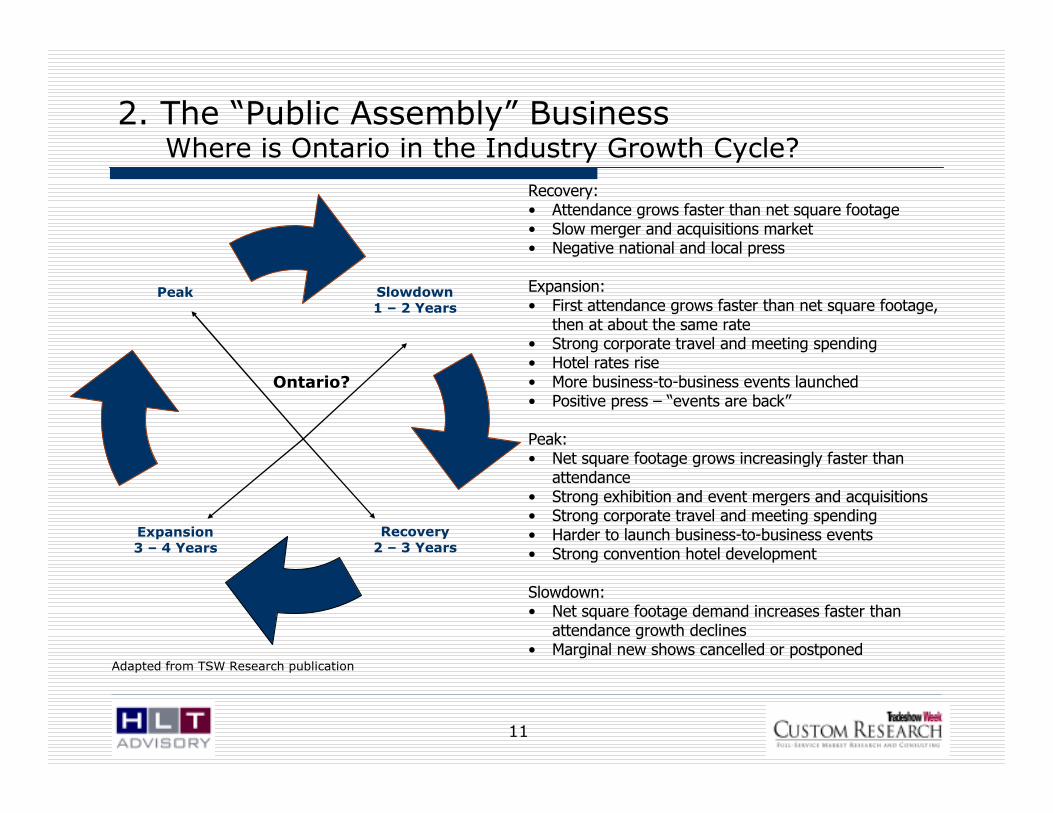
2. The “Public Assembly” BusinessWhere is Ontario in the Industry Growth Cycle?
Recovery:• Attendance grows faster than net square footage• Slow merger and acquisitions market• Negative national and local press
Expansion:• First attendance grows faster than net square footage,
then at about the same rate• Strong corporate travel and meeting spending• Hotel rates rise• More business-to-business events launched• Positive press – “events are back”
Peak:• Net square footage grows increasingly faster than
attendance• Strong exhibition and event mergers and acquisitions• Strong corporate travel and meeting spending• Harder to launch business-to-business events• Strong convention hotel development
Slowdown:• Net square footage demand increases faster than
attendance growth declines• Marginal new shows cancelled or postponed
Ontario?
Adapted from TSW Research publication

12
2. The “Public Assembly” BusinessOccupancy Levels at North American Venues
One measure of success for a public-assembly building is the utilization or occupancy level (i.e., the number of days in any given year that the venue, or parts of the venue are used). While this measure demonstrates activity—and an obvious extension to revenue and bottom-line profitability levels—within the venue, occupancy does not necessarily demonstrate “success”… particularly if success is defined as generating economic impact within the host community. In this case, success is more a function of the type of event than the quantum.
Nevertheless, utilization is an effective measure when looking at industry-wide trends. The theoretical maximum occupancy rates for exhibit halls is thought to be around 70% as a result of the requirement of move-in and move-out days for trade shows and consumer shows. A more likely (and efficient) occupancy level is thought to be in the 50% to 60% range. Greater occupancy levels may be achieved with banquet and meeting spaces. An annual study by PricewaterhouseCoopers focusing on North American venues (with an emphasis on convention centres), “2006 Convention Center Report”, suggests average exhibit hall occupancies in the 50% to 60% range for those venues located in gateway cities (major U.S. and Canadian cities with excellent air access), and even lower levels for regional venues.
The occupancy levels at the four major Ontario convention centres (Hamilton Convention Centre, London Convention Centre, Ottawa Congress Centre and Metro Toronto Convention Centre) suggest somewhat stronger business levels, a function, in part, of the operating mandates of Canadian venues to include more bottom-line accountability (and therefore more “local” profit-based events) as opposed to pure economic impact generation.
2004 2005 2006
Exhibit Hall Occupancy 50.4% 57.1% 62.0%
Meeting Room Occupancy 46.8% 48.1% 51.6%
Ballroom Occupancy 43.5% 44.5% 54.7%Total 49.4% 54.5% 59.6%Source: Ontario Convention Venues
* Weighted Average
Occupancy Rates* at Ontario Convention Venues
13
2. The “Public Assembly” BusinessImplications for Ontario
The public assembly business can be segmented into four broad types of events specifically: conventions, conferences, trade shows and consumer shows. A variety of venue types service these events including purpose -built buildings such as convention and trade centres as well as buildings adapted to meet demand such as arenas used to service trade and consumer shows.
The justification for public ownership (and most often in Canada, management) of convention centres is the creation of economic impact for the broader community. On the other hand, the private-sector’s involvement in public-assembly buildings occurs when the operating environment produces an opportunity for profit-based events such as trade and consumer shows. Trade and consumer shows generate profit for the event producer (and indirectly to venue owner) based on size and scale of the exhibition (the “sellers”) and the ability to generate visitors to the event (the “buyers.”). In the case of convention hotels, the profit-generating element is hotel room night sales.
As a result, a privately-owned venue will most likely prioritize events that maximize revenue to the venue. Most often these events are local or regional but in some cases (such as Toronto) have the potential to draw from a much wider area. A publicly-owned venue will prioritize events that maximize economic impact, such as conventions. Conventions are more likely to bring visitors to the host community; economic impacts are generated at the local, provincial and federal level although not all impacts are incremental. For the purposes of this analysis, consideration is given to economic impact at the provincial level (i.e., the ability to drive incremental visitation to Ontario).
The public assembly business has historically been successful in generating economic impact for Ontario. In 2004 (the last year for which full data is available), the convention business segment accounted for 1% of the total visitation to Ontario yet generated 5% of the tourist spending. Ontario has recognized the importance of the public assembly market as evidenced by the development and renewal of the Convention Development Fund.
Ontario offers a range of destinations and venues for the full array of event types. Within the convention marketplace, Toronto and Ottawa hold the greatest potential to create incremental visitation given current (and potential) size and scale of facilities as well as destination attractiveness factors. Niagara Falls and Windsor offer unique characteristics given the border and tourism focus. Hamilton and London have more regionally-focused opportunities. All of these destinations have a degree of potential in the trade and consumer show market.
14
The balance of this report focuses primarily on the large convention and exhibition/trade centres in major cities across the province. The majority of these are publicly owned and reflect the mandate and focus of the public shareholder (either the municipal or provincial governments). The publicly-owned venues under consideration (excluding proposed venues) include:
• Direct Energy Centre (former National Trade Centre), Toronto
• Hamilton Convention Centre
• Lansdowne Park (Ottawa)
• London Convention Centre
• Metro Toronto Convention Centre
• Ottawa Congress Centre
Privately-owned venues include:
• Toronto Congress Centre
• Toronto International Centre
On an overall basis we have also taken into account the numerous convention hotels in various Ontario destinations as well as several local convention/meeting/exhibit facilities primarily focused on a local market.
3. Major Ontario VenuesIntroduction

15
3. Major Ontario VenuesMandates of Publicly-Owned Ontario Venues
The delivery of economic impact is a common focus among the publicly-owned Ontario venue mission statements. Each venue also addresses local issues and objectives, including a bottom-line orientation.
City Full Name of Centre Mission StatementHamilton Hamilton Convention Centre - To maintain, operate, manage and promote the Hamilton Convention Centre, Hamilton Place Theatre and Copps Coliseum on Behalf of the
City of Hamilton.
- To positively impact the economic health of the area through the increased use of hotels, restaurants, retail shops and service by using the
three facilities as the catalyst to retain local spending and attract people from outside the region.
- To maximize the use of the three facilities while providing programming that reflects local interests and contributes to the quality of life.
- Via effective, efficient management to constantly work towards the reduction of the annual municipal contribution by corporation of the City
of Hamilton.
- All of this is to be achieved while pursuing excellence of management and service in a manner that fosters local pride and enhances the
city’s reputation and image.London London Convention Centre The London Convention Centre will be recognized by the community as an economic generator for the City of London.
Core values:
1) Our associates and our partners are our greatest asset.
2) Operate in an ethical and trustworthy manner.
3) Inspire innovation, creativity and personal growth.
4) Demonstrate excellence in everything we do.
Ottawa Ottawa Congress Centre In cooperation with the National Capital Region's tourism industry partners, the mission of the Ottawa Congress Centre is to operate a fiscally
responsible efficient and effective first-class multipurpose convention/meeting facility through the development of existing and new niche
markets which will place Canada's Capital Region on the leading edge of the convention industry in the 21st Century.
Ottawa Lansdowne Park To be operated as a multi-purpose sports and entertainment facility catering to the needs of both local citizens and visitors and conduct such
activities in a manner which minimizes impacts on adjacent communities.
Toronto Metro Toronto Convention
Centre
The mission of the Metro Toronto Convention Centre is to operate a world class convention centre in a manner that:
- generates significant economic benefit to the community;
- provides a showcase for conventions, trade shows, public shows, meetings, and food and beverage events;
- operates on a cost recovery commercial basis; and
- is managed in a manner consistent with an Operational Enterprise Agency of the Province.
Toronto Direct Energy Centre
(one of four operations at
Exhibition Place)
The mission of Exhibition Place is to:
- provide an opportunity for business stimiluation and economic development in the community;
- provide a focus for public celebration and events;
- preserve the 22 architecturally and historically significant structures on the grounds; and
- provide a world class venue for trade and consumer shows and major city events and celebrations.
16
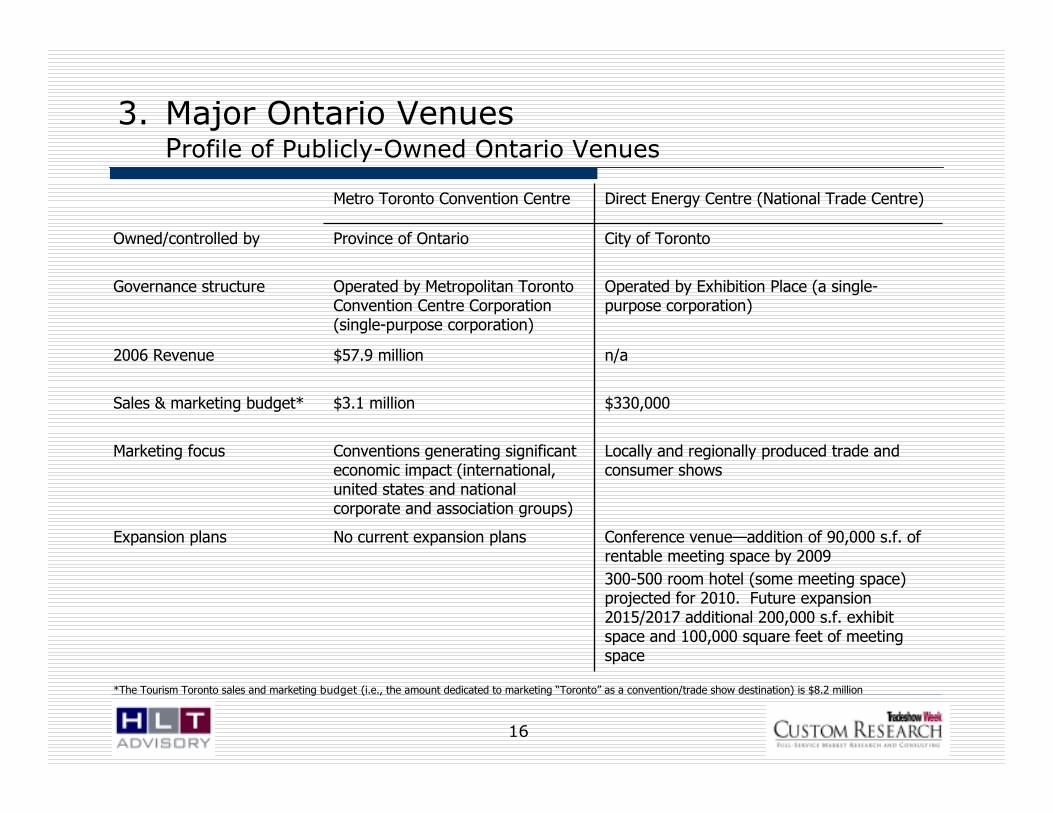
3. Major Ontario Venues Profile of Publicly-Owned Ontario Venues
n/a$57.9 million2006 Revenue
City of TorontoProvince of OntarioOwned/controlled by
Locally and regionally produced trade and consumer shows
Conventions generating significant economic impact (international, united states and national corporate and association groups)
Marketing focus
Operated by Exhibition Place (a single-purpose corporation)
Operated by Metropolitan Toronto Convention Centre Corporation (single-purpose corporation)
Governance structure
Conference venue—addition of 90,000 s.f. of rentable meeting space by 2009
300-500 room hotel (some meeting space) projected for 2010. Future expansion 2015/2017 additional 200,000 s.f. exhibit space and 100,000 square feet of meeting space
No current expansion plansExpansion plans
$330,000$3.1 millionSales & marketing budget*
Direct Energy Centre (National Trade Centre)Metro Toronto Convention Centre
*The Tourism Toronto sales and marketing budget (i.e., the amount dedicated to marketing “Toronto” as a convention/trade show destination) is $8.2 million

17
3. Major Ontario Venues Profile of Publicly-Owned Ontario Venues (cont’d.)
$4.5 million$10.2 million2006 Revenue
City of OttawaProvince of OntarioOwned/controlled by
Trade and consumer shows, primarily local and regional clientele
Post-expansion marketing strategy under development – will focus on new target markets (U.S. and international)
Marketing focus
Operated by City of Ottawa Business Transformation Services (City Department)
Operated by the Ottawa Congress Centre, single-purpose corporation
Governance structure
Currently, the City is conducting an international design competition for the redevelopment of Lansdowne Park. The redevelopment may or may not include a trade centre component.
Announced facility closure in September 2008, new facility to open in 2011
New facility profile (exhibit, meeting and ballroom space) to be announced. Funding commitments have been announced by the federal and provincial governments.
Expansion plans
Spend between $20,000 and $25,000$1.7 millionSales & marketing budget
Lansdowne ParkOttawa Congress Centre
Note: The Tourism Ottawa MC&IT sales and marketing budget is $1.5 million

18
$3.9 million$3.4 million2006 Revenue
City of LondonCity of HamiltonOwned/controlled by
Provincial associations and corporate meetings generating hotel demand
Regional and provincial markets, one- or two-day events with minimal hotel room requirements
Marketing focus
Incorporated company with arms length reporting to the City of London, single-purpose corporation
Hamilton Entertainment and Convention Facilities Inc. (“HECFI”), multi-purpose corporation. HECFI includes the Hamilton Convention Centre, Hamilton Place and Copps Coliseum.
Governance structure
No current expansion plansNo current expansion plansExpansion plans
$517,000$754,000Sales & marketing budget
London Convention CentreHamilton Convention Centre
3. Major Ontario Venues Profile of Publicly-Owned Ontario Venues (cont’d.)

19
3. Major Ontario Venues Profile of Ontario Privately-Owned Ontario Venues
Toronto-based ownership group Toronto-based ownership groupOwned/controlled by
Locally produced trade and consumer shows
Secondary market segment of meetings, concerts as well as ethnic and religious events
Locally produced trade and consumer shows
Significant food and beverage event business
Marketing focus
A conference centre is under construction that will offer 23,000 square feet of meeting space.
300,000 square foot expansion under construction (completion early 2008)
Planning a 25,000 square foot ballroom, additional exhibit space as well as a 400 to 500 room hotel
Expansion plans
Do not participate with Tourism Toronto but expect to do so once the conference centre is completed
Do not actively participate with Tourism Toronto
Sales & marketing
Toronto International CentreToronto Congress Centre
20
3. Major Ontario Venues Ontario Venues
The following analysis focuses on the major publicly-owned convention and trade centres in Ontario as well as selected major privately-owned trade centres and convention hotels.
Identified but not included in the analysis are:
• privately-owned banquet and conference centres;
• facilities that offer exhibit space but whose primary use is another purpose (i.e., sports facilities such as the Ricoh Centre, exhibitions such as the Western Fair in London and unique venues such as the Elgin and Winter Garden theatres); and
• hotels with less than 20,000 square feet of meeting space.
These smaller venues play a role in accommodating a variety of event types but in most cases lack the critical mass to generate or assist in generating incremental visitation to Ontario.

21
The field of competition for Ontario venues includes a broad range of Ontario facilities as well as venues located across Canada and North America. The size, scale and origin of attendees have the greatest impact on the destination decision. Suffice it to say, that within a North American context competition is substantial for all manner of event types. Demand characteristics are discussed in more detail in the following chapter.
As has been the case over the past few years, the growth in both the number and size of North American convention centres continues, although at a much slower rate than experienced through the 1990’s. Supply trends of note to Ontario venues include:
• Recognition by many in the North American convention ownership/management sector, that supply growth has outpaced demand. The effect of the supply – demand imbalance is most noticeable in those destinations lacking key attributes sought by meeting planners. Specifically, an adequate supply of nearby hotel rooms, convenient and cost effective air access, destination animation and appeal necessary to drive attendance.
• Price-based competition, most notably from Tier 3 cities that do not have the destination attributes to compete on merit.
• Considerable growth in “self-contained” convention centres where all convention components (i.e., hotel rooms, exhibit halls, meeting space, ballroom and entertainment) are provided under one roof. Several such facilities exist in Las Vegas (Sands Expo – the Venetian and Mandalay Bay) and are the exclusive product offering of dedicated hospitality operators such as Gaylord (Nashville, Orlando, Dallas, Washington D.C.). These facilities compete for events of the size and larger than what can be accommodated at Ontario convention venues. While these self-contained venues appeal to some, universal acceptance of this option by convention/meeting planners is still very much in doubt.
The following pages provide analysis of the supply profile with a focus on North American convention centre and trade/exhibition centre venues.
4. SupplyIntroduction

22
4. SupplyGrowth in North American Exhibit Space (1996 to 2007)
62.0 63.0 63.0 63.4 65.5 67.672.4
77.2 80.5 82.3 85.1 85.9
0
20
40
60
80
100
SF (000,000's)
1996 1997 1998 1999 2000 2001 2002 2003 2004 2005 2006 2007
Year
Source: TSW Research
Since 1996, the amount of exhibit space in Canada and United States venues has increased 38.5% from 62.0 million square feet to 85.9 million square feet. This represents a compound average growth rate of 3.0%. Exhibit space is the “default” measure of venue growth across convention centres and exhibition/trade centres. Meeting, banquet and associated support spaces are not included in this total but will be accommodated in each venue based on the market focus (e.g., conventions, conferences, trade shows) of the venue.

23
4. SupplyVenue Breakdown by Total Exhibit Area
TSW Research maintains a comprehensive inventory of convention centres, trade centres and hotels with meeting space across North America. Of the 569 venues in this inventory, the majority offer between 50,000 and 499,999 square feet of exhibit space. Less than 40 venues offer more then 500,000 square feet of exhibit space (including the Metro Toronto Convention Centre).
Square Feet of Exhibit Space
15%
32%45%
8%
25,000 to 49,999 50,000 to 99,999100,000 to 499,999 Over 500,000
Source: Tradeshow Week

24
4. SupplyExhibit Space within Convention Centres
0
10
20
30
40
50
60
70
80
90
SF(000,000's)
2003 2004 2005 2006 2007
Year
Convention Centres Other VenuesSource: Tradeshow Week
Convention centres, for the purposes of this study defined as venues with a ratio of exhibit space to meeting/ballroom space of 4:1 or less, account for approximately 25% of the total exhibit space inventory in Canada and the United States. The remainder of the exhibit space is located in purpose-built trade centres or in hotels with meeting space.
25
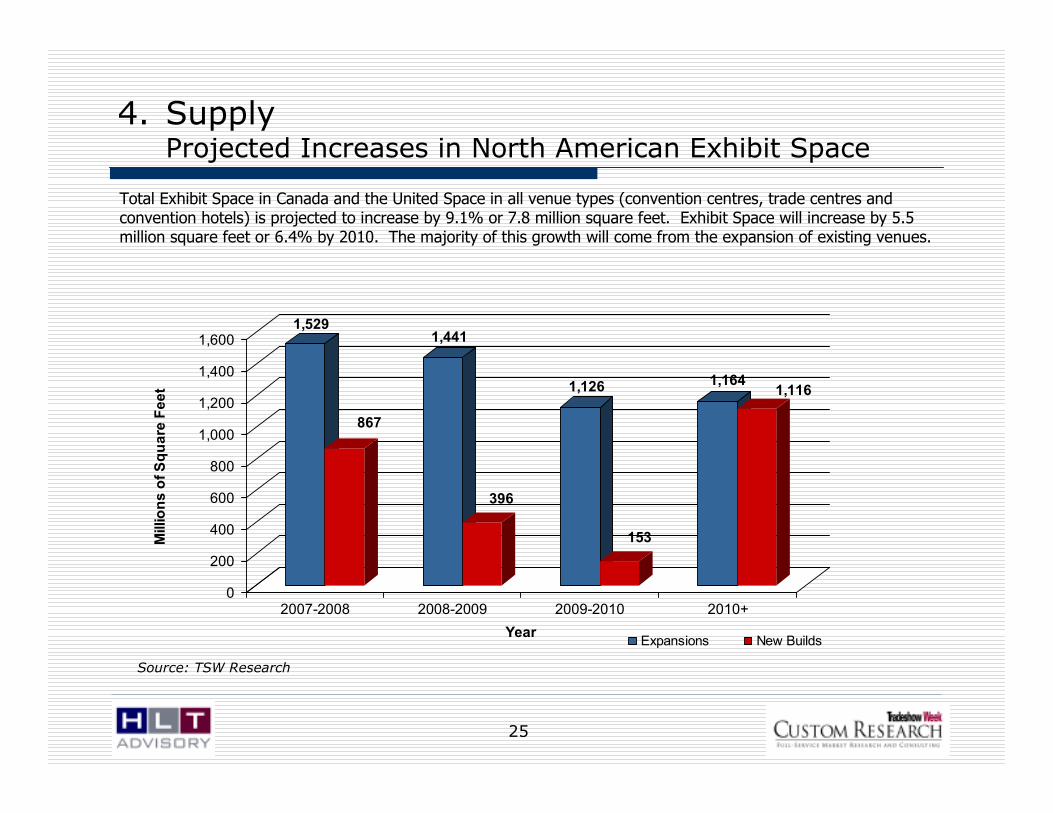
Total Exhibit Space in Canada and the United Space in all venue types (convention centres, trade centres and convention hotels) is projected to increase by 9.1% or 7.8 million square feet. Exhibit Space will increase by 5.5 million square feet or 6.4% by 2010. The majority of this growth will come from the expansion of existing venues.
4. SupplyProjected Increases in North American Exhibit Space
1,529
867
1,441
396
1,126
153
1,1641,116
0
200
400
600
800
1,000
1,200
1,400
1,600
Millions of Square Feet
2007-2008 2008-2009 2009-2010 2010+
YearExpansions New Builds
Source: TSW Research
26
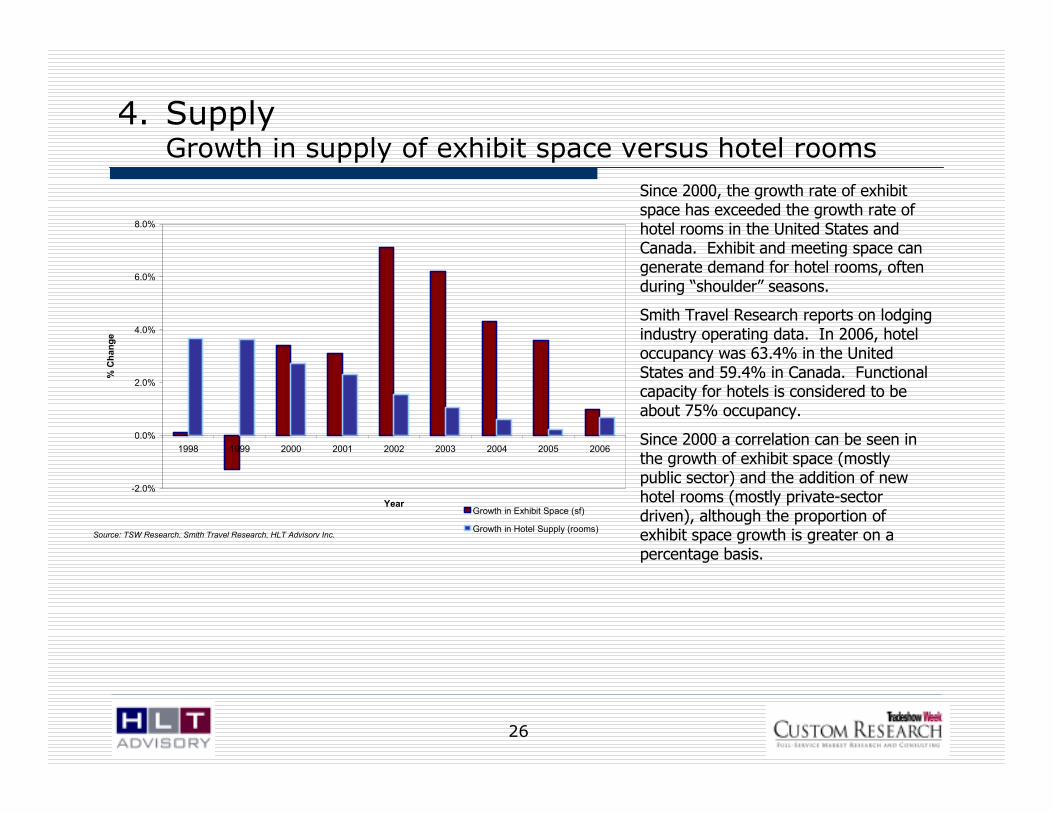
Since 2000, the growth rate of exhibit space has exceeded the growth rate of hotel rooms in the United States and Canada. Exhibit and meeting space can generate demand for hotel rooms, often during “shoulder” seasons.
Smith Travel Research reports on lodging industry operating data. In 2006, hotel occupancy was 63.4% in the United States and 59.4% in Canada. Functional capacity for hotels is considered to be about 75% occupancy.
Since 2000 a correlation can be seen in the growth of exhibit space (mostly public sector) and the addition of new hotel rooms (mostly private-sector driven), although the proportion of exhibit space growth is greater on a percentage basis.
4. SupplyGrowth in supply of exhibit space versus hotel rooms
-2.0%
0.0%
2.0%
4.0%
6.0%
8.0%
1998 1999 2000 2001 2002 2003 2004 2005 2006
Year
% Change
Growth in Exhibit Space (sf)
Growth in Hotel Supply (rooms)Source: TSW Research, Smith Travel Research, HLT Advisory Inc.

27
4. SupplyGrowth in Hotel Demand versus Exhibition Attendance
-8.0%
-6.0%
-4.0%
-2.0%
0.0%
2.0%
4.0%
6.0%
8.0%
1998 1999 2000 2001 2002 2003 2004 2005 2006
Year
% Change
Change in Convention & Exhibition Attendance
Change in Hotel DemandSource: TSW Research, Smith Travel Research, HLT Advisory Inc.
A similar correlation appears to exist between growth patterns in hotel demand and exhibition attendance.
28
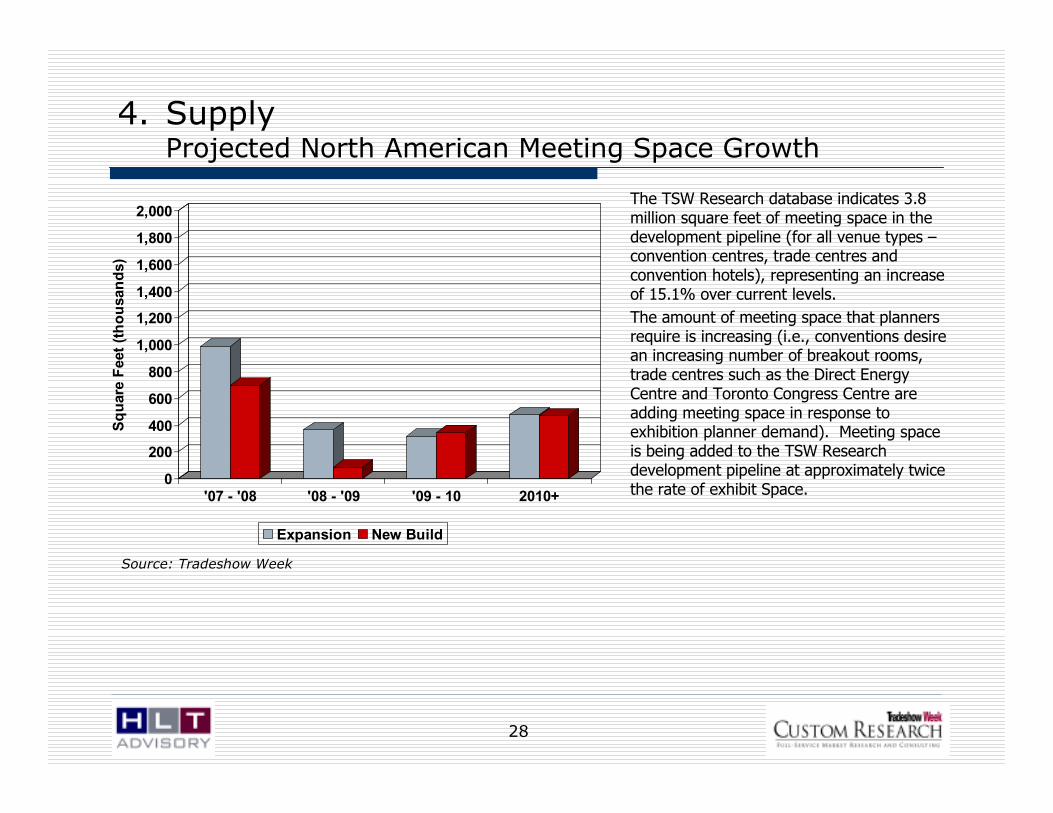
The TSW Research database indicates 3.8 million square feet of meeting space in the development pipeline (for all venue types –convention centres, trade centres and convention hotels), representing an increase of 15.1% over current levels.
The amount of meeting space that planners require is increasing (i.e., conventions desire an increasing number of breakout rooms, trade centres such as the Direct Energy Centre and Toronto Congress Centre are adding meeting space in response to exhibition planner demand). Meeting space is being added to the TSW Research development pipeline at approximately twice the rate of exhibit Space.
4. SupplyProjected North American Meeting Space Growth
Source: Tradeshow Week
0
200
400
600
800
1,000
1,200
1,400
1,600
1,800
2,000
Square Feet (thousands)
'07 - '08 '08 - '09 '09 - 10 2010+
Expansion New Build

29
4. SupplyInventory of Major Canadian Convention Centres
Upon completion of its expansion in 2009, the Vancouver Convention and Exhibition Centre will be the second largest convention centre in Canada with over 418,000 square feet of exhibit, meeting and ballroom space.
The table below summarizes the members of the Convention Centres of Canada, an industry association representing the largest fifteen publicly-owned convention centres in Canada.
Venue
Exhibit Space
(sf)
Meeting/
Ballroom
Space (sf)
Total Exhibit/
Meeting/ Ballroom
Space (sf)
Exhibit Space to
Meeting/Ballroom
Space
Downtown
Hotel Rooms
Ratio of Total
Space to
Hotel Rooms
Metro Toronto Convention Centre 453,648 122,227 575,875 3.7 16,616 34.7
Palais des Congrés de Montréal 199,052 130,730 329,782 1.5 14,044 23.5
Québec City Convention Centre 75,000 94,500 169,500 0.8 3,922 43.2
Shaw Conference Centre 105,000 37,700 142,700 2.8 4,682 30.5
Winnipeg Convention Centre 78,000 59,218 137,218 1.3 4,199 32.7
Vancouver Convention & Exhibition Centre 91,205 41,469 132,674 2.2 14,849 8.9
Calgary TELUS Convention Centre 47,047 42,140 89,187 1.1 9,935 9.0
Ottawa Congress Centre 54,113 14,941 69,054 3.6 7,026 9.8
Hamilton Convention Centre 19,662 32,652 52,314 0.6 1,331 39.3
World Trade and Convention Centre 20,000 30,000 50,000 0.7 2,671 18.7
London Convention Centre - 43,357 43,357 n/a 1,355 32.0
Penticton Trade & Convention Centre 13,590 21,054 34,644 0.6 1,651 21.0
TELUS Whistler Conference Centre - 27,470 27,470 n/a 5,936 4.6
Victoria Conference Centre 14,190 9,210 23,400 1.5 5,961 3.9
Prince George Civic Centre 18,000 4,800 22,800 3.8 1,621 14.1Source: HLT Advisory Inc, convention centres
30
4. SupplyInventory of Major Ontario Convention / Trade Centres
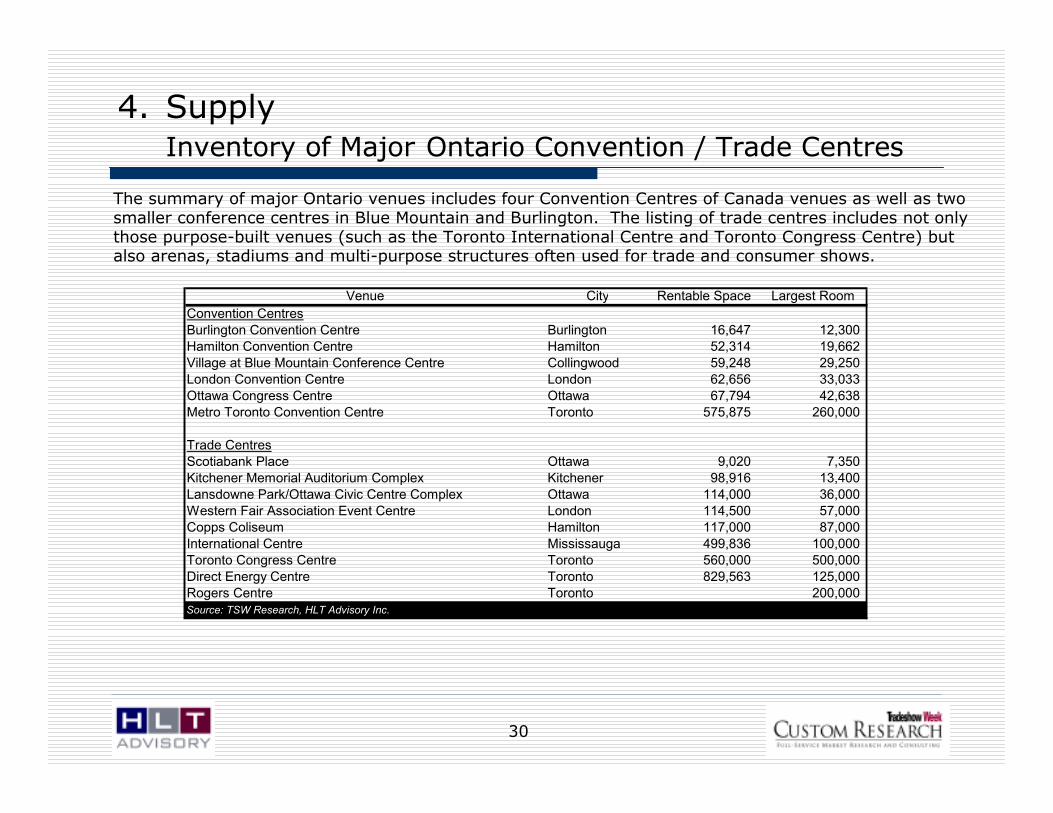
The summary of major Ontario venues includes four Convention Centres of Canada venues as well as two smaller conference centres in Blue Mountain and Burlington. The listing of trade centres includes not only those purpose-built venues (such as the Toronto International Centre and Toronto Congress Centre) but also arenas, stadiums and multi-purpose structures often used for trade and consumer shows.
Venue City Rentable Space Largest Room
Convention Centres
Burlington Convention Centre Burlington 16,647 12,300
Hamilton Convention Centre Hamilton 52,314 19,662
Village at Blue Mountain Conference Centre Collingwood 59,248 29,250
London Convention Centre London 62,656 33,033
Ottawa Congress Centre Ottawa 67,794 42,638
Metro Toronto Convention Centre Toronto 575,875 260,000
Trade Centres
Scotiabank Place Ottawa 9,020 7,350
Kitchener Memorial Auditorium Complex Kitchener 98,916 13,400
Lansdowne Park/Ottawa Civic Centre Complex Ottawa 114,000 36,000
Western Fair Association Event Centre London 114,500 57,000
Copps Coliseum Hamilton 117,000 87,000
International Centre Mississauga 499,836 100,000
Toronto Congress Centre Toronto 560,000 500,000
Direct Energy Centre Toronto 829,563 125,000
Rogers Centre Toronto 200,000 Source: TSW Research, HLT Advisory Inc.
31
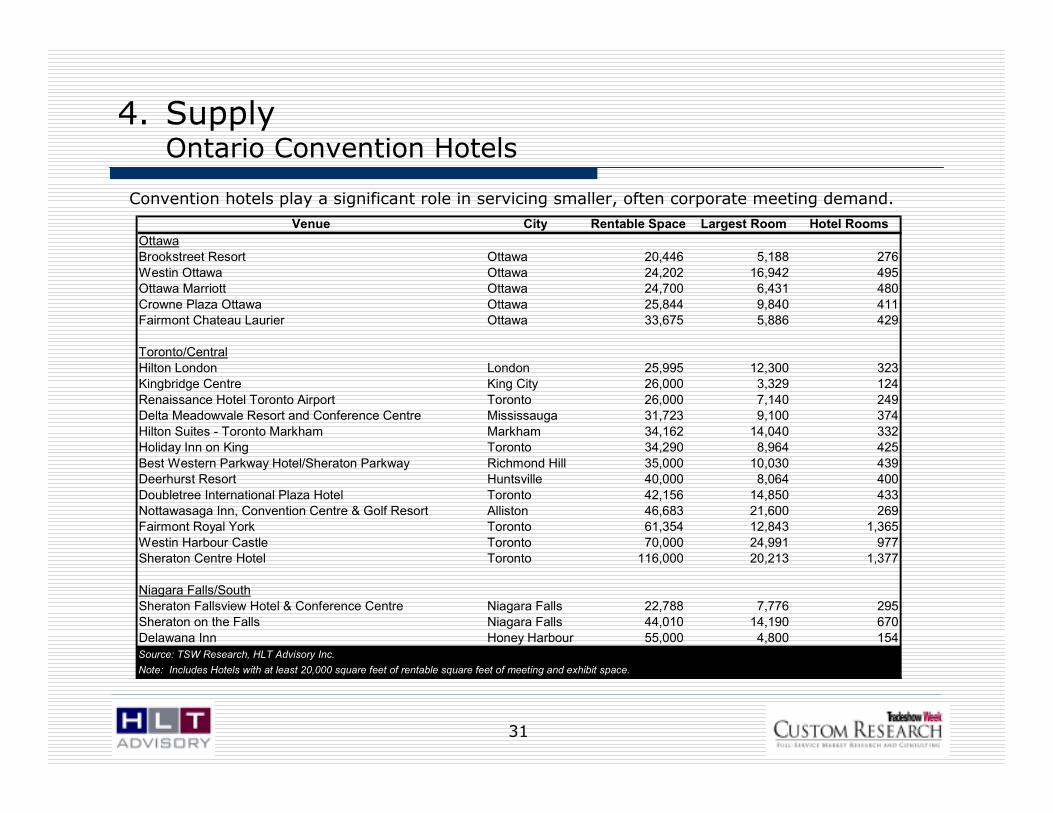
4. SupplyOntario Convention Hotels
Convention hotels play a significant role in servicing smaller, often corporate meeting demand.
Venue City Rentable Space Largest Room Hotel Rooms
OttawaBrookstreet Resort Ottawa 20,446 5,188 276
Westin Ottawa Ottawa 24,202 16,942 495Ottawa Marriott Ottawa 24,700 6,431 480
Crowne Plaza Ottawa Ottawa 25,844 9,840 411Fairmont Chateau Laurier Ottawa 33,675 5,886 429
Toronto/Central
Hilton London London 25,995 12,300 323Kingbridge Centre King City 26,000 3,329 124
Renaissance Hotel Toronto Airport Toronto 26,000 7,140 249Delta Meadowvale Resort and Conference Centre Mississauga 31,723 9,100 374
Hilton Suites - Toronto Markham Markham 34,162 14,040 332Holiday Inn on King Toronto 34,290 8,964 425
Best Western Parkway Hotel/Sheraton Parkway Richmond Hill 35,000 10,030 439Deerhurst Resort Huntsville 40,000 8,064 400
Doubletree International Plaza Hotel Toronto 42,156 14,850 433Nottawasaga Inn, Convention Centre & Golf Resort Alliston 46,683 21,600 269Fairmont Royal York Toronto 61,354 12,843 1,365
Westin Harbour Castle Toronto 70,000 24,991 977Sheraton Centre Hotel Toronto 116,000 20,213 1,377
Niagara Falls/South
Sheraton Fallsview Hotel & Conference Centre Niagara Falls 22,788 7,776 295Sheraton on the Falls Niagara Falls 44,010 14,190 670
Delawana Inn Honey Harbour 55,000 4,800 154
Note: Includes Hotels with at least 20,000 square feet of rentable square feet of meeting and exhibit space.
Source: TSW Research, HLT Advisory Inc.

32
4. SupplyNew and Proposed Canadian Public-Assembly Venues
Several existing venues are undergoing expansion while several other destinations have proposed to develop convention or trade show venues. The lead time from planning to construction to opening can be substantial, particularly with publicly-funded venues, given the need for political approval. As an example, demand studies verified a need to expand the Vancouver Convention and Exhibition Centre as early as 1994 but construction did not commence until 2003 with opening expected in 2009.
Venue City Completion Exhibit Space Meeting/Ballroom Other Total Space
Under Construction
Vancouver Island Conference Centre Nanaimo 2008 0 19,597 9,054 28,651
Victoria Conference Centre Crystal Garden (Expansion) Victoria 2008 0 25,000 0 25,000Toronto International Centre Toronto 2008 0 23,000 0 23,000
Casino Windsor Windsor 2008 39,500 34,299 4,208 78,007
Toronto Congress Centre Toronto 2008 300,000 0 0 300,000
Vancouver Convention and Exhibition Centre (Expansion) Vancouver 2009 222,860 114,091 127,000 463,951
Proposed
Barrie Waterfront Barrie TBD
Calgary TELUS Convention Centre (Expansion) Calgary TBD
Charlottetown Charlottetown TBDShaw Convention Centre Edmonton TBD
Moncton Moncton TBD
Niagara Falls Convention Centre Niagara Falls 2011 100,000 30,700 0 130,700
Ottawa Congress Centre (Expansion) Ottawa 2011 64,993 83,744 51,344 200,081Saint John Saint John TBD
Toronto Congress Centre - Phase II Expansion Toronto TBD 0 25,000 0 25,000
Toronto Congress Centre - Phase III Expansion Toronto TBD
Winnipeg Convention Centre Winnipeg TBDYork Region York Region TBD Tourism needs Assessment underway
Source: HLT Advisory Inc.
20,000 to 25,000 square feet - under study
Market assessment underway
Market assessment underway
150 residential/120 hotel units, 12,000 square feet
20,000 to 25,000 square feet - under study
Additional exhibit space
Market assessment underway
Market assessment underway

33
4. SupplyPrivate-Sector Involvement in Venue Development
Demand for local and regional meetings, trade shows and consumer shows is often identified and serviced by the private sector. In addition to the Toronto International Centre and Toronto Congress Centre, the two largest privately-owned venues in Ontario, several smaller venues have been created over the past decade to service local/regional demand such as:
• Oakville Conference Centre—A privately-owned conference centre with over 10,000 sq. ft. of exhibit space.
• Burlington Convention Centre—A 16,600 sq. ft. centre including 12,300 sq. ft. of exhibit space and 1,500 sq. ft. of meeting space. This venue targets the Oakville/Burlington/ Hamilton corporate market for business and social events.
• Paradise Banquet and Convention Centre—A conference centre/banquet hall with 50,000 square feet of rentable space. Facilities similar to Paradise Banquet and Convention Centre, although smaller, operate in various forms in a great many centres across Ontario.
Virtually none of the events hosted in these venues generate economic impact beyond the host community, nor is there such an expectation. Local and regional business is easier to identify, target and service; support from the destination marketing organization is not required nor is coordination among local hotels as the majority of events are “same-day” or, even if multiple days, are focused on attendees within easy driving distance. As the private sector enters this marketplace, smaller events may be drawn away from publicly-owned venues. While private sector investment in and operation of smaller-scale, public-assembly venues should be viewed as a positive sign of a strong tourism/hospitality industry, there will be some negative impact on the revenue- (and profit-) generating ability of the public venues. Arguably, this allows the public venues more resources to focus on economic impact-generating events by freeing up time and resources, but will also affect profitability. A factor the public shareholder must recognize and take into account when evaluating performance.
34
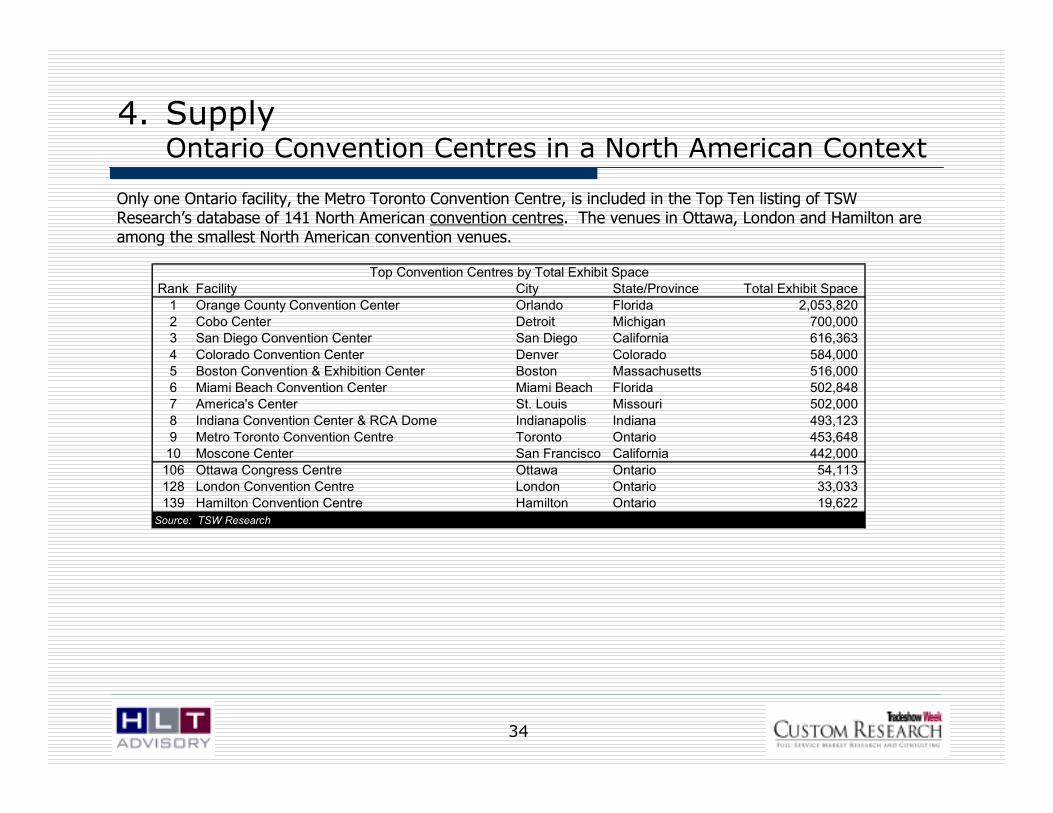
Only one Ontario facility, the Metro Toronto Convention Centre, is included in the Top Ten listing of TSW Research’s database of 141 North American convention centres. The venues in Ottawa, London and Hamilton are among the smallest North American convention venues.
4. SupplyOntario Convention Centres in a North American Context
Rank Facility City State/Province Total Exhibit Space
1 Orange County Convention Center Orlando Florida 2,053,820 2 Cobo Center Detroit Michigan 700,000 3 San Diego Convention Center San Diego California 616,363
4 Colorado Convention Center Denver Colorado 584,000 5 Boston Convention & Exhibition Center Boston Massachusetts 516,000 6 Miami Beach Convention Center Miami Beach Florida 502,848 7 America's Center St. Louis Missouri 502,000
8 Indiana Convention Center & RCA Dome Indianapolis Indiana 493,123 9 Metro Toronto Convention Centre Toronto Ontario 453,648 10 Moscone Center San Francisco California 442,000
106 Ottawa Congress Centre Ottawa Ontario 54,113 128 London Convention Centre London Ontario 33,033 139 Hamilton Convention Centre Hamilton Ontario 19,622
Source: TSW Research
Top Convention Centres by Total Exhibit Space

35
Eight Ontario trade centres are included in TSW Research’s database of the top 160 trade centres, based on total exhibit space.
4. SupplyOntario Trade Centres in a North American Context
Rank Facility City State/Province Total Exhibit Space
1 McCormick Place Chicago Illinois 2,200,000
2 Las Vegas Convention Center Las Vegas Nevada 1,940,631
3 Georgia World Congress Center Atlanta Georgia 1,370,000
4 Ernest N. Morial Convention Center - New Orleans New Orleans Louisiana 1,100,000
5 Kentucky Exposition Center Louisville Kentucky 1,035,000
6 Dallas Convention Center Dallas Texas 1,019,142
7 Pennsylvania Farm Show Complex & Expo Center Harrisburg Pennsylvania 1,000,000
8 George R. Brown Convention Center Houston Texas 930,000
9 International Exposition Center (I-X Center) Cleveland Ohio 902,000
10 Donald E. Stephens Convention Center Rosemont Illinois 845,000
16 Direct Energy Centre Toronto Ontario 804,563
22 Toronto Congress Centre Toronto Ontario 500,000
26 International Centre, Toronto Toronto Ontario 471,000
77 Rogers Centre Toronto Ontario 200,000
119 Copps Coliseum Hamilton Ontario 117,000
120 Lansdowne Park/Ottawa Civic Centre Complex Ottawa Ontario 111,000
130 Western Fair Association Event Center London Ontario 109,500
161 Kitchener Memorial Auditorium Complex Kitchener Ontario 13,400
Top Trade Centres by Total Exhibit Space
Source: TSW Research

36
4. SupplyDevelopment/Design Characteristics
During the rapid growth cycle of the 1980s, convention centres in North America were constructed with banquet and meeting spaces equalling 15% to 20% of the exhibit space. As convention centres expanded, industry needs pushed meeting and ballroom space to increase as a percentage of total rentable space. As the industry evolved over the last decade, the combined meeting space and ballroom space grew upwards of 40% of the total rentable space. This spatial relationship tends to hold true for convention venues of up to 600,000 square feet (i.e., larger than any venue in Canada). The buildings that adapted best to their markets have “fixed” the spatial relationships over time, increasing the proportion of meeting space to meet demand.
The Table below compares the rentable space at current Ontario convention venues to the proposed facility programs at the expanded Ottawa Congress Centre and the Niagara Falls Convention Centre. While the proposed total rentable space at these two venues is similar, the ratio of exhibit space to meeting space is quite different.
Note: Halls “F” and “G” of the Metro Toronto Convention Centre exhibit hall (about 50,000 sq. ft. are finished at “hotel quality” standard and are frequently used as ballroom and plenary meeting space), bringing total meeting/ballroom space at the MTCC up to about 30% of the exhibit space.
Hamilton
Convention
Centre
London
Convention
Centre
Ottawa Congress
Centre
Metro Toronto
Convention
Centre
Expanded Ottawa
Congress Centre*
Niagara Falls
Convention
Centre
Exhibit Space 19,662 0 54,113 453,648 64,993 100,000Meeting/Ballroom Space 32,652 43,357 14,941 122,227 83,744 30,700Other Rentable Space 0 2,703 23,683 260,000 51,344 n/a
Total 52,314 46,060 92,737 835,875 200,081 130,700
Source: HLT Advisory Inc., PKF Consulting "Niagara Falls Convention Centre Study Update", October 2004
Rentable Space at Current and Proposed Ontario Convention Venues
37
The growth in exhibition space and meeting space in North America over the past several years has been significant. Further, the development pipeline suggests that strong supply growth will continue over the short- to mid-term. Key implications for Ontario based on a review of North American supply trends include:
• Growth in the supply of exhibit space in North America has outpaced the growth in supply of hotel rooms since 2000, suggesting the private sector (responsible for most hotel development) is more cautious than public-sector proponents of public-assembly venues.
• An analysis of the largest convention centres and trade centres in North America in terms of total exhibit space indicates that Toronto is the only Ontario destination currently positioned to compete with the leading North American destinations.
• Canada appears to be experiencing growth in public-assembly supply with increases underway or planned in a variety of public- and private-sector venues offering a range of exhibit, meeting and ballroom space. Construction is underway on the expansion of six Canadian venues, including two privately-owned trade centres in Toronto. Twelve Canadian new-build venues and expansion projects are in the pipeline.
• The private sector involvement in the development of venues, while focused on regional and local markets, continues in markets with strong local economies.
Venue design is also evolving, reflecting user needs, resulting in much greater emphasis on flexible meeting and assembly space, at the expense of exhibit area…in all but the largest trade/exhibit halls.
4. SupplyImplications for Ontario
38
5. DemandIntroduction
No one source tracks all events that utilize the various public-assembly venues under study in this analysis. However, a number of organizations track data that provide insight into the scope of the market potential, including:
• TSW Research’s database of Canadian and United States Trade Shows includes 3,871 events, each of which more than 5,000 square feet of exhibit space. Of these events, 416 or 10.7% are held in Canada.
• The Destination Marketing Association International (“DMAI”) has a database of over 18,000 organizations (associations, corporations and government groups) that hold about 37,000 meetings annually. In 2006, 71 of these organizations held 75 meetings in Canada.
• The Meeting Database Institute has a database of over 30,000 annual meetings ranging in size from two people to over 10,000. Approximately 60% of these meetings are held by corporate groups and 40% are held by associations. The database contains limited profiles of meetings held in Canada. However, the database includes 1,616 meetings which have met in Canada in the past.
• Meetings & Convention Magazine (“M&C”) estimates the United States meetings market biennially. In the2006 report (2005 data), M&C estimated 1,243,600 meetings occurred with an overall attendance of 136.5 million generating total expenditures of US$107.2 billion. A third of the 736 respondents to the M&C survey indicated interest in holding a meeting outside the United States. In 2005, Europe was the most popular international destination with 37% of meeting planners booking international meetings holding meetings there. Europe was followed by the Caribbean (36%) and Canada and Mexico (each with 25%).
• The International Congress and Convention Association (“ICCA”) tracks international associations that meet regularly and rotate between a minimum of three countries. In 2006, ICCA’s database of
international association meetings included 5,838 events.
These sources have been used to provide a broad picture of demand for Ontario public-assembly venues.
39
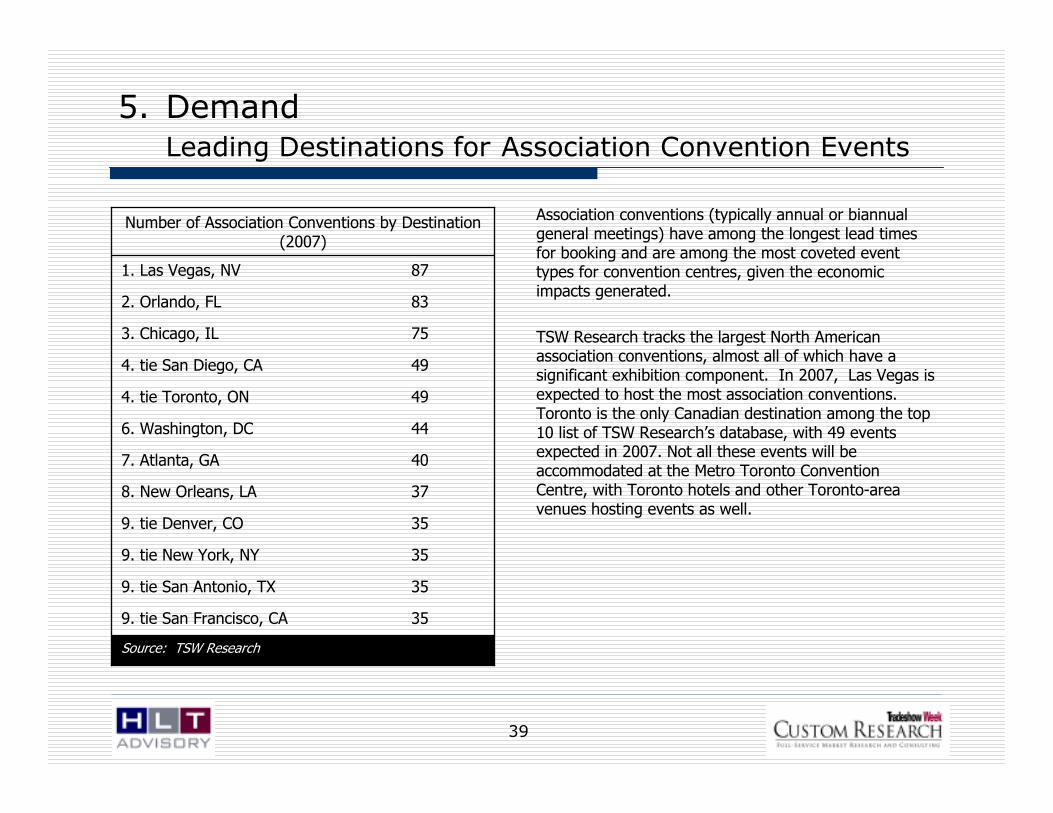
Association conventions (typically annual or biannual general meetings) have among the longest lead times for booking and are among the most coveted event types for convention centres, given the economic impacts generated.
TSW Research tracks the largest North American association conventions, almost all of which have a significant exhibition component. In 2007, Las Vegas is expected to host the most association conventions. Toronto is the only Canadian destination among the top 10 list of TSW Research’s database, with 49 events expected in 2007. Not all these events will be accommodated at the Metro Toronto Convention Centre, with Toronto hotels and other Toronto-area venues hosting events as well.
Source: TSW Research
359. tie San Francisco, CA
359. tie San Antonio, TX
359. tie New York, NY
359. tie Denver, CO
378. New Orleans, LA
407. Atlanta, GA
446. Washington, DC
494. tie Toronto, ON
494. tie San Diego, CA
753. Chicago, IL
832. Orlando, FL
871. Las Vegas, NV
Number of Association Conventions by Destination (2007)
5. DemandLeading Destinations for Association Convention Events

40
Of the entire TSW Research database of over 5,036 events using at least 5,000 square feet of exhibit space, Las Vegas is expected to lead all other North American destinations in 2007 with 250 events, or 5.0% of the total events.
The only Canadian destination represented in the top ten is Toronto with 136 events or 2.7% of the total Canadian and United States events.
Top 10 Destinations for all Convention and Trade Show Events (2007)
Source: TSW Research
San Diego8110
Dallas848
Washington848
Boston917
Orlando1006
Atlanta1125
Toronto1364
New York1453
Chicago1502
Las Vegas2501
CityEventsRank
5. DemandTop Host Cities for all Conventions and Exhibition Events
41
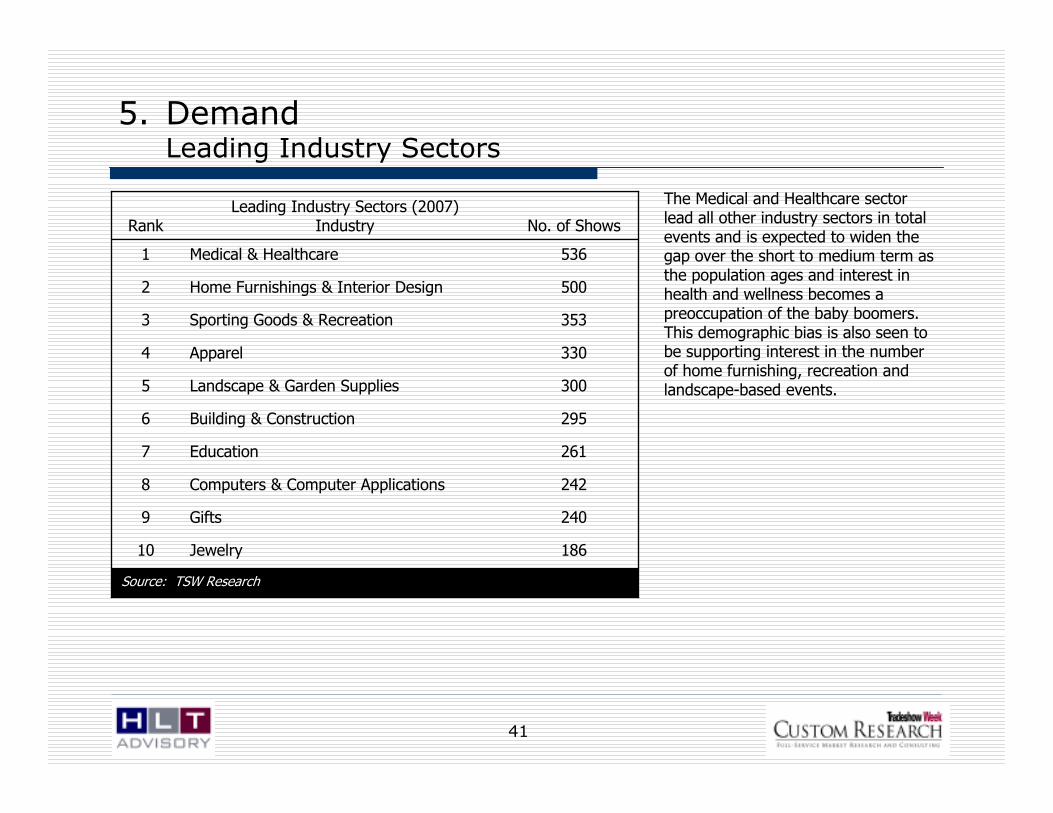
5. DemandLeading Industry Sectors
The Medical and Healthcare sector lead all other industry sectors in total events and is expected to widen the gap over the short to medium term as the population ages and interest in health and wellness becomes a preoccupation of the baby boomers. This demographic bias is also seen to be supporting interest in the number of home furnishing, recreation and landscape-based events.
Source: TSW Research
186Jewelry10
240Gifts9
242Computers & Computer Applications8
261Education7
295Building & Construction6
300Landscape & Garden Supplies5
330Apparel4
353Sporting Goods & Recreation3
500Home Furnishings & Interior Design2
536Medical & Healthcare1
No. of ShowsLeading Industry Sectors (2007)
IndustryRank

42
TSW Research surveyed event producers to determine the key factors used when selecting a host city for their event. Three of the five top factors were hotel related:
• Hotel room price/quality
• Number of hotel rooms, capacity
• Hotel block attrition clauses and issues
Finding open dates is the second most important criteria for show producers when selecting a venue and reflects the attractiveness of established destinations (“everyone wants the same dates”). Often, excess demand exists for high-season dates (high season may vary by destination, venue and event type).
5. DemandDestination Selection Criteria
Hotel Room Price/Quality 63%Finding Open Dates 49%Labour Costs and Service Issues 46%
Number of Hotel Rooms, Capacity 44%Hotel Block Attrition Clauses and Issues 41%Regional Professional Demographics 33%Quality of Area Near the Venue/Headquarter Hotel 33%CVB/City Government Marketing Efforts and Support 28%
Airport Capacity 25%Parking Capacity 23%Restaurants - Quality, Reputation, etc. 22%Safety Issues/Low Crime, etc. 19%Road and Highway Access 19%
Cultural Amenities, Nightlife 19%Technology Service Costs and Service Issues 14%Regional Consumer Demographics 13%Public Transportation Access 13%Total Population 12%
Health of City/Regional Economy 10%Golf Courses and Other Sporting Opportunities 10%Family-Oriented Activities Nearby/In City 10%Gambling/Gaming Nearby 5%Space for Outdoor Exhibits and Tents 4%
Amusement Parks Nearby 2%Professional Sports in City/Nearby 1%Other 11%Source: TSW Research

43
Similar to destination selection criteria, price or cost is the most important criteria for show producers when selecting a venue. Other criteria related to cost includes labour cost, exhibit space rental rates, food & beverage costs and technology & telecom costs.
Appropriate meeting and exhibit space is also important to show producers.
5. DemandVenue Selection Criteria
Costs 77%
Meeting Space Size and Quality 66%
Open Dates 66%
Exhibit Space Size and Quality 65%
Number of Hotel Rooms Nearby 62%
Exhibit Space Rental Rates 53%
Labour Costs and Service Issues 53%
Exhibit Space Configurations 51%
Food and Beverage Quality and Costs 35%
Parking Capacity 27%
Exclusive Contracts 25%
Expansion/Renovation/Construction Issues 23%
Quality of Area Near the Venue 23%
Technology/Telecom Service and Cost Issues 17%
Venue Staff Customer Service 17%
Public Transpiration Access 12%
Road Access Information 8%
Signage Issues 6%
Space for Outdoor Exhibits and Tents 6%
Other 6%Source: TSW Research
44
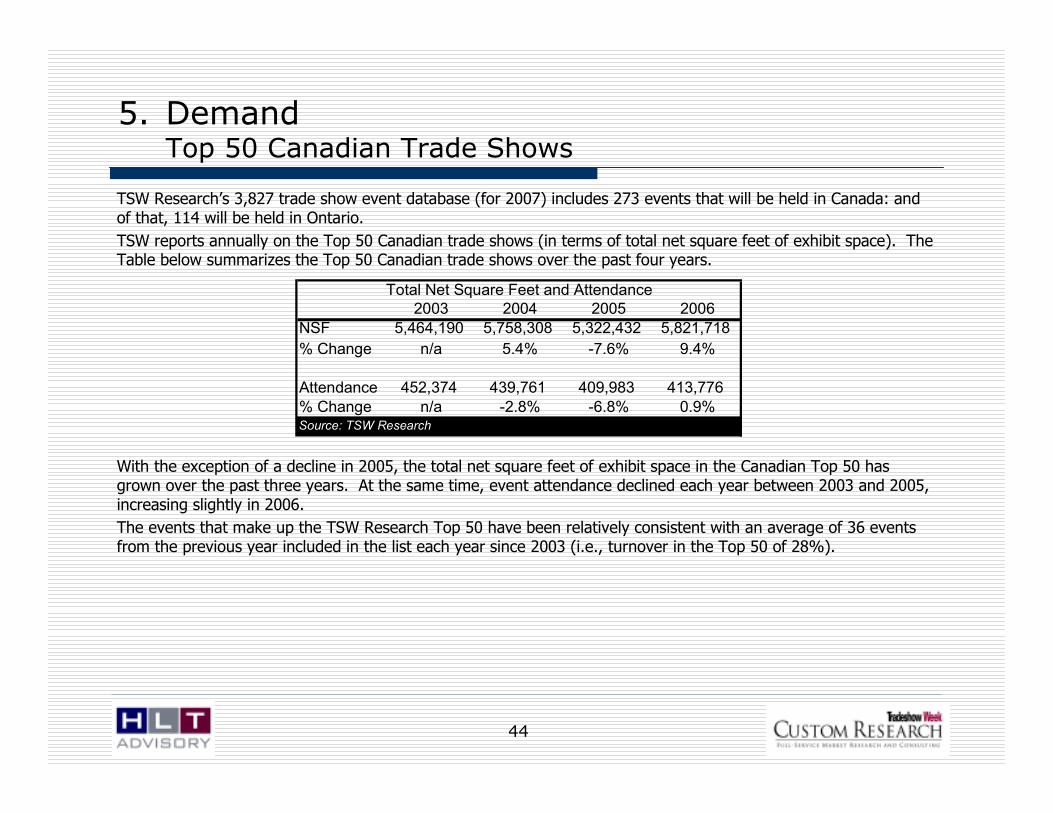
TSW Research’s 3,827 trade show event database (for 2007) includes 273 events that will be held in Canada: and of that, 114 will be held in Ontario.
TSW reports annually on the Top 50 Canadian trade shows (in terms of total net square feet of exhibit space). The Table below summarizes the Top 50 Canadian trade shows over the past four years.
With the exception of a decline in 2005, the total net square feet of exhibit space in the Canadian Top 50 has grown over the past three years. At the same time, event attendance declined each year between 2003 and 2005, increasing slightly in 2006.
The events that make up the TSW Research Top 50 have been relatively consistent with an average of 36 events from the previous year included in the list each year since 2003 (i.e., turnover in the Top 50 of 28%).
5. DemandTop 50 Canadian Trade Shows
2003 2004 2005 2006
NSF 5,464,190 5,758,308 5,322,432 5,821,718
% Change n/a 5.4% -7.6% 9.4%
Attendance 452,374 439,761 409,983 413,776
% Change n/a -2.8% -6.8% 0.9%
Total Net Square Feet and Attendance
Source: TSW Research
45
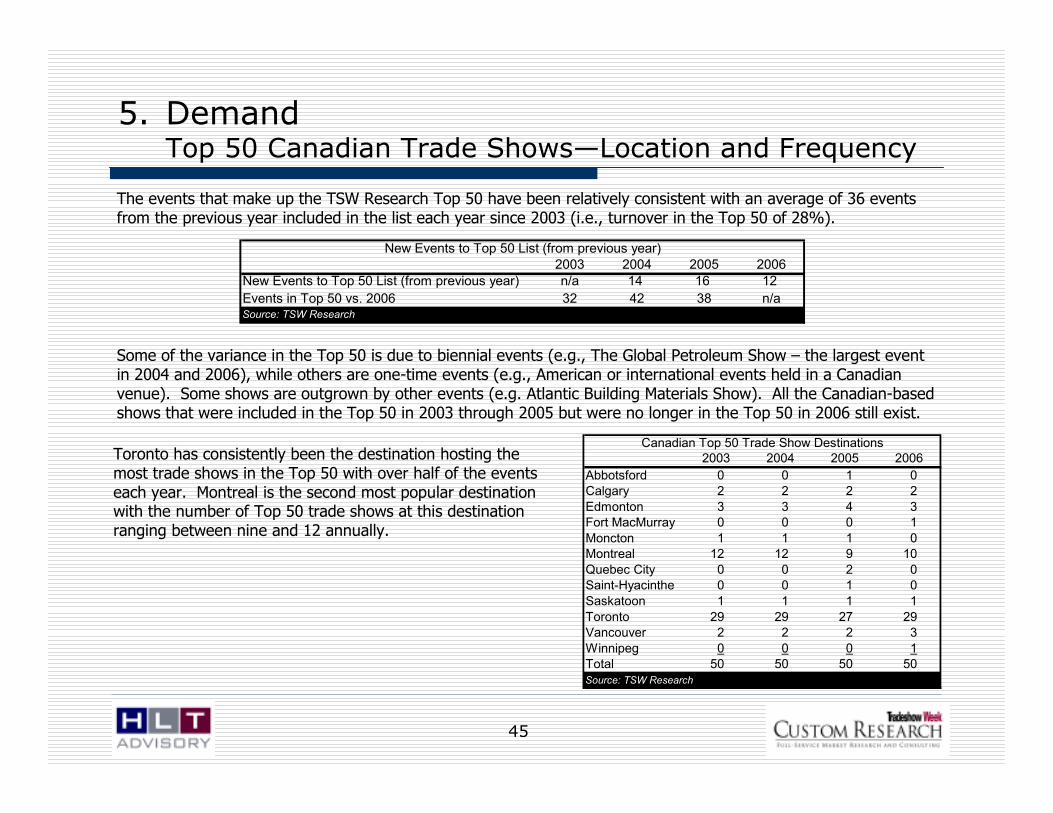
5. DemandTop 50 Canadian Trade Shows—Location and Frequency
The events that make up the TSW Research Top 50 have been relatively consistent with an average of 36 events from the previous year included in the list each year since 2003 (i.e., turnover in the Top 50 of 28%).
Some of the variance in the Top 50 is due to biennial events (e.g., The Global Petroleum Show – the largest event in 2004 and 2006), while others are one-time events (e.g., American or international events held in a Canadian venue). Some shows are outgrown by other events (e.g. Atlantic Building Materials Show). All the Canadian-based shows that were included in the Top 50 in 2003 through 2005 but were no longer in the Top 50 in 2006 still exist.
2003 2004 2005 2006
New Events to Top 50 List (from previous year) n/a 14 16 12
Events in Top 50 vs. 2006 32 42 38 n/a
New Events to Top 50 List (from previous year)
Source: TSW Research
Toronto has consistently been the destination hosting the most trade shows in the Top 50 with over half of the events each year. Montreal is the second most popular destination with the number of Top 50 trade shows at this destination ranging between nine and 12 annually.
2003 2004 2005 2006
Abbotsford 0 0 1 0Calgary 2 2 2 2
Edmonton 3 3 4 3Fort MacMurray 0 0 0 1
Moncton 1 1 1 0Montreal 12 12 9 10
Quebec City 0 0 2 0Saint-Hyacinthe 0 0 1 0
Saskatoon 1 1 1 1
Toronto 29 29 27 29Vancouver 2 2 2 3
Winnipeg 0 0 0 1Total 50 50 50 50Source: TSW Research
Canadian Top 50 Trade Show Destinations

46
An analysis of the industry breakdown of the Top 50 Canadian Trade Shows is provided in the Table to the left. As shown, the industry breakdown has been relatively consistent. Of note:
• Gifts industry trade shows in the Top 50 have declined from eight in 2003 and 2004 to six in 2006
• Medical and Healthcare industry trade shows increased from none in 2003 and 2004 to three in 2006.
5. DemandTop 50 Canadian Trade Shows—By Sector
2003 2004 2005 2006
Advertising & Marketing 0 0 2 2Agriculture & Farming 4 4 4 4
Air-Conditioning Heating & Refrigeration 0 1 0 1Apparel 3 3 3 3Automotive & Trucking 1 3 1 3
Beauty & Hair Care 3 3 3 3Building & Construction 3 3 3 3China & Glassware 2 2 2 2Communications 0 1 0 0Dental 1 1 0 0Electrical & Electronics 0 1 0 1Food & Beverage 6 5 5 5Gifts 8 8 7 6Home Furnishings & Interior Design 1 1 2 2Industrial 3 4 1 3Libraries 1 0 1 0Manufacturing 2 0 2 1Medical & Health Care 0 0 1 3Mining 1 2 2 1Office Equipment 1 1 1 1Packaging 1 0 1 0Paper 1 1 1 1Petroleum, Oil & Gas 1 1 2 1Printing 1 0 1 0Real Estate 1 1 1 1Sanitation and Waste Management 1 1 0 0Sporting Goods & Recreation 4 3 4 3Total 50 50 50 50
Top 50 Canadian TradeshowsNumber of Events by Industry

47
In 2007, 273 trade show events with at least 5,000 square feet of exhibit space were held in Canada. This represents 5.4% of the total United States and Canadian events in the TSW Research database. Of these 273 events, 114 or 41.8% were held in Ontario. Ontario also generates 41.0% of the total Canadian net square feet of Exhibit Space, 44.1% of the exhibiting companies and 30.6% of the attendance. The majority of these events were held in Toronto.
5. DemandTrade Shows Held in Canada – 2007
Rank City Events Share
Net Square
Feet Share
Exhibiting
Companies Share Attendance Share
1 Toronto 95 34.8% 6,574,400 35.4% 23,052 38.8% 586,550 25.9%
2 Montreal 39 14.3% 2,586,092 13.9% 8,717 14.7% 397,550 17.5%
3 Calgary 26 9.5% 1,562,500 8.4% 4,945 8.3% 113,400 5.0%
4 Vancouver 25 9.2% 1,597,800 8.6% 5,070 8.5% 116,900 5.2%
5 Edmonton 16 5.9% 1,235,300 6.7% 4,342 7.3% 413,900 18.3%
6 Quebec City 8 2.9% 480,000 2.6% 1,430 2.4% 32,800 1.4%
7 Ottawa 7 2.6% 403,050 2.2% 1,300 2.2% 40,400 1.8%
8 Winnipeg 6 2.2% 403,050 2.2% 1,060 1.8% 47,300 2.1%
9 Regina 5 1.8% 1,140,000 6.1% 1,330 2.2% 193,100 8.5%
10 Halifax 5 1.8% 300,000 1.6% 720 1.2% 15,400 0.7%
13 London 4 1.5% 240,000 1.3% 760 1.3% 17,600 0.8%
16 Hamilton 3 1.1% 180,000 1.0% 430 0.7% 24,900 1.1%
20 Sudbury 2 0.7% 70,000 0.4% 210 0.4% 12,000 0.5%
25 Vaughan 1 0.4% 60,000 0.3% 190 0.3% 4,400 0.2%
27 Sarnia 1 0.4% 60,000 0.3% 150 0.3% 8,000 0.4%
30 Orillia 1 0.4% 20,000 0.1% 100 0.2% 500 0.0%
Subtotal Ontario 114 41.8% 7,607,450 41.0% 26,192 44.1% 694,350 30.6%
Total Canada 273 100.0% 18,546,842 100.0% 59,417 100.0% 2,266,200 100.0%Source: TSW Research

48
5. DemandTrade Shows held in the North America, Canada and
Ontario
TSW Research database includes all trade shows with 5,000 net square feet of exhibit space or more.
• In 2007, 5,036 such events where held in the United States and Canada of these events, 3,827 are trade shows. The compound average growth rate in number of trade shows between 2003 and 2007 is 2.4%. As shown, the growth in number of trade shows in the TSW Research database has slowed each year over this period. For comparison purposes, the compound average growth rate in the supply of exhibit space in the United States and Canada was 2.7% over the same period.
• TSW Research’s event database includes 273 trade shows that will be held in Canada in 2007. The number of Canadian events in the TSW database has declined by a compound average growth rate of 5.1% since 2003.
• TSW Research’s event database includes 114 trade shows that will be held in Canada in 2007. The number of Canadian events in the TSW database has declined by a compound average growth rate of 2.9% since 2003.
• Ontario’s share of the total number of Canadian and United States trade shows in the TSW database has declined from 3.7% in 2003 to 3.0% today.
• Ontario’s share of the Canadian trade shows in the database has fluctuated between 38.1% and 43.3% over the last three years.
Events Growth Events Growth Events Growth
Share of
Total
Share of
Canada
2007 3,827 0.7% 273 -2.6% 114 -3.5% 3.0% 41.8%2006 3,800 2.2% 280 1.1% 118 7.6% 3.1% 42.1%
2005 3,716 2.3% 277 -10.1% 109 -21.1% 2.9% 39.4%
2004 3,631 4.2% 305 -10.2% 132 3.0% 3.6% 43.3%
2003 3,479 5.2% 336 n/a 128 n/a 3.7% 38.1%Source: TSW Research
Total Canada and the
United States Canada Ontario
Note: TSW Research Database includes trade shows and consumer shows. We have assumed the 2007 ratio of trade shows
to consumer shows has remained constant throughout the 2003 to 2007 period.

49
5. DemandTrade Shows Held in Canada – Recurring vs. “One Time”
The TSW Research database of trade shows held in Canada includes 1,471 individual events over the five-year 2003 to 2007 period (an annual event which occurred in each of the five years would be considered five individual events). Of these 1,471 events, 1,213 or 81.5% were recurring events (i.e., events that occurred more than once in the five-year period). Only 258 events, or an average of 52 per year, were “one-time” events.
Of the 1,213 recurring events, 971 or 80% (1,179 less 258) were held at the same destination each time, although in some cases different venues. The remaining events occurred in multiple destinations.
5+ 4 3 2 1
5+ 538 5 4 3 19 66
4 252 5 3 7 48
3 249 9 5 69
2 174 17 70
1 258 258
Total Events 1,471 26 40 54 172 1,179Source: TSW Research, HLT Advisory Inc.
Event Distribution (Number of Canadian Venues)Total Number of
Events
Times Event
Held in Canada
Trade Show Events Held in Canada Between 2002 and 2007
50
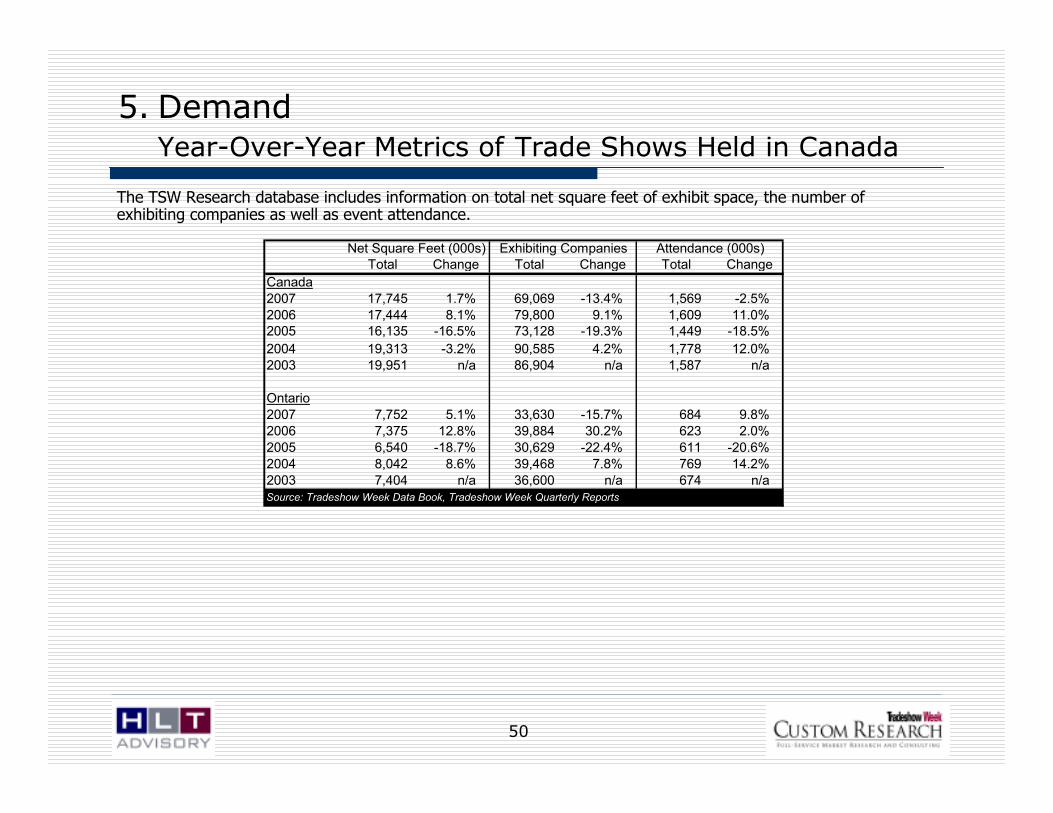
5. DemandYear-Over-Year Metrics of Trade Shows Held in Canada
The TSW Research database includes information on total net square feet of exhibit space, the number of exhibiting companies as well as event attendance.
Total Change Total Change Total Change
Canada
2007 17,745 1.7% 69,069 -13.4% 1,569 -2.5%
2006 17,444 8.1% 79,800 9.1% 1,609 11.0%2005 16,135 -16.5% 73,128 -19.3% 1,449 -18.5%
2004 19,313 -3.2% 90,585 4.2% 1,778 12.0%
2003 19,951 n/a 86,904 n/a 1,587 n/a
Ontario
2007 7,752 5.1% 33,630 -15.7% 684 9.8%
2006 7,375 12.8% 39,884 30.2% 623 2.0%
2005 6,540 -18.7% 30,629 -22.4% 611 -20.6%
2004 8,042 8.6% 39,468 7.8% 769 14.2%
2003 7,404 n/a 36,600 n/a 674 n/aSource: Tradeshow Week Data Book, Tradeshow Week Quarterly Reports
Net Square Feet (000s) Attendance (000s)Exhibiting Companies

51
Destination Marketing Association International (“DMAI”) maintains a database of over 18,000 organizations associations, corporations and government groups that hold about 37,000 meetings annually. Of these organizations, about 1% or 352 have reported meeting in Canada since 2002. These 352 organizations reported holding 401 meetings in Canada since 2002 as well as an additional 224 meetings in Canada prior to 2002.
The DMAI database is maintained by member Destination Management Organizations (DMOs). The database is dependent on these DMOs inputting the information in the database. Those events occurring at a destination that did not utilize the local DMO (e.g. an event occurring at a convention hotel that in which the lead was generated by the hotel or hotel company’s sales office) are most likely not included.
The table below provides a breakdown of the 401 events in the DMAI database by host city.
Over 50% of the 401 Canadian events were held in Ontario. The majority (98.1%) of these reported Ontario events occurred in Toronto with the remainder occurring in Ottawa. Only four of the reported events in the DMAI database where held in Ottawa.
Toronto and Montreal, the Canadian cities with the largest convention venues in terms of rentable space, have held the most events since 2002 with 210 and 105 respectively. Vancouver and Calgary, with Canada’s sixth and seventh largest convention centres, held 43 and 37 events since 2002.
5. DemandConventions Held in Canada
Calgary Edmonton Montreal Ottawa Toronto Vancouver Total
Events 37 2 105 4 210 43 401
Average Registered Attendance 942 225 1,475 288 1,990 915 1,616Average Total Attendance 987 225 1,580 281 2,230 910 1,773
Average Peak Rooms Picked Up 366 57 765 143 840 462 725Source: Destination Marketing Association International, HLT Advisory Inc.
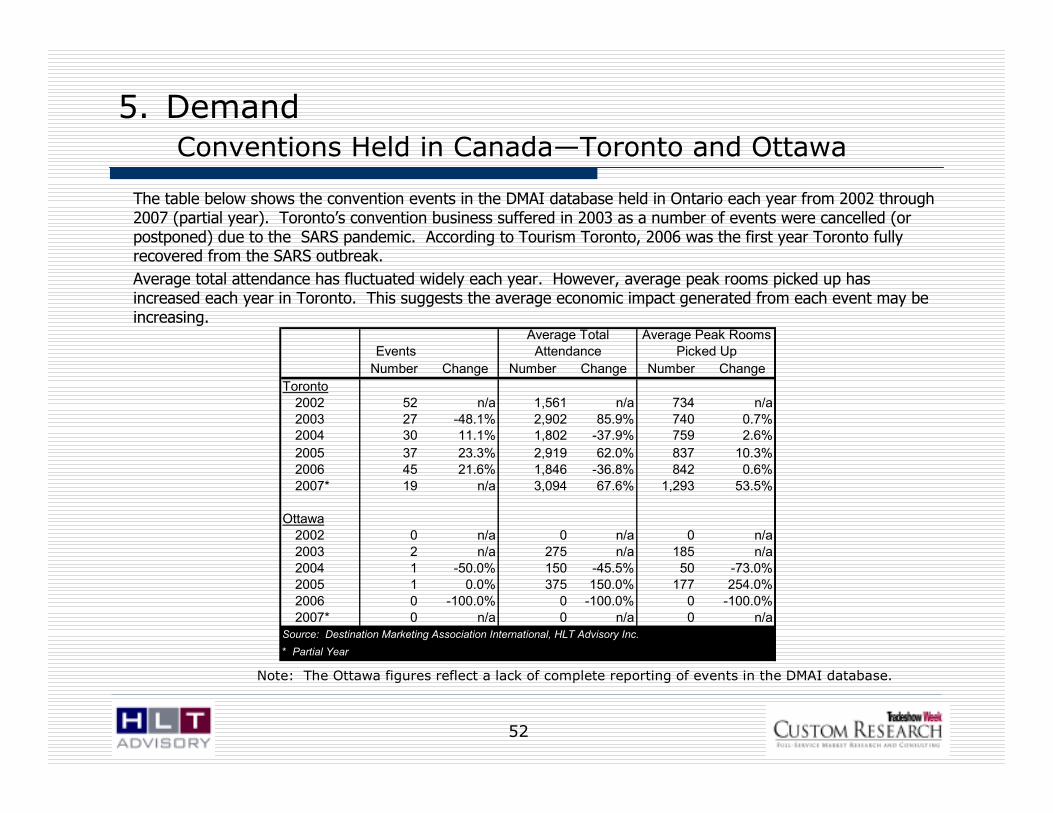
52
The table below shows the convention events in the DMAI database held in Ontario each year from 2002 through 2007 (partial year). Toronto’s convention business suffered in 2003 as a number of events were cancelled (or postponed) due to the SARS pandemic. According to Tourism Toronto, 2006 was the first year Toronto fully recovered from the SARS outbreak.
Average total attendance has fluctuated widely each year. However, average peak rooms picked up has increased each year in Toronto. This suggests the average economic impact generated from each event may be increasing.
5. DemandConventions Held in Canada—Toronto and Ottawa
Note: The Ottawa figures reflect a lack of complete reporting of events in the DMAI database.
Events
Number Change Number Change Number Change
Toronto
2002 52 n/a 1,561 n/a 734 n/a
2003 27 -48.1% 2,902 85.9% 740 0.7%2004 30 11.1% 1,802 -37.9% 759 2.6%
2005 37 23.3% 2,919 62.0% 837 10.3%
2006 45 21.6% 1,846 -36.8% 842 0.6%
2007* 19 n/a 3,094 67.6% 1,293 53.5%
Ottawa
2002 0 n/a 0 n/a 0 n/a
2003 2 n/a 275 n/a 185 n/a
2004 1 -50.0% 150 -45.5% 50 -73.0%
2005 1 0.0% 375 150.0% 177 254.0%
2006 0 -100.0% 0 -100.0% 0 -100.0%
2007* 0 n/a 0 n/a 0 n/aSource: Destination Marketing Association International, HLT Advisory Inc.
* Partial Year
Average Total
Attendance
Average Peak Rooms
Picked Up

53
Of the 352 association and corporate groups in the DMAI database that have held conventions in Canada since 2002, 128 of those have met in Canada on multiple occasions. These 128 groups have held 401 meetings in Canada (dating back to 1985). Toronto was by far the most popular destination for these groups hosting 184meetings by 110 individual groups an average of 1.7 times. Montreal and Calgary have also been successful in hosting groups on multiple occasions.
5. DemandConventions Held in Canada—Destination Allocation
The 352 organizations in the DMAI database holding events in Canada since 2002 have held a total of 625 events in Canada. Of these 625 events, 224 have been held in Canada once (in most cases United States or international based groups). Over half of these “one-off” events were held in Toronto. Ottawa was the only other Ontario city to host one-off events with two of its 22 events coming from groups holding a single event in Canada.
This analysis suggests that Toronto is the primary destination for both groups holding multiple events and one-off events in Canada.
Calgary Edmonton Hamilton Montreal Ottawa Quebec Toronto Vancouver Victoria Total
Meetings by Location (Multiple Meetings in Canada) 48 12 1 90 20 11 184 34 1 401
Groups Holding Meeting at Destination 34 11 1 71 19 11 110 29 1 128Groups Holding Meeting at Destination (Capture Rate) 26.6% 8.6% 0.8% 55.5% 14.8% 8.6% 85.9% 22.7% 0.8% 100.0%Average Meetings at Destination per Group 1.4 1.1 1.0 1.3 1.1 1.0 1.7 1.2 1.0 3.1Source: Destination Marketing Association International, HLT Advisory Inc.
Total Events Multiple Events One-Time Events
Calgary 62 48 14
Edmonton 14 12 2
Hamilton 1 1 0Montreal 145 90 55
Ottawa 22 20 2Quebec City 12 11 1
Richmond 1 0 1
Toronto 301 184 117Vancouver 66 34 32
Victoria 1 1 0625 401 224
Source: Destination Marketing Association International, HLT Advisory Inc.
Groups Holding Events in Canada 2002 to 2007
54
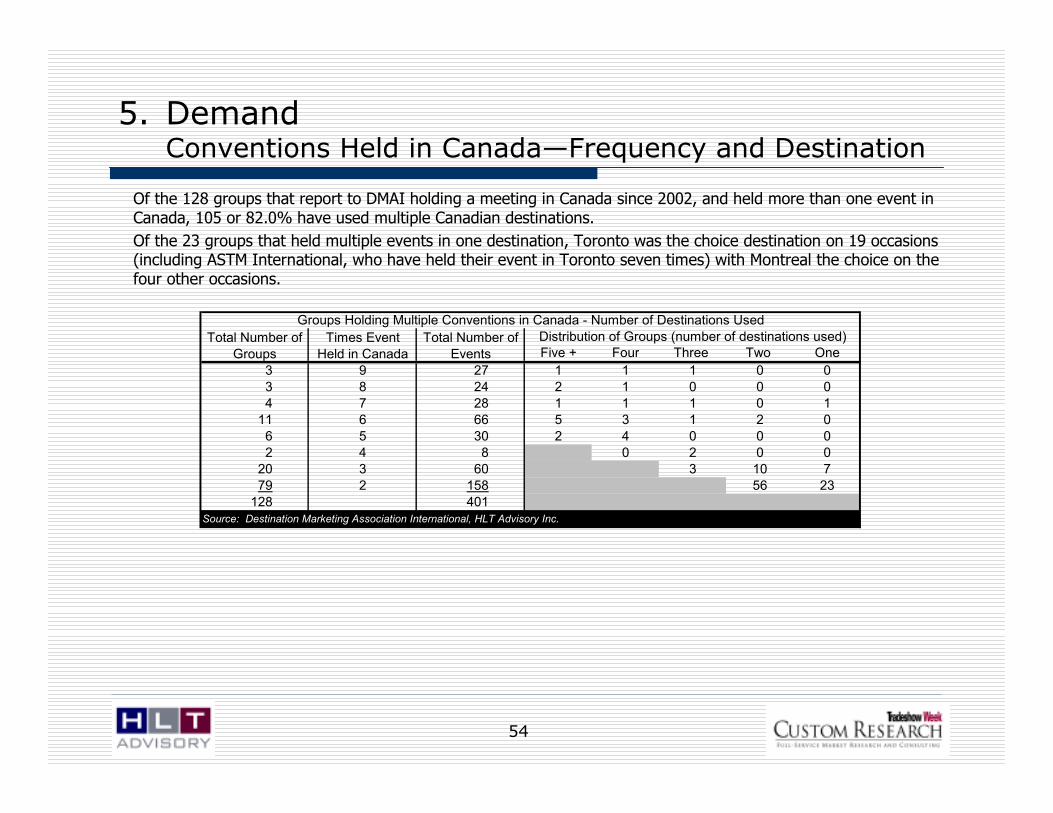
Of the 128 groups that report to DMAI holding a meeting in Canada since 2002, and held more than one event in Canada, 105 or 82.0% have used multiple Canadian destinations.
Of the 23 groups that held multiple events in one destination, Toronto was the choice destination on 19 occasions (including ASTM International, who have held their event in Toronto seven times) with Montreal the choice on the four other occasions.
5. DemandConventions Held in Canada—Frequency and Destination
Five + Four Three Two One
3 9 27 1 1 1 0 0
3 8 24 2 1 0 0 0
4 7 28 1 1 1 0 1
11 6 66 5 3 1 2 0
6 5 30 2 4 0 0 0
2 4 8 0 2 0 0
20 3 60 3 10 7
79 2 158 56 23
128 401Source: Destination Marketing Association International, HLT Advisory Inc.
Groups Holding Multiple Conventions in Canada - Number of Destinations Used
Distribution of Groups (number of destinations used)Total Number of
Groups
Total Number of
Events
Times Event
Held in Canada
55
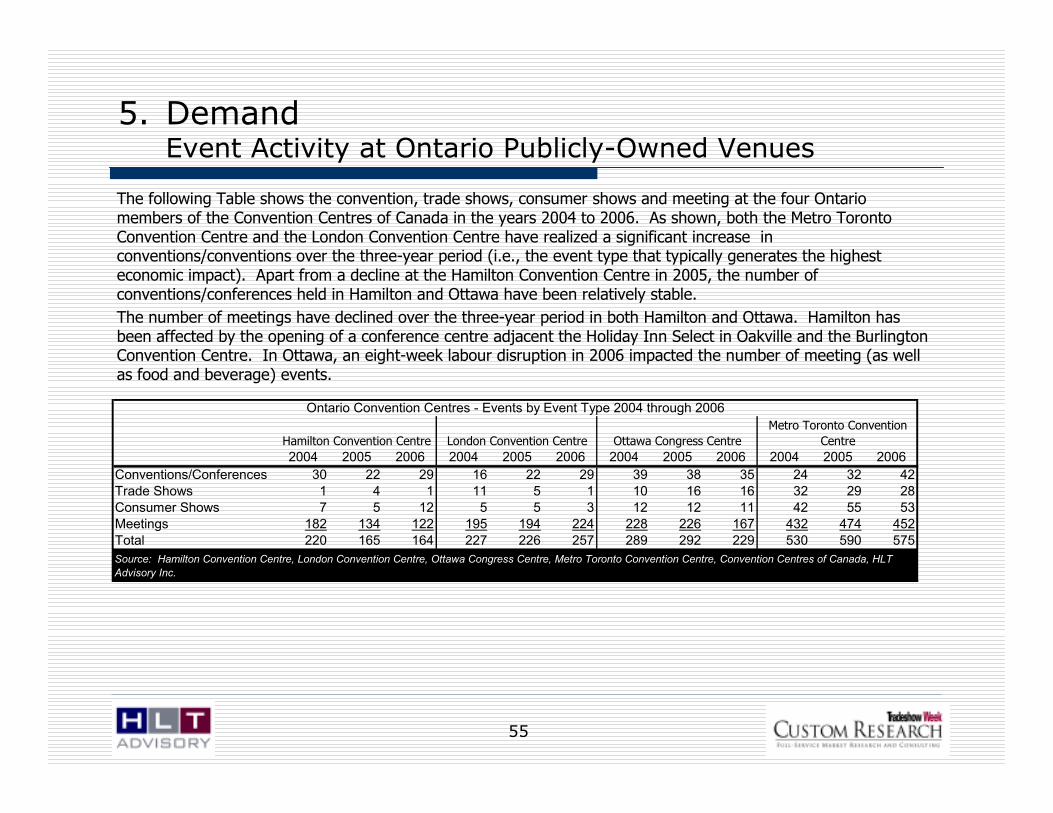
The following Table shows the convention, trade shows, consumer shows and meeting at the four Ontario members of the Convention Centres of Canada in the years 2004 to 2006. As shown, both the Metro Toronto Convention Centre and the London Convention Centre have realized a significant increase in conventions/conventions over the three-year period (i.e., the event type that typically generates the highest economic impact). Apart from a decline at the Hamilton Convention Centre in 2005, the number of conventions/conferences held in Hamilton and Ottawa have been relatively stable.
The number of meetings have declined over the three-year period in both Hamilton and Ottawa. Hamilton has been affected by the opening of a conference centre adjacent the Holiday Inn Select in Oakville and the Burlington Convention Centre. In Ottawa, an eight-week labour disruption in 2006 impacted the number of meeting (as well as food and beverage) events.
5. DemandEvent Activity at Ontario Publicly-Owned Venues
2004 2005 2006 2004 2005 2006 2004 2005 2006 2004 2005 2006
Conventions/Conferences 30 22 29 16 22 29 39 38 35 24 32 42
Trade Shows 1 4 1 11 5 1 10 16 16 32 29 28
Consumer Shows 7 5 12 5 5 3 12 12 11 42 55 53
Meetings 182 134 122 195 194 224 228 226 167 432 474 452
Total 220 165 164 227 226 257 289 292 229 530 590 575
London Convention CentreHamilton Convention Centre
Ontario Convention Centres - Events by Event Type 2004 through 2006
Metro Toronto Convention
CentreOttawa Congress Centre
Source: Hamilton Convention Centre, London Convention Centre, Ottawa Congress Centre, Metro Toronto Convention Centre, Convention Centres of Canada, HLT
Advisory Inc.

56
Comparing the aggregate convention/conference, trade and consumer show events held in the four Ontario convention centres to the results for the aggregate Convention Centres of Canada total, provides an indication of market share in a Canadian context. However, as these aggregate numbers include local, provincial and regional events (where venues outside the local, provincial or regional area will be ineligible to host an event) can distort the total…
5. DemandOntario Venues Compared with CC of C Venues
2004 2005 2006 2004 2005 2006 2004 2005 2006
Conventions/Conferences 109 114 135 442 481 529 24.7% 23.7% 25.5%
Trade Shows 54 54 46 175 176 171 30.9% 30.7% 26.9%
Consumer Shows 66 77 79 128 162 175 51.6% 47.5% 45.1%
Meetings 1,037 1,028 965 2,932 3,404 3,591 35.4% 30.2% 26.9%
Total 1,266 1,273 1,225 3,677 4,223 4,466 34.4% 30.1% 27.4%
Note: Canadian event counts from the Convention Centres of Canada Benchmarking Study
Source: Hamilton Convention Centre, London Convention Centre, Ottawa Congress Centre, Metro Toronto Convention Centre,
Convention Centres of Canada, HLT Advisory Inc.
Ontario Market ShareTotal CanadaOntario
Ontario Convention Centre Market Share by Event Type - 2004 to 2006
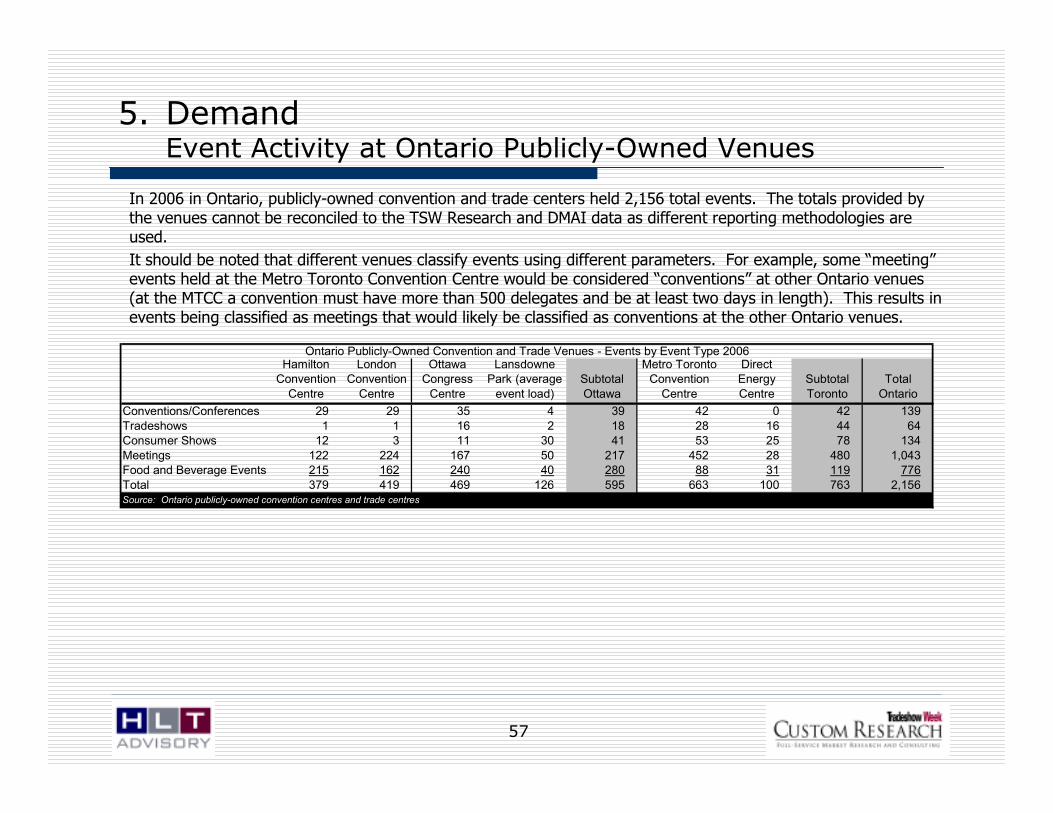
57
In 2006 in Ontario, publicly-owned convention and trade centers held 2,156 total events. The totals provided by the venues cannot be reconciled to the TSW Research and DMAI data as different reporting methodologies are used.
It should be noted that different venues classify events using different parameters. For example, some “meeting”events held at the Metro Toronto Convention Centre would be considered “conventions” at other Ontario venues (at the MTCC a convention must have more than 500 delegates and be at least two days in length). This results in events being classified as meetings that would likely be classified as conventions at the other Ontario venues.
5. DemandEvent Activity at Ontario Publicly-Owned Venues
Hamilton Convention
Centre
London Convention
Centre
Ottawa Congress
Centre
Lansdowne Park (average
event load)
Subtotal
Ottawa
Metro Toronto Convention
Centre
Direct Energy
Centre
Subtotal
Toronto
Total
Ontario
Conventions/Conferences 29 29 35 4 39 42 0 42 139
Tradeshows 1 1 16 2 18 28 16 44 64Consumer Shows 12 3 11 30 41 53 25 78 134
Meetings 122 224 167 50 217 452 28 480 1,043Food and Beverage Events 215 162 240 40 280 88 31 119 776
Total 379 419 469 126 595 663 100 763 2,156Source: Ontario publicly-owned convention centres and trade centres
Ontario Publicly-Owned Convention and Trade Venues - Events by Event Type 2006

58
An analysis of the convention/conference, trade and consumer show events held in 2006 at Ontario’s publicly-owned convention centres shows the vast majority (89.6%) of conventions and conferences do not regularly occur (i.e., these are “one-time” events or events on a rotation that may visit the venue once every few years). Conversely, the majority of trade shows (80.4%) and consumer shows (89.9%) occur on an annual basis.
5. DemandEvent Activity at Ontario Publicly-Owned Venues (cont’d.)
Hamilton
Convention
Centre
London
Convention
Centre
Ottawa
Congress
Centre
Metro Toronto
Convention
Centre
Conventions/Conferences
Recurring 7 3 3 2 15 11.1%
One-Time Provincial/Regional 11 20 10 21 62 45.9%
One-Time National 9 6 19 14 48 35.6%
One-Time International 2 0 3 5 10 7.4%
Total 29 29 35 42 135 100.0%
Tradeshows
Recurring 1 1 8 27 37 80.4%
One-Time Provincial/Regional 0 0 8 1 9 19.6%
One-Time National 0 0 0 0 0 0.0%
One-Time International 0 0 0 0 0 0.0%
Total 1 1 16 28 46 100.0%
Consumer Shows
Recurring 11 3 10 47 71 89.9%
One-Time Provincial/Regional 0 0 0 5 5 6.3%
One-Time National 1 0 1 1 3 3.8%
One-Time International 0 0 0 0 0 0.0%
Total 12 3 11 53 79 100.0%
Total
Source: Hamilton Convention Centre, London Convention Centre, Ottawa Congress Centre, Metro Toronto Convention Centre, HLT Advisory Inc.
Ontario Convention Venues - Recurring and One-Time Events by Market Segment

59
Attractive dates vary by event type. In Canada, convention demand is highest during non-holiday weeks in the spring and fall. While client-specific requirements vary, generally convention organizers avoid holiday periods and seasonal fluctuations. As a result, convention “season” is only a subset of the entire year. Typically, convention events have booking priority at the venues with other event types (i.e., trade shows, consumer shows) filling in the scheduling gaps or the non-saleable weeks for conventions. The above table breaks down the number of saleable weeks by geographic market.
5. DemandConvention Saleable Weeks by Delegate Source of Origin
Canadian United States International
Saleable Season All Year Mar. to Oct. Mar. to Oct.
Saleable Weeks 52 35 35
Less: Weeks with Major Holidays
First Week of January 1 n/a n/a
Easter 2 2 2
Memorial Day/Mother's Day 1 1 1
Canada Day 1 n/a n/a
July 4th n/a 1 n/a
Civic Holiday (August) 1 n/a n/a
Labour Day/Rosh Hashanna 1 1 1
Yom Kippur n/a 1 n/a
Simhat Torah n/a 1 n/a
Columbus Day n/a 1 n/a
Thanksgiving (Canada) 1 n/a n/a
Thanksgiving (United States) n/a 1 n/a
Christmas/New Years 1 n/a n/a
Subtotal 9 9 4
Total Saleable Weeks 43 26 31Source: HLT Advisory Inc.
Geographic Orientation

60
Combining the publicly-owned and privately-owned venues together with convention hotels gives an indication of total demand within Ontario's two major cities.
5. DemandTotal Demand Estimates for Toronto and Ottawa
Metro Toronto
Convention
Centre
Direct Energy
Centre
International
Centre/ Toronto
Congress
Centre*
Convention
Hotels** Total Toronto
Conventions 42 0 10 220 272
Tradeshows 28 16 250 10 304
Consumer Shows 53 25 60 5 143
Source: Metro Toronto Convention Centre, HLT Advisor Inc. estimates
* Estimated aggregate event load for private trade centres
Toronto 2006 Event Load
** Estimated aggregate event load for the Fairmont Royal York, the Sheraton Centre and Westin Harbour Castle - defined as group
events generating at least 500 occupied room nights
Ottawa Congress
Centre* Lansdowne Park
Convention
Hotels** Total Ottawa
Conventions 35 4 100 139
Tradeshows 16 2 10 28
Consumer Shows 11 30 5 46
Source: Ottawa Congress Centre, HLT Advisory Inc. estimates
* The Ottawa Congress Centre experienced an eight-week labour disruption beginning on April 12, 2006
** Estimated aggregate event load for the Chateau Laurier, Westin Ottawa and Marriott Ottawa - defined as group
events generating at least 400 occupied room nights
Ottawa 2006 Event Load

61
6. Key Success Factors (KSF)Introduction
In this section, the Key Success Factors (“KSF”) for a convention venue in attracting convention events are discussed. The analysis is focused on convention events because these are the events that have the potential to attract the most non-resident delegates thereby generating the greatest economic impact. The KSF for conventions include:
• Air lift to the destination
• Quality hotels close to or adjacent to the venue
• Quality venue space
• Cost of destination and venue
• Attractive destination

62
6. KSF #1Air Lift to Destination
The number of destinations with non-stop service to the host destination as well as the frequency and capacity of the flights is one of the most critical KSFs in attracting convention events. The source of origin of event delegates will determine the air lift requirements.
Region Toronto
Ottawa
Montreal
Philadelphia
Washington
Chicago
Boston
Atlanta
Dallas
Miami
Vancouver
Los Angeles
Canada 27 13 29 2 4 9 6 3 4 2 41 5
United States 41 10 21 82 91 140 22 163 127 46 24 77
Caribbean* 25 - 13 11 5 10 5 22 3 27 5 1
Central & South America 19 - 3 2 9 20 2 29 26 36 9 27
Atlantic Islands 2 - - - - - 1 - - - - -
Europe 27 1 25 17 12 22 11 19 4 - 10 8
Africa - - 2 - 1 - - 2 - - - -
Middle East 1 - 2 - 4 3 - 2 - - - 1
Asia/Oceania 7 - 1 - 4 18 - 3 2 - 10 19
Total Destinations 149 24 96 114 130 222 47 243 166 111 99 138
* Six destinations in Cuba are served from Toronto - they have been counted as one destination.
Source: Toronto Pearson International Airport, Ottawa International Airport, Montréal-Pierre Elliott Trudeau International
Airport, Philadelphia International Airport, Metropolitan Washington Airports Authority, Chicago Airport System, Logan
International Airport (Boston), Hartsfield-Jackson Atlanta International Airport, Dallas Fort Worth Airport, Miami-Dade
International Airport, Vancouver International Airport, Los Angeles International Airport.
Airport
Total Airport Destinations by Region
Toronto is well-positioned from this perspective serving more United States destinations than any Canadian city, more European destinations than all of the selected destinations as well as a number of Asian destinations. The only cities whose airports serve more destinations than Toronto are Atlanta (hub for Delta Airlines), Chicago (hub for American Airlines and United Airlines) and Dallas (hub for American Airlines). The cities included in the table were selected as representative of typical competitors to Toronto for convention events.
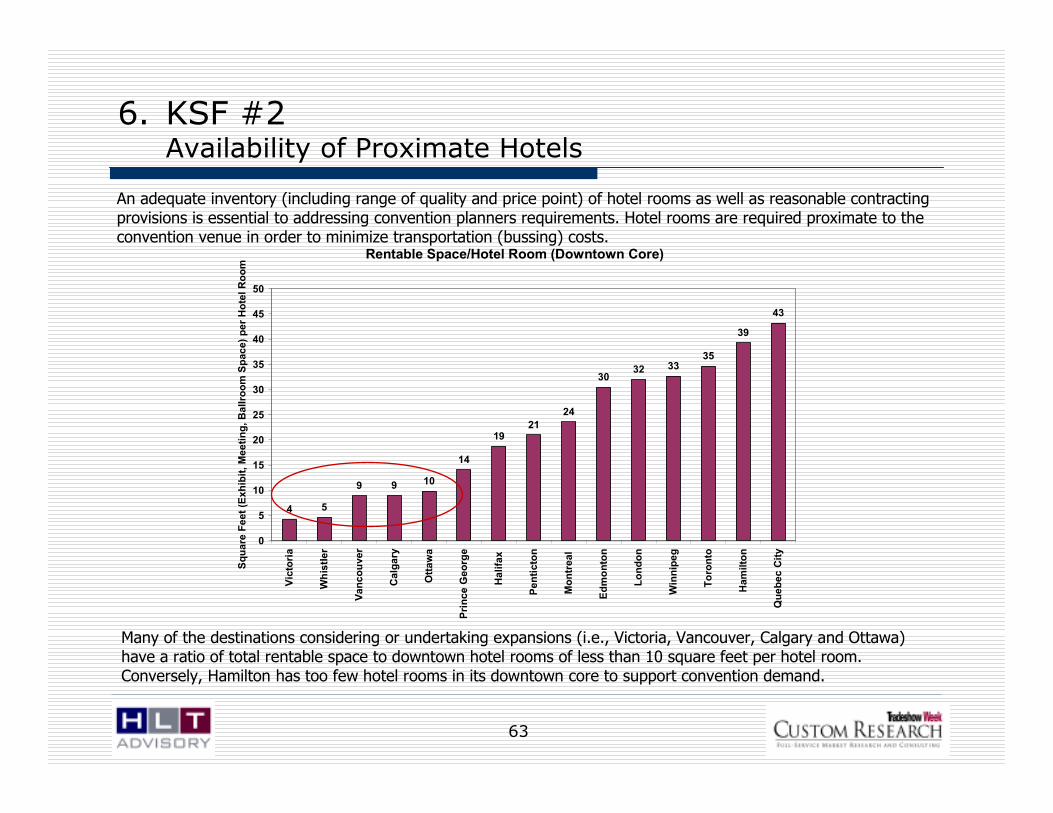
63
6. KSF #2Availability of Proximate Hotels
An adequate inventory (including range of quality and price point) of hotel rooms as well as reasonable contracting provisions is essential to addressing convention planners requirements. Hotel rooms are required proximate to the convention venue in order to minimize transportation (bussing) costs.
Rentable Space/Hotel Room (Downtown Core)
4 5
9 9 10
14
1921
24
3032 33
35
39
43
0
5
10
15
20
25
30
35
40
45
50Victoria
Whistler
Vancouver
Calgary
Ottawa
Prince George
Halifax
Penticton
Montreal
Edmonton
London
Winnipeg
Toronto
Hamilton
Quebec City
Square Feet (Exhibit, Meeting, Ballroom Space) per Hotel Room
Many of the destinations considering or undertaking expansions (i.e., Victoria, Vancouver, Calgary and Ottawa) have a ratio of total rentable space to downtown hotel rooms of less than 10 square feet per hotel room. Conversely, Hamilton has too few hotel rooms in its downtown core to support convention demand.

64
6. KSF #3Quality of Venue and Service
The appropriateness of a venue’s exhibition, meeting and ballroom space is an important criteria for meeting planners. Once they have determined that enough space of each type (exhibit space, number and size of breakouts, size of ballroom) is available, they consider:
• Amount of contiguous exhibit space—Ideally, exhibitors may be accommodated in one contiguous space. The exhibit space should be column free. Sufficient loading docks and access to the exhibit floor is important. Event organizers look to minimize the move-in and move-out time requirements to both reduce the cost to themselves (through exhibit hall rentals) and their exhibitors (often a significant source of revenue for the organizer).
• Number and size of breakout rooms—Event organizers (both convention and trade show) are looking for an increasing number of breakout rooms. These rooms should be “hotel quality” as should the main ballroom used for plenary sessions, meals, gala dinners, etc. An appropriate mix of Exhibit Space to meeting/ballroom space is desired. The venue’s exhibition, meeting room and ballroom space should be easily accessible to each other.
• Technology and Telecom—State-of-the-art technology is increasingly becoming a requirement for event organizers and participants.
• Ability to provide “hotel quality” food and beverage—Event organizers look for quality food and beverage offerings at a reasonable cost.

65
6. KSF #4Cost of Destination and Venue
The overall cost of a destination or venue is a key factor for event organizers. For many association groups, the annual meeting or convention is a key source of funding. If a destination is too expensive, attendance may be adversely affected negatively affecting convention revenues. Further, the cost to the event organizer affects convention profitability, which may adversely affect the association’s financial situation. As a result, venues and CVBs look for ways to reduce the overall cost to organizers.
Toronto, Ottawa and Montreal are among the most expensive destinations. One reason for this is the success of the two major Canadian airlines in maximizing air fares. Price competition is more prevalent in the United States, which has five major airlines (i.e., lower air fares).
TOR OTT MTL PHL WAS CHI BOS ATL DAL MIA VAN LA
YYZ YOW YUL PHL DCA ORD BOS ATL DFW MIA YVR LAX
TOR YYZ 0.49$ 0.37$ 0.74$ 0.78$ 0.50$ 0.69$ 0.42$ 0.22$ 0.23$ 0.17$ 0.14$
OTT YOW 0.47$ 2.05$ 0.71$ 0.55$ 0.42$ 1.00$ 0.57$ 0.23$ 0.20$ 0.14$ 0.13$ MTL YUL 0.38$ 2.20$ 0.66$ 0.61$ 0.33$ 1.04$ 0.54$ 0.20$ 0.23$ 0.17$ 0.14$ PHL PHL 0.58$ 0.57$ 0.53$ 2.11$ 0.15$ 1.31$ 0.18$ 0.10$ 0.08$ 0.10$ 0.28$ WAS DCA 0.63$ 0.45$ 0.51$ 2.11$ 0.31$ 0.46$ 0.21$ 0.10$ 0.12$ 0.11$ 0.07$ CHI ORD 0.42$ 0.35$ 0.32$ 0.15$ 0.31$ 0.24$ 0.19$ 0.20$ 0.08$ 0.14$ 0.07$ BOS BOS 0.57$ 0.84$ 0.85$ 1.31$ 0.46$ 0.24$ 0.26$ 0.48$ 0.11$ 0.10$ 0.16$ ATL ATL 0.35$ 0.49$ 0.46$ 0.18$ 0.21$ 0.19$ 0.26$ 0.17$ 0.19$ 0.11$ 0.19$ DAL DFW 0.18$ 0.19$ 0.17$ 0.10$ 0.10$ 0.20$ 0.48$ 0.17$ 0.27$ 0.15$ 0.09$ MIA MIA 0.19$ 0.16$ 0.19$ 0.08$ 0.12$ 0.08$ 0.11$ 0.19$ 0.27$ 0.10$ 0.06$ VAN YVR 0.17$ 0.14$ 0.16$ 0.12$ 0.14$ 0.17$ 0.11$ 0.13$ 0.18$ 0.11$ 0.22$ LA LAX 0.11$ 0.11$ 0.12$ 0.28$ 0.07$ 0.07$ 0.16$ 0.19$ 0.09$ 0.06$ 0.18$
Greater than $0.30/mile
Between $0.20 and $0.30/mile
Between $0.10 and $0.20/mileLess than $0.10/mile
Note: Price based on the lowest advertised, one-way ticket.
Destination Airport
Departure Airport
The adjacent table shows the average cost per mile for a one-way fare between major urban centres likely to compete with Toronto and Ottawa for national, United States and international conventions. The table represents an average of the lowest available fares on Expedia on November 12, 2007 for travel on January 22, 2008 and April 22, 2008.
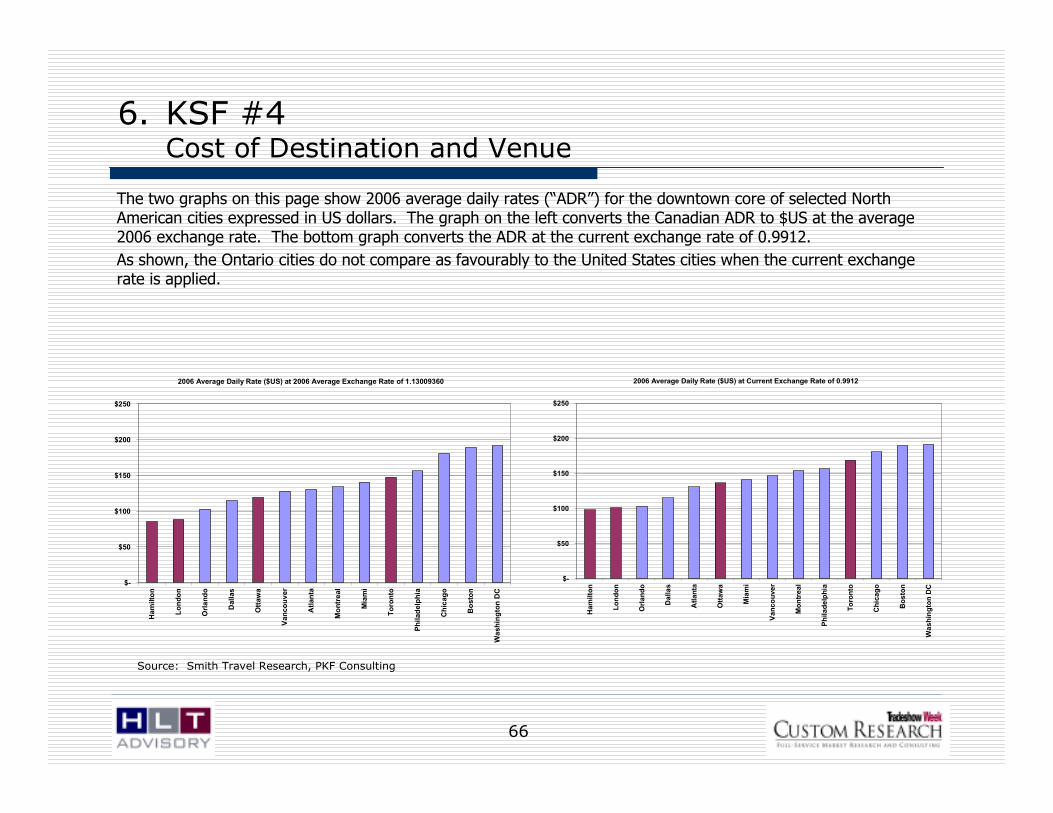
66
6. KSF #4Cost of Destination and Venue
The two graphs on this page show 2006 average daily rates (“ADR”) for the downtown core of selected North American cities expressed in US dollars. The graph on the left converts the Canadian ADR to $US at the average 2006 exchange rate. The bottom graph converts the ADR at the current exchange rate of 0.9912.
As shown, the Ontario cities do not compare as favourably to the United States cities when the current exchange rate is applied.
2006 Average Daily Rate ($US) at 2006 Average Exchange Rate of 1.13009360
$-
$50
$100
$150
$200
$250
Hamilton
London
Orlando
Dallas
Ottawa
Vancouver
Atlanta
Montreal
Miami
Toronto
Philadelphia
Chicago
Boston
Washington DC
2006 Average Daily Rate ($US) at Current Exchange Rate of 0.9912
$-
$50
$100
$150
$200
$250
Hamilton
London
Orlando
Dallas
Atlanta
Ottawa
Miami
Vancouver
Montreal
Philadelphia
Toronto
Chicago
Boston
Washington DC
Source: Smith Travel Research, PKF Consulting
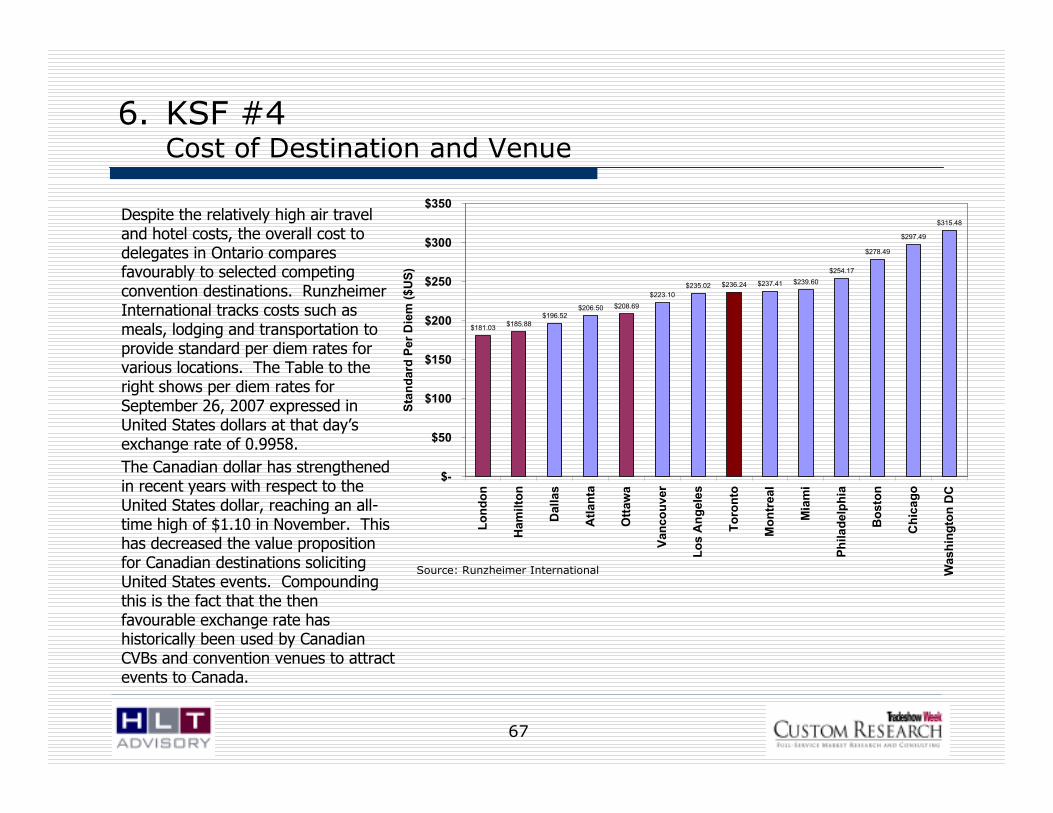
67
6. KSF #4Cost of Destination and Venue
$181.03$185.88
$196.52$206.50 $208.69
$223.10
$235.02 $236.24 $237.41 $239.60
$254.17
$278.49
$297.49
$315.48
$-
$50
$100
$150
$200
$250
$300
$350
London
Hamilton
Dallas
Atlanta
Ottawa
Vancouver
Los Angeles
Toronto
Montreal
Miami
Philadelphia
Boston
Chicago
Washington DC
Standard Per Diem ($US)
Despite the relatively high air travel and hotel costs, the overall cost to delegates in Ontario compares favourably to selected competing convention destinations. Runzheimer International tracks costs such as meals, lodging and transportation to provide standard per diem rates for various locations. The Table to the right shows per diem rates for September 26, 2007 expressed in United States dollars at that day’s exchange rate of 0.9958.
The Canadian dollar has strengthened in recent years with respect to the United States dollar, reaching an all-time high of $1.10 in November. This has decreased the value proposition for Canadian destinations soliciting United States events. Compounding this is the fact that the then favourable exchange rate has historically been used by Canadian CVBs and convention venues to attract events to Canada.
Source: Runzheimer International

68
6. KSF #5Tourism Appeal of the Destination
In Section 5, the results of a TSW Research survey of selection criteria used by show organizers when selecting destinations and venues in which to hold their event is provided. While the most important criteria considered the appropriateness and availability of the venue space and the cost of the destination and venue, the overall attractiveness of a destination was also important:
• The population and demographics of the city/region—Is there a strong local support to generate attendance at the event?
• Proximity and quality of hotels, restaurants, entertainment options, retail and tourist attractions to the venue—A correlation exists between a city’s popularity as a tourist destination and its attractiveness as a convention destination. To the extent the tourism infrastructure is proximate to the convention venue, the more attractive a destination is to meeting planners.
• The safety and security of a destination—Safety and security in a city, particularly proximate to the venue and hotels, are a requirement of a convention destination. A city must be (or be perceived to be) a low crime area, clean and safe. The 2003 SARS outbreak in Toronto is an example. Prior to the outbreak, Toronto was considered a safe destination. Major events were cancelled or postponed almost immediately with the beginning of the pandemic. The negative effects of the outbreak on the city’s convention industry was felt for several years until Toronto was again perceived to be “safe”.
69
6. Key Success FactorsImplications for Ontario
Toronto, and to a lesser extent Ottawa (though considerably enhanced post-expansion), are well positioned to succeed in attracting national and international events.
• Air lift to major Canadian urban centres as well as international destinations is relatively good, especially to/from Toronto.
• As the national capital, Ottawa has a head office base among national associations. Many of these groups have been prohibited from meeting in Ottawa due to lack of suitable exhibit and meeting space at the Ottawa Congress Centre.
• Ottawa’s downtown hotel supply exceeds the demand requirements created by the current Ottawa Congress Centre. Toronto’s supply of quality hotel rooms proximate to the Metro Toronto Convention Centre is sufficient.
• Both Toronto and Ottawa have considerable appeal as tourist destinations, with significant tourism infrastructure generating leisure demand.
One of the principal challenges faced by Toronto and Ottawa within a North American and international context is cost, a challenge exacerbated by exchange rates. Recently, the provincially-funded Convention Development Fund (“CDF”) has provided a compelling sales aid for several Ontario cities, but even with these incentives, pricing is a challenge. Ontario is no longer a “cheap” destination. Unfortunately, given the reliance on and promotion of historical cost advantages (much of this exchange rate-based), the cost challenge is one of the industry’s own making and one that the industry will need to address through provision of alternate price-value sales approaches.

70
In addition to the industry data and interviews conducted as part of this analysis, HLT and TSW Research undertook a survey of event planners to identify awareness of and interest in Ontario as destination for one or more events (the “Survey”). The Survey was sent via email to 3,208 TSW Research database entries (mostly US-based event planners) as well as event planners identified by the Ontario publicly-owned venues. The Survey was not intended as a statistically valid analysis of event planners but does provide (largely anecdotal) insight into current thinking about Ontario as an event destination.
The Survey identified several challenges that could potentially prevent the hosting of an event in Canada/Ontario, including:
• border crossing issues such customs, duties an passport requirements – 54%;
• United States/Canada exchange rate – 33%;
• venue/convention centre costs – 23%;
• cost of transportation to Ontario/venue – 19%; and
• hotel rates – 10%.
The Western Hemisphere Travel Initiative (“WHTI”) requiring United States Citizens to have a passport when arriving by air (and extended to include arrivals by land and sea sometime after summer 2008) has had a modest effect on travel to Canada, although the negative perceptions created have been far greater than the actual effects. Confusion over the shifting requirements of the WHTI has had more of a negative effect on Ontario’s attractiveness as a convention destination. The Canadian dollar, worth US$0.65 as recently as 2001, has strengthened over the past six years achieving a record high of US$1.10 in November 2007. After many years of marketing Canada as a “value” destination, largely as a result of currency differentials, pricing is no longer a strategic advantage.
The following pages outline some additional issues and challenges facing Ontario, primarily in the North American and International marketplace.
7. Issues and ChallengesIntroduction

71
Following September 11th, heightened security concerns have had a limiting effect on international travel. One of the by products of this increased concern is the greater requirement for visitors to the United States to obtain a visa. Canada’s policy with respect to travel visas captures some 20 fewer origin points. The Table below shows the countries where citizens are not required to have a visa to enter Canada and the United States.
7. Issues and ChallengesSecurity Concerns Affecting Travel Mobility
Andorra
Antigua & Barbuda
Australia
Austria
Barbados
Belgium
Botswana
Brunei
Canada
Czech Republic
Cyprus
Denmark
Estonia
Finland
France
Germany
Greece
Iceland
Ireland
Israel
Italy
Japan
Korea, Republic of
Latvia, Republic of
Liechtenstein
Canada � � � � � � � � � � � � � � � � � � � �* � � � � �
US � � � � � � � � � � � � � � �
Continued Luxembourg
Malta
Mexico
Monaco
Namibia
Netherlands
New Zealand
Norway
Papua New Guiney
Portugal
San Marino
Singapore
Slovenia
Solomon Islands
Spain
St. Kitts & Nevis
St. Lucia
St. Vincent
Swaziland
Sweden
Switzerland
United Kingdom
United States
Western Samoa
Canada � � � � � � � � � � � � � � � � � � � � � �**� �
US � � � � � � � � � � � � � �***�
Source: Visa Waiver Program Travel Guide, CIC Canada
*
**
***
- British citizens, British Overseas citizens who are readmissable to the UK, citizens who derive their citizenship
through birth, descent, registration or naturalization in one of the British dependent territories of Anguilla, Bermuda,
British Virgin Islands, Cayman Islands, Falkland Islands, Gibraltar, Montserrat, Pitcairn, St. Helena or the Turks and
Caicos Islands.
- for citizens with the unrestricted right of permanent abode in England, Scotland, Wales, Northern Ireland, the
Channel Islands and the Isle of Man.
- National Passport holders only.
Canada may be seen as an attractive alternative for international groups looking to generate U.S. visitation without basing the event within the United States.

72
Third party meeting planners, such as MCI, SmithBucklin and Experient, are becoming increasingly prevalent in the meeting, convention and trade show industry.
These organizations take over many or all of the event planning tasks for associations and corporations. The destination and venue decision is typically made by the association or corporation (as opposed to the third party planner, although they can sway the decision). Third party planners often do, however, run an open and transparent RFP process for destination and/or venue selection.
One way in which third party planners justify their fees is negotiating better rates and incentives for their clients. In fact, the ability to show purchasing power is a key success factor for third party planners. Hotel sales professionals, for example, often deal with third parties instead of the end user. This has changed how hotel sales are conducted, reducing the importance of relationship building.
7. Issues and ChallengesEmergence of Third Party Planners
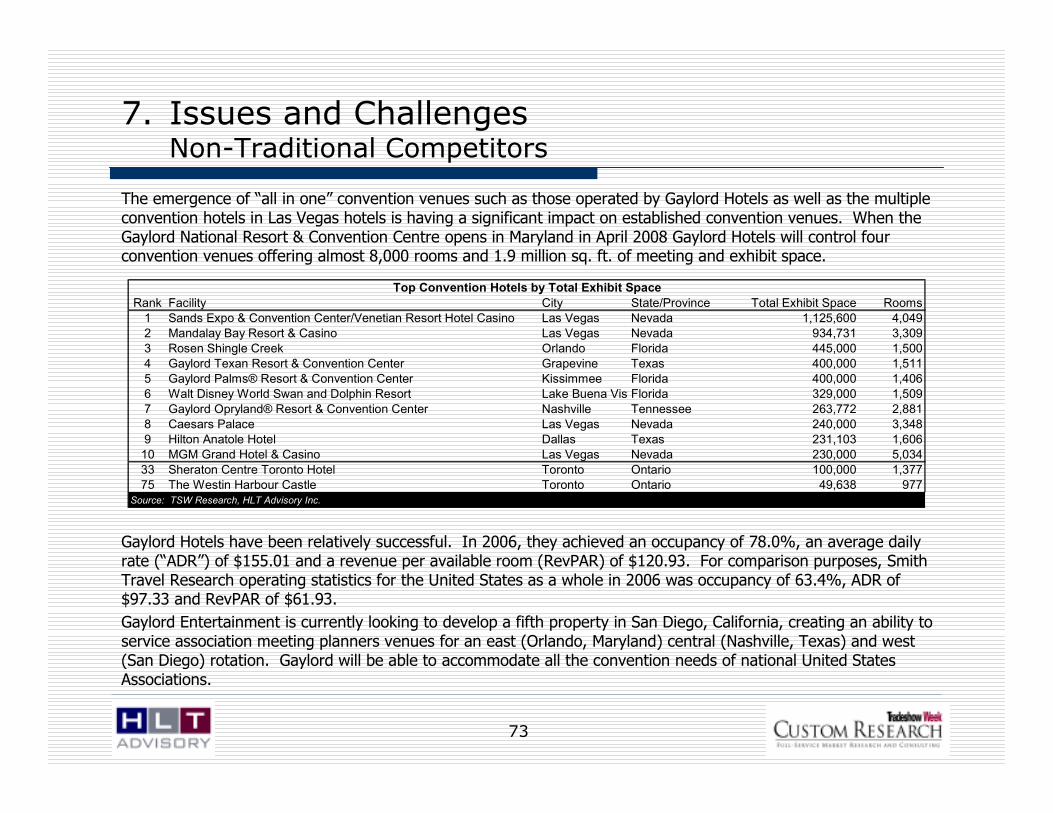
73
The emergence of “all in one” convention venues such as those operated by Gaylord Hotels as well as the multiple convention hotels in Las Vegas hotels is having a significant impact on established convention venues. When the Gaylord National Resort & Convention Centre opens in Maryland in April 2008 Gaylord Hotels will control four convention venues offering almost 8,000 rooms and 1.9 million sq. ft. of meeting and exhibit space.
7. Issues and ChallengesNon-Traditional Competitors
Gaylord Hotels have been relatively successful. In 2006, they achieved an occupancy of 78.0%, an average daily rate (“ADR”) of $155.01 and a revenue per available room (RevPAR) of $120.93. For comparison purposes, Smith Travel Research operating statistics for the United States as a whole in 2006 was occupancy of 63.4%, ADR of $97.33 and RevPAR of $61.93.
Gaylord Entertainment is currently looking to develop a fifth property in San Diego, California, creating an ability to service association meeting planners venues for an east (Orlando, Maryland) central (Nashville, Texas) and west (San Diego) rotation. Gaylord will be able to accommodate all the convention needs of national United States Associations.
Rank Facility City State/Province Total Exhibit Space Rooms
1 Sands Expo & Convention Center/Venetian Resort Hotel Casino Las Vegas Nevada 1,125,600 4,049
2 Mandalay Bay Resort & Casino Las Vegas Nevada 934,731 3,309
3 Rosen Shingle Creek Orlando Florida 445,000 1,500
4 Gaylord Texan Resort & Convention Center Grapevine Texas 400,000 1,511
5 Gaylord Palms® Resort & Convention Center Kissimmee Florida 400,000 1,406
6 Walt Disney World Swan and Dolphin Resort Lake Buena VistaFlorida 329,000 1,509
7 Gaylord Opryland® Resort & Convention Center Nashville Tennessee 263,772 2,881
8 Caesars Palace Las Vegas Nevada 240,000 3,348
9 Hilton Anatole Hotel Dallas Texas 231,103 1,606
10 MGM Grand Hotel & Casino Las Vegas Nevada 230,000 5,034
33 Sheraton Centre Toronto Hotel Toronto Ontario 100,000 1,377
75 The Westin Harbour Castle Toronto Ontario 49,638 977Source: TSW Research, HLT Advisory Inc.
Top Convention Hotels by Total Exhibit Space
74
Event organizers (both corporate and association) are becoming increasingly socially responsible. The future leaders of these organizations are must more likely to be concerned that they, and their organization, are socially responsible.
Green Meetings
Increasingly, event organizers want to ensure their events are “green” or environmentally friendly. They are concerned about the environmental footprint their event leaves behind. The Convention Industry Council (“CIC”) has studied “green meetings” and “green venues”. Recommended best practices for event venues include:
• use recycled and recyclable materials;
• not pre-filling water glasses;
• using reusable china and linen as opposed to disposable products as well as other environmentally-friendly products;
• energy efficient venues;
• arrange to have leftover food donated to a local food bank or separated for pick up by composting operation or local farm;
• shifting as much written communication as possible to email; and
• minimize the use of collateral materials and use double-sided, recycled paper with soy-based ink.
The CIC also has best practices for event organizers in destination, accommodation, event venue and transportation selection.
Ontario venues can make themselves more attractive to organizers concerned with green venues by adhering to environmental programs and having details of those programs available to interested event organizers.
7. Issues and ChallengesIncreasing Importance of Social Responsibility

75
Pharma Code
An issue affecting the ability of Canadian venues to attract lucrative medical conferences is the Canadian Pharma Code, which is more stringent than the United States code. Canada’s Research Based Pharmaceutical Companies created their own code to avoid government regulation. The code limits the sponsorship and hospitality opportunities available to pharmaceutical companies. The code is voluntary and self policing – in Canada, significant fines may be levied for infractions.
The differences between the Pharma Codes in Canada and the United States are significant:
• In the United States, pharmaceutical companies may promote their brands. In Canada, pharmaceutical companies may promote their companies but not their brands. This is less attractive to the pharmaceutical companies.
• In the United States, pharmaceutical companies can underwrite convention costs such as transportation. This is not allowed under Canada’s Pharma Code.
The Canadian Tourism Commission (“CTC”) believes the differences in Pharma Codes between the two countries can mean a difference of $100,000 to $1 million in profits for an event. This makes United States venues significantly more attractive. As these events typically book up to ten years in advance, this issue may have long-term implications for the Canadian convention industry.
7. Issues and ChallengesIncreasing Importance of Social Responsibility

76
Association dynamics are changing. SmithBucklin recently completed a study of such mergers. In recent years, several associations have merged in an effort to address issues such as:
• duplicated memberships;
• similarity in association functions;
• increases operating costs;
• defend associations against industry consolidation; and
• enabling organizations to retain members, their associated fee income and to remain relevant in changing association or industry environments.
This trend is a concern to convention venues as it decreases the universe of events, lowering overall demand.
Another trend is associations “piggybacking” events to capitalize on similar audiences. This can lead to enhanced revenues through greater attendance, lower costs through increased bargaining power (i.e., a longer, larger event) as well as provide more value to their memberships. Destinations and convention venues benefit considerably from such arrangements. For example:
• In 2007 the Software and Information Industry Association’s Software Strategy Summit was co-located with the IDG World Expo’s Software as a Service event at the Santa Clara Convention Center.
• The Worldwide Food Expo, held biennially in Chicago is co-located with the AMI International Meat, Poultry & Seafood Convention and Exposition and the Food, Dairy & Beverage Exposition.
• The co-location of specialty food shows All Asia Food Expo, Expo Comida Latina – New York and Kosherfest contributed to boosting attendance at these events by 15% in 2006.
7. Issues and ChallengesChanging Dynamics for Associations

77
7. Issues and ChallengesRelationships with CVBs
Ideally, CVBs or Destination Marketing Organizations (“DMOs”) and convention centres work together to attract major events to the destination and venue. However, often tensions exist between the venue and CVB.
Funding levels between the CVB and venue are significantly different. A survey of Canadian and United States venues and CVBs found the average marketing budget for venues was $735,733 while the average CVB marketing budget was $3,523,312. Further, the CVB controls the incentive funding or hotel taxes resulting in the venue being dependent on the CVB. In the United States, many venues are taking over responsibility for their own marketing.
Another source of tension is the CVB’s control of the venue. The TSW Survey found the CVB controls the booking window an average of 19 months out, often resulting in friction between the two parties. For example, some venues have bottom-line responsibility and the CVB positions the venue as a loss-leader.
A further source of tension is the two parties often have different measurements of success, as shown in the following Table.
Hamilton London
Venue
Ottawa Congress
Centre Lansdowne Park
Metro Toronto
Convention Centre
Direct Energy
Centre
Hamilton
Convention Centre
London
Convention Centre
Destination Marketing
Organization
Ottawa Tourism
and Convention
Authority
Ottawa Tourism
and Convention
Authority Tourism Toronto Tourism Toronto Tourism Hamilton Tourism London
Relationship
Relationship
Improving
Venue does not
participate with
CVB
Work together to
administer CDF
Good Working
Relationship
DMO responsible
for marketing,
venue for
operations
Work together to
market venue,
LCC participates
in DMO initiatives
Source: Venues and Destination Marketing Organizations
Ottawa Toronto

78
7. Issues and ChallengesSuccess Metrics
A significant difference in mandates of Canadian and United States convention venues is how success is measured. In a survey conducted by TSW Research of convention venues and CVBs, respondents were asked “How does your CVB, venue and/or hotel measure overall CVB and convention centre marketing success?”. Forty percent of United States based respondents mentioned “convention center profit/loss” among other factors. In Canada, 62% of respondents responded the same way. This result indicates a greater willingness to subsidize convention centre operations in the United States than in Canada.
Venues CVBs
All
Respondents
Canadian
Respondents
Total Number of Rooms Booked 79% 86% 81% 100%Total Economic Impact 68% 64% 67% 88%
Convention Centre Profit/Loss 45% 43% 44% 62%Total Number of Visitors 36% 57% 43% 65%Hotel Community Occupancy Levels 38% 64% 46% 50%
Public Relations 21% 29% 24% 25%Hotel Community Gross Sales or Profit 7% 7% 8% 25%Visitor Related Tax Revenues 30% 54% 39% n/a
Bureau Profit/Loss 2% 18% 8% n/aDo Not Measure 11% 0% 7% n/aOther 16% 14% 18% 38%Source: TSW Research
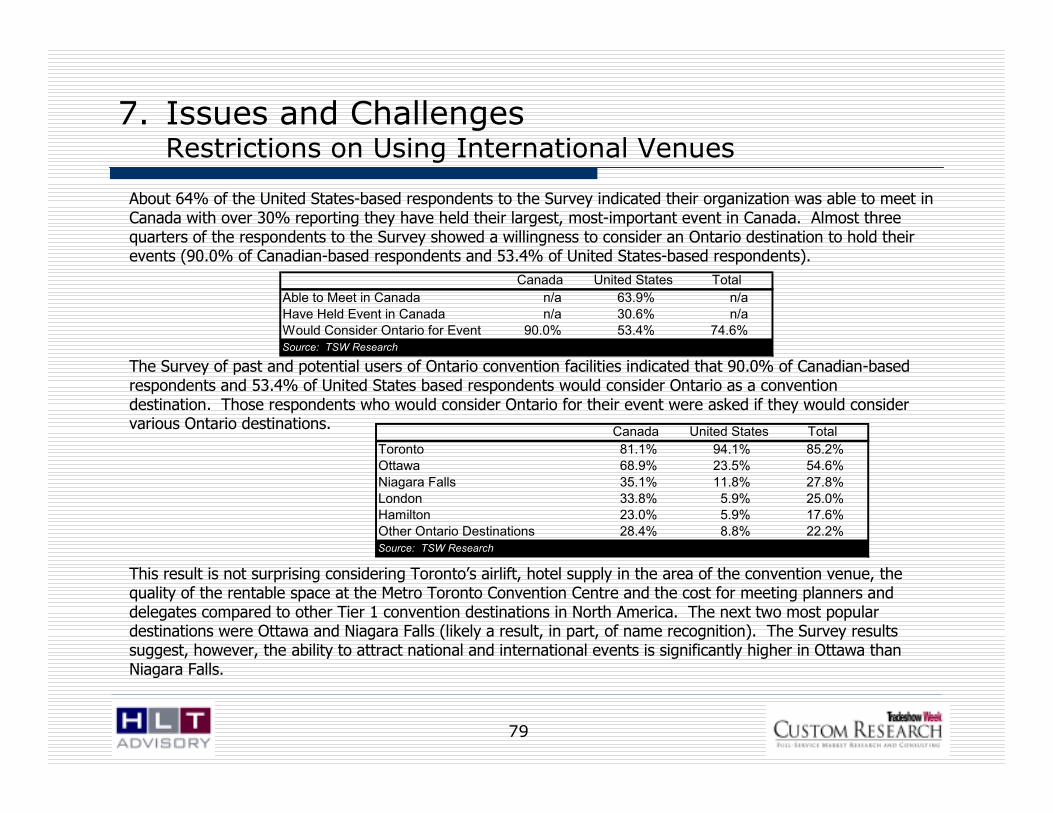
79
About 64% of the United States-based respondents to the Survey indicated their organization was able to meet in Canada with over 30% reporting they have held their largest, most-important event in Canada. Almost three quarters of the respondents to the Survey showed a willingness to consider an Ontario destination to hold their events (90.0% of Canadian-based respondents and 53.4% of United States-based respondents).
7. Issues and ChallengesRestrictions on Using International Venues
The Survey of past and potential users of Ontario convention facilities indicated that 90.0% of Canadian-based respondents and 53.4% of United States based respondents would consider Ontario as a convention destination. Those respondents who would consider Ontario for their event were asked if they would consider various Ontario destinations.
This result is not surprising considering Toronto’s airlift, hotel supply in the area of the convention venue, thequality of the rentable space at the Metro Toronto Convention Centre and the cost for meeting planners and delegates compared to other Tier 1 convention destinations in North America. The next two most popular destinations were Ottawa and Niagara Falls (likely a result, in part, of name recognition). The Survey results suggest, however, the ability to attract national and international events is significantly higher in Ottawa than Niagara Falls.
Canada United States Total
Able to Meet in Canada n/a 63.9% n/a
Have Held Event in Canada n/a 30.6% n/aWould Consider Ontario for Event 90.0% 53.4% 74.6%Source: TSW Research
Canada United States Total
Toronto 81.1% 94.1% 85.2%
Ottawa 68.9% 23.5% 54.6%
Niagara Falls 35.1% 11.8% 27.8%
London 33.8% 5.9% 25.0%Hamilton 23.0% 5.9% 17.6%
Other Ontario Destinations 28.4% 8.8% 22.2%Source: TSW Research
80
8. Opportunities for OntarioIntroduction
The supply and demand trends within the North American (and Ontario) public-assembly marketplace, taken together with key success factors and the variety of issues facing the industry frame a future market size profile for Ontario. The following pages summarize future supply implications and a demand outlook for the six principal “destinations” identified in this analysis: Toronto, Ottawa, London, Hamilton, Windsor and Niagara Falls. The selection of these six markets also reflect the current (and anticipated) location of the principal, publicly-owned (and therefore economic impact focused) public-assembly venues in Ontario.

81
8. Opportunities for OntarioCurrent and Future Supply
Between 2007 and 2010 some 560,000 square feet of exhibit, meeting and ballroom space will be added to ten venues in Ontario. Some 288,000 square feet or 51% of this total is exhibit space, the balance meeting/ ballroom space.
The border communities of Windsor and Niagara Falls are taking two very different approaches to the market with Niagara Falls focusing much more on exhibit-based events (75% of the Niagara Falls venue is dedicated to exhibit space versus 50% in Windsor).
The Ottawa Congress Centre expansion will see a substantial increase in meeting/ballroom space to complement expanded exhibit areas.
The private sector exhibit halls in Toronto continue to expand while the Direct Energy Centre will add meeting capacity in part at the expense of exhibit space.
Exhibit Space
Meeting/
Ballroom*Exhibit Space
Meeting/
Ballroom*Exhibit Space
Meeting/
Ballroom*
TorontoMetro Toronto Convention Centre 453,648 122,227 0 0 453,648 122,227Direct Energy Centre 804,563 25,000 (162,000) 90,000 642,563 115,000International Centre 471,000 28,836 0 23,000 471,000 51,836Toronto Congress Centre** 500,000 60,000 300,000 25,000 800,000 85,000Total 2,229,211 236,063 138,000 138,000 2,367,211 374,063Growth Percentage 6.2% 58.5%
OttawaOttawa Congress Centre*** 54,113 14,941 10,880 68,803 64,993 83,744
Lansdowne Park 111,000 3,000 0 0 111,000 3,000Total 165,113 17,941 10,880 68,803 175,993 86,744Growth Percentage 6.6% 383.5%
Hamilton/LondonHamilton Convention Centre 19,662 32,652 0 0 19,662 32,652
London Convention Centre 0 43,357 0 0 0 43,357Total 19,662 76,009 0 0 19,662 76,009Growth Percentage 0.0% 0.0%
Windsor/Niagara Falls
Niagara Falls Convention Centre 0 0 100,000 30,700 100,000 30,700Casino Windsor 0 0 39,500 37,941 39,500 37,941Total 0 0 139,500 68,641 139,500 68,641Growth Percentage n/a n/a
Total Ontario 2,413,986 330,013 288,380 275,444 2,702,366 605,457
Growth Percentage 11.9% 83.5%Source: HLT Advisory Inc.
* Meeting/Ballroom space may also be used for exhibitions
** Does not include Phase III expansion at the Toronto Congress Centre (currently undefined)
Current and Proposed Exhibit and Meeting/Ballroom Space
*** The 51,344 square feet of pre-function space is not included. When included, the total rentable space
at the expanded Ottawa Congress Centre would exceed 200,000 square feet.
Current Proposed (by 2010) Total

82
8. Opportunities for OntarioDemand Outlook
The total North American convention, trade and consumer show activity for 2006 is estimated based on the Meetings Market Report and TSW Research. Compound average growth rates over the previous decade reflect modest growth at about 2.5%.
Looking at the demand outlook for Ontario, consideration must be given to the growth in supply (particularly new buildings in Windsor and Niagara Falls) as well as modified building focus for the Direct Energy Center and the privately-owned trade centres in Toronto. Consideration of supply increases results in growth in the convention market of about 25% over the next ten years, including all convention events held in convention centres, trade centres and large convention hotels.
Current Five Year Ten Year2006 2010 2015
North AmericaConventions 12,700 13,500 15,000
Trade Shows 3,827 4,000 4,700
Consumer Shows 1,209 1,250 1,475
Ontario
Conventions 469 545 590
Trade Shows 334 379 410
Consumer Shows 204 233 259Source: HLT Advisory Inc.
* Includes public and private venues as well as large convention hotels.
Current and Projected Event Load*

83
8. Opportunities for OntarioDemand Outlook – Toronto and Ottawa
Toronto and Ottawa hold the greatest potential for convention events drawing attendance from outside Ontario. Of the 77 convention events held in the Metro Toronto Convention Centre, Ottawa Congress Centre and Direct Energy Centre only five are annual, recurring events. While an increase in convention activity is a reasonable assumption at the Metro Toronto Convention Centre as the Toronto market recovers, the greatest aggregate growth of convention activity will occur in Ottawa as a result of the Ottawa Congress Centre expansion. By 2015, the Ottawa Congress Centre could be expected to accommodate 10 to 15 more conventions as well as increasing the draw (and size) of existing convention events due to enhanced capacity.
As the privately-held trade centres add additional space, the Metro Toronto Convention Centre is likely to come under some pressure to accommodate trade and consumer show events. The convention events held at these private centres are, for the most part, expected to be local and/or regional (Ontario) based.
Current Five Year Ten Year2006 2010 2015
Conventions 272 300 320
Trade Shows 304 325 345Consumer Shows 143 155 170Source: HLT Advisory Inc.
* Includes public and private venues as well as large convention hotels.
Toronto Current and Projected Event Load*
Current Five Year Ten Year2006 2010 2015
Conventions 139 145 160
Trade Shows 28 30 35Consumer Shows 46 50 57Source: HLT Advisory Inc.
* Includes public and private venues as well as large convention hotels.
Ottawa Current and Projected Event Load*
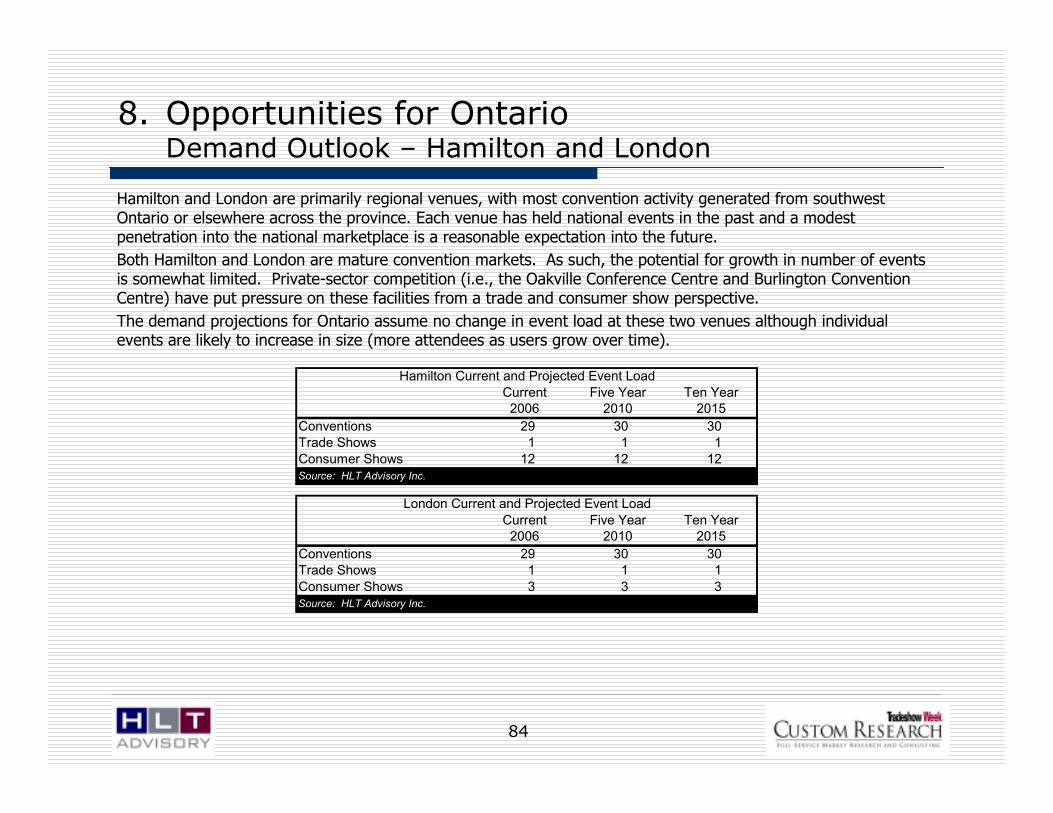
84
8. Opportunities for OntarioDemand Outlook – Hamilton and London
Hamilton and London are primarily regional venues, with most convention activity generated from southwest Ontario or elsewhere across the province. Each venue has held national events in the past and a modest penetration into the national marketplace is a reasonable expectation into the future.
Both Hamilton and London are mature convention markets. As such, the potential for growth in number of events is somewhat limited. Private-sector competition (i.e., the Oakville Conference Centre and Burlington Convention Centre) have put pressure on these facilities from a trade and consumer show perspective.
The demand projections for Ontario assume no change in event load at these two venues although individual events are likely to increase in size (more attendees as users grow over time).
Current Five Year Ten Year2006 2010 2015
Conventions 29 30 30Trade Shows 1 1 1
Consumer Shows 12 12 12Source: HLT Advisory Inc.
Hamilton Current and Projected Event Load
Current Five Year Ten Year2006 2010 2015
Conventions 29 30 30Trade Shows 1 1 1
Consumer Shows 3 3 3Source: HLT Advisory Inc.
London Current and Projected Event Load

85
8. Opportunities for OntarioDemand Outlook –Windsor and Niagara Falls
Similar to Hamilton and London, Niagara Falls and Windsor are primarily regional destinations from a public-assembly perspective. While both will likely host some national conventions, the majority of the convention activity will likely come from regional demand sources. As border communities, the “regional” draw will include demand from New York, Michigan and Ohio.
Aside from being border communities, these venues have much greater potential to generate demand from different sources than Hamilton and London. The Casino Windsor venue will be primarily used for entertainment purposes to drive casino demand. In Niagara Falls, the supporting tourism infrastructure (such as the commercial casinos, entertainment options not to mention the Falls themselves) enhance the destination’s appeal as a convention destination.
The Casino Windsor venue is projected to open in 2008. Event load estimates are presented based on the current understanding of Casino Windsor marketing focus, and recognition that as a venue primarily designed to service/generate casino demand, the marketing and sales approach will differ from all other public-assembly venues in Ontario.
Current Five Year Ten Year2006 2010 2015
Conventions 0 20 20Trade Shows 0 10 10
Consumer Shows 0 5 5Source: HLT Advisory Inc.
Windsor Current and Projected Event Load
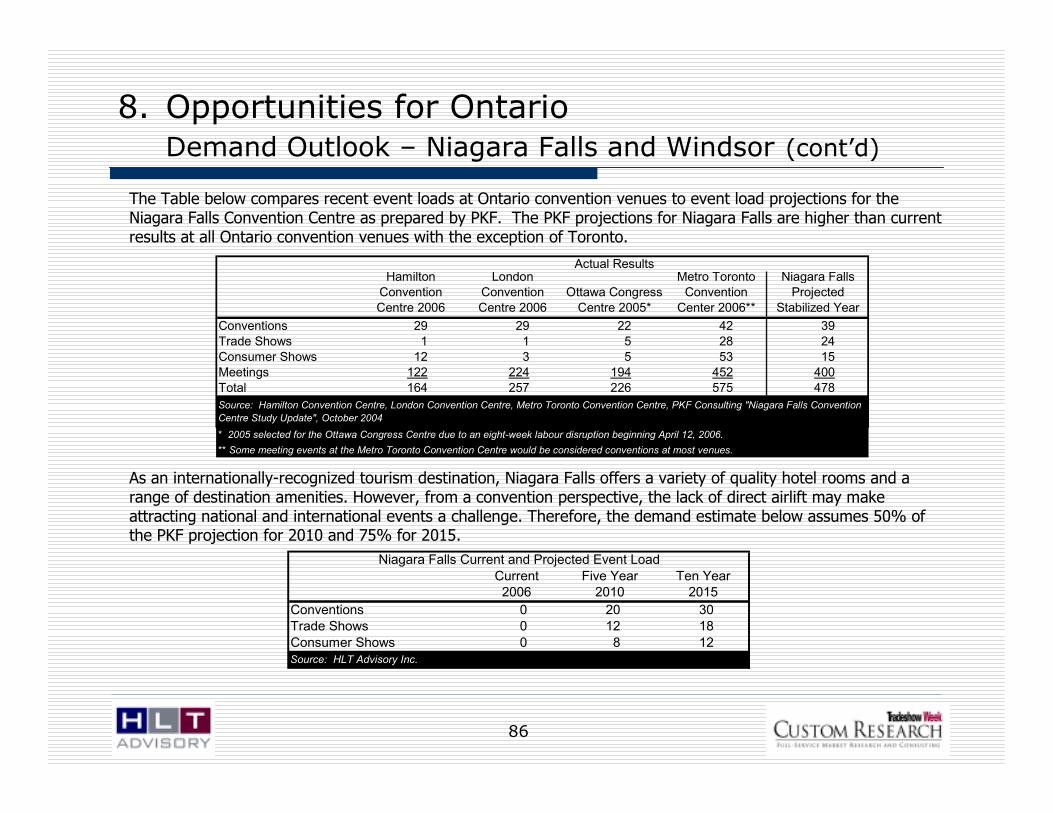
86
8. Opportunities for OntarioDemand Outlook – Niagara Falls and Windsor (cont’d)
The Table below compares recent event loads at Ontario convention venues to event load projections for the Niagara Falls Convention Centre as prepared by PKF. The PKF projections for Niagara Falls are higher than current results at all Ontario convention venues with the exception of Toronto.
As an internationally-recognized tourism destination, Niagara Falls offers a variety of quality hotel rooms and a range of destination amenities. However, from a convention perspective, the lack of direct airlift may make attracting national and international events a challenge. Therefore, the demand estimate below assumes 50% of the PKF projection for 2010 and 75% for 2015.
Current Five Year Ten Year2006 2010 2015
Conventions 0 20 30Trade Shows 0 12 18
Consumer Shows 0 8 12Source: HLT Advisory Inc.
Niagara Falls Current and Projected Event Load
Hamilton
Convention
Centre 2006
London
Convention
Centre 2006
Ottawa Congress
Centre 2005*
Metro Toronto
Convention
Center 2006**
Niagara Falls
Projected
Stabilized Year
Conventions 29 29 22 42 39
Trade Shows 1 1 5 28 24
Consumer Shows 12 3 5 53 15
Meetings 122 224 194 452 400
Total 164 257 226 575 478
* 2005 selected for the Ottawa Congress Centre due to an eight-week labour disruption beginning April 12, 2006.
** Some meeting events at the Metro Toronto Convention Centre would be considered conventions at most venues.
Source: Hamilton Convention Centre, London Convention Centre, Metro Toronto Convention Centre, PKF Consulting "Niagara Falls Convention
Centre Study Update", October 2004
Actual Results

87
Across North America demand growth, measured in terms of attendees and amount of exhibit/meeting space required for conventions, conferences, trade shows and consumer shows has been met or exceeded by the growth of new and expanded public-assembly venues. The supply/demand balance within Ontario does not necessarily reflect these North American trends except that Ontario venues competing in the national, North American and international marketplaces are facing competitive pressure caused, in part, by increased supply (together with a host of other controllable and uncontrollable factors).
The opportunity for Ontario, and specific Ontario destinations, within this industry sector varies considerably by destination and by event type. In our view:
• Toronto is capable of maintaining and furthering its position as a leading convention and trade show destination on both a national and international basis. The principal public- and private-sector venues are well positioned (supported by several expansion plans), the destination marketing efforts are well organized and funded, and Toronto offers a range of attributes required by event planners.
• Ottawa offers additional opportunity in the national convention, conference and to a limited extent, trade show market. Expanding the Ottawa Congress Centre will greatly assist Ottawa in realizing latent demand.
• Niagara Falls is a unique market located within the broader Toronto/south central Ontario area and adjacent to New York state. Opportunities exist for conference and convention business (likely provincial and national, as well as some trans-border).
• Opportunities in Windsor are tied to casino expansion and will draw on both the southwest Ontario and Michigan markets…although events will be tied to generating gaming demand first and foremost.
• London and Hamilton will remain strong competitors in the provincial marketplace.
8. Opportunities for OntarioConclusions

88
Appendix A
Rank Show Name NSF Attendance
1 Global Petroleum Show 524,264 39,843 2 CGTA Gift Show (Canadian Gift & Tableware Assn.) (Jan.) 425,377 21,895
3 CGTA Gift Show (Canadian Gift & Tableware Assn.) (Aug.) 425,341 17,126
4 The Canadian Home Furnishings Market 335,351 9,366 5 Canadian Intl. Farm Equipment Show 227,000 NS
6 Health & Safety Canada IAPA Conference & Trade Show (Industrial Accident Prevention Assn.) 210,000 6,000
7 Alberta Gift Show (Aug.) 196,762 14,460 8 Alberta Gift Show (Feb.) 196,602 15,547
9 Truck World 165,900 12,912
10 Montreal Gift Show (Aug.) 127,587 10,612 11 Montreal Gift Show (Mar.) 124,154 10,486
12 Congress featuring Fencecraft - Canada's Intl. Horticultural Lawn & Garden Trade Show & Conference 121,480 10,656
13 Construct Canada/PM Expo/Homebuilder & Renovator Expo/Design Trends/Concrete Canada/Global Property Market 110,800 17,464 14 HostEx 2006 103,920 9,326
15 NSIA Snow Show (Natl. Snow Industries Assn.) 102,481 2,107 16 American Psychiatric Assn. Annual Meeting 101,100 15,173
17 CMX-CIPHEX 2006 (Canadian Mechanicals Exposition) 97,000 8,952
18 Truxpo 2006 92,300 11,637 19 Canadian Assn. of Agri-Retailers Convention & Trade Show 92,000 595
20 PDAC Intl. Convention, Trade Show & Investors Exchange (Prospectors & Developers Assn. of Canada) 90,100 9,803
21 Montreal NAFEM - The Luxury Outerwear Show 90,000 3,945 22 ExpoCycle 87,700 2,278
23 Canadian Manufacturing Week/Weld Expo Canada/Finishing Expo Canada 80,915 5,226
24 IIDEX®/NeoCon® Canada 80,000 15,750 25 Vancouver Gift Show (Mar.) 76,500 4,941
26 Canadian Utilities Equipment & Engineering Show 75,845 3,041
27 CamExpo 75,487 7,000 28 Ontario Fashion Exhibitors (Sept.) 75,000 3,390
29 Allied Beauty Assn. Ontario Beauty Show 73,800 14,279
30 AAO-HNSF Annual Meeting & OTO Expo 69,800 6,121
Top 50 Canadian Trade Shows - 2006
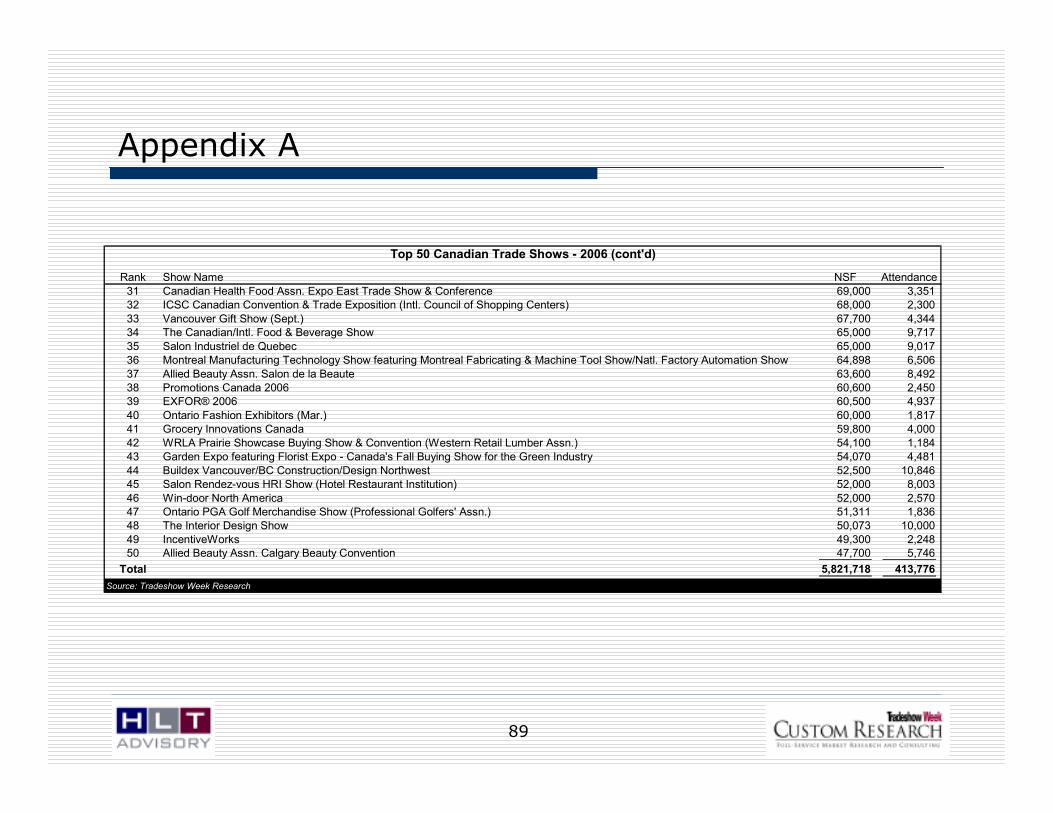
89
Appendix A
Rank Show Name NSF Attendance
31 Canadian Health Food Assn. Expo East Trade Show & Conference 69,000 3,351 32 ICSC Canadian Convention & Trade Exposition (Intl. Council of Shopping Centers) 68,000 2,300
33 Vancouver Gift Show (Sept.) 67,700 4,344 34 The Canadian/Intl. Food & Beverage Show 65,000 9,717
35 Salon Industriel de Quebec 65,000 9,017 36 Montreal Manufacturing Technology Show featuring Montreal Fabricating & Machine Tool Show/Natl. Factory Automation Show 64,898 6,506
37 Allied Beauty Assn. Salon de la Beaute 63,600 8,492 38 Promotions Canada 2006 60,600 2,450 39 EXFOR® 2006 60,500 4,937
40 Ontario Fashion Exhibitors (Mar.) 60,000 1,817 41 Grocery Innovations Canada 59,800 4,000
42 WRLA Prairie Showcase Buying Show & Convention (Western Retail Lumber Assn.) 54,100 1,184 43 Garden Expo featuring Florist Expo - Canada's Fall Buying Show for the Green Industry 54,070 4,481
44 Buildex Vancouver/BC Construction/Design Northwest 52,500 10,846 45 Salon Rendez-vous HRI Show (Hotel Restaurant Institution) 52,000 8,003
46 Win-door North America 52,000 2,570 47 Ontario PGA Golf Merchandise Show (Professional Golfers' Assn.) 51,311 1,836 48 The Interior Design Show 50,073 10,000
49 IncentiveWorks 49,300 2,248 50 Allied Beauty Assn. Calgary Beauty Convention 47,700 5,746
Total 5,821,718 413,776
Source: Tradeshow Week Research
Top 50 Canadian Trade Shows - 2006 (cont'd)
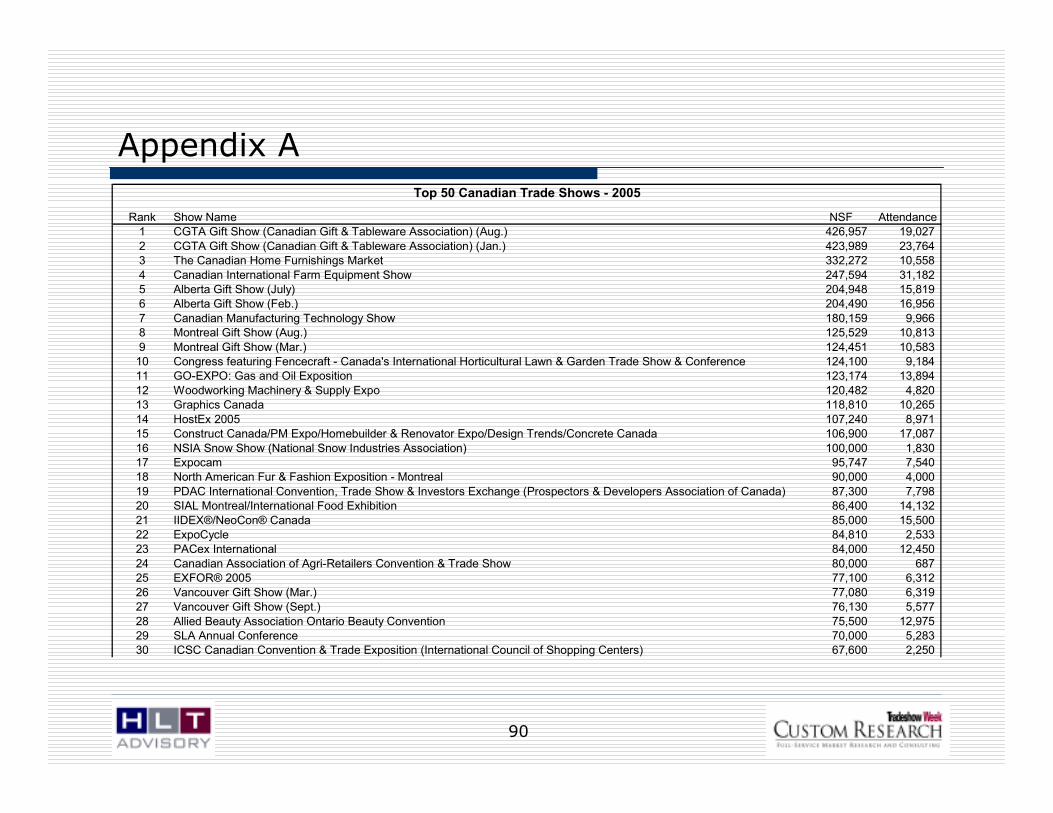
90
Appendix A
Rank Show Name NSF Attendance1 CGTA Gift Show (Canadian Gift & Tableware Association) (Aug.) 426,957 19,027
2 CGTA Gift Show (Canadian Gift & Tableware Association) (Jan.) 423,989 23,764 3 The Canadian Home Furnishings Market 332,272 10,558
4 Canadian International Farm Equipment Show 247,594 31,182 5 Alberta Gift Show (July) 204,948 15,819 6 Alberta Gift Show (Feb.) 204,490 16,956
7 Canadian Manufacturing Technology Show 180,159 9,966 8 Montreal Gift Show (Aug.) 125,529 10,813
9 Montreal Gift Show (Mar.) 124,451 10,583 10 Congress featuring Fencecraft - Canada's International Horticultural Lawn & Garden Trade Show & Conference 124,100 9,184 11 GO-EXPO: Gas and Oil Exposition 123,174 13,894
12 Woodworking Machinery & Supply Expo 120,482 4,820 13 Graphics Canada 118,810 10,265
14 HostEx 2005 107,240 8,971 15 Construct Canada/PM Expo/Homebuilder & Renovator Expo/Design Trends/Concrete Canada 106,900 17,087
16 NSIA Snow Show (National Snow Industries Association) 100,000 1,830 17 Expocam 95,747 7,540 18 North American Fur & Fashion Exposition - Montreal 90,000 4,000
19 PDAC International Convention, Trade Show & Investors Exchange (Prospectors & Developers Association of Canada) 87,300 7,798 20 SIAL Montreal/International Food Exhibition 86,400 14,132
21 IIDEX®/NeoCon® Canada 85,000 15,500 22 ExpoCycle 84,810 2,533 23 PACex International 84,000 12,450
24 Canadian Association of Agri-Retailers Convention & Trade Show 80,000 687 25 EXFOR® 2005 77,100 6,312
26 Vancouver Gift Show (Mar.) 77,080 6,319 27 Vancouver Gift Show (Sept.) 76,130 5,577
28 Allied Beauty Association Ontario Beauty Convention 75,500 12,975 29 SLA Annual Conference 70,000 5,283 30 ICSC Canadian Convention & Trade Exposition (International Council of Shopping Centers) 67,600 2,250
Top 50 Canadian Trade Shows - 2005

91
Appendix A
Rank Show Name NSF Attendance
31 American Association of Petroleum Geologists Annual Convention 66,000 4,513 32 The Canadian/International Food & Beverage Show 63,800 9,776 33 Society of Nuclear Medicine Annual Meeting 60,400 4,082 34 Canadian Health Food Association Expo East Trade Show & Conference 60,000 3,799
35 Promotions Canada 2005 60,000 2,445 36 Ontario Fashion Exhibitors (Mar.) 60,000 2,000 37 Ontario Fashion Exhibitors (Sept.) 60,000 2,000 38 Allied Beauty Association Salon de la Beaute 59,000 9,324
39 Allied Beauty Association Edmonton Beauty Convention 56,500 5,215 40 Win-door North America 55,000 3,300 41 Ontario PGA Golf Merchandise Show (Professional Golfers' Association) 54,530 1,931 42 Oil Sands Trade Show & Conference 54,120 2,425
43 Hockey & Sports Show 53,300 1,500 44 WRLA Prairie Showcase Trade Show & Convention (Western Retail Lumber Association) 52,200 1,053 45 Salon Rendez-vous HRI Show 51,500 7,300 46 Garden Expo featuring Florist Expo - Canada's Fall Buying Show for the Green Industry 51,150 3,319
47 Toronto International Gift Fair™ (Jan.) 50,970 5,247 48 The Interior Design Show 50,000 9,500 49 Buildex Vancouver/BC Construction Show/Design Northwest 48,500 10,141 50 IncentiveWorks 47,700 3,038
Total 5,322,432 409,983
Source: Tradeshow Week Research
Top 50 Canadian Trade Shows - 2005 (cont'd)

92
Appendix A
Rank Show Name NSF Attendance
1 Global Petroleum Show 510,000 36,660 2 CGTA Gift Show (Canadian Gift & Tableware Association) (Jan.) 426,908 22,791
3 CGTA Gift Show (Canadian Gift & Tableware Association) (Aug.) 426,139 21,086
4 Canadian International Farm Equipment Show 330,000 31,500
5 The Canadian Home Furnishings Market 323,367 10,669
6 Alberta Gift Show (Feb.) 205,650 18,030
7 Alberta Gift Show (Aug.) 205,020 16,651
8 Truck World 155,800 11,870
9 NSIA Snow Show (National Snow Industries Association) 137,500 2,532 10 Montreal Gift Show (Aug.) 124,624 11,755
11 Montreal Gift Show (Mar.) 122,603 12,899
12 Congress - Canada's International Horticultural Lawn & Garden Trade Show & Conference 113,270 11,426
13 Canadian Utilities Equipment & Engineering Show 107,996 4,809
14 HostEx 2004 106,880 9,952
15 Construct Canada/PM Expo/Homebuilder & Renovator Expo/Design Trends/Concrete Canada 101,700 16,193
16 North American Fur & Fashion Exposition - Montreal 92,000 4,385
17 Canadian Manufacturing Week/Weld Expo Canada/Finishing Expo Canada 91,795 7,104 18 EXFOR® 2004 89,000 6,506
19 CMX 2004 (Canadian Mechanicals Exposition) 86,000 11,413
20 PDAC International Convention, Trade Show & Investors Exchange (Prospectors & Developers Association of Canada) 84,700 5,610
21 Truxpo 2004 82,990 11,269
22 IIDEX®/NeoCon® Canada 80,000 15,000
23 Canadian Association of Agri-Retailers Convention & Trade Show 80,000 753
24 ExpoCycle 78,650 2,000
25 CamExpo 78,000 8,500 26 Allied Beauty Association Ontario Beauty Show 77,900 12,820
27 Vancouver Gift Show (Mar.) 77,740 6,198
28 Toronto International Gift Fair™ 77,220 5,924
29 Vancouver Gift Show (Sept.) 73,580 5,703
30 Montreal Fabricating & Machine Tool Show/National Factory Automation Show 72,722 6,888
Top 50 Canadian Trade Shows - 2004

93
Appendix A
Rank Show Name NSF Attendance31 The Canadian/International Food & Beverage Show 67,700 9,570
32 Allied Beauty Association Salon de la Beaute 67,500 10,130
33 ICSC Canadian Convention & Trade Exposition (International Council of Shopping Centers) 67,500 2,300
34 APCO International Annual Conference & Exposition (Association of Public-Safety Communications Officials) 67,300 2,686
35 Salon industriel de Quebec 65,000 7,708
36 Grocery Innovations Canada 61,200 6,600
37 Ontario Fashion Exhibitors Market (Sept.) 60,000 2,000 38 Ontario Fashion Exhibitors Market (Mar.) 60,000 2,000
39 Allied Beauty Association Edmonton Beauty Show 59,000 5,766
40 Toronto Gift & Accessories Market™ 57,570 4,000
41 Ontario PGA Golf Merchandise Show (Professional Golfers' Association) 57,370 2,151
42 CIM Tradex Edmonton 56,700 1,360
43 Canadian Health Food Association Expo East Trade Show & Conference 52,000 3,310 44 Salon Rendez-vous HRI Show 51,500 8,400
45 Garden Expo featuring Florist Expo - Canada's Fall Buying Show for the Green Industry 51,250 3,611
46 Canadian Waste & Recycling Expo/Canadian Public Works Expo 47,850 4,129
47 WRLA Prairie Showcase Trade Show (Western Retail Lumber Association) 47,400 1,082
48 Ontario Dental Association Annual Spring Meeting 47,300 7,456
49 SIBO: Salon Industriel du Bois Ouvre/Industrial Woodworking Show 47,264 5,271 50 Atlantic Building Materials Show 47,150 1,335
Total 5,758,308 439,761
Source: Tradeshow Week Research
Top 50 Canadian Trade Shows - 2004 (cont'd)
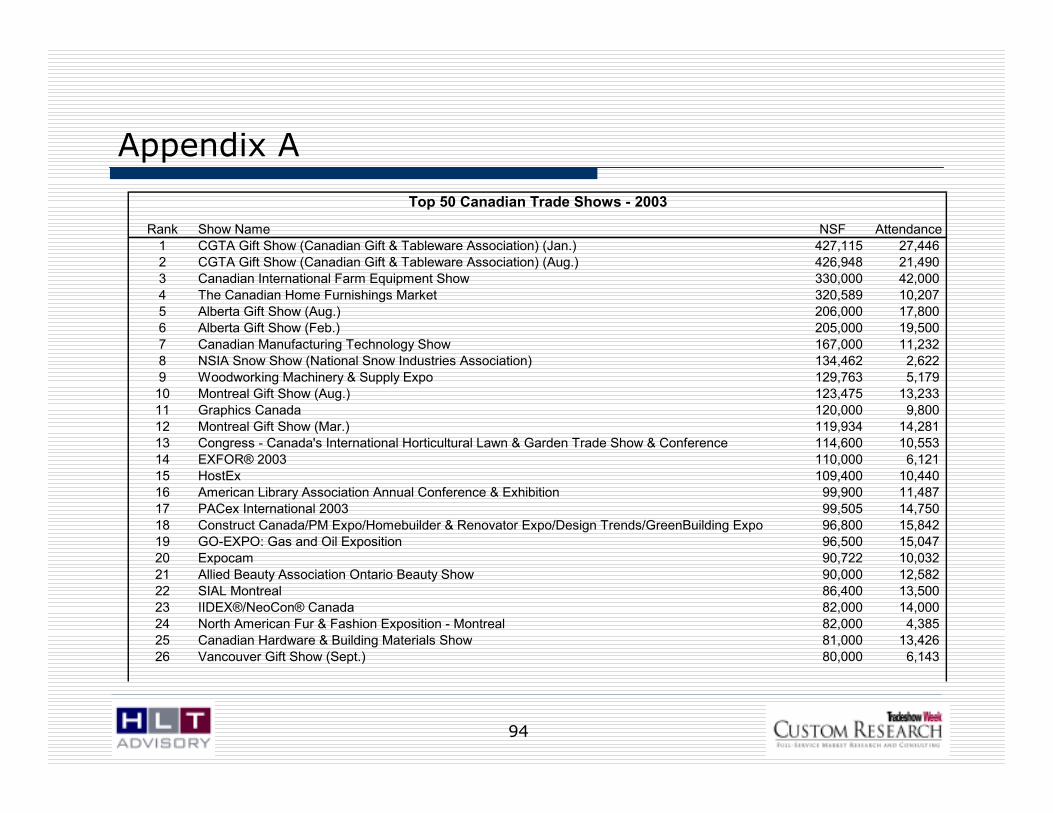
94
Appendix A
Rank Show Name NSF Attendance
1 CGTA Gift Show (Canadian Gift & Tableware Association) (Jan.) 427,115 27,446
2 CGTA Gift Show (Canadian Gift & Tableware Association) (Aug.) 426,948 21,490
3 Canadian International Farm Equipment Show 330,000 42,000
4 The Canadian Home Furnishings Market 320,589 10,207
5 Alberta Gift Show (Aug.) 206,000 17,800
6 Alberta Gift Show (Feb.) 205,000 19,500
7 Canadian Manufacturing Technology Show 167,000 11,232
8 NSIA Snow Show (National Snow Industries Association) 134,462 2,622
9 Woodworking Machinery & Supply Expo 129,763 5,179
10 Montreal Gift Show (Aug.) 123,475 13,233
11 Graphics Canada 120,000 9,800
12 Montreal Gift Show (Mar.) 119,934 14,281
13 Congress - Canada's International Horticultural Lawn & Garden Trade Show & Conference 114,600 10,553
14 EXFOR® 2003 110,000 6,121
15 HostEx 109,400 10,440
16 American Library Association Annual Conference & Exhibition 99,900 11,487
17 PACex International 2003 99,505 14,750
18 Construct Canada/PM Expo/Homebuilder & Renovator Expo/Design Trends/GreenBuilding Expo 96,800 15,842
19 GO-EXPO: Gas and Oil Exposition 96,500 15,047
20 Expocam 90,722 10,032
21 Allied Beauty Association Ontario Beauty Show 90,000 12,582
22 SIAL Montreal 86,400 13,500
23 IIDEX®/NeoCon® Canada 82,000 14,000
24 North American Fur & Fashion Exposition - Montreal 82,000 4,385
25 Canadian Hardware & Building Materials Show 81,000 13,426
26 Vancouver Gift Show (Sept.) 80,000 6,143
Top 50 Canadian Trade Shows - 2003

95
Appendix A
Rank Show Name NSF Attendance
27 Vancouver Gift Show (Mar.) 79,050 7,000 28 Canadian Association of Agri-Retailers Convention & Trade Show 78,500 1,176 29 Toronto International Gift Fair™ (Jan.) 78,420 5,298
30 ExpoCycle 76,740 2,650 31 Grocery Innovations Canada 67,800 6,500 32 ICSC Canadian Convention & Trade Exposition (International Council of Shopping Centers) 67,500 2,053
33 The Canadian/International Food & Beverage Show 66,900 10,977 34 Allied Beauty Association Salon de la Beaute 65,000 9,978 35 Canadian Waste & Recycling Expo/Canadian Public Works Expo 61,750 3,694 36 Toronto International Gift Fair™ (Aug.) 60,370 4,000
37 Ontario PGA Golf Merchandise Show (Professional Golfers' Association) 60,000 2,535 38 Ontario Fashion Exhibitors Market (Mar.) 60,000 2,000 39 Ontario Fashion Exhibitors Market (Sept.) 60,000 2,000
40 Allied Beauty Association Edmonton Beauty Show 60,000 4,512 41 CIM Tradex Montreal 2003 58,930 984 42 Garden Expo 2003 53,151 3,561 43 Rendez-vous Equipmag 50,000 7,000
44 CHFA Toronto Expo East Trade Show & Conference (Canadian Health Food Association) 50,000 2,279 45 Canadian Pool & Spa Conference & Expo 50,000 1,175 46 Plant Maintenance & Design Engineering Show & Weld Quebec 48,926 4,024
47 Atlantic Building Materials Show 45,750 1,304 48 Ontario Dental Association Annual Spring Meeting 45,700 7,160 49 ISA Calgary Instrumentation Show 2003 45,590 4,116 50 Win-door North America 45,000 3,300
Total 5,464,190 452,374
Source: Tradeshow Week Research
Top 50 Canadian Trade Shows - 2003 (cont'd)