ont. 2016 - rbc · downgraded our national growth forecast to 1.4% (from 1.8% previously), quebec...
TRANSCRIPT

Paul Ferley
Assistant Chief Economist
416-974-7231
Robert Hogue
Senior Economist
416-974-6192
Gerard Walsh
Economist
416-974-6525
PROVINCIAL OUTLOOK June 2016
Complex adjustments still ongoing across provinces in 2016
The outlook for provincial economies continues to vary substantially across Canada.
Oil-producing provinces face another year of contraction of activity in 2016; whereas, all oil-consuming provinces are set to grow, and quite vigorously in the case of British Columbia, Ontario, and to a lesser extent, Manitoba.
We have lowered our 2016 GDP forecast for Alberta to -2.5% from -1.6% previously to re-flect a weaker than expected start to 2016 and the negative effects of the horrific wildfires that devastated Fort McMurray and disrupted oil sands products in May.
On the other hand, we have slightly boosted our GDP growth forecasts for a few provinces in 2016, including Ontario and British Columbia, to reflect stronger than expected activity—especially in the household sector—in the early months of 2016.
Our provincial growth rankings for 2016 continue to place British Columbia in first position with a growth rate of 3.0%, followed by Ontario (2.8%) and Manitoba (2.3%). Because we downgraded our national growth forecast to 1.4% (from 1.8% previously), Quebec (1.5%) has become the only other province that we project to grow at a faster rate than the national average. Along with Alberta, we expect the economies of Newfoundland and Labrador and Saskatchewan to contract slightly in 2016.
We have also made several modest changes to our 2017 outlook for the provinces, which were in keeping with downward revisions that we made to our macroeconomic assumptions (we now expect the national economy to grow by 2.0% next year, which is down from our previous forecast of 2.3%). The majority of these changes have resulted in slightly slower expected provincial growth next year, except for Alberta where we boosted growth to account for the rebuilding work in Fort McMurray and a lower base for oil production in 2016.
More of the same in 2016
The complex adjustments to sharply lower energy oil prices that provincial economies began to
undergo in 2015 will continue to unfold in 2016, and we expect that they will result in a marked
divergence in provincial growth rates similar to what we saw last year—with oil-producing prov-
inces mired in recession at one end of the spectrum, and a trio of oil-consuming provinces seeing
material growth at the other end. Despite recent increases in oil prices, our working assumption
is that they will stay at weak enough levels—the West Texas Intermediate (WTI) benchmark
averaging US$41/barrel in 2016—to constrain revenues and lead to further substantial declines
in capital spending in the energy sector in 2016. Such would continue to weigh heavily on the
performance of oil-producing provinces. On the other hand, oil-consuming provinces such as
British Columbia, Ontario, and to a lesser extent, Manitoba will continue to lead growth thanks
to accommodative interest rates, low energy costs, a depreciated Canadian dollar, and improved
US demand.
Capital expenditure intentions disappoint
The poor outlook for capital expenditures in the energy sector was corroborated by the recent
release of Statistics Canada’s survey of capital expenditure intentions (CAPEX survey), which
showed that oil and gas extraction firms plan to cut their capital spending by 26% in 2016, which
would be on the heels of an even larger reduction of 35% in 2015, much of it taking place in
Alberta. While continued retrenchment in this sector was widely anticipated, the CAPEX survey
also revealed downbeat intentions by firms in other private-sector industries across Canada,
which was disappointing to see. Quebec and Nova Scotia are the only two provinces where the
private sector plans to boost its spending in 2016. Higher public sector expenditures will fill at
least part of the gap in most provinces, however.
Real GDP growth % change
Source: Statistics Canada, RBC Economics Research
-4 -3 -2 -1 0 1 2 3 4 5
ALTA.
N.& L.
SASK.
N.S.
CANADA
QUE.
P.E.I
N.B.
MAN.
ONT.
B.C.
2015
-4 -3 -2 -1 0 1 2 3 4 5
ALTA.
N.& L.
SASK.
N.B.
P.E.I
N.S.
CANADA
QUE.
MAN.
ONT.
B.C.
2016
-4 -3 -2 -1 0 1 2 3 4 5
N.& L.
N.B.
P.E.I
N.S.
QUE.
SASK.
CANADA
ALTA.
B.C.
MAN.
ONT.
2017
RBC ECONOMICS | RESEARCH
2
PROVINCIAL OUTLOOK | JUNE 2016
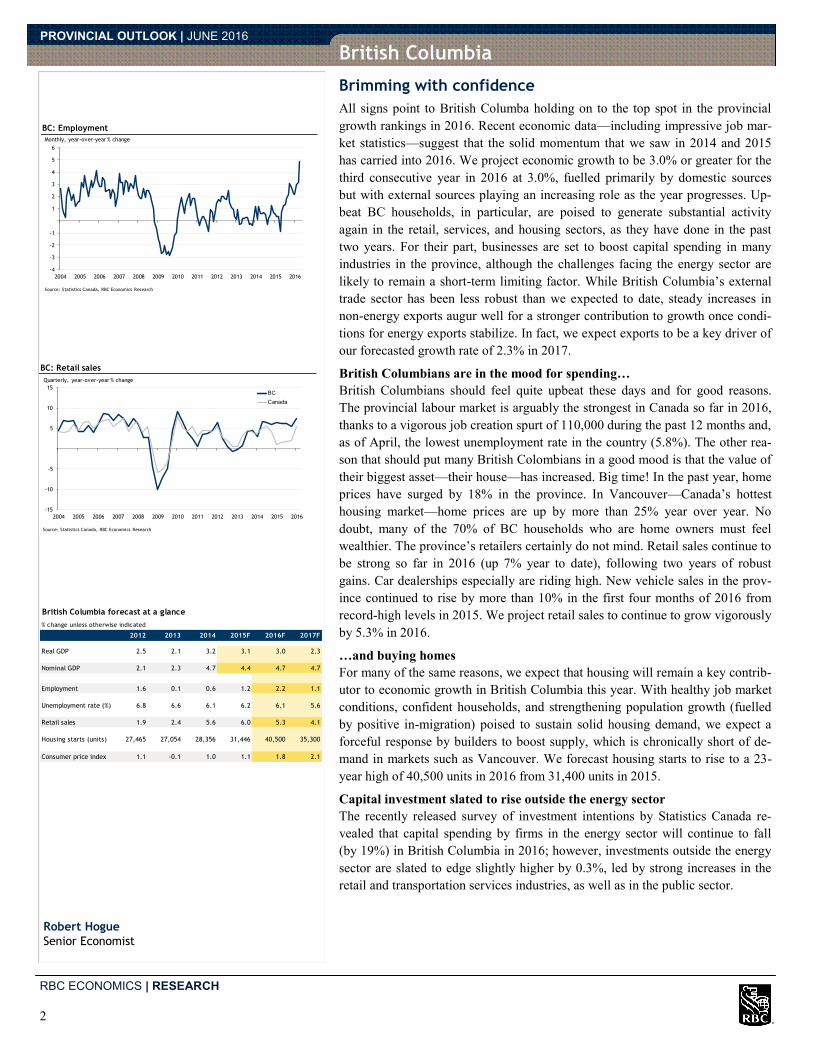
Brimming with confidence
All signs point to British Columba holding on to the top spot in the provincial
growth rankings in 2016. Recent economic data—including impressive job mar-
ket statistics—suggest that the solid momentum that we saw in 2014 and 2015
has carried into 2016. We project economic growth to be 3.0% or greater for the
third consecutive year in 2016 at 3.0%, fuelled primarily by domestic sources
but with external sources playing an increasing role as the year progresses. Up-
beat BC households, in particular, are poised to generate substantial activity
again in the retail, services, and housing sectors, as they have done in the past
two years. For their part, businesses are set to boost capital spending in many
industries in the province, although the challenges facing the energy sector are
likely to remain a short-term limiting factor. While British Columbia’s external
trade sector has been less robust than we expected to date, steady increases in
non-energy exports augur well for a stronger contribution to growth once condi-
tions for energy exports stabilize. In fact, we expect exports to be a key driver of
our forecasted growth rate of 2.3% in 2017.
British Columbians are in the mood for spending…
British Columbians should feel quite upbeat these days and for good reasons.
The provincial labour market is arguably the strongest in Canada so far in 2016,
thanks to a vigorous job creation spurt of 110,000 during the past 12 months and,
as of April, the lowest unemployment rate in the country (5.8%). The other rea-
son that should put many British Colombians in a good mood is that the value of
their biggest asset—their house—has increased. Big time! In the past year, home
prices have surged by 18% in the province. In Vancouver—Canada’s hottest
housing market—home prices are up by more than 25% year over year. No
doubt, many of the 70% of BC households who are home owners must feel
wealthier. The province’s retailers certainly do not mind. Retail sales continue to
be strong so far in 2016 (up 7% year to date), following two years of robust
gains. Car dealerships especially are riding high. New vehicle sales in the prov-
ince continued to rise by more than 10% in the first four months of 2016 from
record-high levels in 2015. We project retail sales to continue to grow vigorously
by 5.3% in 2016.
…and buying homes
For many of the same reasons, we expect that housing will remain a key contrib-
utor to economic growth in British Columbia this year. With healthy job market
conditions, confident households, and strengthening population growth (fuelled
by positive in-migration) poised to sustain solid housing demand, we expect a
forceful response by builders to boost supply, which is chronically short of de-
mand in markets such as Vancouver. We forecast housing starts to rise to a 23-
year high of 40,500 units in 2016 from 31,400 units in 2015.
Capital investment slated to rise outside the energy sector
The recently released survey of investment intentions by Statistics Canada re-
vealed that capital spending by firms in the energy sector will continue to fall
(by 19%) in British Columbia in 2016; however, investments outside the energy
sector are slated to edge slightly higher by 0.3%, led by strong increases in the
retail and transportation services industries, as well as in the public sector.
British Columbia
Robert Hogue
Senior Economist
-4
-3
-2
-1
1
2
3
4
5
6
2004 2005 2006 2007 2008 2009 2010 2011 2012 2013 2014 2015 2016
Source: Statistics Canada, RBC Economics Research
Monthly, year-over-year % change
BC: Employment
-15
-10
-5
5
10
15
2004 2005 2006 2007 2008 2009 2010 2011 2012 2013 2014 2015 2016
BC
Canada
Source: Statistics Canada, RBC Economics Research
Quarterly, year-over-year % change
BC: Retail sales
British Columbia forecast at a glance
% change unless otherwise indicated
2012 2013 2014 2015F 2016F 2017F
Real GDP 2.5 2.1 3.2 3.1 3.0 2.3
Nominal GDP 2.1 2.3 4.7 4.4 4.7 4.7
Employment 1.6 0.1 0.6 1.2 2.2 1.1
Unemployment rate (%) 6.8 6.6 6.1 6.2 6.1 5.6
Retail sales 1.9 2.4 5.6 6.0 5.3 4.1
Housing starts (units) 27,465 27,054 28,356 31,446 40,500 35,300
Consumer price index 1.1 -0.1 1.0 1.1 1.8 2.1

RBC ECONOMICS | RESEARCH
3
PROVINCIAL OUTLOOK | JUNE 2016
Alberta
Cannot catch a break
It seems that Alberta cannot catch a break these days. Already facing tremendous
adversity since oil prices plummeted in mid-2014, the province received another
blow in May 2016 when horrific wildfires devastated large parts of Fort McMur-
ray and disrupted major oil sands operations in the region. While the full extent
of the economic costs of the fires is still largely unknown, we assume that it will
translate into a loss of approximately 0.5 percentage points for Alberta’s real
gross domestic product (GDP) in 2016. We have lowered our economic growth
forecast for 2016 by a greater extent— to -2.5% from -1.6% in the March Pro-
vincial Outlook report—however, because conditions were weaker than we ex-
pected prior to the wildfires. If there can be a silver lining for gut-wrenching
disasters such as this, however, it is that growth in 2017 is likely to be stronger
than previously expected due to the lower oil production base in 2016 and re-
building work that will take place in Fort McMurray. We have revised our 2017
growth forecast upwardly to 2.2% from 2.0% previously.
Forest fires another blow to the provincial economy
The horrific wildfires that caused the evacuation of Fort McMurray—the resi-
dential hub for oil sands operations—at the beginning of May 2016 took an enor-
mous toll on many families and businesses, many of whom saw their properties
destroyed. Although the fires did not damage oil sands production and transpor-
tation infrastructures, nearly half of oil sands capacity was shut down during the
month of May—both for precautionary reasons and to allow workers (many of
them Fort McMurray evacuees) to deal with difficult personal matters. The situa-
tion remained fluid at the time of writing, with large oil sands projects still partly
or entirely offline, and the extent and timeline of reconstruction work on de-
stroyed properties still largely unknown. Nonetheless, we estimate that the loss
of oil production due to the fires, alone, will knock between 0.8 percentage
points and 1.2 percentage points off Alberta’s 2016 growth (depending on the
speed that oil sands production returns to pre-crisis levels). We expect some off-
set from reconstruction work to kick in during the second half of 2016 that will
temper the overall hit to the economy from the energy sector in 2016. At this
juncture, our working assumption is that the net effect of the fires will slice ap-
proximately 0.5 percentage point from Alberta’s real GDP growth in 2016.
Tougher 2015 than expected…
The first set of provincial GDP estimates for 2015 released recently by Statistics
Canada showed that Alberta’s recession last year was much deeper than we had
believed with real GDP by industry plummeting by 4.0% in 2015 (our most re-
cent forecast was -1.8%). The estimates confirmed the sharp downturns in engi-
neering construction, oil and gas services, and manufacturing; however, it re-
vealed greater weakness than we anticipated in several service industries, includ-
ing in wholesale and retail trade, and accommodation and food services.
…but improved outlook for 2017
Looking ahead to 2017, we expect Alberta’s economy finally to grow again after
two very difficult years. While short-term prospects for major investments in the
energy sector remain grim—despite oil prices gaining ground—the outlook for
oil production is positive, with the lower base in 2016 setting up for a stronger
rate of increase in 2017 than we had previously expected. The rebuilding of Fort
McMurray will also contribute to growth next year and beyond.
Robert Hogue
Senior Economist
50
100
150
200
250
300
350
400
450
2012 2013 2014 2015 2016
Source: National Energy Board, RBC Economics Research
Monthly, million cubic meters per day
Alberta: Non-conventional oil production
10
20
30
40
50
60
70
2006 2007 2008 2009 2010 2011 2012 2013 2014 2015 2016
*IntentionsSource: Statistics Canada, RBC Economics Research
Billions $
Alberta: Oil and gas extraction industry capital expenditures
*
Alberta forecast at a glance
% change unless otherwise indicated
2012 2013 2014 2015F 2016F 2017F
Real GDP 3.9 5.1 4.8 -3.5 -2.5 2.2
Nominal GDP 4.3 10.2 9.1 -12.1 -5.4 10.8
Employment 3.5 2.5 2.2 1.2 -1.8 0.9
Unemployment rate (%) 4.6 4.6 4.7 6.0 7.9 7.2
Retail sales 7.0 6.9 7.5 -4.6 -3.4 2.0
Housing starts (units) 33,396 36,011 40,590 37,282 24,100 25,000
Consumer price index 1.1 1.4 2.6 1.2 1.3 2.1

RBC ECONOMICS | RESEARCH
4
PROVINCIAL OUTLOOK | JUNE 2016
Activity weighed down by low oil prices
As a major oil-producing province, Saskatchewan has been negatively affected
by the drop in oil prices. Although greater economic diversification compared to
Alberta and Newfoundland and Labrador (Canada’s other major oil-producing
provinces) has helped temper the negative shock in the province, it did not pre-
vent GDP growth in Saskatchewan from declining by an estimated 1.1% in 2015.
Low oil prices and attendant reductions in capital expenditure within the prov-
ince’s energy sector are expected to continue to weigh on growth this year and
result in overall GDP declining again in 2016, albeit marginally by 0.2%. The
projected recovery in agricultural production is the main factor preventing a
more significant drop in activity in 2016. Our assumption of a recovery in oil
prices, on an annual average basis, next year contributes to 2017 GDP growth
turning positive rising 1.8%.
2016 growth revised lower
We have revised downward our GDP growth forecast significantly in Saskatche-
wan this year from the 1.2% increase projected in the March issue of Provincial
Outlook. This is in part a reflection of indications of worsening labour market
conditions with employment growth turning negative in the early months of
2016. This has contributed to the unemployment rate rising to 5.9% in the first
quarter from the 5.5% that prevailed in the final quarter of 2015 and the 2015
average of 5.0%. The downward revision to growth is also the reflection of dis-
appointing capital expenditure survey numbers that have been recently released.
These survey numbers implied that overall capital expenditure is likely to de-
cline by 18% in 2016, which would represent little change from the sizeable
17% drop recorded in 2015. Our previous assumption had been for the pace of
decline to ease in 2016. Weak investment intentions this year are largely concen-
trated in the energy sector reflecting low oil prices. Our expectation is oil prices
will recover on a sustained basis in 2017, and that would be consistent with a
cessation of declining investment activity next year.
Potash production hurt by weak demand
The persistence of low oil prices this year is expected to result in oil production
continuing to decline in 2016. The mining sector is also expected to be weighed
down by indications of cutbacks in potash production as the market confronts
weakening global demand and low prices for this key input to agricultural ferti-
lizers. While potash production was up almost 16% in 2015, there was a clear
slowing pattern during the year. We assume that these declines will persist during
2016 with activity dropping by about 8%. We expect potash production to stabi-
lize in 2017 and reflect expected strengthening in global growth next year.
Agricultural production projected to rebound
The main offset to these expected areas of declining activity is strengthening
agricultural production. This sector was hampered by adverse growing condi-
tions in 2015 that resulted in output in the sector declining marginally by 0.5%.
Our assumption of a return to more ‘normal’ weather conditions this year and
next is projected to result in activity in the sector rebounding by 8.0% in 2016
and 4.0% in 2017. If the projected rebound in agricultural production this year
were derailed by another year of adverse weather conditions, then it could result
in overall GDP activity declining more significantly for a second consecutive
year.
Saskatchewan
Paul Ferley
Assistant Chief Economist
-20
-15
-10
-5
0
5
10
15
20
25
2010 2011 2012 2013 2014 2015 2016
Saskatchewan
Canada
*IntentionsSource: Statistics Canada, RBC Economics Research
Saskatchewan: Total capital expenditures
Year-over-year % change
*
Saskatchewan forecast at a glance
% change unless otherwise indicated
2012 2013 2014 2015F 2016F 2017F
Real GDP 1.7 5.8 1.9 -1.1 -0.2 1.8
Nominal GDP 4.2 7.1 -0.9 -6.0 0.3 6.3
Employment 2.4 3.1 1.0 0.5 -1.4 0.4
Unemployment rate (%) 4.7 4.1 3.8 5.0 6.7 6.6
Retail sales 7.4 5.1 4.6 -3.5 -0.2 3.1
Housing starts (units) 9,968 8,290 8,257 5,149 4,900 6,800
Consumer price index 1.6 1.4 2.4 1.6 1.8 2.9
-30
-20
-10
0
10
20
30
40
2012 2013 2014 2015 2016
Source: Statistics Canada, RBC Economics Research
Saskatchewan: Potash production
Year-over-year % change

RBC ECONOMICS | RESEARCH
5
PROVINCIAL OUTLOOK | JUNE 2016
Manitoba
Paul Ferley
Assistant Chief Economist
Carrying positive momentum into 2016
Recently released preliminary estimates of 2015 provincial GDP growth for
Manitoba indicated greater-than-assumed 2.3% growth in the province last year
compared to the 1.8% that we had penciled in previously. A key source of unex-
pected strength was construction spending, which grew almost 10% and was
more than double the rate we had been assumed. Although the pace of construc-
tion spending is projected to moderate during the forecast, the sector is still ex-
pected to be a main contributor to growth in the province. This, along with an
expected strengthening in other areas of the Manitoba economy, such as manu-
facturing, is expected to result in the economy generally maintaining last year’s
pace during the forecast period rising by 2.3% in 2016 and 2.4% in 2017.
Business investment expected to continue to support growth
Confidence that investment spending will continue to be an important contribu-
tor to growth was provided by the recently released CAPEX survey numbers.
The report indicated that, although nominal construction spending was expected
to slow relative to 2015’s impressive increase of 19.4%, the projected 2016 rise
in construction spending of 7.0% still represented a solid increase and outpaced
most other provinces. The survey results are consistent with indications of ongo-
ing major expenditures by Manitoba Hydro on both the Keeysak Generating Sta-
tion and the Bipole III Transmission Line. The increase is also consistent with
anecdotal reports that expenditure will get underway this year on a major com-
mercial-residential project in downtown Winnipeg, with spending on this devel-
opment expected to continue for a number of years.
Manufacturing activity expected to strengthen
Although manufacturing sales activity in Manitoba disappointingly declined by
1.5% in 2015, the quarterly detail indicated positive growth, on a year-over-year
basis, in the final quarter of 2015. Encouragingly, data during the first quarter of
2016 indicated that growth has continued with the pace rising marginally. Rising
manufacturing activity has been long anticipated to benefit from expected in-
creased export demand via solid US domestic spending and a depreciating Cana-
dian dollar. These factors have been contributing to strengthening some manu-
facturing sub-sectors such as transportation equipment and furniture products;
however, this had been more than offset by weakness in areas of manufacturing
such as machinery and fabricated metals that were more dependent on the sizea-
ble energy sector in Manitoba’s neighbouring provinces of Alberta and Sas-
katchewan. The improvement in manufacturing activity in the last two quarters
has reflected some easing in the weakness in these latter areas. Our forecast as-
sumes that the supportive factors of strong US demand and a weak Canadian
dollar will increasingly dominate activity in the manufacturing sector in Manito-
ba and contribute to modest growth on a volumes basis of 3.0% to 4.0% during
the next two years.
Growth in agriculture to continue at a more moderate pace
The agricultural sector was also an important contributor to growth in 2015, with
the volume of activity rising by almost 9%. The assumption of normal growing
conditions during the forecast implies continued increases in output although
with the pace expected to moderate to 5.5% this year and 2.0% in 2017.
-15
-10
-5
0
5
10
15
20
25
2010 2011 2012 2013 2014 2015 2016
Manitoba
Canada
*IntentionsSource: Statistics Canada, RBC Economics Research
Manitoba: Capital expenditures, construction
Year-over-year % change
*
-6
-4
-2
0
2
4
6
8
2012 2013 2014 2015 2016
Source: Statistics Canada, RBC Economics Research
Manitoba: Manufacturing sales
Year-over-year % change
Manitoba forecast at a glance
% change unless otherwise indicated
2012 2013 2014 2015F 2016F 2017F
Real GDP 3.0 2.4 2.3 2.3 2.3 2.4
Nominal GDP 6.4 3.5 3.5 3.6 3.9 4.6
Employment 1.6 0.7 0.1 1.6 0.5 1.2
Unemployment rate (%) 5.3 5.4 5.4 5.6 5.6 5.3
Retail sales 1.3 3.9 4.3 1.5 4.7 4.3
Housing starts (units) 7,242 7,465 6,220 5,501 5,700 6,800
Consumer price index 1.6 2.3 1.8 1.2 1.4 2.4

RBC ECONOMICS | RESEARCH
6
PROVINCIAL OUTLOOK | JUNE 2016
On a roll and poised to outperform
Ontario’s economy has been on a roll lately, thereby leading us to believe that
growth will be the strongest in six years in 2016. External trade has shown en-
couraging signs since the middle of 2015; however, it is the household sector
that remains the main driving force in the province at this stage. Not only is
household spending on goods and services growing at a rapid clip, but also
household investment in residential structures (both new and existing) continues
to defy expectations of a ‘soft landing’ and keeps fuelling substantial economic
activity in the province. With interest rates anticipated to stay low, the Canadian
dollar continuing to hover around levels keeping Ontario firms internationally
competitive, and governments intent on stoking the economy, we believe that the
elements will be in place for Ontario to outperform the national economy for a
third-straight year in 2016. We forecast growth to accelerate slightly from a solid
2.6% in 2015 to 2.8% in 2016. Our outlook for 2017 calls for only a modest
slowing in the pace to 2.5%.
Households carrying much of the load
Ontario households were a key driver of growth in the province in 2015, and this
was clearly in evidence in the fourth quarter. Statistics compiled by the Ontario
Ministry of Finance (OMF) showed that household spending and investment in
residential structures effectively accounted for the entire growth in the provincial
economy in the fourth quarter (estimated at 3.1%, annualized). Household
spending on goods and services grew the most (4.8% annualized) in the province
since the end of 2010, and residential investment surged by 11.2%, thereby
building further on very strong increases earlier last year. Early signs suggest
that Ontarians remained very active so far in 2016. They have continued to buy
new motor vehicles and existing homes in record numbers, and also pumped up
sales at retailers other than car dealerships. While we expect some moderation in
home resales later this year—due to deteriorating affordability—we believe that
households will continue to carry much of the load in 2016.
Net trade starting to pitch in
A central theme of our Ontario outlook story is that we expect external trade to
contribute increasingly to growth. Although we were disappointed by the lack of
traction in the first half of 2015 (partly explained by special factors), recent de-
velopments point to encouraging gains on that front. OMF estimates show that
net trade bounced back in both the third and fourth quarters of 2015—driven
higher by sizable advances in international exports. Monthly merchandise trade
statistics suggest that this continued to be the case in the first quarter of 2016
thanks to increases in most major export categories, including motor vehicle and
parts. We continue to believe that a strengthening external trade sector will
broaden Ontario’s expansion going forward.
If only businesses could boost their investments
Where we risk being disappointed this year is capital investment in the province.
The recently released CAPEX survey indicated that firms plan to cut back capital
expenditures marginally by 0.1% in 2016 (on the heels of a strong 9.6% boost in
2015), with the private sector (-0.7%) accounting for the entire decline (public-
sector organizations intend to boost their capital outlays by 0.7%). Should this
survey prove to be an accurate reflection of actual spending, then the scope for a
meaningful increase in Ontario’s production capacity would be limited in 2016.
Ontario
Robert Hogue
Senior Economist
200
220
240
260
280
300
320
340
360
2004 2005 2006 2007 2008 2009 2010 2011 2012 2013 2014 2015 2016
Exports
Imports
Source: Ontario Ministry of Finance, RBC Economics Research
Quarterly, billions of chained 2007 $
Ontario: External trade
-4
-2
2
4
6
8
2004 2005 2006 2007 2008 2009 2010 2011 2012 2013 2014 2015 2016
Source: Ontario Ministry of Finance, RBC Economics Research
Quarterly % change, annualized
Ontario: Household consumption expenditures
Ontario forecast at a glance
% change unless otherwise indicated
2012 2013 2014 2015F 2016F 2017F
Real GDP 1.3 1.3 2.7 2.6 2.8 2.5
Nominal GDP 3.1 1.9 4.1 4.1 4.7 4.4
Employment 0.7 1.8 0.8 0.7 1.3 1.0
Unemployment rate (%) 7.9 7.6 7.3 6.8 6.5 6.0
Retail sales 1.6 2.3 5.0 4.2 5.5 4.2
Housing starts (units) 76,742 61,085 59,134 70,156 72,300 65,800
Consumer price index 1.4 1.1 2.3 1.2 1.8 2.3

RBC ECONOMICS | RESEARCH
7
PROVINCIAL OUTLOOK | JUNE 2016
Quebec
Bringing it up a notch
Quebec’s economic performance has been quite uneven in the past few years,
and recent developments have been no exceptions. Fortunately, the provincial
economy started 2016 on a strong footing with signs that a number of key eco-
nomic sectors picked up their pace in the early months of this year after a disap-
pointing finish to 2015. While the road ahead will likely remain bumpy, we be-
lieve that the provincial economy is now engaged in a modestly higher growth
trajectory. Quebec is among the provinces standing to benefit most from the low-
er value of the Canadian dollar and reasonably healthy conditions in the US mar-
kets. Moreover, new data support our view that business investment in the prov-
ince will finally begin to turn around this year following a long period of decline.
We forecast real GDP growth to accelerate to 1.5% in 2016 and 1.7% in 2017
from 1.1% in 2015.
Good start to 2016…
Early indications suggest that Quebec’s economic activity bounced back in the
first quarter of 2016 from a slight contraction in the fourth quarter of 2015. Esti-
mates from the Institut de la statistique du Québec (ISQ) showed that monthly
real GDP picked up noticeably in January and February, thereby setting the stage
for a solid quarterly growth of 3.4% (annualized) in the first quarter of 2016,
according to our latest monitoring. The ISQ estimates reveal that key industries
posted welcome gains relative to the fourth quarter of 2015, including manufac-
turing, retail trade, transportation services, accommodation and food services,
and public administration, which augur well for further broad-based advances in
the remainder of 2016. In the case of manufacturing, solid growth occurred de-
spite continued softness in the aerospace equipment industry, as strong gains in
industries such as food products, fabricated metal products, paper, and furniture
carried the day. In the case of public administration, the pickup in activity fol-
lowing more than five years of virtual stagnation may be a sign that stringent
fiscal restraint has begun to ease at the provincial level. In its March 2016 budg-
et, the Quebec government confirmed that it balanced its books in the 2015-16
fiscal year and that it is on track to do continue to do so for the next five years.
…despite some export inertia
One element coming short of our expectations early this year has been external
trade. More specifically, real merchandise exports were up by a meagre 1.7%
year over year in the first quarter of 2016, which suggests to us that the rotation
toward external sources of growth has nearly stalled after making such great
progress in the province in 2014 and 2015. A dip in exports of aircrafts and parts
has significantly offset strong advances in sales abroad of electricity, pharmaceu-
tical products, and minerals (e.g., iron ore and copper). Nonetheless, we continue
to believe that external trade will play an increasing part of Quebec’s growth
story going forward.
Positive outlook for business investment at last
We also believe that business investment will play a positive role in that story.
Our view received support from Statistics Canada’s latest CAPEX survey, which
showed that firms plan to boost capital spending by 7.1% in the province in
2016. Particularly encouraging was the fact that Quebec was one of only two
provinces where firms in the private sector intend to increase investment—
including a big 17% boost in manufacturing.
Robert Hogue
Senior Economist
-5
-4
-3
-2
-1
0
1
2
3
4
5
6
2005 2006 2007 2008 2009 2010 2011 2012 2013 2014 2015 2016
Source: Instistut de la statistique du Québec, RBC Economics Research
Quarterly % change, annualized
Quebec: Real GDP
-15
-10
-5
5
10
2007 2008 2009 2010 2011 2012 2013 2014 2015 2016
Public
Private
Total
*IntentionsSource: Statistics Canada, RBC Economics Research
Annual % change
Quebec: Capital expenditures
*
Quebec forecast at a glance
% change unless otherwise indicated
2012 2013 2014 2015F 2016F 2017F
Real GDP 1.0 1.2 1.5 1.1 1.5 1.7
Nominal GDP 2.7 2.0 2.5 2.6 3.2 3.5
Employment 0.8 1.4 0.0 0.9 0.8 0.7
Unemployment rate (%) 7.7 7.6 7.7 7.6 7.6 7.4
Retail sales 1.2 2.5 1.7 0.5 3.9 3.8
Housing starts (units) 47,367 37,758 38,810 37,926 36,100 34,500
Consumer price index 2.1 0.8 1.4 1.1 1.4 2.4

RBC ECONOMICS | RESEARCH
8
PROVINCIAL OUTLOOK | JUNE 2016
Exports still the key to the provincial outlook
Preliminary data from Statistics Canada show that New Brunswick’s economy
delivered stronger than expected growth in 2015, expanding by 1.9% on the back
of manufacturing and primary industries. Save for a disappointing setback for
the mining industry, the outlook for these export-oriented sectors remains broad-
ly positive this year and will sustain economic growth during our forecast hori-
zon. Our forecast assumes more significant offset from the domestic economy
and fiscal restraint by the provincial government. We expect that economic
growth will slow to a modest growth rate of 0.4% this year and 0.6% in 2017.
Hewing wood and drawing water
Even looking through the effect of a maintenance-related shutdown of the Saint
John refinery last year, exports were stuck in low gear in 2015, and that weak-
ness has not ended so far in 2016. The province’s export outlook took a hit when
the newly commissioned Picadilly mine was shuttered in the wake of low potash
prices; however, there will be some offset from a full year of metal production at
the Caribou mine. Outside of mining and despite declining exports overall, there
are localized sources of strength in food manufacturing, wood products, and pa-
per products, which bode well for future export growth. Steadily rising US hous-
ing starts and investments in domestic capacity are helping to drive exports of
wood products, which are up 25% so far this year. The province’s tourism indus-
try is also getting a boost from a weaker Canadian dollar that is enticing US
shoppers across the border. Visitors arriving by car are up 15% so far this year,
which may be contributing to a 9% year-to-date gain in retail sales.
Slumping capital investment adds to weakness in the domestic economy
Recently released data show that capital investment intentions are down 7% in
New Brunswick in 2016, led by an 18% drop in private-sector spending. Falling
investment intentions partly reflect the end of maintenance and upgrading work
at the Saint John refinery but also reflect the drying up of the capital investment
pipeline. While planned public-sector investment is up somewhat this year, as
the government aims to stimulate a flagging economy, it too is on a declining
trajectory going forward, thereby dimming the outlook for construction beyond
2016. On the residential side, building activity is ebbing, and new housing starts
remain at a low level. The government’s tight grip on spending is leaning into
challenging conditions for the domestic economy, and steep job losses in the
public sector are contributing to a 1.5% year-to-date decline in employment.
While this pace of job losses will likely reverse somewhat, we expect New
Brunswick to shed jobs in both 2016 and 2017 following overall employment
declines in six of the past seven years. Despite sustained job losses in the prov-
ince, the unemployment rate has come down as the labour force and pool of
working-age adults shrink. The province’s economic and labour market fortunes
are linked to these demographic trends as fewer workers translates into less de-
mand for consumer goods and housing construction, and a shrinking tax base
encumbers the government with the structural deficit that it has grappled with in
recent budgets.
New Brunswick
Gerard Walsh
Economist
0.0
0.5
1.0
1.5
2.0
2.5
3.0
3.5
4.0
4.5
5.0
2006 2007 2008 2009 2010 2011 2012 2013 2014 2015 2016
$ Billion
New Brunswick: Total capital expenditures
*IntentionsSource: Statistics Canada, RBC Economics Research
*
0
100
200
300
400
500
600
700
800
900
1,000
0
250
500
750
1,000
1,250
1,500
1,750
2,000
2,250
2,500
2000 2001 2002 2003 2004 2005 2006 2007 2008 2009 2010 2011 2012 2013 2014 2015 2016
US housing starts (SAAR, thousands) [LHS] Lumber exports (millions of cubic meters) [RHS]
Quarterly
New Brunswick: Lumber exports and US housing starts
Source: Statistics Canada, US Bureau of the Census, RBC Economics Research
New Brunswick forecast at a glance
% change unless otherwise indicated
2012 2013 2014 2015F 2016F 2017F
Real GDP -1.0 0.4 -0.3 1.9 0.4 0.6
Nominal GDP 0.7 0.4 0.6 3.7 2.0 2.5
Employment -0.7 0.4 -0.2 -0.6 -0.5 -0.2
Unemployment rate (%) 10.2 10.3 10.0 9.8 9.7 9.6
Retail sales -0.7 0.7 3.8 2.4 2.4 2.4
Housing starts (units) 3,299 2,843 2,276 1,995 1,600 2,000
Consumer price index 1.7 0.8 1.5 0.5 1.9 2.5

RBC ECONOMICS | RESEARCH
9
PROVINCIAL OUTLOOK | JUNE 2016
Nova Scotia
Growth poised to pick up modestly
Strength in the export-oriented manufacturing and primary sectors propelled
Nova Scotia’s economy last year with Statistics Canada’s first estimate of 2015
real GDP showing a modest expansion despite sluggish growth in the public
sector, falling construction activity, and declining natural gas production. Eco-
nomic growth is set to accelerate this year as exports continue to benefit from a
lower dollar and as shipbuilding and construction activity continue to ramp in
Halifax. Our forecast calls for real GDP growth to quicken to 1.3% in 2016 be-
fore slowing to 1.1% in 2017 as construction projects wind down.
Construction activity to support growth
Recently released Statistics Canada data on capital spending intentions show a
sharp 24% rise in public-sector investment in 2016 that reflected spending on a
new convention centre in Halifax. We expect this investment to boost non-
residential construction activity in the province this year. On the residential side,
we expect construction levels to remain high this year thanks to the start of sev-
eral multi-unit dwelling projects in 2015. Looking to 2017, as major residential
and non-residential projects begin to wrap up, construction activity will likely
ebb, thereby weighing on the overall economic outlook.
Provincial government on the cusp of balancing its budget
The Nova Scotia government’s 2016 budget, released in April, projects the prov-
ince is on the cusp of its first surplus in five years following several years of
fiscal restraint. The budget included few new initiatives, which will likely limit
the public sector’s contribution to GDP and employment growth going forward.
The manufacturing sector hums along
Nova Scotia’s headline export growth was only 2% in 2015, but this masked
important dynamics in the province’s export mix as substantial declines in natu-
ral gas production offset robust growth in non-energy export categories. As a
result, natural gas has come to represent only a small share of exports (4% in the
first quarter of 2016) such that further declines will no longer meaningfully af-
fect overall export growth in the province. Instead, non-energy products should
propel overall exports as they build on the solid 13% gain last year that was sup-
ported by solid US demand and a weak Canadian dollar. The manufacturing sec-
tor should also benefit from shipbuilding activity, thanks to the Arctic Offshore
Patrol Ships being assembled in Halifax.
Labour market continues to feel the strain
Despite an expected pickup in economic growth in 2016, Nova Scotia’s employ-
ment outlook remains dim. So far this year, losses in private-sector jobs have
contributed to a 0.2% decline in overall employment. While there is scope for a
modest turnaround in private-sector hiring in the remainder of this year, it is
likely to be more than offset by cutbacks in public-sector payrolls. Still, despite
stagnating employment, we expect Nova Scotia unemployment rate to edge low-
er, slightly due to a shrinking labour force brought about by a declining working-
age population. The ageing of the Nova Scotia’s population increasingly is tak-
ing a toll on its pool of available labour, although we expect this phenomenon to
be partly offset by improving interprovincial migration flows with Alberta (that
has been a long-standing drain on the Nova Scotia population).
Gerard Walsh
Economist
-2,000
-1,500
-1,000
-500
0
500
2006 2007 2008 2009 2010 2011 2012 2013 2014 2015
Individuals
Nova Scotia's interprovincial migration balance with Alberta
Source: Statistics Canada, RBC Economics Research
Net migration to Nova Scotia
Net migration to Alberta
0.0
0.5
1.0
1.5
2.0
2.5
3.0
3.5
4.0
4.5
5.0
2006 2007 2008 2009 2010 2011 2012 2013 2014 2015 2016
Public Sector Private Sector
Annual, $ billions
Nova Scotia: Capital expenditures
*IntentionsSource: Statistics Canada, RBC Economics Research
*
Nova Scotia forecast at a glance
% change unless otherwise indicated
2012 2013 2014 2015F 2016F 2017F
Real GDP -0.9 0.0 0.6 0.9 1.3 1.1
Nominal GDP 0.5 2.0 1.3 2.1 2.8 3.1
Employment 1.0 -1.1 -1.1 0.1 -0.2 -0.1
Unemployment rate (%) 9.1 9.1 8.9 8.6 8.5 8.2
Retail sales 1.0 2.9 2.3 -0.6 2.7 2.6
Housing starts (units) 4,522 3,919 3,056 3,825 3,100 3,200
Consumer price index 1.9 1.2 1.7 0.4 1.4 2.6

RBC ECONOMICS | RESEARCH
10
PROVINCIAL OUTLOOK | JUNE 2016
Exports to fuel a steadily growing economy
According to preliminary figures, Prince Edward Island’s GDP expanded by 1.5%
in 2015 and was led by growth in private services and exports. These sectors are
expected to be the province’s key growth engines again in 2016. The construction
sector should provide a lift this year followed by a small drag thereafter, and
growth in domestically oriented sectors of the economy should be modest and
temper overall economic performance. Our forecast calls for real GDP to expand
by 1.3% in 2016 before easing further to 0.9% in 2017.
Exports growing and diversifying
After a strong hand-off from 2015, exports remain on track for continued growth
thanks to solid US domestic spending, low Canadian dollar, and continued invest-
ments by exporters. Recently announced contracts in the aerospace sector point to
firms expanding capacity and production going forward, and rising shipments of
lobsters and potato products are driving a 22% gain in food-product exports so far
this year. As exports have grown, exporters have diversified their markets with an
increased share of provincial exports headed for Asia. In 2015, the United States
received 65% of the Island’s exports, which was down from 81% in 2008; where-
as, the share bound for Asia rose to 13% from 4% during the same period.
A delayed return to surplus prevents a fiscal drag
Prince Edward Island’s 2016 budget raised the harmonized sales tax (HST) by 1
percentage point to 15% and maintained deficit spending for another year, as the
government eschewed cuts to government services. As a result, the public sector
will make a small contribution to the otherwise weak domestically oriented side
of the provincial economy this year. The impressive 8% year-to-date gain in retail
sales is expected to moderate, and overall employment has fallen substantially,
thereby putting the province on track for its third consecutive year of job losses.
The effect of employment declines on the unemployment rate is being tempered
by a steadily declining labour force and working-age population. Like most prov-
inces in Atlantic Canada, Prince Edward Island faces demographic challenges, but
a relatively high level of international immigration, coupled with a pledge to ac-
cept hundreds of Syrian refugees, may forestall them in the near term.
Capital spending jumps in the near term
Capital spending intentions, recently released by Statistics Canada, show a 16%
increase on Prince Edward Island in 2016 and the key driver of that growth is a
$140-million electricity cable to New Brunswick. While the cable has a large dol-
lar value, little of its materials or labour will be locally sourced, thereby minimiz-
ing its effect on PEI growth. A large contribution to the construction sector will
come from an uptick in government investment activity this year, but looking to
2017 and beyond, the construction industry will face a declining trajectory of pub-
lic capital spending and a dim outlook for residential construction brought on by
slow population growth.
Prince Edward Island
Gerard Walsh
Economist
-4
-3
-2
-1
0
1
2
3
4
5
6
2007 2008 2009 2010 2011 2012 2013 2014 2015 2016
Quarterly, year-over-year % change
Prince Edward Island: Employment
Source: Statistics Canada, RBC Economics Research
0
50
100
150
200
250
300
350
400
2007 2008 2009 2010 2011 2012 2013 2014 2015 2016
Quarterly, $ millions
Prince Edward Island: Merchandise exports
Source: Statistics Canada, RBC Economics Research
Prince Edward Island forecast at a glance
% change unless otherwise indicated
2012 2013 2014 2015F 2016F 2017F
Real GDP 1.2 2.0 1.5 1.5 1.3 0.9
Nominal GDP 2.7 3.8 3.8 3.5 2.7 2.5
Employment 1.7 1.4 -0.1 -1.2 -0.7 -0.1
Unemployment rate (%) 11.1 11.5 10.6 10.5 10.7 10.5
Retail sales 3.2 0.8 3.3 2.3 3.5 2.0
Housing starts (units) 941 636 511 558 570 800
Consumer price index 2.0 2.0 1.6 -0.6 1.4 2.6

RBC ECONOMICS | RESEARCH
11
PROVINCIAL OUTLOOK | JUNE 2016
Newfoundland & Labrador
An austerity budget amid a contracting economy
The gathering effect of low oil prices and falling production on Newfoundland
and Labrador’s economy was revealed recently when Statistics Canada’s prelim-
inary estimate of GDP growth for 2015 showed a contraction of 2.2%. Despite a
stable outlook for oil production, the government’s austerity budget and a lower
trajectory for investment spending will cause steady declines in provincial GDP
for the next two years with knock-on implications for employment growth and
the unemployment rate. We expect real GDP will slip by 0.3% in 2016 and a
further 0.9% in 2017.
The province responds to lower revenues with taxes and spending cuts…
In response to plunging oil royalties, the government of Newfoundland and Lab-
rador outlined significant spending cuts and tax increases in its 2016 budget,
including line-by-line reviews of department budgets, hikes in income taxes, gas
taxes, and the HST, and the introduction of the Deficit Reduction Levy of up to
$900 per person. Even with these measures, the government is projecting deficits
exceeding $500 million until 2022-23 and a rapid rise in its debt-to-GDP ratio.
The province’s fiscal challenges have prompted the federal government to sus-
pend the province’s payments on $267 million owed to Ottawa and to extend the
province funds under the Fiscal Stabilization Program. For its part, the provincial
government has promised further measures in its upcoming Fall Update, which
the government expects will be sufficient to balance the budget by 2021-22. Se-
vere fiscal restraint will deal a blow to Newfoundland and Labrador’s already
weakened economy, as tax increases sap consumer spending and expenditure
cuts add to accumulating public-sector employment losses. Public-sector em-
ployment is down 4% year to date compared with last year, which along with a
1.3% decline in private-sector employment, is putting upward pressure on the
unemployment rate that is expected to be the highest among the provinces during
our forecast horizon.
…as investment and construction activity begins to fade
Despite a challenging budget situation, the government remains committed to
investing in Nalcor and its Muskrat Falls project. Employment peaked on the
$7.7-billion project last year, and the wind down of activity going forward is
contributing to a 10% decline in province-wide capital spending intentions for
2016. Adding to falling capital spending is an expected 14% decline in mining,
oil, and gas investment as the $14-billion Hebron project commences oil produc-
tion in 2017. The long-term decline in investment is the key driver in our fore-
cast for the next two years and implies a negative outlook for a construction sec-
tor, which is also facing declining residential activity. Housing starts have de-
clined steadily since 2012, and declining average resale prices and a shrinking
working-age population signal further weakness ahead.
Gerard Walsh
Economist
0
2
4
6
8
10
12
2006 2007 2008 2009 2010 2011 2012 2013 2014 2015 2016
Annual, $ billions
Newfoundland and Labrador: Capital expenditures
*IntentionsSource: Statistics Canada, RBC Economics Research
*
-2,500
-2,000
-1,500
-1,000
-500
0
500
1,000
1,500
2,000
2,500
2003-04
2004-05
2005-06
2006-07
2007-08
2008-09
2009-10
2010-11
2011-12
2012-13
2013-14
2014-15
2015-16
2016-17
2017-18
2018-19
2019-20
2020-21
2021-22
2022-23
Adjusted Budget Balance Target Budget Balance (including future measures)
$ million
Newfoundland and Labrador: Budget balance
Source: Newfoundland and Labrador Department of Finance, RBC Economics Research
Government projection
Newfoundland forecast at a glance
% change unless otherwise indicated
2012 2013 2014 2015F 2016F 2017F
Real GDP -4.4 5.8 -2.0 -2.2 -0.3 -0.9
Nominal GDP -4.5 9.2 -4.2 -9.5 -2.1 4.9
Employment 3.8 0.8 -1.7 -1.0 -1.5 -2.0
Unemployment rate (%) 12.3 11.6 11.9 12.8 13.4 14.5
Retail sales 4.5 5.0 3.4 0.2 0.9 0.7
Housing starts (units) 3,885 2,862 2,119 1,697 1,600 1,300
Consumer price index 2.1 1.7 1.9 0.4 1.7 2.5
RBC ECONOMICS | RESEARCH
12
PROVINCIAL OUTLOOK | JUNE 2016
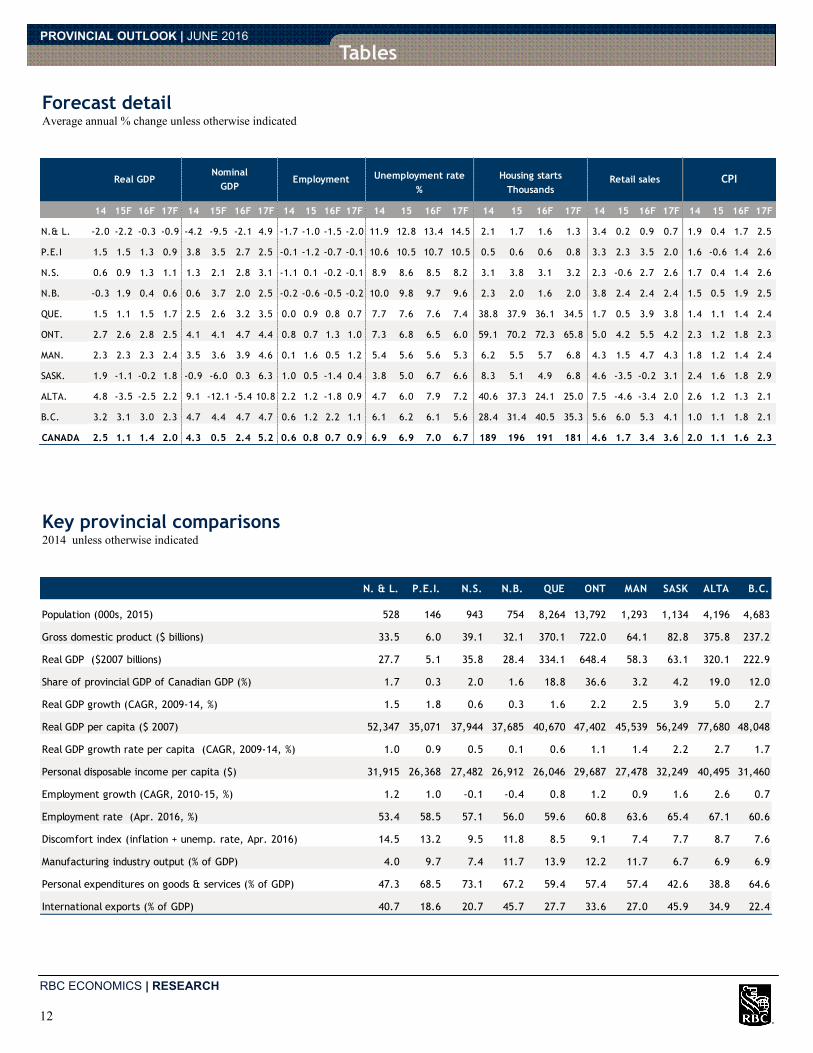
Forecast detail Average annual % change unless otherwise indicated
Key provincial comparisons 2014 unless otherwise indicated
Tables
14 15F 16F 17F 14 15F 16F 17F 14 15 16F 17F 14 15 16F 17F 14 15 16F 17F 14 15 16F 17F 14 15 16F 17F
N.& L. -2.0 -2.2 -0.3 -0.9 -4.2 -9.5 -2.1 4.9 -1.7 -1.0 -1.5 -2.0 11.9 12.8 13.4 14.5 2.1 1.7 1.6 1.3 3.4 0.2 0.9 0.7 1.9 0.4 1.7 2.5
P.E.I 1.5 1.5 1.3 0.9 3.8 3.5 2.7 2.5 -0.1 -1.2 -0.7 -0.1 10.6 10.5 10.7 10.5 0.5 0.6 0.6 0.8 3.3 2.3 3.5 2.0 1.6 -0.6 1.4 2.6
N.S. 0.6 0.9 1.3 1.1 1.3 2.1 2.8 3.1 -1.1 0.1 -0.2 -0.1 8.9 8.6 8.5 8.2 3.1 3.8 3.1 3.2 2.3 -0.6 2.7 2.6 1.7 0.4 1.4 2.6
N.B. -0.3 1.9 0.4 0.6 0.6 3.7 2.0 2.5 -0.2 -0.6 -0.5 -0.2 10.0 9.8 9.7 9.6 2.3 2.0 1.6 2.0 3.8 2.4 2.4 2.4 1.5 0.5 1.9 2.5
QUE. 1.5 1.1 1.5 1.7 2.5 2.6 3.2 3.5 0.0 0.9 0.8 0.7 7.7 7.6 7.6 7.4 38.8 37.9 36.1 34.5 1.7 0.5 3.9 3.8 1.4 1.1 1.4 2.4
ONT. 2.7 2.6 2.8 2.5 4.1 4.1 4.7 4.4 0.8 0.7 1.3 1.0 7.3 6.8 6.5 6.0 59.1 70.2 72.3 65.8 5.0 4.2 5.5 4.2 2.3 1.2 1.8 2.3
MAN. 2.3 2.3 2.3 2.4 3.5 3.6 3.9 4.6 0.1 1.6 0.5 1.2 5.4 5.6 5.6 5.3 6.2 5.5 5.7 6.8 4.3 1.5 4.7 4.3 1.8 1.2 1.4 2.4
SASK. 1.9 -1.1 -0.2 1.8 -0.9 -6.0 0.3 6.3 1.0 0.5 -1.4 0.4 3.8 5.0 6.7 6.6 8.3 5.1 4.9 6.8 4.6 -3.5 -0.2 3.1 2.4 1.6 1.8 2.9
ALTA. 4.8 -3.5 -2.5 2.2 9.1 -12.1 -5.4 10.8 2.2 1.2 -1.8 0.9 4.7 6.0 7.9 7.2 40.6 37.3 24.1 25.0 7.5 -4.6 -3.4 2.0 2.6 1.2 1.3 2.1
B.C. 3.2 3.1 3.0 2.3 4.7 4.4 4.7 4.7 0.6 1.2 2.2 1.1 6.1 6.2 6.1 5.6 28.4 31.4 40.5 35.3 5.6 6.0 5.3 4.1 1.0 1.1 1.8 2.1
CANADA 2.5 1.1 1.4 2.0 4.3 0.5 2.4 5.2 0.6 0.8 0.7 0.9 6.9 6.9 7.0 6.7 189 196 191 181 4.6 1.7 3.4 3.6 2.0 1.1 1.6 2.3
Thousands
Nominal
GDPReal GDP Employment Unemployment rate Housing starts Retail sales CPI
%
N. & L. P.E.I. N.S. N.B. QUE ONT MAN SASK ALTA B.C.
Population (000s, 2015) 528 146 943 754 8,264 13,792 1,293 1,134 4,196 4,683
Gross domestic product ($ billions) 33.5 6.0 39.1 32.1 370.1 722.0 64.1 82.8 375.8 237.2
Real GDP ($2007 billions) 27.7 5.1 35.8 28.4 334.1 648.4 58.3 63.1 320.1 222.9
Share of provincial GDP of Canadian GDP (%) 1.7 0.3 2.0 1.6 18.8 36.6 3.2 4.2 19.0 12.0
Real GDP growth (CAGR, 2009-14, %) 1.5 1.8 0.6 0.3 1.6 2.2 2.5 3.9 5.0 2.7
Real GDP per capita ($ 2007) 52,347 35,071 37,944 37,685 40,670 47,402 45,539 56,249 77,680 48,048
Real GDP growth rate per capita (CAGR, 2009-14, %) 1.0 0.9 0.5 0.1 0.6 1.1 1.4 2.2 2.7 1.7
Personal disposable income per capita ($) 31,915 26,368 27,482 26,912 26,046 29,687 27,478 32,249 40,495 31,460
Employment growth (CAGR, 2010-15, %) 1.2 1.0 -0.1 -0.4 0.8 1.2 0.9 1.6 2.6 0.7
Employment rate (Apr. 2016, %) 53.4 58.5 57.1 56.0 59.6 60.8 63.6 65.4 67.1 60.6
Discomfort index (inflation + unemp. rate, Apr. 2016) 14.5 13.2 9.5 11.8 8.5 9.1 7.4 7.7 8.7 7.6
Manufacturing industry output (% of GDP) 4.0 9.7 7.4 11.7 13.9 12.2 11.7 6.7 6.9 6.9
Personal expenditures on goods & services (% of GDP) 47.3 68.5 73.1 67.2 59.4 57.4 57.4 42.6 38.8 64.6
International exports (% of GDP) 40.7 18.6 20.7 45.7 27.7 33.6 27.0 45.9 34.9 22.4

RBC ECONOMICS | RESEARCH
13
PROVINCIAL OUTLOOK | JUNE 2016
Tables
British Columbia2008 2009 2010 2011 2012 2013 2014 2015F 2016F 2017F
Real GDP Chained $2007 millions 199,768 194,987 200,324 206,360 211,427 215,901 222,868 229,866 236,647 242,090
% change 0.7 -2.4 2.7 3.0 2.5 2.1 3.2 3.1 3.0 2.3
Nominal GDP $ millions 204,406 196,250 205,117 216,786 221,414 226,605 237,188 247,610 259,248 271,311
% change 3.1 -4.0 4.5 5.7 2.1 2.3 4.7 4.4 4.7 4.7
Employment thousands 2,242 2,192 2,223 2,228 2,262 2,266 2,278 2,306 2,357 2,382
% change 1.6 -2.2 1.4 0.2 1.6 0.1 0.6 1.2 2.2 1.1
Unemployment rate % 4.6 7.7 7.6 7.5 6.8 6.6 6.1 6.2 6.1 5.6
Retail sales $ millions 57,794 55,288 58,251 60,090 61,255 62,734 66,273 70,272 73,989 77,011
% change 1.5 -4.3 5.4 3.2 1.9 2.4 5.6 6.0 5.3 4.1
Housing starts units 34,321 16,077 26,479 26,400 27,465 27,054 28,356 31,446 40,500 35,300
% change -12.4 -53.2 64.7 -0.3 4.0 -1.5 4.8 10.9 28.8 -12.8
Consumer price index 2002=100 112.3 112.3 113.8 116.5 117.8 117.7 118.9 120.2 122.4 125.0
% change 2.1 0.0 1.4 2.3 1.1 -0.1 1.0 1.1 1.8 2.1
Alberta2008 2009 2010 2011 2012 2013 2014 2015F 2016F 2017F
Real GDP Chained $2007 millions 265,165 250,510 262,720 279,655 290,544 305,353 320,113 309,069 301,497 307,979
% change 1.6 -5.5 4.9 6.4 3.9 5.1 4.8 -3.5 -2.5 2.2
Nominal GDP $ millions 296,072 245,690 270,049 299,521 312,485 344,452 375,756 330,372 312,610 346,474
% change 13.5 -17.0 9.9 10.9 4.3 10.2 9.1 -12.1 -5.4 10.8
Employment thousands 2,054 2,030 2,024 2,100 2,172 2,226 2,275 2,301 2,260 2,280
% change 3.2 -1.2 -0.3 3.7 3.5 2.5 2.2 1.2 -1.8 0.9
Unemployment rate % 3.6 6.5 6.6 5.4 4.6 4.6 4.7 6.0 7.9 7.2
Retail sales $ millions 61,620 56,489 59,849 63,945 68,408 73,109 78,582 74,989 72,455 73,901
% change 0.2 -8.3 5.9 6.8 7.0 6.9 7.5 -4.6 -3.4 2.0
Housing starts units 29,164 20,298 27,088 25,704 33,396 36,011 40,590 37,282 24,100 25,000
% change -39.7 -30.4 33.5 -5.1 29.9 7.8 12.7 -8.1 -35.4 3.7
Consumer price index 2002=100 121.6 121.5 122.7 125.7 127.1 128.9 132.2 133.7 135.5 138.4
% change 3.2 -0.1 1.0 2.4 1.1 1.4 2.6 1.2 1.3 2.1
Saskatchewan2008 2009 2010 2011 2012 2013 2014 2015F 2016F 2017F
Real GDP Chained $2007 millions 55,139 52,195 54,647 57,545 58,514 61,929 63,127 62,464 62,314 63,405
% change 5.3 -5.3 4.7 5.3 1.7 5.8 1.9 -1.1 -0.2 1.8
Nominal GDP $ millions 67,619 60,080 63,368 74,821 77,957 83,496 82,780 77,837 78,038 82,977
% change 29.1 -11.1 5.5 18.1 4.2 7.1 -0.9 -6.0 0.3 6.3
Employment thousands 517 526 531 536 548 565 571 574 566 568
% change 2.5 1.6 1.0 0.9 2.4 3.1 1.0 0.5 -1.4 0.4
Unemployment rate % 4.0 4.9 5.3 4.9 4.7 4.1 3.8 5.0 6.7 6.6
Retail sales $ millions 14,676 14,605 15,103 16,199 17,405 18,301 19,143 18,477 18,438 19,004
% change 11.8 -0.5 3.4 7.3 7.4 5.1 4.6 -3.5 -0.2 3.1
Housing starts units 6,828 3,866 5,907 7,031 9,968 8,290 8,257 5,149 4,900 6,800
% change 13.7 -43.4 52.8 19.0 41.8 -16.8 -0.4 -37.6 -4.8 38.8
Consumer price index 2002=100 115.9 117.1 118.7 122.0 123.9 125.7 128.7 130.8 133.1 136.9
% change 3.2 1.1 1.3 2.8 1.6 1.4 2.4 1.6 1.8 2.9

RBC ECONOMICS | RESEARCH
14
PROVINCIAL OUTLOOK | JUNE 2016
Tables Manitoba
2008 2009 2010 2011 2012 2013 2014 2015F 2016F 2017F
Real GDP Chained $2007 millions 51,544 51,464 52,736 54,045 55,674 57,005 58,301 59,665 61,008 62,441
% change 3.7 -0.2 2.5 2.5 3.0 2.4 2.3 2.3 2.3 2.4
Nominal GDP $ millions 52,154 50,804 53,308 56,197 59,781 61,897 64,077 66,385 68,965 72,138
% change 4.9 -2.6 4.9 5.4 6.4 3.5 3.5 3.6 3.9 4.6
Employment thousands 602 601 609 612 622 626 626 636 640 647
% change 1.5 -0.2 1.4 0.4 1.6 0.7 0.1 1.6 0.5 1.2
Unemployment rate % 4.2 5.2 5.4 5.5 5.3 5.4 5.4 5.6 5.6 5.3
Retail sales $ millions 14,983 14,920 15,770 16,443 16,652 17,297 18,034 18,297 19,150 19,968
% change 6.9 -0.4 5.7 4.3 1.3 3.9 4.3 1.5 4.7 4.3
Housing starts units 5,537 4,174 5,888 6,083 7,242 7,465 6,220 5,501 5,700 6,800
% change -3.5 -24.6 41.1 3.3 19.1 3.1 -16.7 -11.6 3.6 19.3
Consumer price index 2002=100 113.4 114.1 115.0 118.4 120.3 123.0 125.3 126.8 128.5 131.6
% change 2.2 0.6 0.8 2.9 1.6 2.3 1.8 1.2 1.4 2.4
Ontario2008 2009 2010 2011 2012 2013 2014 2015F 2016F 2017F
Real GDP Chained $2007 millions 601,723 582,904 600,131 614,606 622,717 631,068 648,352 665,468 683,769 700,521
% change 0.0 -3.1 3.0 2.4 1.3 1.3 2.7 2.6 2.8 2.5
Nominal GDP $ millions 608,446 597,882 630,989 659,743 680,084 693,210 721,970 751,266 786,592 821,175
% change 1.1 -1.7 5.5 4.6 3.1 1.9 4.1 4.1 4.7 4.4
Employment thousands 6,610 6,433 6,538 6,658 6,703 6,823 6,878 6,923 7,012 7,083
% change 1.0 -2.7 1.6 1.8 0.7 1.8 0.8 0.7 1.3 1.0
Unemployment rate % 6.6 9.1 8.7 7.9 7.9 7.6 7.3 6.8 6.5 6.0
Retail sales $ millions 151,697 148,109 156,276 161,859 164,503 168,253 176,719 184,143 194,330 202,509
% change 3.9 -2.4 5.5 3.6 1.6 2.3 5.0 4.2 5.5 4.2
Housing starts units 75,076 50,370 60,433 67,821 76,742 61,085 59,134 70,156 72,300 65,800
% change 10.2 -32.9 20.0 12.2 13.2 -20.4 -3.2 18.6 3.1 -9.0
Consumer price index 2002=100 113.3 113.7 116.5 120.1 121.8 123.0 125.9 127.4 129.7 132.6
% change 2.3 0.4 2.4 3.1 1.4 1.1 2.3 1.2 1.8 2.3
Quebec2008 2009 2010 2011 2012 2013 2014 2015F 2016F 2017F
Real GDP Chained $2007 millions 311,945 309,359 315,708 321,647 324,993 329,038 334,103 337,912 342,811 348,639
% change 1.9 -0.8 2.1 1.9 1.0 1.2 1.5 1.1 1.5 1.7
Nominal GDP $ millions 314,380 314,541 328,138 344,735 354,040 361,211 370,064 379,798 391,855 405,690
% change 2.7 0.1 4.3 5.1 2.7 2.0 2.5 2.6 3.2 3.5
Employment thousands 3,883 3,854 3,938 3,976 4,006 4,061 4,060 4,097 4,130 4,161
% change 1.1 -0.7 2.2 1.0 0.8 1.4 0.0 0.9 0.8 0.7
Unemployment rate % 7.2 8.6 8.0 7.9 7.7 7.6 7.7 7.6 7.6 7.4
Retail sales $ millions 94,816 93,759 99,590 102,556 103,753 106,301 108,137 108,727 112,989 117,227
% change 4.9 -1.1 6.2 3.0 1.2 2.5 1.7 0.5 3.9 3.8
Housing starts units 47,901 43,403 51,363 48,387 47,367 37,758 38,810 37,926 36,100 34,500
% change -1.3 -9.4 18.3 -5.8 -2.1 -20.3 2.8 -2.3 -4.8 -4.4
Consumer price index 2002=100 112.7 113.4 114.8 118.3 120.8 121.7 123.4 124.7 126.4 129.5
% change 2.1 0.6 1.3 3.0 2.1 0.8 1.4 1.1 1.4 2.4

RBC ECONOMICS | RESEARCH
15
PROVINCIAL OUTLOOK | JUNE 2016
Tables
New Brunswick2008 2009 2010 2011 2012 2013 2014 2015F 2016F 2017F
Real GDP Chained $2007 millions 28,501 28,080 28,643 28,702 28,417 28,530 28,436 28,988 29,089 29,264
% change 0.8 -1.5 2.0 0.2 -1.0 0.4 -0.3 1.9 0.4 0.6
Nominal GDP $ millions 28,779 28,857 30,213 31,500 31,723 31,857 32,056 33,257 33,908 34,759
% change 1.7 0.3 4.7 4.3 0.7 0.4 0.6 3.7 2.0 2.5
Employment thousands 361 360 358 356 353 355 354 352 350 349
% change 0.9 -0.2 -0.5 -0.7 -0.7 0.4 -0.2 -0.6 -0.5 -0.2
Unemployment rate % 8.5 8.7 9.2 9.5 10.2 10.3 10.0 9.8 9.7 9.6
Retail sales $ millions 10,018 10,094 10,595 11,103 11,028 11,107 11,528 11,808 12,093 12,389
% change 6.5 0.8 5.0 4.8 -0.7 0.7 3.8 2.4 2.4 2.4
Housing starts units 4,274 3,521 4,101 3,452 3,299 2,843 2,276 1,995 1,600 2,000
% change 0.8 -17.6 16.5 -15.8 -4.4 -13.8 -19.9 -12.3 -19.8 25.0
Consumer price index 2002=100 113.2 113.5 115.9 120.0 122.0 123.0 124.8 125.4 127.9 131.1
% change 1.7 0.3 2.1 3.5 1.7 0.8 1.5 0.5 1.9 2.5
Nova Scotia2008 2009 2010 2011 2012 2013 2014 2015F 2016F 2017F
Real GDP Chained $2007 millions 34,618 34,721 35,693 35,884 35,567 35,562 35,758 36,080 36,549 36,951
% change 2.0 0.3 2.8 0.5 -0.9 0.0 0.6 0.9 1.3 1.1
Nominal GDP $ millions 35,416 34,931 36,849 37,652 37,835 38,576 39,077 39,908 41,034 42,315
% change 4.3 -1.4 5.5 2.2 0.5 2.0 1.3 2.1 2.8 3.1
Employment thousands 452 450 451 453 458 453 448 448 447 447
% change 1.0 -0.5 0.4 0.4 1.0 -1.1 -1.1 0.1 -0.2 -0.1
Unemployment rate % 7.6 9.2 9.6 9.0 9.1 9.1 8.9 8.6 8.5 8.2
Retail sales $ millions 12,091 12,105 12,651 13,098 13,223 13,605 13,915 13,827 14,198 14,569
% change 4.1 0.1 4.5 3.5 1.0 2.9 2.3 -0.6 2.7 2.6
Housing starts units 3,982 3,438 4,309 4,644 4,522 3,919 3,056 3,825 3,100 3,200
% change -16.2 -13.7 25.3 7.8 -2.6 -13.3 -22.0 25.2 -19.0 3.2
Consumer price index 2002=100 115.9 115.7 118.2 122.7 125.1 126.6 128.8 129.3 131.2 134.6
% change 3.0 -0.1 2.2 3.8 1.9 1.2 1.7 0.4 1.4 2.6
Prince Edward Island2008 2009 2010 2011 2012 2013 2014 2015F 2016F 2017F
Real GDP Chained $2007 millions 4,683 4,695 4,800 4,895 4,952 5,051 5,126 5,203 5,268 5,315
% change 1.1 0.3 2.2 2.0 1.2 2.0 1.5 1.5 1.3 0.9
Nominal GDP $ millions 4,754 4,927 5,222 5,424 5,573 5,783 6,003 6,214 6,380 6,541
% change 2.7 3.6 6.0 3.9 2.7 3.8 3.8 3.5 2.7 2.5
Employment thousands 69 68 70 72 73 74 74 73 73 73
% change 0.8 -1.3 2.3 3.1 1.7 1.4 -0.1 -1.2 -0.7 -0.1
Unemployment rate % 10.8 11.9 11.4 11.1 11.1 11.5 10.6 10.5 10.7 10.5
Retail sales $ millions 1,703 1,682 1,770 1,866 1,925 1,940 2,005 2,052 2,124 2,167
% change 5.1 -1.3 5.3 5.4 3.2 0.8 3.3 2.3 3.5 2.0
Housing starts units 712 877 756 940 941 636 511 558 570 800
% change -5.1 23.2 -13.8 24.3 0.1 -32.4 -19.7 9.2 2.2 40.4
Consumer price index 2002=100 117.5 117.3 119.5 123.0 125.5 128.0 130.1 129.3 131.1 134.5
% change 3.4 -0.1 1.8 2.9 2.0 2.0 1.6 -0.6 1.4 2.6

RBC ECONOMICS | RESEARCH
16
PROVINCIAL OUTLOOK | JUNE 2016
The material contained in this report is the property of Royal Bank of Canada and may not be reproduced in any way, in whole or in part, without express authorization of the copyright holder in writing. The statements and statistics contained herein have been prepared by RBC Economics Research based on information from sources con-
sidered to be reliable. We make no representation or warranty, express or implied, as to its accuracy or completeness. This publication is for the information of investors
and business persons and does not constitute an offer to sell or a solicitation to buy securities.
®Registered trademark of Royal Bank of Canada.
©Royal Bank of Canada.
Tables
Newfoundland & Labrador2008 2009 2010 2011 2012 2013 2014 2015F 2016F 2017F
Real GDP Chained $2007 millions 28,629 25,740 27,164 27,946 26,719 28,272 27,695 27,086 26,994 26,751
% change -1.5 -10.1 5.5 2.9 -4.4 5.8 -2.0 -2.2 -0.3 -0.9
Nominal GDP $ millions 31,572 25,001 29,085 33,539 32,032 34,991 33,514 30,316 29,669 31,136
% change 8.6 -20.8 16.3 15.3 -4.5 9.2 -4.2 -9.5 -2.1 4.9
Employment thousands 221 215 223 232 241 243 239 236 233 228
% change 1.9 -2.7 3.6 4.1 3.8 0.8 -1.7 -1.0 -1.5 -2.0
Unemployment rate % 13.3 15.5 14.7 12.6 12.3 11.6 11.9 12.8 13.4 14.5
Retail sales $ millions 7,009 7,121 7,453 7,833 8,182 8,589 8,882 8,900 8,982 9,041
% change 7.4 1.6 4.7 5.1 4.5 5.0 3.4 0.2 0.9 0.7
Housing starts units 3,261 3,057 3,606 3,488 3,885 2,862 2,119 1,697 1,600 1,300
% change 23.1 -6.3 18.0 -3.3 11.4 -26.3 -26.0 -19.9 -5.7 -18.8
Consumer price index 2002=100 114.3 114.6 117.4 121.4 123.9 126.0 128.4 129.0 131.1 134.4
% change 2.9 0.3 2.4 3.4 2.1 1.7 1.9 0.4 1.7 2.5