online source credibility: experts and fellow users · attributed on web sites on perceived...
TRANSCRIPT
Online source credibility:
Experts and fellow users
P. Jason Morrison
COMM 65020
Kent State University
2 May 2005

Abstract
This study attempted to measure the effect of different ways information is presented and
attributed on web sites on perceived credibility. Internet users were asked to use information on
one of three web sites to make evaluations of digital cameras and then rate several measures of
the credibility of the information. One site presented information as a table with no attribution,
one presented the information in the form of an expert review, and one in the form of multiple
user reviews. Results were mixed, with those using the review sites slightly more likely to say
they had enough information, could make a decision, were confident in the choice they made, did
not want to look at more or different kind of information, and did not think reviewers were
biased. The results did not support the idea that user reviews positively affected credibility more
than expert reviews, and more expert users were less likely to find the information credible in all
significant cases.
Introduction
Why do people believe what they see online? Why would a user trust information in an article
on a web site, or be willing to make a purchase based on reviews on a merchant's site?
Even before the advent of the Internet, people have been exposed to, have searched for, and have
made decisions based upon information from various sources. It follows that people have needed
to evaluate the information and the source of the information, to assign them levels of credibility,
or to put a level of trust in the the source. Sometimes this is easy; for example, one person might
know someone who is an professional photographer, so they might take his or her advice about
buying a camera very seriously. In mass media, people can often rely on the reputation of a
publication, familiarity with a writer, or an established personal history of using information
from that source.
These methods of evaluation are not always so easy on the Internet. When seeking information
on digital cameras, for example, users may visit the manufacturer's site directly, a newspaper's
online edition, an online-only publication the user has never read before, a personal home page or
blog of a current camera owner, a forum filled with myriad opinions entered by anonymous
enthusiasts, etc. How does one identify how much weight to give to which sources? Other types
of information face similar (and often more pressing) concerns: how is a user to know that a
news story, a piece of health advice, or a reference article is credible?
Web sites use a number of different methods to make the information they provide seem
credible, trustworthy, or often in the case of commercial web site, convincing. These include
elements as disparate as reputation, co-branding, links to reputable sources, guarantees,
suggestions personalized to the user, source attribution, authority of authors and user
contribution, among others. Many of these are difficult to quantify and measure, and a given web
site may use any or all of the above, making it difficult to determine exactly how much each user
might be affected by each tactic.
This study looks at a very small part of this overall question. There are two methods in particular
that many web sites have used to give users a sense that a source or piece of information is
reliable and credible. In the first method, the site will credit the information to an expert author
or reviewer. In the second technique, more prominent online than in traditional media, sites will
allow all of their users to review something (a computer, a store, a seller, an article, etc.). The
result is a sort of average review of sometimes thousands of individuals, the idea being that the

user can trust the overall rating or impression because it is a sum of a large number of individual,
subjective opinions. Ebay, Amazon.com, Bizrate.com, and a growing number of others apply
this technique.
These two methods, authority of authors and user contribution, present a nice contrast and a good
target for study.
RQ1: If information content is held relatively equal, does the way in which information is
presented and sources attributed affect users' perception of credibility?
Literature Review
Research into traditional media credibility has been going on for decades. Hovland and Weiss
defined credibility as being made up of two dimensions: trustworthiness and expertise.1 Petty
and Cacioppo, developing the Elaboration Likelihood Model, saw two ways in which a text can
be found credible or untrustworthy: the central route, where readers evaluate the text and make
decisions about its arguments, and the peripheral route, which include external cues like
reputation.2
Research specifically into the credibility of information online has often started from this base,
often directly comparing online and traditional media. Since credibility is very much a concern
of the news media, it is not surprising that a large amount of the research on Internet information
credibility been done in specifically with the news media.
As early as 1998, the Pew Research Center found the number of Americans getting their news
online had grown at an astonishing rate, while attitudes about traditional news media had soured
and credibility had stabilized below levels in the 1980s.3 By 2004, while many media outlets'
credibility declined, they found that 29% of Americans reported regularly going online to get
news.4
Credibility is an important issue for online information sources because the less people believe or
trust what they see and hear, the less the pay attention to it.5 In one early study, Brady created a
web page with information on candidates running for congress and found that 71% of the
participants thought it was more in-depth than television, while 43 percent said it was less
biased.6
In 1998, Johnson and Kaye studied politically-interested Internet users in order to gage whether
they thought Internet publications were as credible as their traditional media counterparts.7 They
measured credibility as consisting of four dimensions: believability, accuracy, bias, and depth.
They found that in general, both Internet and traditional sources were seen as “somewhat”
credible, and that online information was seen as at least as credible as traditional. Online
newspapers and candidate literature, in fact, were seen as significantly more credible. They also
found that that reliance was a stronger predictor of credibility for print media than online,
although it was positively correlated in both cases. Reliance was a better predictor of credibility
for online sources than simple use.
Later in 2000, Johnson and Kaye looked at the influence of reliance on credibility of online
political information.8 Their study had three research questions: first, how do those who rely
heavily on online information rate the credibility of online newspapers, television station sites,
online newsmagazines, candidate literature, and issue-oriented sites? Second, how credible will
people who normally rely on traditional media see those sites to be? Third, will online or
traditional media sources better predict credibility of those sites? In general, reliance on the web
was a significant predictor of credibility for all of the online information sources in the study, and
reliance on the traditional media versions was a significant predictor for most. In addition, they
found that younger users were more likely to find the online sources as credible and that the more
educated found them less credible. Overall, the researchers though that concerns that the Internet
would never be taken seriously as an information source were overblown, and that as people
begin to rely on online information sources they will see them as credible.
In a 2000 study, Flanagin and Metzger found that information from the Internet was seen to be as
credible or more credible as information from magazines, radio, and television, though not as
credible as newspapers, despite the fact that information on the Internet might have had the least
amount of editorial control.9 Their study looked at the relative perceived credibility of different
news media and different types of information presented via those media. They measured
credibility as believability, accuracy, trustworthiness, bias, and completeness and looked at four
different type of information: news or current events, entertainment, reference, and commercial.
They also found that Internet information credibility was positively correlated with Internet
experience, but they could not support their hypothesis that Internet experience was positively
correlated with Internet credibility relative to other media.
Studies have shown varying results on how source attribution affects perceived credibility. The
presence of attribution was found to be an important factor in credibility of online news sources
in one study by Sundar.10 In this study credibility was considered an overall measure of the

objectivity of a story, and six types of information were presented to participants: national,
international, local, business, sports, and entertainment. In at least one of the many studies on
this subject researchers found that the more participants relied on print media, the more likely
they were to look for attribution.11
In a more general study, Kiousis found that although people are generally skeptical about all of
the news media, they rated online news sources above television (but below newspapers).12
Research into the credibility of online information sources has not, of course, been limited to the
newsmedia. After a broad review of the literature, Freeman and Spyridakis found that a large
number of organizations and experts more or less agreed on a number of positive characteristics
publishers could include to enhance the credibility of their site.13 The study looked to see if
interest or presence of a street address and external links would correlate positively with
credibility, and found that they did. The measurement of credibility included accuracy, bias,
credibility, expertise, and trustworthiness.
Credibility and trustworthiness in other contexts have found other factors as well. In a study of
online support groups, Wright found the perceptions of credibility were related to network size
and satisfaction, and that satisfaction was linked to the amount of time spent and number of
messages exchanged by users.14
Hypothesis
H1: Users will find information written by other people (with value judgments and attribution)
more credible than that same information listed out with no context.

H2: Users will be more likely to trust information attributed to multiple fellow users than
information attributed to an expert.
H3: Users that are more accustomed to using information online are more likely to find
information attributed to multiple fellow users credible.
Method
Internet users do not search for information in general, but instead go online looking for
information on a certain topic or subject. Digital cameras were chosen as the particular subject in
this study because there was a wealth of objective information available from manufacturers
online and because it seemed to be a subject that users would actually look for online. Three
different web sites were created: the control site, with information simply listed for each camera,
the expert review site, where the information was presented as a review written by a digital
photography expert, and the user review site, where the information was presented as short
reviews written by a number of users.
In order to keep the time requirements of the survey down, only four cameras were shown on
each test site (Canon PowerShot A75, Nikon Coolpix 5700, Canon PowerShot SD300, Sony
Cyber Shot DSC-F828). To ensure that all of the cameras were of similar quality and that there
would be a clear distinction between them, cameras were chosen from the “Editors' Top
Cameras” lists of a major review site15, one from each of four categories: “3-megapixel
cameras,” “5-megapixel cameras,” “6-megapixel and higher cameras,” and “Ultracompact
cameras.”
The same 14 pieces of information were collected about each camera from review sites and
manufacturer's sites, including the following:
• Resolution• Optical/Digital zoom• Lens manufacturer/brand name• Autofocus system• LCD screen size/resolution, presence/absence optical viewfinder • body materials (plastic, aluminum, etc.)• Movie modes• Presence/absence of Low-light focus assist illuminator • Shutter speeds of 15 seconds to 1/2000 second• Selectable ISO settings from 50 to 400• Battery type• Storage type (CompactFlash, SecureDigital, Memory Stick, etc.) and included memory size. • Size• Weight
Each specification was then written as a sentence for each camera. The control site had all
information listed out as bullet points on the page. In the expert review site, the sentences were
put together in the form of a review, with some written as positive and others negative. In the
user review site, similar positive/negative sentences were broken up into a number of different
user reviews.
For example, the fact that the Canon A75 weighs 7.1 oz. was written as follows: “Weight: 7.1
oz” (control); “The A75 weighs 7.1oz which is light in the hand, but too heavy to put in a
pocket.” (expert review); and “It is light (7.1 oz) when I'm shooting, but it is too heavy to put in
my pocket.” (user review).
Although the goal was to keep the information content of each site as similar as possible, both
review sites framed some of the information in positive or negative comments. This was done in
order to make the reviews seem as naturalistic as possible.

In order to ensure they would read the site and use it to make some kind of evaluation,
participants were asked to perform two simple tasks requiring them to evaluate digital cameras
using information provided. They were randomly assigned to one of three groups: the first
group, the control group, was given information about the cameras in a table with no context.
The second group, the expert review group, was given the same information presented in the
form of a review written by a digital photography expert. The third group, the user review group,
was presented the same information in the form of multiple short reviews written by fellow users.
After the participant fulfilled their task and chose cameras, they were asked a series of
demographic questions and asked to rate ten statements on a 5-point Likert-type scale. The
notion of credibility or trust of an online source was been operationalized as consisting of seven
facets:
• The user's ability to evaluate with the amount of information provided (sufficiency)
• The user’s ability to choose based on information (decision)
• The user’s confidence in action based on information (confidence)
• The user’s lack of desire to look for additional information (completeness)
• The user’s belief that the source is trustworthy (trust)
• The user’s belief that the source is unbiased (bias)
• The user’s belief that the information is accurate (accuracy)
Other questions asked the user to rate their familiarity with the subject matter, how much they
liked the organization of the information, and their previous experience with these particular
brands and cameras.
Data Collection
The survey was made available to employees of SBC through and invitation sent out via the
billing group email distribution list and the web developer mailing list on April 20, 2005 and the
survey web site was open through April 29. Participants were not given any incentive to
participate and were asked to complete the survey outside of work hours.
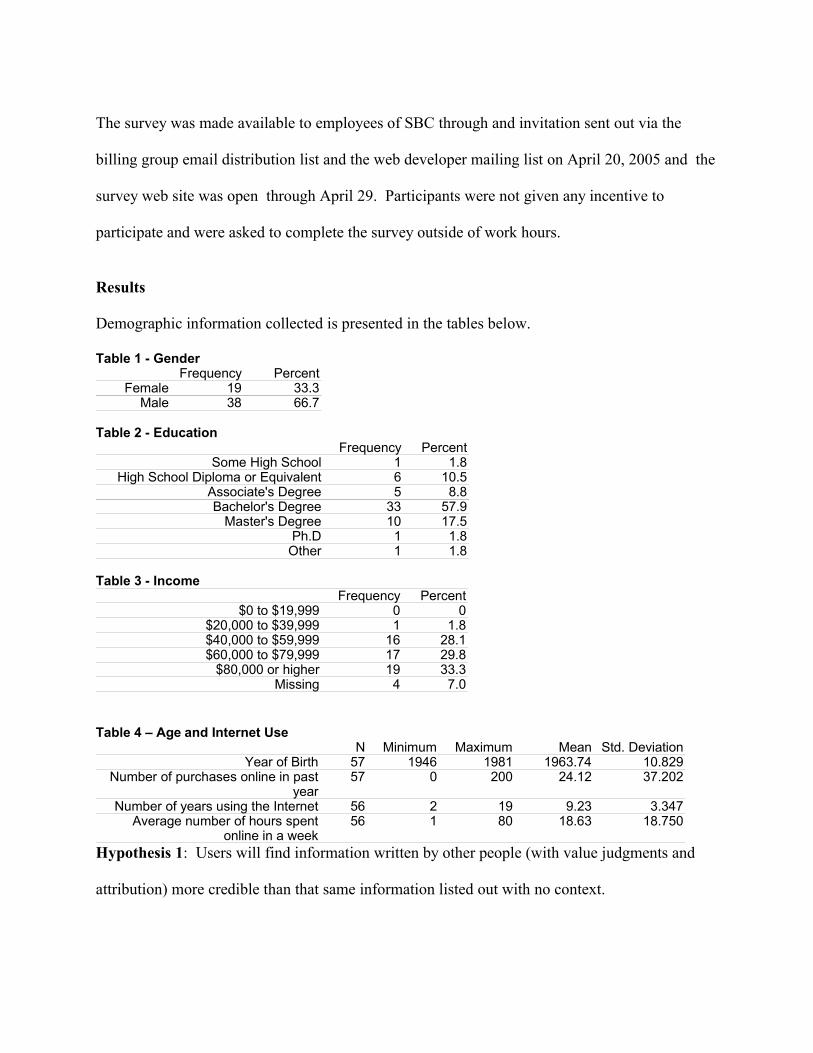
Results
Demographic information collected is presented in the tables below.
Table 1 - Gender Frequency Percent
Female 19 33.3Male 38 66.7
Table 2 - Education
Frequency PercentSome High School 1 1.8
High School Diploma or Equivalent 6 10.5Associate's Degree 5 8.8Bachelor's Degree 33 57.9
Master's Degree 10 17.5Ph.D 1 1.8
Other 1 1.8 Table 3 - Income
Frequency Percent$0 to $19,999 0 0
$20,000 to $39,999 1 1.8$40,000 to $59,999 16 28.1$60,000 to $79,999 17 29.8
$80,000 or higher 19 33.3Missing 4 7.0
Table 4 – Age and Internet Use N Minimum Maximum Mean Std. Deviation
Year of Birth 57 1946 1981 1963.74 10.829Number of purchases online in past
year57 0 200 24.12 37.202
Number of years using the Internet 56 2 19 9.23 3.347Average number of hours spent
online in a week56 1 80 18.63 18.750
Hypothesis 1: Users will find information written by other people (with value judgments and
attribution) more credible than that same information listed out with no context.

The first way this hypothesis was tested was by taking a mean of the seven credibility indicators
and comparing those for all participants that viewed plain information versus those that saw one
of the two review sites (Table 5). An ANOVA table was calculated to test for significance.
Table 5 – Overall Credibility Rating, Plain Information v. Reviews Information type Mean N Std.
DeviationStd. Error
of MeanPlain Information 2.8786 20 .61187 .13682
Information in Reviews
2.9344 37 .60758 .09989
Total 2.9148 57 .60420 .08003
ANOVA Table
Sum of Squares
df Mean Square
F Sig.
Between Groups(Combined)
.040 1 .040 .109 .743
Within Groups
20.403 55 .371
Total
20.443 56
Participants in the Review groups did report a slightly higher overall credibility, but the
difference was very small and the results were not statistically significant. Although the seven
indicators were chosen from among a number of studies in the literature, it is quite possible that
the simple average shown above is not a reliable measure of credibility. A in a second attempt to
test the first hypothesis, means were calculated for each measure individually (as well as the
measure of whether the participant liked the site's organization) for each group and an ANOVA
table was calculated to test for significance (Table 6).
Table 6 – Individual Credibility Indications, Plain Information v. Reviews N Mean Std.
DeviationStd. Error 95% Confidence Interval for
Mean Lower Bound Upper Bound
Sufficiency Plain Information
20 2.65 1.089 .244 2.14 3.16
Information in Reviews
37 3.19 1.101 .181 2.82 3.56
Total 57 3.00 1.118 .148 2.70 3.30Decision Plain
Information20 2.55 1.191 .266 1.99 3.11

Information in Reviews
37 2.68 1.156 .190 2.29 3.06
Total 57 2.63 1.159 .154 2.32 2.94Liked Plain
Information20 3.40 1.095 .245 2.89 3.91
Information in Reviews
37 2.89 1.075 .177 2.53 3.25
Total 57 3.07 1.100 .146 2.78 3.36Confident Plain
Information20 3.25 1.446 .323 2.57 3.93
Information in Reviews
37 3.35 .978 .161 3.03 3.68
Total 57 3.32 1.152 .153 3.01 3.62Complete Plain
Information20 1.65 .813 .182 1.27 2.03
Information in Reviews
37 1.76 .895 .147 1.46 2.06
Total 57 1.72 .861 .114 1.49 1.95Trust Plain
Information20 3.60 1.046 .234 3.11 4.09
Information in Reviews
37 3.24 .925 .152 2.93 3.55
Total 57 3.37 .975 .129 3.11 3.63Bias Plain
Information20 2.80 1.005 .225 2.33 3.27
Information in Reviews
37 2.95 .911 .150 2.64 3.25
Total 57 2.89 .939 .124 2.65 3.14Accuracy Plain
Information20 3.65 .933 .209 3.21 4.09
Information in Reviews
37 3.38 .639 .105 3.17 3.59
Total 57 3.47 .758 .100 3.27 3.67
ANOVA Sum of Squares df Mean Square F Sig.
Sufficiency Between Groups 3.774 1 3.774 3.135 .082 Within Groups 66.226 55 1.204 Total 70.000 56
Decision Between Groups .205 1 .205 .150 .700 Within Groups 75.058 55 1.365 Total 75.263 56
Liked Between Groups 3.352 1 3.352 2.864 .096 Within Groups 64.368 55 1.170 Total 67.719 56
Confident Between Groups .133 1 .133 .099 .754 Within Groups 74.182 55 1.349 Total 74.316 56
Complete Between Groups .148 1 .148 .197 .659 Within Groups 41.361 55 .752 Total 41.509 56
Trust Between Groups 1.652 1 1.652 1.761 .190 Within Groups 51.611 55 .938 Total 53.263 56
Bias Between Groups .277 1 .277 .310 .580 Within Groups 49.092 55 .893 Total 49.368 56
Accuracy Between Groups .958 1 .958 1.686 .200
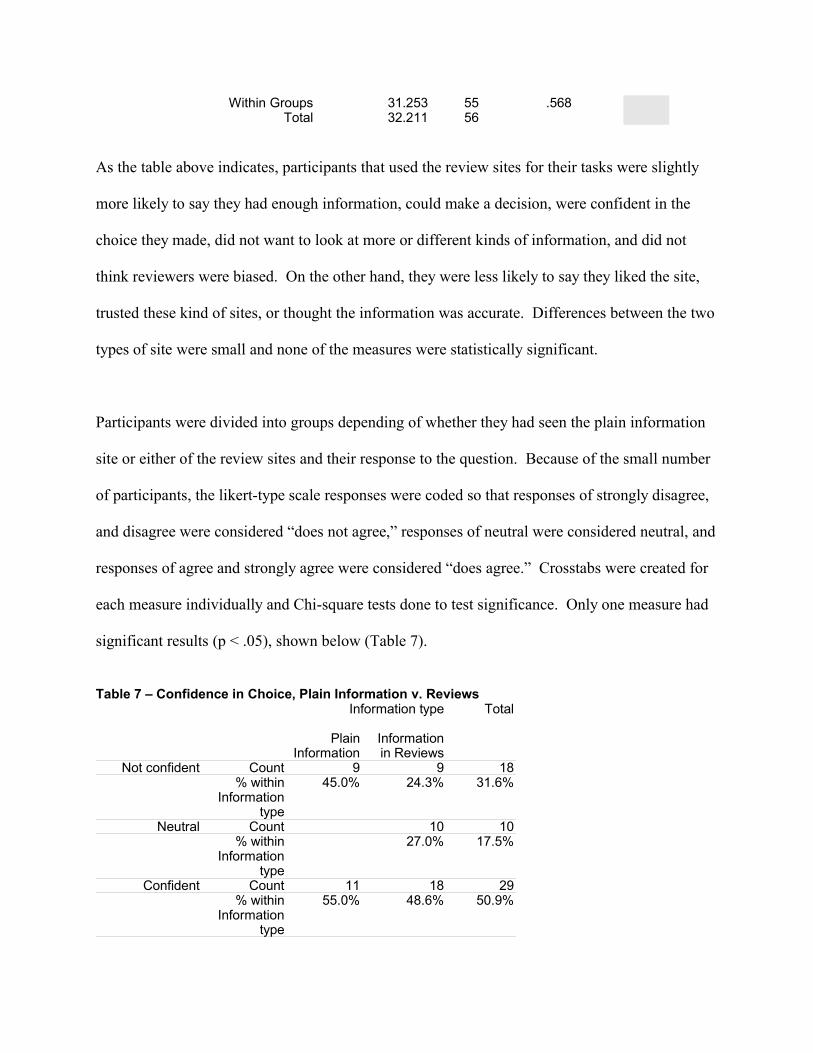
Within Groups 31.253 55 .568 Total 32.211 56
As the table above indicates, participants that used the review sites for their tasks were slightly
more likely to say they had enough information, could make a decision, were confident in the
choice they made, did not want to look at more or different kinds of information, and did not
think reviewers were biased. On the other hand, they were less likely to say they liked the site,
trusted these kind of sites, or thought the information was accurate. Differences between the two
types of site were small and none of the measures were statistically significant.
Participants were divided into groups depending of whether they had seen the plain information
site or either of the review sites and their response to the question. Because of the small number
of participants, the likert-type scale responses were coded so that responses of strongly disagree,
and disagree were considered “does not agree,” responses of neutral were considered neutral, and
responses of agree and strongly agree were considered “does agree.” Crosstabs were created for
each measure individually and Chi-square tests done to test significance. Only one measure had
significant results (p < .05), shown below (Table 7).
Table 7 – Confidence in Choice, Plain Information v. Reviews Information type
Total
Plain Information
Information in Reviews
Not confident Count 9 9 18 % within
Information type
45.0% 24.3% 31.6%
Neutral Count 10 10 % within
Information type
27.0% 17.5%
Confident Count 11 18 29 % within
Information type
55.0% 48.6% 50.9%
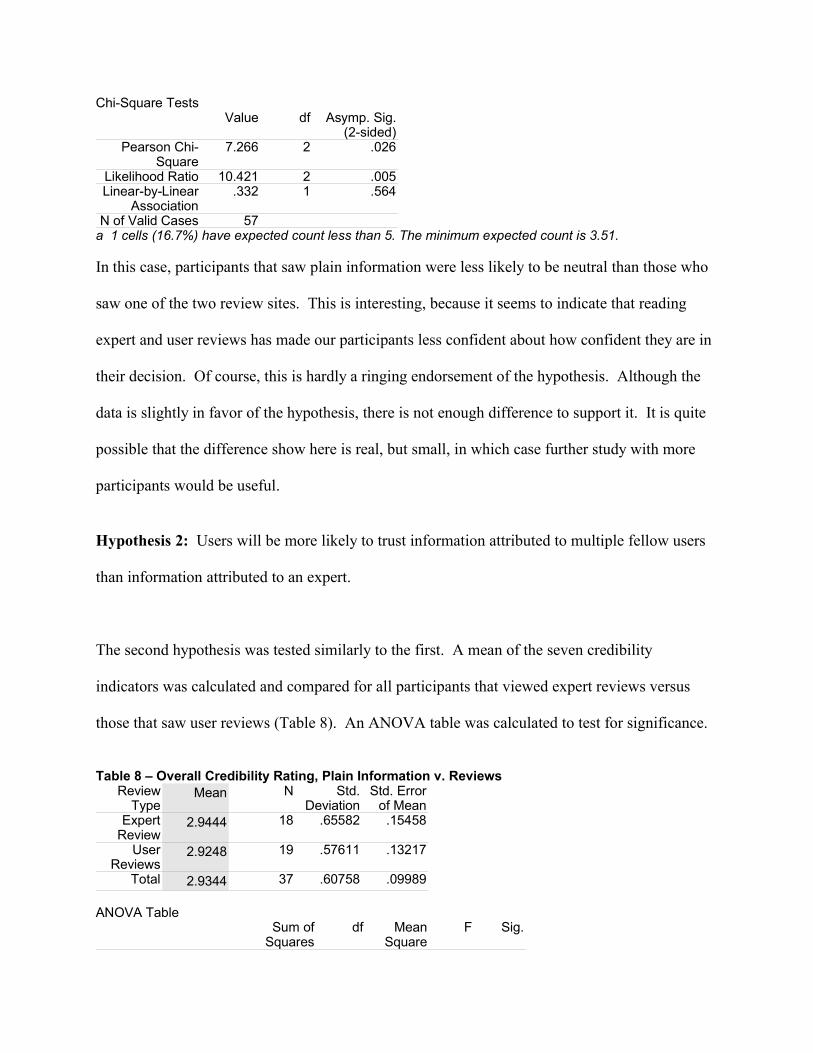
Chi-Square Tests Value df Asymp. Sig.
(2-sided)Pearson Chi-
Square7.266 2 .026
Likelihood Ratio 10.421 2 .005Linear-by-Linear
Association.332 1 .564
N of Valid Cases 57 a 1 cells (16.7%) have expected count less than 5. The minimum expected count is 3.51.
In this case, participants that saw plain information were less likely to be neutral than those who
saw one of the two review sites. This is interesting, because it seems to indicate that reading
expert and user reviews has made our participants less confident about how confident they are in
their decision. Of course, this is hardly a ringing endorsement of the hypothesis. Although the
data is slightly in favor of the hypothesis, there is not enough difference to support it. It is quite
possible that the difference show here is real, but small, in which case further study with more
participants would be useful.
Hypothesis 2: Users will be more likely to trust information attributed to multiple fellow users
than information attributed to an expert.
The second hypothesis was tested similarly to the first. A mean of the seven credibility
indicators was calculated and compared for all participants that viewed expert reviews versus
those that saw user reviews (Table 8). An ANOVA table was calculated to test for significance.
Table 8 – Overall Credibility Rating, Plain Information v. Reviews Review
TypeMean N Std.
DeviationStd. Error
of MeanExpert
Review2.9444 18 .65582 .15458
User Reviews
2.9248 19 .57611 .13217
Total 2.9344 37 .60758 .09989 ANOVA Table
Sum of Squares
df Mean Square
F Sig.

Between Groups(Combined)
.004 1 .004 .009 .923
Within Groups
13.286 35 .380
Total
13.290 36
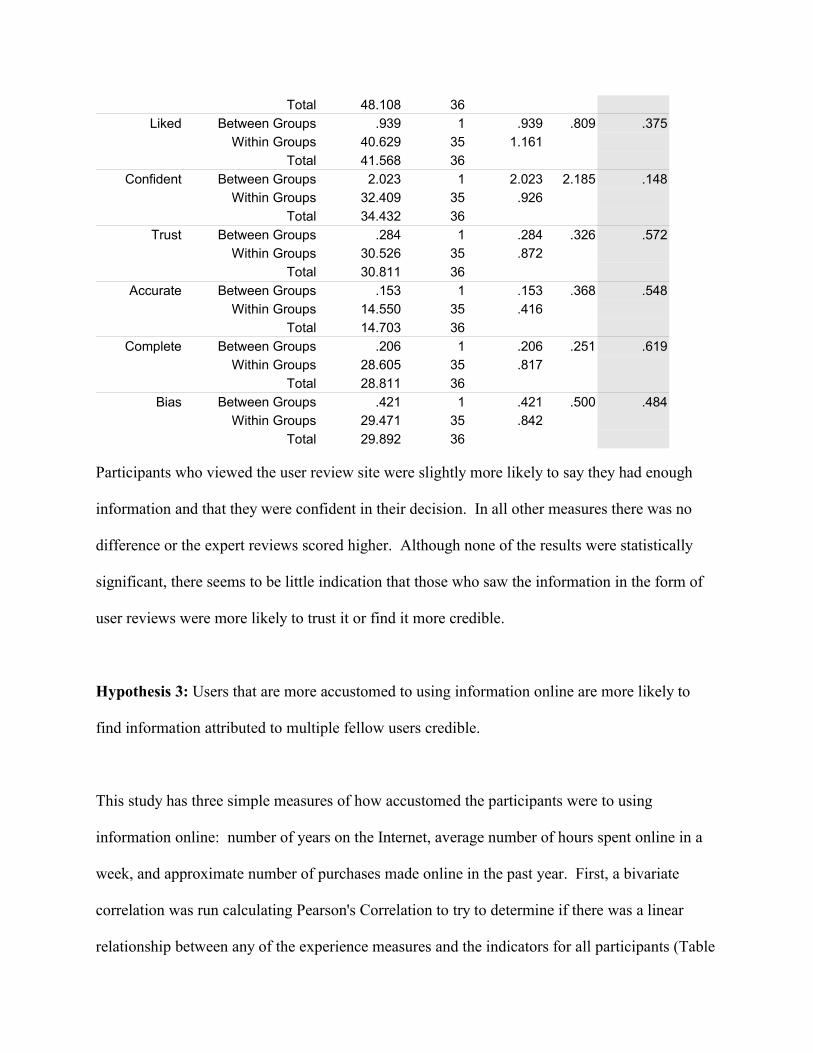
In this case the the expert reviews were rated slightly higher than the user reviews, although not
enough to be significant. Means were then calculated and compared for each of the measures
individually, with an ANOVA table was calculated to test for significance (Table 9).
Table 9 – Individual Credibility Indications, Plain Information v. Reviews N Mean Std.
DeviationStd. Error 95% Confidence Interval for
Mean
Lower Bound
Upper Bound
Sufficiency Expert Review 18 3.17 1.150 .271 2.59 3.74 User Reviews 19 3.21 1.084 .249 2.69 3.73 Total 37 3.19 1.101 .181 2.82 3.56
Decision Expert Review 18 2.67 1.283 .302 2.03 3.30 User Reviews 19 2.68 1.057 .242 2.17 3.19 Total 37 2.68 1.156 .190 2.29 3.06
Liked Expert Review 18 3.06 1.162 .274 2.48 3.63 User Reviews 19 2.74 .991 .227 2.26 3.21 Total 37 2.89 1.075 .177 2.53 3.25
Confident Expert Review 18 3.11 .900 .212 2.66 3.56 User Reviews 19 3.58 1.017 .233 3.09 4.07 Total 37 3.35 .978 .161 3.03 3.68
Trust Expert Review 18 3.33 .970 .229 2.85 3.82 User Reviews 19 3.16 .898 .206 2.72 3.59 Total 37 3.24 .925 .152 2.93 3.55
Accurate Expert Review 18 3.44 .784 .185 3.05 3.83 User Reviews 19 3.32 .478 .110 3.09 3.55 Total 37 3.38 .639 .105 3.17 3.59
Complete Expert Review 18 1.83 .985 .232 1.34 2.32 User Reviews 19 1.68 .820 .188 1.29 2.08 Total 37 1.76 .895 .147 1.46 2.06
Bias Expert Review 18 3.06 .938 .221 2.59 3.52 User Reviews 19 2.84 .898 .206 2.41 3.28 Total 37 2.95 .911 .150 2.64 3.25
ANOVA
Sum of Squares
df Mean Square
F Sig.
Sufficiency Between Groups .018 1 .018 .014 .906 Within Groups 43.658 35 1.247 Total 43.676 36
Decision Between Groups .003 1 .003 .002 .964 Within Groups 48.105 35 1.374
Total 48.108 36 Liked Between Groups .939 1 .939 .809 .375
Within Groups 40.629 35 1.161 Total 41.568 36
Confident Between Groups 2.023 1 2.023 2.185 .148 Within Groups 32.409 35 .926 Total 34.432 36
Trust Between Groups .284 1 .284 .326 .572 Within Groups 30.526 35 .872 Total 30.811 36
Accurate Between Groups .153 1 .153 .368 .548 Within Groups 14.550 35 .416 Total 14.703 36
Complete Between Groups .206 1 .206 .251 .619 Within Groups 28.605 35 .817 Total 28.811 36
Bias Between Groups .421 1 .421 .500 .484 Within Groups 29.471 35 .842 Total 29.892 36
Participants who viewed the user review site were slightly more likely to say they had enough
information and that they were confident in their decision. In all other measures there was no
difference or the expert reviews scored higher. Although none of the results were statistically
significant, there seems to be little indication that those who saw the information in the form of
user reviews were more likely to trust it or find it more credible.
Hypothesis 3: Users that are more accustomed to using information online are more likely to
find information attributed to multiple fellow users credible.
This study has three simple measures of how accustomed the participants were to using
information online: number of years on the Internet, average number of hours spent online in a
week, and approximate number of purchases made online in the past year. First, a bivariate
correlation was run calculating Pearson's Correlation to try to determine if there was a linear
relationship between any of the experience measures and the indicators for all participants (Table

10).
Table 10 - Individual Credibility Indications and Experience Measures YEARS HOURS PURCHASE
Sufficiency Pearson Correlation -.108 -.065 -.098 Sig. (2-tailed) .429 .633 .469 N 56 56 57
Decision Pearson Correlation -.121 .090 -.023 Sig. (2-tailed) .374 .511 .865 N 56 56 57
Liked Pearson Correlation -.250 .008 -.132 Sig. (2-tailed) .063 .953 .329 N 56 56 57
Confident Pearson Correlation -.002 .178 -.002 Sig. (2-tailed) .989 .190 .987 N 56 56 57
Complete Pearson Correlation -.224 -.274 -.157 Sig. (2-tailed) 0.1 .041 .244 N 56 56 57
Trust Pearson Correlation -.366 -.217 -.245 Sig. (2-tailed) .006 .108 .066 N 56 56 57
Bias Pearson Correlation -.011 -.087 -.032 Sig. (2-tailed) .938 .522 .811 N 56 56 57
Accurate Pearson Correlation -.159 .065 .030 Sig. (2-tailed) .243 .634 .824 N 56 56 57
Bold signifies correlation is significant at the 0.05 level (2-tailed).
Although this did not directly test the hypothesis, it was interesting to see if the results, as a
whole, showed a positive correlation between experience and credibility. In fact, the majority of
the measures of credibility were negatively correlated with with experience—the longer the
participant had been using the Internet, the more hours per week they used it, and the more
purchases they had made, in general the less credible they had found the information. Only two
of the correlations was statistically significant: the more years the participant had been using the
Internet, the less likely they were to trust this and similar websites, and the larger number of
hours spent on the Internet in a week, the more likely they were to want more information.
A similar tables was calculated, this time with just the User Review participants (Table 11).
Table 11 - Individual Credibility Indications and Experience Measures

YEARS HOURS PURCHASESufficiency Pearson Correlation -.180 -.392 .017
Sig. (2-tailed) .461 .108 .946 N 19 18 19
Decision Pearson Correlation -.423 -.117 .147 Sig. (2-tailed) .071 .644 .547 N 19 18 19
Liked Pearson Correlation -.589 -.204 .100 Sig. (2-tailed) .008 .417 .685 N 19 18 19
Confident Pearson Correlation -.006 .114 .182 Sig. (2-tailed) .980 .653 .455 N 19 18 19
Complete Pearson Correlation -.489 -.336 -.080 Sig. (2-tailed) .033 .173 .744 N 19 18 19
Trust Pearson Correlation -.337 -.571 .166 Sig. (2-tailed) .159 .013 .497 N 19 18 19
Bias Pearson Correlation -.206 .033 -.370 Sig. (2-tailed) .397 .897 .119 N 19 18 19
Accurate Pearson Correlation -.245 -.503 .190 Sig. (2-tailed) .311 .033 .437 N 19 18 19
Bold signifies correlation is significant at the 0.05 level (2-tailed).
Looking at the results just for the participants that saw the user reviews site, (table XX), a similar
pattern emerges. In general, the more experienced the user, the lower the perceived credibility,
and the four statistically significant results showed definite inverse correlations. The one
measure of experience that did correlate positively (although never statistically significantly)
more often than not was purchases. This is interesting because the tasks the participants were
asked to perform were similar to what they would do in preparation for a purchase online. There
is hardly evidence here to say that the more purchases a user makes, the more likely user reviews
are able to increase a site's credibility, but user reviews do not incite the strong downward pitch
in credibility when experience is measured by purchases alone.
One final correlation was calculated in order to compare the results of the correlation above with
the results for all other participants (Table 12).
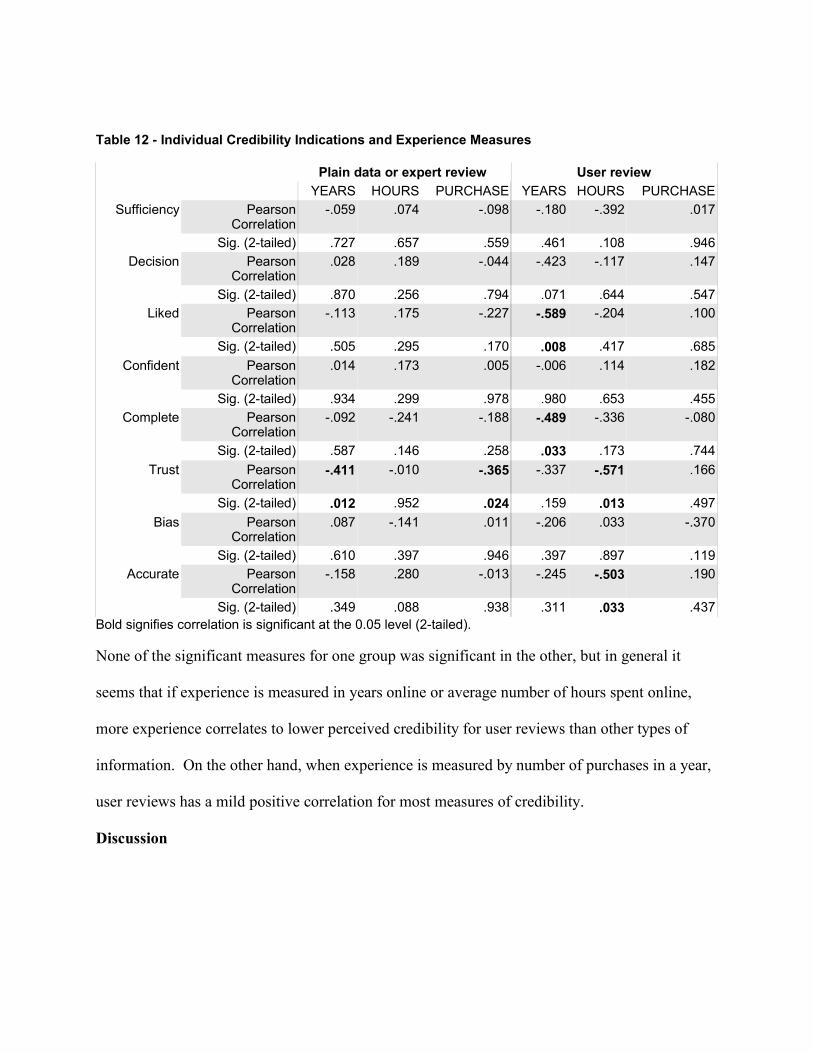
Table 12 - Individual Credibility Indications and Experience Measures
Plain data or expert review User reviewYEARS HOURS PURCHASE YEARS HOURS PURCHASE
Sufficiency Pearson Correlation
-.059 .074 -.098 -.180 -.392 .017
Sig. (2-tailed) .727 .657 .559 .461 .108 .946Decision Pearson
Correlation.028 .189 -.044 -.423 -.117 .147
Sig. (2-tailed) .870 .256 .794 .071 .644 .547Liked Pearson
Correlation-.113 .175 -.227 -.589 -.204 .100
Sig. (2-tailed) .505 .295 .170 .008 .417 .685Confident Pearson
Correlation.014 .173 .005 -.006 .114 .182
Sig. (2-tailed) .934 .299 .978 .980 .653 .455Complete Pearson
Correlation-.092 -.241 -.188 -.489 -.336 -.080
Sig. (2-tailed) .587 .146 .258 .033 .173 .744Trust Pearson
Correlation-.411 -.010 -.365 -.337 -.571 .166
Sig. (2-tailed) .012 .952 .024 .159 .013 .497Bias Pearson
Correlation.087 -.141 .011 -.206 .033 -.370
Sig. (2-tailed) .610 .397 .946 .397 .897 .119Accurate Pearson
Correlation-.158 .280 -.013 -.245 -.503 .190
Sig. (2-tailed) .349 .088 .938 .311 .033 .437Bold signifies correlation is significant at the 0.05 level (2-tailed).
None of the significant measures for one group was significant in the other, but in general it
seems that if experience is measured in years online or average number of hours spent online,
more experience correlates to lower perceived credibility for user reviews than other types of
information. On the other hand, when experience is measured by number of purchases in a year,
user reviews has a mild positive correlation for most measures of credibility.
Discussion
The survey results do not completely support either of the three hypothesis, although there are
some indications that with a larger sample more of the small differences noted would be
statistically significant.
It is also possible that the independent variable used here, the way in which information is
presented and attributed, is not a strong factor in perceived credibility. Other variable that were
held constant, for example the specific number of facts available on each site, the site's visual
design, etc. may be much stronger predictors.
Clearly, more study needs to be done in this area. This particular study was most valuable as a
test of the operationalization and survey mechanism.
Limitations
The largest limitation to this study is the small, non-probability sample. SBC employees most
likely do no represent the universe of Internet users, and participants were highly self-selected.
None of the results can be generalized to the Internet population as whole. This survey also
suffers from some of the same general limitations that any study involving self-reporting does.
Informal interviews with participants later revealed that some of the questions could have been
worded more clearly. Question 8 in part 2 (“I find the people who write product reviews on web
sites biased”) was not seen by all participants as referring to the specific reviews they read, but
instead as referring to all web sites in general.
Another consideration was the artificiality of the test web sites themselves. Although users

presumably utilized the sites in the same environment as they normally would, the sites
themselves were fairly plain and did not have colorful logos, advertisements, and other elements
that typical web sites contain.
Further study
It would certainly be interesting to do a similar study using actual web sites, although in that
situation it would be very difficult to put any amount of control over information content in the
different types of sites. A cursory look at the amount of information presented on a Amazon.com
product page, for example, will demonstrate that user reviews rarely cover every attribute listed
in the “Product Details” section. A look at several web sites will show differences in the types
and quantity of information offered at each. It might be possible to find a number of sites that are
fairly close in information content, save them locally, and edit them for consistency. It may also
be advantageous to take the current pages and reformat them to look much more like a particular
site the users may be familiar with.
One thing that this study does not consider is the interaction between different types of
information on the same site. It may be worthwhile to do a similar study to see if presenting the
same information in multiple forms increases credibility or likely hood. In fact, the current study
is in somewhat artificial in that many sites present factual information, expert reviews, and user
reviews on the same page.
With more participants, it might also be able to control for factors like familiarity with the
subject matter. The questionnaire asked participants to rate themselves on expertise in the
subject matter at hand as well as familiarity with the brands of the cameras themselves.

It would be interesting to run the same study with other types of information as well.
Commercial product information in general, and digital camera information in particular, were
chosen for this study because they seemed to lend themselves well to study. It would be valuable
to run this same study with other kind of products and compare results. It would also be
interesting to run similar studies with other types of information, perhaps the four types studied
by Flanagin and Metzger: news, reference, entertainment, and commercial.
Finally, only three types of presentation and attribution were examined. Other studies have
found other factors that affect perceived credibility, and it would be interesting to include
additional sites to test these as well.
Works Cited
1. Hovland, C. I. And W. Weiss. “The influence of source credibility on communication
effectiveness. Public Opinion Quarterly 1951. 15:635-650.
2. Petty, R. E. and J. T. Cacioppo. Communication and persuasion: Central and peripheral
routes to attitude change. 1986. New York: Springer-Verlag.
3. Pew Research Center for the People and the Press. “Internet News Takes Off -
Event-Driven News Audiences.” 8 June 1998. <http://people-
press.org/reports/display.php3?PageID=564> (29 April 2005).
4. Pew Research Center for the People and the Press. “News Audiences Increasingly Politicized
- Online News Audience Larger, More Diverse.” 8 June 2004. <http://people-
press.org/reports/display.php3?ReportID=215> (29 April 2005).
5. Gaziano, Cecilie. “How Credible is the Credibility Crisis?” Journalism Quarterly 65
(Summer 1988): 267-78, 375.
6. Brady, Dwight J. “Cyberdemocracy and perceptions of Politics: An Experimental Analysis of
Political Communication on the World Wide Web.” Paper presented at the annual meeting of
the Midwest Association for Public Opinion Research, Chicago, IL, 1996.
7. Johnson, T. J. and Kaye, B. K. (1998). Cruising is believing?: Comparing Internet and
traditional sources on media credibility measures. Journalism and Mass Communication
Quarterly. v.75, n.2: 325-340.
8. Johnson, Thomas J. and Barbara K. Kaye. “Using is believing: The influence of reliance on
the credibility of online political information among politically interested Internet users.”
Journalism and Mass Communication Quarterly., v. 77 issue 4, 2000, p. 865.
9. Flanagin, Andrew J. and Metzger, Miriam J. “Perceptions of Internet Information
Credibility.” Journalism & Mass Communication Quarterly, Autumn 2000, Vol. 77 Issue 3,
p515.
10.Sundar, S. S. (1998). Effect of source attribution on perception of online news stories.
Journalism and Mass Communication Quarterly. v.75, n.1: 55-68.
11.Culbertson, Hugh M. and Nancy Somerick, “Variables Affect How Persons View Unnamed
News Sources.” Journalism Quarterly 54 (spring 1977): 58-69.
12.Kiousis, Spiro. “Public trust or mistrust? Perceptions of media credibility in the Information
Age.” Mass Communication & Society. 4, (4, Fall 2001), 381-403.

13.Freeman, Krisandra S. and Jan H. Spyridakis. “An Examination of Factors That Affect the
Credibility of Online Health Information.” Technical Communication; May2004, Vol. 51
Issue 2, p239.
14.“Perceptions of on-line support providers: An examination of perceived homophily, source
credibility, communication and social support within on-line support groups.”
Communication Quarterly., v. 48 issue 1, 2000, p. 44.
15. Baldridge, Aimee ed. “Editors' Top Cameras.” Cnet. 20 April 2005.
<http://reviews.cnet.com/Digital_cameras/4521-6530_7-5021301-1.html> (29 April 2005).