online calculators in the dcas tests
TRANSCRIPT
© Delaware Department of Education, 2013Descriptions of the operation of the Test Delivery System and related systems are property of the American
Institutes for Research (AIR) and are used with the permission of AIR.
Online Calculators in the DCAS Tests
2013–2014

© Delaware Department of Education, 2013Descriptions of the operation of the Test Delivery System and related systems are property of the American
Institutes for Research (AIR) and are used with the permission of AIR.
iii
Table of Contents
About Calculators in the Test Delivery System .................................................................................................................. 1
Accessing the Sample Calculators ........................................................................................................................................ 2Open a Sample Calculator on Windows/Mac/Linux ..................................................................................................... 2
Create a Desktop Shortcut to the Sample Calculator ............................................................................................... 2Open a Sample Calculator on a Mobile Tablet ............................................................................................................... 3
Save a Sample Calculator to your Home Screen (iPad) ............................................................................................. 3Bookmark and Add a Sample Calculator to your Home Screen (Android) ............................................................. 4
Available Calculators ............................................................................................................................................................. 5Basic (Four-Function) Calculator ................................................................................................................................... 5Scientific Calculator ......................................................................................................................................................... 6Graphing Calculator ......................................................................................................................................................... 7
Expressions (Y=) ........................................................................................................................................................... 7Window View ................................................................................................................................................................. 8Table View ...................................................................................................................................................................... 8Graph (Output) View .................................................................................................................................................... 9
Matrices Calculator ........................................................................................................................................................ 10Regression Calculator..................................................................................................................................................... 11
Keyboard Shortcuts for Calculators .................................................................................................................................. 12Navigating Within the Calculator ................................................................................................................................. 12


1
Students are able to use an online calculator for online testing as an alternative to handheld calculators that are allowable by the Delaware Department of Education. Available calculator types include Basic, Scientific, Graphing, Matrices, and Regression. Descriptions of each available calculator are provided in this document.
Students can use a mouse or keyboard to use the calculators on desktop and laptop computers. For tablets, students can simply tap the keys on the calculator’s keypad. Information about keyboard shortcuts for students who cannot use a mouse is also available in this manual.
Some calculators may be combined; that is, students may access multiple calculators within the same calculator window. When multiple calculator types are available, a button will appear for each calculator type.
Figure 1. Sample Combined Calculator
The American Institutes for Research, which provides the online tests/assessments, welcomes suggestions and/or feedback about the online calculators. Contact them at [email protected].
About Calculators in the Test Delivery System

2
All sample calculators are available on the DCAS portal. We encourage bookmarking the sample calculators so that users can easily open them. Desktop/home screen shortcuts can also be created.
Once the calculators are saved to the desktop or home screen, students can open them without needing a Wifi or 3G/4G connection.
Open a Sample Calculator on Windows/Mac/Linux1. Navigate to the DCAS portal > Students
and Families > Family Resources page.
2. Click a [Calculator] link.
The sample calculator you selected will open in the browser window.
Note: The first time you load the sample calculator, you should see a pop-up message that says “This website (tds.airast.org) is asking you to store data on your computer for offline use.”
3. Click [Allow].
Create a Desktop Shortcut to the Sample Calculator
Note: Ensure the browser window does not take up the full screen.
1. Use your mouse to hover over the lock icon in the address bar.
2. Click and drag the lock icon to the desktop. A shortcut will appear that says “Calculator” and will display the browser icon.
3. Optional: Rename shortcut icon
a. Click in the icon text and it will become editable.
b. Change the text to what you want (e.g., “Graphing Calculator” or “3-5 Calculator”).
4. Double-click the icon to open the sample calculator. It will open in the browser.
Accessing the Sample Calculators

3
Open a Sample Calculator on a Mobile Tablet1. Navigate to the DCAS portal > Students
and Families > Family Resources page.
For iPads, use Safari. For Android tablets, use Google Chrome.
2. Tap on a [Calculator] link.
The sample calculator you selected will open in the browser window.
Note: You will see a pop-up message encouraging you to add the calculator to the tablet’s home screen.
Save a Sample Calculator to your Home Screen (iPad)
1. Tap the “share” icon [ ], which appears just to the left of the address bar.
2. Tap the [Add to Home Screen] icon.
3. Optional: Rename shortcut icon
(By default, all sample calculators are named “Calculator.”)
a. Tap in the box that says “Calculator.”
b. Using the tablet keyboard, add or modify text (e.g., “Graphing Calculator” or “3-5 Calculator”).
4. Tap the blue [Add] button. The shortcut icon will appear on the Home screen.

4
Bookmark and Add a Sample Calculator to your Home Screen (Android)
Save the Sample Calculator as a Bookmark
1. Tap the star icon [ ], which appears on the right side of the address bar. The Add Bookmark screen will open.
2. Optional: Modify the bookmark name
a. Tap the text and then use the keyboard to change the name.
b. Tap the down arrow to close the keyboard.
3. Tap [Save].
Add the Calculator Bookmark to the Home Screen
1. Tap the menu [ ] icon, which appears in the upper right corner. The menu will open.
2. Tap [Bookmarks]. The list of your bookmarks will appear.
3. Tap and hold the calculator bookmark. A list of options will appear.
4. Tap [Add to home screen]. The bookmark will be added to your tablet’s home screen.
5
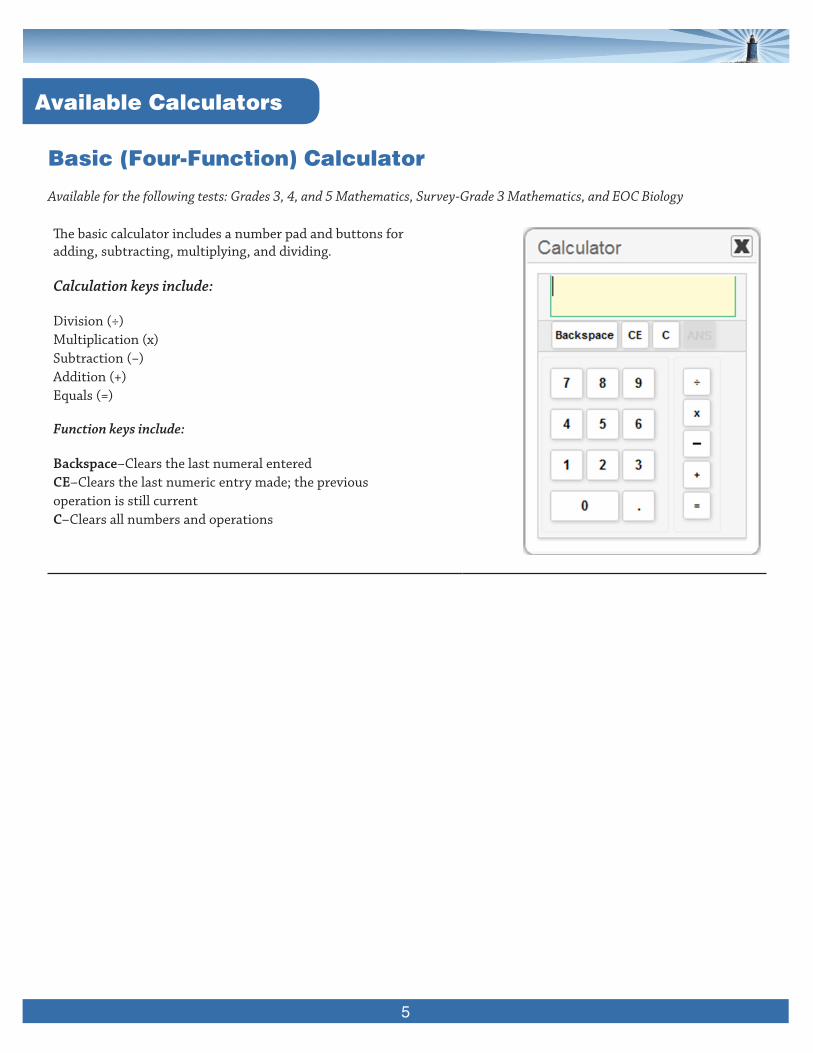
Basic (Four-Function) Calculator
Available for the following tests: Grades 3, 4, and 5 Mathematics, Survey-Grade 3 Mathematics, and EOC Biology
The basic calculator includes a number pad and buttons for adding, subtracting, multiplying, and dividing.
Calculation keys include:
Division (÷)Multiplication (x)Subtraction (−) Addition (+)Equals (=)
Function keys include:
Backspace–Clears the last numeral enteredCE–Clears the last numeric entry made; the previous operation is still currentC–Clears all numbers and operations
Available Calculators

6
Scientific CalculatorAvailable for the following tests: Grades 6–10 Mathematics, EOC Algebra, and EOC Integrated Math
In addition to the functions available on the basic calculator, the scientific calculator includes exponential, logarithmic, and trigonometric functions.
Calculation keys include:
Division (÷)Multiplication (x)Square root (√ )Subtraction (−) Sign (+/-)Addition (+)Equals (=)
Function keys include:
Backspace–Clears the last numeral enteredCE–Clears the last numeric entry made; the previous operation is still currentC–Clears all numbers and operationsANS–Retrieves last computed resultM–Indicates memory is fullSTO–Stores displayed value in memoryRCL–Recalls stored value from memoryC–Clears stored value in memorySin–Displays “sin(” followed by expression: used to find sine valuesCos–Displays “cos(” followed by expression: used to find cosine valuesTan–Displays “tan(” followed by expression: used to find tangent valuesAsin–Displays “asin(” followed by expression: used to find inverse sine valuesAcos–Displays “acos(” followed by expression: used to find inverse cosine valuesAtan–Displays “atan(” followed by expression: used to find inverse tangent values
e^x–Displays “exp(” followed by expression: used to find exponentials ln–Displays “ln(” followed by expression: used to find natural logarithmslog–Displays “log(” followed by expression: used to find logarithms(–Left parentheses)–Right parenthesesn!–Finds factorial of displayed value1/x–Finds multiplicative inverse of displayed valuex^y–Displays carrot symbol to represent exponential notationx^2–Finds the square of the displayed valuex^3–Finds the cube of the displayed valueπ–Displays the value of pi as 3.141593Abs–Displays “Abs(” followed by expression: used to find absolute valueDegrees–Sets calculator in degrees modeRadians–Sets calculator in radians mode

7
Graphing CalculatorAvailable for the following tests: Grades 6–10 Mathematics, EOC Algebra, and EOC Integrated Math
In addition to the function and calculation keys available on a scientific calculator, students can plot graphs and tables for up to four equations, as well as modify the graphing window parameters.
Graphing function keys include:
Expressions (Y=)–Allows student to enter up to four (4) different expressionsWindow–Allows student to set maximum and minimum axes values for graphing windowTable–Allows student to create a table of values for each entered expressionGraph–Shows graph for each entered expression using the windowReset–Clears all expressions and resets window to default valuesx-var–Inputs x-variable
Expressions (Y=)
By default, the [Expressions (Y=)] option is selected (shaded blue). Each expression can be an equality or inequality.
From each drop-down list, select from: • equals (=) • greater than (>)–shade above function • less than (<)–shade below function
Enter an expression into each desired Y text box. • To display the graph of the expression(s), click the
[Graph] button. • To change the window parameters, click the
[Window] button.

8
Window View
This section allows you to change the dimensions and scale for the graph output window.
Click the [Window] button and verify or update the value in each text box.
Xmin–Sets the minimum x value displayed on the graph’s x-axisXmax–Sets the maximum x value displayed on the graph’s x-axisYmin–Sets the minimum y value displayed on the graph’s y-axisYmax–Sets the maximum y value displayed on the graph’s y-axisTrace Step Size–This feature is comparable to the Xres feature on handheld graphing calculators, and allows you to change the pixel resolution. This value does not need to be changed.Xscale–Defines the distance between tick marks on the x-axisYscale–Defines the distance between tick marks on the y-axis
Table View
This section allows you to change the initial value of x based on the expressions entered in the [Expressions (Y=)] section. Changing the value of Init X will allow you to see the corresponding output values for each Y = expression.
After you have verified or updated the value in the Initial X (Init X) text box, click the [Apply] button.
Function keys include:
Apply–Shows y-values for the inputted x-valuePrevious–Shows y-values for the preceding 5 values of xNext–Shows y-values for the next 5 values of x
9
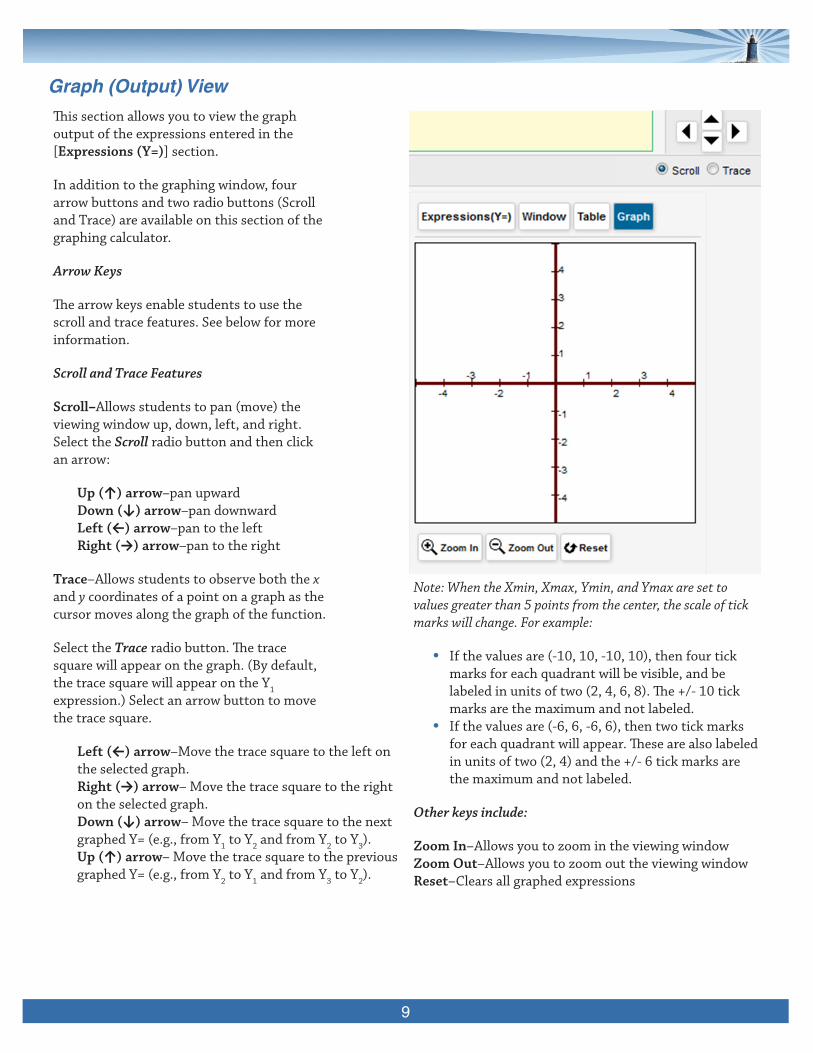
Graph (Output) View
This section allows you to view the graph output of the expressions entered in the [Expressions (Y=)] section.
In addition to the graphing window, four arrow buttons and two radio buttons (Scroll and Trace) are available on this section of the graphing calculator.
Arrow Keys
The arrow keys enable students to use the scroll and trace features. See below for more information.
Scroll and Trace Features
Scroll–Allows students to pan (move) the viewing window up, down, left, and right. Select the Scroll radio button and then click an arrow:
Up (↑) arrow–pan upwardDown (↓) arrow–pan downwardLeft (←) arrow–pan to the leftRight (→) arrow–pan to the right
Trace–Allows students to observe both the x and y coordinates of a point on a graph as the cursor moves along the graph of the function.
Select the Trace radio button. The trace square will appear on the graph. (By default, the trace square will appear on the Y1 expression.) Select an arrow button to move the trace square.
Left (←) arrow–Move the trace square to the left on the selected graph.Right (→) arrow– Move the trace square to the right on the selected graph.Down (↓) arrow– Move the trace square to the next graphed Y= (e.g., from Y1 to Y2 and from Y2 to Y3). Up (↑) arrow– Move the trace square to the previous graphed Y= (e.g., from Y2 to Y1 and from Y3 to Y2).
Note: When the Xmin, Xmax, Ymin, and Ymax are set to values greater than 5 points from the center, the scale of tick marks will change. For example:
• If the values are (-10, 10, -10, 10), then four tick marks for each quadrant will be visible, and be labeled in units of two (2, 4, 6, 8). The +/- 10 tick marks are the maximum and not labeled.
• If the values are (-6, 6, -6, 6), then two tick marks for each quadrant will appear. These are also labeled in units of two (2, 4) and the +/- 6 tick marks are the maximum and not labeled.
Other keys include:
Zoom In–Allows you to zoom in the viewing windowZoom Out–Allows you to zoom out the viewing window Reset–Clears all graphed expressions

10
Matrices CalculatorAvailable for the following tests: Grades 6–10 Mathematics, EOC Algebra, and EOC Integrated Math
In addition to the functions available on a basic or standard calculator, the matrices calculator can be used to compute inverses and perform matrix operations.
In the matrix section, you can select up to 7 rows and 7 columns for up to 5 matrices (M1, M2, M3, M4, or M5). Click an M tab to access that matrix. Once a matrix is entered, inverses and operations can be calculated.
Matrix Function keys include:
(–Left parentheses)–Right parenthesesInv–Displays “inv(“ followed by expression: used to calculate inverse of selected matrixDet–Displays “det(“ followed by expression: used to calculate determinant of selected matrixT = Displays “T(“ followed by expression: used to transpose selected matrixM1–Displays “M1” in viewing window for calculation purposes. References values input in M1 matrix.M2–Displays “M2” in viewing window for calculation purposes. References values input in M2 matrix.M3–Displays “M3” in viewing window for calculation purposes. References values input in M3 matrix.M4–Displays “M4” in viewing window for calculation purposes. References values input in M4 matrix.M4–Displays “M4” in viewing window for calculation purposes. References values input in M5 matrix.
Result–Displays result in selected matrix area (Note: To view the original matrix values, click the tab for that matrix.)Clear–Clears the selected (active) matrix values
11
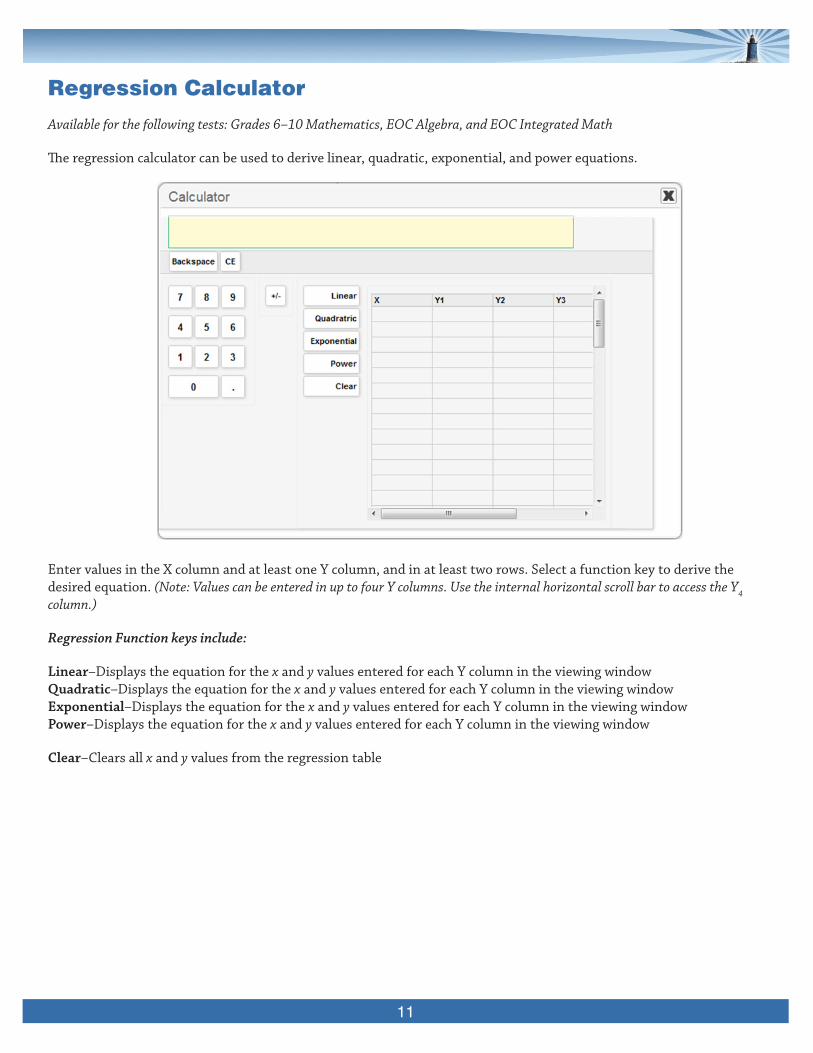
Regression CalculatorAvailable for the following tests: Grades 6–10 Mathematics, EOC Algebra, and EOC Integrated Math
The regression calculator can be used to derive linear, quadratic, exponential, and power equations.
Enter values in the X column and at least one Y column, and in at least two rows. Select a function key to derive the desired equation. (Note: Values can be entered in up to four Y columns. Use the internal horizontal scroll bar to access the Y4 column.)
Regression Function keys include:
Linear–Displays the equation for the x and y values entered for each Y column in the viewing windowQuadratic–Displays the equation for the x and y values entered for each Y column in the viewing windowExponential–Displays the equation for the x and y values entered for each Y column in the viewing windowPower–Displays the equation for the x and y values entered for each Y column in the viewing window
Clear–Clears all x and y values from the regression table

12
This section provides information on using keyboard shortcuts to enter calculations and equations. The keyboard shortcuts provided in this section work for all supported operating systems (Windows, Mac OS X, and Linux).
• The functionality is similar to navigating between elements on a test page. • The [Ctrl], [Shift], and arrow keys are used to navigate, and the space bar is used to select a value or variable.
To open the calculator in a test environment using keyboard shortcuts:
1. Press the [Ctrl] + [G] keys on the keyboard. This will open the Global Menu.
2. Use the arrow up or down keys to navigate to the calculator tool.
3. Press [Enter] to select and open the calculator.
Note: Refer to the Test Administrator User Guide for additional information about general keyboard shortcuts in a test.
Navigating Within the Calculator Each calculator has several “areas,” including the display, number keypad, and function keypad (see sample image). You can navigate between each area and within each area using the following shortcut keys.
To navigate between areas: • Press [Ctrl] + [Shift] + [→] OR [←].
To navigate within an area: • Press [Shift] + any arrow key (up, down, left, right).
To select a number or function to enter in the display: • Press the space bar. The selected value or variable will
appear in the display.
Sample Calculator
For graphing calculators, moving the trace square no longer requires keyboard shortcuts. The on-screen arrow buttons should be used to move the trace square.
Keyboard Shortcuts for Calculators