one planet living in the thames gateway - pandaassets.panda.org/downloads/thamesgateway.pdfone...
TRANSCRIPT
One Planet Living inthe Thames Gateway
A WWF-UK One Million Sustainable Homes Campaign Report
Nick James and Pooran DesaiBioRegional Development Group
June 2003
One Planet Living in the Thames GatewayA WWF-UK One Million Sustainable Homes Campaign ReportBioRegional Development Group
Page 2 of 66
BioRegional Development Group is an independentenvironmental organisation working with industry partners toimplement real-life, commercially viable solutions forsustainable living – bringing local sustainability into themainstream.
The Group has recently been involved in initiating,designing and constructing an urban eco-village in SouthLondon, Beddington Zero (fossil) Energy Development,or BedZED. The project was designed with architectBill Dunster and developed in partnership with thePeabody Trust.
BioRegional is currently engaged in further projects relatingto our experience at BedZED and the monitoring of thedevelopment in use. BioRegional also provide consultancyservices to Local Authorities, building professionals andother parties with an interest in sustainable living.
www.bioregional.com
The Stockholm Environment Institute is an independent,international research institute specialising in sustainabledevelopment and environment issues. It works at local,national, regional and global policy levels. The SEI researchprogrammes aim to clarify the requirements, strategies andpolicies for a transition to sustainability. These goals arelinked to the principles advocated in Agenda 21 and theConventions such as Climate Change, Ozone LayerProtection and Biological Diversity.
SEI’s mission is to support decision-making and inducechange towards sustainable development around the worldby providing integrative knowledge that bridges scienceand policy in the field of environment and development.
www.seiy.org
WWF, the global environment network, works to conserveendangered species, protect endangered spaces, andaddress global threats to the planet by seeking sustainablesolutions for the benefit of people and nature.
WWF’s mission is to stop the degradation of the planet’snatural environment and to build a futurein which humans live in harmony with nature, by:• conserving the world’s biological diversity• ensuring that the use of renewable resources
is sustainable• promoting the reduction of pollution and wasteful
consumptionwww.wwf.org.uk
Fulcrum Consulting is a leading international practice ofconsulting engineers specialising in the built environment.Their primary areas of activity are the following:• Mechanical and electrical services engineering• Building physics and passive environmental
control systems• Public Health• Daylighting and specialist artificial lighting design• Sustainability• Acoustics
www.fulcrumfirst.com
Dr Robin Stott
Robin Stott is a recently retired Consultant Physician whohas worked all his life in an inner city community basedteaching hospital. He has had a longstanding interest inthe wider aspects of health. He is presently vice chair ofMedact, a health professional organisation dedicated topromoting health through the development of economic,environmental and social justice.
He has written extensively about the similarities of theantecedents of sustainability and health, includinga Schumacher briefing on the subject. He is presentlythe sustainability advisor to the mayor of Lewisham,and is a Sustainable Development Commissionerfor London.
For further information please contact:
Paul KingWWF-UKPanda House, Weyside ParkGodalming, Surrey GU7 1XRTelephone: 01483 426444Fax: 01483 426409
© WWF-UK, 2003Registered Charity No 1081247Panda symbol © WWF 1986® WWF Registered Trademark
Cover photosFamily: Image 100Houses: Raf Makda, Bill Dunster ArchitectsGlobe: Mountain High Maps

One Planet Living in the Thames GatewayA WWF-UK One Million Sustainable Homes Campaign ReportBioRegional Development Group
Page 3 of 66
Contents
4 Executive Summary7 WWF’s One Million Sustainable Homes Campaign8 The Thames Gateway9 Government Targets
14 Sustainability – three planets into one planet15 Four Scenarios for the Thames Gateway18 Impact criteria20 Energy use in the Home23 Transport27 House Infrastructure31 Shared Infrastructure35 Waste and Consumer Items38 Water41 Built Land43 Services45 Food47 Key findings47 Headline Findings47 CO2 emissions associated with energy use in the home48 CO2 emissions associated with built form and utility use49 CO2 emissions associated with lifestyle50 Total Carbon Dioxide emissions52 Ecological Footprint54 Capital Costs and Personal Expenditure56 Conclusions56 Environmental Impacts57 Cost of Homes and Infrastructure58 Ecological Footprint59 Living on One Planet60 Next Steps61 Appendix 1: The Health benefits of a compact ‘environmentally friendly’ city64 Appendix 2: Scenario Data-sets
One Planet Living in the Thames GatewayA WWF-UK One Million Sustainable Homes Campaign ReportBioRegional Development Group
Page 4 of 66
Executive Summary
If everyone on the planet were to consume natural resources and pollute the environment as wecurrently do in the UK, we would need three planets to support us.1 Reducing the environmentalimpact of homes in the UK is crucial in pursuing sustainable development on a broader scale.
In February 2003, the UK government released its Sustainable Communities Plan, highlightingthe need for development in four ‘growth areas’, including the Thames Gateway region. WWFaccepts that there is a need for new and refurbished housing in some parts of the UK. However,decisions about where and how housing is developed must be taken in the context ofsustainability – minimising negative environmental impacts while maximising social andeconomic benefits. Major developments in the Thames Gateway will be seen as a blueprint forthe government’s approach to housing over the next 15-20 years. This is especially true giventhat key decisions will have to be taken before forthcoming revisions to planning guidance andbuilding regulations have come into effect.
For this reason, the report focuses on the Thames Gateway region as a case study andinvestigates the implications of building 200,000 new homes to different environmentalstandards:
Scenario 1 Current Building Regulations with ‘average’ UK residents;Scenario 2 Building Research Establishment’s (BRE) EcoHomes ‘Very Good’ standard with
‘average’ UK residents;Scenario 3 BRE’s EcoHomes ‘Very Good’ standard with environmentally aware residents;Scenario 4 ‘Z2’ standard (Zero fossil Energy, Zero Waste) with environmentally aware
residents.
The environmental impacts of the various scenarios have been measured in terms of specificissues such as carbon dioxide emissions, water use and waste as well as in terms of overallecological footprint. The study has also assessed the contributions to the government’ssustainable development targets, as well as the impacts on the costs of house building andassociated infrastructure and household expenditure of the four different scenarios.
Sustainable homes offer the opportunity for the government to anchor the idea of sustainabilityin people’s everyday lives. Global threats, such as climate change, often appear to be intangibleconcepts about which individuals feel they can do little. Addressing sustainability effectivelytherefore requires not only education and explanation, but the provision of relevant, inspiringand practical solutions with which people can engage in a meaningful and positive way.
Key findings
The study demonstrates that by developing 200,000 new homes in the Thames Gateway to aminimum of EcoHomes ‘Very Good’ standard, the following significant environmental savingscould be made per home/per year when compared with homes built to current BuildingRegulations:
• 32 per cent reduction in carbon dioxide (CO2) emissions from energy use in the home, (thissaving of 0.993 tonnes of CO2/home/year equates to 198,840 tonnes of CO2 or 54,220tonnes of carbon for the 200,000 homes each year);
• 39 per cent reduction in water use;• 4 per cent reduction in the amount of household waste sent to landfill for an ‘average’ UK
resident living in Scenario 2; and 1 The Living Planet Report, www.panda.org/downloads/general/LPR_2002.pdf

One Planet Living in the Thames GatewayA WWF-UK One Million Sustainable Homes Campaign ReportBioRegional Development Group
Page 5 of 66
• 25 per cent reduction in the amount of household waste sent to landfill for anenvironmentally aware resident living in Scenario 3.
The study shows that even greater savings could be made per home per year by developing allhomes in the Thames Gateway to Z2 standards:
• 99 per cent reduction in CO2 emissions from energy use in the home (this saving of 3.052tonnes of CO2/home/year, equates to 610,640 tonnes of CO2 or 166,540 tonnes of carbonfor the 200,000 homes each year);
• 65 per cent reduction in water use; and• 76 per cent reduction in the amount of household waste sent to landfill.
Cost of Homes and Infrastructure
The study demonstrates that in terms of capital costs and personal expenditure related to thepurchase and running of a home, the cost of developing 200,000 homes to EcoHomes ‘VeryGood’ standard and to ‘Z2’ standards would be comparable to, or even cheaper than, the cost ofdeveloping to current Building Regulations. This is because the additional build costs (estimatedto be 2 per cent for EcoHomes and 10 per cent for Z2) could be offset partly by planning gain (amechanism whereby developers can increase development in exchange for meetingenvironmental targets, saving 50 per cent of the extra cost), and partly by residents payingslightly more for their homes. The study shows that these increased mortgage repaymentswould be compensated for by the savings from reduced energy and water bills. In fact if allhousehold expenditure is considered, including transport and waste, the report findings suggestthat sustainable living in the Thames Gateway would result in lower household expenditure forresidents in addition to the environmental benefits.
The study suggests that the infrastructure costs for all four scenarios would be comparable. Thegovernment already recognises that it must provide the necessary investment to facilitate thedevelopment of the Thames Gateway. Taking into account private sector expenditure, this studyestimates that public sector investment of approximately £1.2 billion a year for 20 years will benecessary for the development of 200,000 homes in the Thames Gateway, includinginfrastructure costs such as transport and flood prevention. Based on the estimated reducedinfrastructure materials needed for Scenarios 2, 3 and 4, this study suggests that theinfrastructure costs could in fact be less than for current Building Regulations (2 per cent, 5 percent and 10 per cent reduction respectively).
Therefore, the study shows that in terms of both personal expenditure and capital costs,developing homes to a minimum of EcoHomes ‘Very Good’ standard, and to Z2 standards, couldindeed be cheaper than building to current regulations.
Ecological Footprint
This study demonstrates that even with significant savings in terms of carbon dioxide, water useand waste in Scenarios 2 and 3, the overall savings in terms of an individual’s total ecologicalfootprint when compared to Scenario 1 are limited:
• 4 per cent for Scenario 2 (8 per cent compared to UK average); and• 11 per cent for Scenario 3 (15 per cent compared with the UK average).

One Planet Living in the Thames GatewayA WWF-UK One Million Sustainable Homes Campaign ReportBioRegional Development Group
Page 6 of 66
This is because a considerable component of an individual’s ecological footprint is attributableto their share of infrastructure and services which are beyond the scope of the EcoHomesstandard.
The figures in Scenario 4 show that individuals can reduce their footprint by 38 per cent (or 40per cent compared with the UK average). This is because Scenario 4 facilitates moresustainable lifestyle decisions (e.g. by providing car clubs to minimise personal car use and byenabling deliveries of locally produced organic food). This study shows that residents living inScenario 4 can go a long way in reducing their ecological footprint, but it would still not beenough to enable an individual to live a truly ‘one planet’ lifestyle.
Conclusions and recommendations
It is evident that construction standards play a significant role in reducing environmentalimpacts, and that people can make very significant contributions to reducing their impactthrough the lifestyle choices they make. However, the study also demonstrates the vitalimportance of shared infrastructure and services. The ecological footprinting analysis suggeststhat UK residents could reduce their ‘three planet lifestyle’ by approximately one planet throughliving in a Z2 home and through their lifestyle choices. To save the second planet and live withinour fair share of the Earth’s resources, we must also reduce the impact of our sharedinfrastructure and services.
1. New communities should be developed to Z2 standards to enable residents to livesustainably and achieve ‘one planet living’. As an absolute minimum, the UK governmentshould require that homes be built to the highest BRE EcoHomes standards of ‘Very Good’or ‘Excellent’.
2. Provision of the new and upgraded levels of infrastructure to facilitate development in theThames Gateway will require substantial investment. The government must spend thismoney in a way that achieves significant environmental savings for the same costs. Forexample, investing in public transport, cycle networks and car clubs will reduce the relianceon private fossil fuel miles and result in fewer roads being required.
3. Key decisions about the Thames Gateway and the other growth areas will be made beforethe forthcoming reforms of the planning and building regulatory processes are implemented.WWF believes the government must intervene to ensure that development throughout theThames Gateway and the other growth areas meets the highest possible sustainabledevelopment standards.
If the government is to meet its own sustainable development targets and realise the aspirationsset out in the Sustainable Communities Plan, it must set minimum sustainable constructionstandards and create the necessary infrastructure and services to enable people to live withintheir fair share of the Earth’s resources.
One Planet Living in the Thames GatewayA WWF-UK One Million Sustainable Homes Campaign ReportBioRegional Development Group
Page 7 of 66
WWF’s One Million Sustainable Homes Campaign
In December 2001, WWF-UK invited the UK government and devolved administrations to makea public commitment to develop a million ‘sustainable homes’ in the UK (including new andrefurbished homes). WWF recognised that the government and devolved administrations couldnot deliver such a commitment alone. They would need the support of a wide range ofstakeholders, including the house building industry, the investment community, local authorities,consumers and non-governmental organisations (NGOs).
WWF has secured commitments from a wide range of organisations including house builders,developers, investors, industry trade associations and research organisations. WWF hasconvened a Sustainable Homes Task Force comprising key partners from these sectors tooversee the different strategies needed to overcome the ‘barriers’ to sustainable homesidentified during the consultation process.
Recommendations
WWF is urging the government to build on its expressions of support and commit to action. TheSustainable Communities Plan set out a number of policy directions intended to create ‘thrivingsustainable communities’, although WWF was disappointed that the government did not gofurther in specifying minimum sustainable construction standards for all new and refurbishedhomes.
Similarly, WWF was disappointed that despite the government’s aspirations to reduce carbonemissions by 60 per cent by 2050, as set out in the recent Energy White Paper, the governmentfailed to outline how it intended to deliver real emissions reductions and long-term investment inlow carbon technologies. In order to meet sustainability targets such as those for CO2, WWFbelieves that the government must support the development of sustainable homes in thefollowing ways:
1 Through leadership and vision
The government should set a minimum sustainable construction standard for homes. TheSustainable Communities Plan outlined plans for the creation of four priority growth areas(namely Milton Keynes, Stansted, Ashford and the Thames Gateway) to help meet the shortfallin housing supply in the south-east. According to the Deputy Prime Minister, ‘each of theseoffers an exciting opportunity for new design led sustainable communities – like the GreenwichMillennium Village’. To achieve these sentiments, WWF believes that new communities shouldbe developed to Z2 standards to enable residents to live sustainably and achieve ‘one planetliving’. As an absolute minimum, the government should require that homes be built to thehighest BRE EcoHomes standards of ‘Very Good’ or ‘Excellent’.
2 As a construction client
The government has already demonstrated leadership through the Millennium Communitiesexemplar schemes, and through English Partnerships and the Housing Corporation (the latternow requiring an EcoHomes ‘Pass’ standard). WWF believes the government should insist thatall new and refurbished homes it is responsible for must meet a minimum standard ofEcoHomes ‘Very Good’ (in line with English Partnerships’ current position). The governmentalready requires all new non-residential buildings that it funds to meet BREEAM ‘Excellent’standard, so why not housing?
One Planet Living in the Thames GatewayA WWF-UK One Million Sustainable Homes Campaign ReportBioRegional Development Group
Page 8 of 66
3 Through Regulatory Reform
The government should provide fiscal incentives for the development of sustainable homes, asproposed in the WWF/ERM discussion document, Fiscal Incentives for Sustainable Homes,May 2002 (www.wwf.org.uk/filelibrary/pdf/sustainablehomes.pdf).
The government should ensure that sustainability lies at the heart of all planning decisions. Thiscould be achieved by providing clear planning policy guidance in favour of sustainablecommunities based on Z2 standards, with all homes built to a minimum of EcoHomes ‘VeryGood’ or ‘Excellent’ standards.
WWF believes that the government must undertake a fundamental review of buildingregulations to ensure they help deliver its sustainable development targets in relation to energyefficiency/fuel poverty, use of sustainable energy, reducing waste and pollution, and promotingresponsible use of natural resources such as water and timber.
More details of WWF’s sustainable homes campaign can be found in One MillionSustainable Homes – Turning Words into Action or via www.wwf.org.uk.
The Thames Gateway
Background
The planned development of the Thames Gateway is the largest and most ambitiousregeneration initiative in Europe. The area is one of the four priority growth areas set out by theUK government to meet housing demands in the South-east. In early summer 2003 thegovernment will announce targets for the number of homes to be built in the area.
The Thames Gateway area of London and South-east England covers over 700 km2 includingmore than 1,000 hectares of previously-used developable land, making it the UK’s largestbrownfield site. The Thames Gateway extends from Tower Bridge eastwards to Thurrock andout to Shoeburyness and the Isle of Sheppey. Its boundaries cross 15 local authority areas:Newham, Tower Hamlets, Lewisham, Greenwich, Bexley, Havering, Barking and Dagenham,Dartford, Gravesham, Medway, Swale, Southend-on-Sea, Castle Point, Basildon and Thurrock.The total area is a powerful strategic location offering development opportunities for new jobsand homes, in addition to environmental improvements. In the past, large areas to the east ofLondon have missed out on the economic development, investment and employment growthwhich can be seen in many parts of west London.
Government predictions suggest that the population of London is going to expand considerably.Over the next 15 years, it is anticipated that London will gain 700,000 new residents, 440,000 ofwhom will come from growth within the existing population. The Deputy Prime Minister, JohnPrescott, has called for a second generation of new and expanded towns in the South-eastcapable of providing 200,000 homes. Much of this planned growth will occur in the ThamesGateway region.
The Thames Gateway Strategic Partnership, headed by the housing and regeneration minister,Lord Rooker, indicates that the area has the potential for 179,060 homes and 324,800 jobs. TheMayor of London his indicated in his draft London Plan projections of employment growth at anet 636,000 jobs and the need for 345,000 additional homes over the period 2002-2016.A Cabinet Committee, chaired by the Prime Minister, will consider how far and to what timescalethe government should seek to develop the Thames Gateway. The government will set out its

One Planet Living in the Thames GatewayA WWF-UK One Million Sustainable Homes Campaign ReportBioRegional Development Group
Page 9 of 66
conclusions in June 2003. Until they have been announced, and for the purposes of this study,a figure of 200,000 new homes in the Thames Gateway over the next 20 years will be assumed.
The founding document on Thames Gateway London, RPG9a, stressed the importance ofraising design standards and the quality of the environment radically, if the area was to turn itspotential for development into a reality. It identified that to create a vibrant and sustainablepattern of communities, the developments must provide a mix of employment, housing and theactivities needed for thriving communities, minimising the need for travel, and taking full accountof the existing pattern of development.
The ‘Heroic Change’ report
Heroic Change: Securing Environmental Quality in Thames Gateway was published by theThames Gateway London Partnership and Arup in 2001. The document includes a collection ofbest practice case studies in environmental quality and design from around the ThamesGateway, the United Kingdom and Europe.
The document was prepared with a ‘bottom up’ approach, in consultation with local authorities,statutory organisations, developers and community groups. It was launched by Lord Falconerwith the aim of complementing existing planning guidance to be used by planners, developersand local communities to make improvements in terms of sustainable development and designquality. The 12 key objectives of the publication are to:
• create a dramatic change in image;• focus on town centres for renovation;• make the most of major development sites;• create sustainable new communities;• improve the sustainability of buildings;• revive existing neighbourhoods;• facilitate regeneration of employment areas;• encourage housing innovation;• make vacant properties contribute to their environment;• conceive streets as places;• build sustainable streets; and• sustain a prime role for the rivers.
Government targets
The UK government has made commitments on a range of environmental, social and economictargets. Its aims of achieving a sustainable future have most recently been highlighted in theEnergy White Paper, the Sustainable Communities plan and through its commitment to itsHeadline Sustainable Development Indicators. However, it is unclear how the government willmeet these targets when it appears to lack coherent vision of what a sustainable future mightlook like – where social, environmental and economic factors are actually integrated, rather thantraded off against each other.
Government projections for the numbers of new homes required in England over the next 20-50years have the potential to conflict with these targets. WWF believes that committing to andimplementing a sustainable homes programme reconciles this conflict, while providing apowerful vehicle for delivering and integrating sustainability targets, and demonstrating ‘joined-up’ thinking on sustainable development.
One Planet Living in the Thames GatewayA WWF-UK One Million Sustainable Homes Campaign ReportBioRegional Development Group
Page 10 of 66
Sustainable homes offer the opportunity for the government to anchor the idea of sustainabilityin people’s everyday lives. Global threats, such as climate change, often appear to be intangibleconcepts about which individuals feel they can do little. Addressing sustainability effectivelytherefore requires not only education and explanation, but the provision of relevant, inspiringand practical solutions with which people can engage in a meaningful and positive way. Theopportunity to live in a sustainable home will offer just this – an affordable, attractive living spacethrough which people can make a concrete and quantifiable contribution to sustainabledevelopment. A sustainable home will also lay the foundation for sustainable purchasingdecisions in relation to food, household goods, and everyday activities such as transport andleisure.
Sustainable homes could also offer significant health benefits to residents and contribute togovernment targets on health. Dr Robin Stott (see Appendix 1) confirms the link betweensustainability and wellbeing for both individuals and the planet, and that the quality of ourbuildings and environment has an important effect on our health. Dr Stott notes that a compact,eco-friendly city, as defined in scenario 4, can be of:
• Direct benefit to individual inhabitants: Reduced traffic levels would result inbetter air quality, lower noise levels and decreased accident rates, as well asincreasing a sense of community through minimising community dislocationcommonly associated with traffic. The alternatives of cycling and walking wouldboost health through increased exercise. The benefits of having access to healthy,local, organic food are also mentioned.
• Indirect benefit to individual inhabitants: Reduced traffic congestion and airpollution would reduce asthma and respiratory problems. The availability ofaffordable warmth would help reduce fuel poverty and the associated healthimplications. The local cycles of production and consumption can have societal,environmental and economic benefits. In addition, residents may benefit from anenhanced sense of trust and control in their neighbourhood.
• Benefit to the wider and global community: There will be global benefits in termsof reducing carbon dioxide (CO2) emissions and climate change.
Energy White Paper
On 24 February 2003, the government published its long-awaited White Paper on energy, Ourenergy future – creating a low carbon economy, which acknowledges that current energystrategy will be unable to meet future challenges and outlines changes in energy policy. In aspeech to mark the publication of the Paper, the Prime Minister warned that extreme climaticevents will cause £150 billion of destruction each year across the world in a decade.
The government has identified an aspirational target of achieving a 60 per cent reduction incarbon dioxide emissions by 2050 (a target recommended by the International Panel on ClimateChange), this is to be primarily met through reducing consumption and boosting the use ofrenewable energy sources. In achieving this long-term target and an intermediate reductiontarget of 15-25 million tonnes of carbon (MtC) by 2020, energy efficiency is identified asdelivering half of the necessary improvements.
One Planet Living in the Thames GatewayA WWF-UK One Million Sustainable Homes Campaign ReportBioRegional Development Group
Page 11 of 66
As the CO2 emissions attributable to the construction and occupation of our homes equates toapproximately 27 per cent of all CO2 emissions in the UK2, it is clear that the sustainability of ourhomes will play a pivotal role in achieving our sustainable future. In the White Paper, thegovernment expressed its aims for improving the energy performance of homes in the UK bybringing forward the next revision of the Building Regulations to 2005, and stating its aim toensure that every home is adequately and affordably heated with nobody living in fuel povertyby 2016-183. The White Paper indicates that 4-6 MtC of the total 15-25 MtC reductions by 2020,could be achieved through energy efficiency in households.
The London Sustainable Development Commission (LSDC) has recommended the reduction ofCO2 emissions in London of 20 per cent from 1990 levels by 2010. This target would be a firststep in a process that would lead to a minimum target of 60 per cent reduction in CO2 emissionsby 2050. To meet these reductions, challenging targets will have to be set for new buildings. Ithas been calculated by the LSDC that to help achieve the 2050 target, all new developments inLondon from now on should be CO2 neutral, and that a 40 per cent saving in current fuel use isalso required for all existing developments. These figures were calculated using currentdomestic fabric renewal rates and predicted housing stock numbers for London over the next 50years. As the homes built today will still be in use in 60+ years, the 2050 target was viewed asthe most important for the construction sector to address now.
Despite the predicted decline in CO2 emissions after 2005, Cambridge Econometrics4 reportsthat the attainment of the government’s domestic goal of a 20 per cent reduction in the 1990level of CO2 emissions by 2010 appears to be unattainable without significant new policymeasures. By 2010, household carbon emissions are expected to be 26 per cent above the1990 level and they, along with road transport, remain formidable barriers to progress towardsthe government’s 20 per cent domestic carbon reduction target.
An aim of this study is to help illustrate that by developing the Thames Gateway usingsustainable design and community principles, significant progress towards meeting thegovernment CO2 targets could be achieved.
Communities Plan
Sustainable Communities: Building for the future was published in February 2003. Thedocument reports on the government’s planned programme of action to tackle the pressingproblems related to communities in England. These are primarily issues of affordability andabandonment, the provision of decent homes and a good quality local environment for all.
The programme aims to demonstrate a step change in the government’s approach. Thedocument acknowledges that a wider vision of sustainable communities is required to underpinthe government’s plan which aims to show its commitment to sustainable design. The documentidentifies that the way our communities develop economically, socially and environmentallymust respect the needs of future generations as well as succeeding now. The need for providingaccess to decent affordable housing in decent surroundings is established.
The framework document sets out priorities for investment over the next three years, butrecognises that 15-20 years of action will be required to facilitate change. One of the aims ofthis study is to help demonstrate that designing and building sustainable communities today in 2 Urban Task Force (1999), ‘Towards an Urban Renaissance’, E & FN Spon, London3 In the UK, an estimated 2.5 million households spend over 10 per cent of their income on heating their homes, this has fallen from5.5 million in 1996, but this is primarily due to reductions in energy costs rather than increased energy efficiency4 www.camecon.co.uk
One Planet Living in the Thames GatewayA WWF-UK One Million Sustainable Homes Campaign ReportBioRegional Development Group
Page 12 of 66
the Thames Gateway is an ideal opportunity to implement the aspirations of ideas in thesustainable communities plan and achieve our sustainable future.
Headline Sustainable Development Indicators
In May 1999, the government published A better quality of life, the strategy document (andsubsequent annual progress reports) aimed to demonstrate commitment to sustainabledevelopment throughout the UK.
The strategy included headline indicators to both raise awareness and help focus publicattention on what sustainable development is. The 15 indicators represent a ‘quality of lifebarometer’ which measure performance against the three pillars of sustainable development –social progress, environmental protection and economic growth. The strategy also outlined awider set of 147 indicators that focus on specific issues which cover people’s everyday quality oflife concerns.
Of the 147 indicators used to measure progress towards achieving government sustainabledevelopment objectives, 70 can be linked to housing and community issues, this is anillustration of the importance of housing in achieving our sustainable future.
One Planet Living in the Thames GatewayA WWF-UK One Million Sustainable Homes Campaign ReportBioRegional Development Group
Page 13 of 66
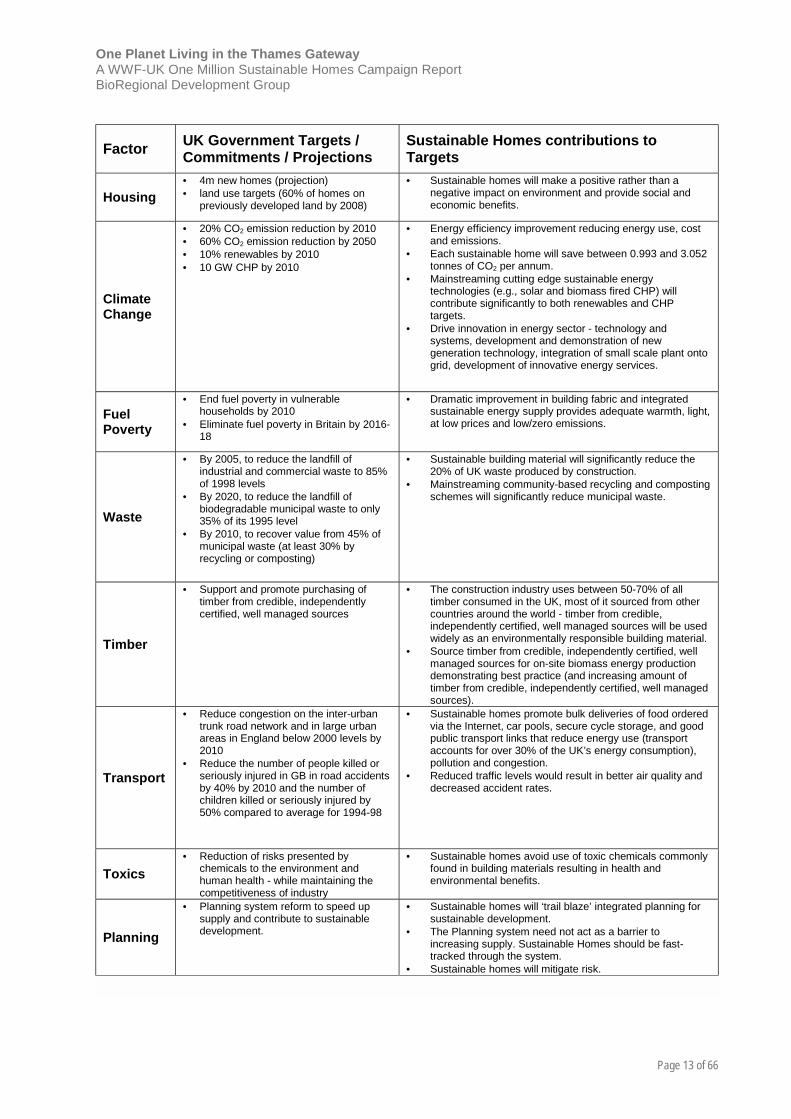
Factor UK Government Targets /Commitments / Projections
Sustainable Homes contributions toTargets
Housing• 4m new homes (projection)• land use targets (60% of homes on
previously developed land by 2008)
• Sustainable homes will make a positive rather than anegative impact on environment and provide social andeconomic benefits.
ClimateChange
• 20% CO2 emission reduction by 2010• 60% CO2 emission reduction by 2050• 10% renewables by 2010• 10 GW CHP by 2010
• Energy efficiency improvement reducing energy use, costand emissions.
• Each sustainable home will save between 0.993 and 3.052tonnes of CO2 per annum.
• Mainstreaming cutting edge sustainable energytechnologies (e.g., solar and biomass fired CHP) willcontribute significantly to both renewables and CHPtargets.
• Drive innovation in energy sector - technology andsystems, development and demonstration of newgeneration technology, integration of small scale plant ontogrid, development of innovative energy services.
FuelPoverty
• End fuel poverty in vulnerablehouseholds by 2010
• Eliminate fuel poverty in Britain by 2016-18
• Dramatic improvement in building fabric and integratedsustainable energy supply provides adequate warmth, light,at low prices and low/zero emissions.
Waste
• By 2005, to reduce the landfill ofindustrial and commercial waste to 85%of 1998 levels
• By 2020, to reduce the landfill ofbiodegradable municipal waste to only35% of its 1995 level
• By 2010, to recover value from 45% ofmunicipal waste (at least 30% byrecycling or composting)
• Sustainable building material will significantly reduce the20% of UK waste produced by construction.
• Mainstreaming community-based recycling and compostingschemes will significantly reduce municipal waste.
Timber
• Support and promote purchasing oftimber from credible, independentlycertified, well managed sources
• The construction industry uses between 50-70% of alltimber consumed in the UK, most of it sourced from othercountries around the world - timber from credible,independently certified, well managed sources will be usedwidely as an environmentally responsible building material.
• Source timber from credible, independently certified, wellmanaged sources for on-site biomass energy productiondemonstrating best practice (and increasing amount oftimber from credible, independently certified, well managedsources).
Transport
• Reduce congestion on the inter-urbantrunk road network and in large urbanareas in England below 2000 levels by2010
• Reduce the number of people killed orseriously injured in GB in road accidentsby 40% by 2010 and the number ofchildren killed or seriously injured by50% compared to average for 1994-98
• Sustainable homes promote bulk deliveries of food orderedvia the Internet, car pools, secure cycle storage, and goodpublic transport links that reduce energy use (transportaccounts for over 30% of the UK’s energy consumption),pollution and congestion.
• Reduced traffic levels would result in better air quality anddecreased accident rates.
Toxics• Reduction of risks presented by
chemicals to the environment andhuman health - while maintaining thecompetitiveness of industry
• Sustainable homes avoid use of toxic chemicals commonlyfound in building materials resulting in health andenvironmental benefits.
Planning
• Planning system reform to speed upsupply and contribute to sustainabledevelopment.
• Sustainable homes will ‘trail blaze’ integrated planning forsustainable development.
• The Planning system need not act as a barrier toincreasing supply. Sustainable Homes should be fast-tracked through the system.
• Sustainable homes will mitigate risk.
One Planet Living in the Thames GatewayA WWF-UK One Million Sustainable Homes Campaign ReportBioRegional Development Group
Page 14 of 66
Sustainability – three planets into one planet
Ecological footprinting (EF) analysis is an accounting tool that represents the environmentalimpacts of a process or person’s lifestyle in terms of an area of land required to sustainablyproduce a particular natural resource or to absorb waste from consumption. It measures thearea of biologically productive land that is required to meet the needs of a given product, personor population. It compares this area with the actual available area on Earth and informs uswhether we are living within the Earth’s regenerative capacity.
A person’s ecological footprint is made up of the footprints of all of their activities, productsconsumed and waste produced. It includes the area of forest required to sequestrate the CO2emissions attributed to that person, and a share of the area taken up by infrastructure, food andtimber growing and fishing. A person’s energy consumption has an eco-footprint, as do theirfood consumption, transport, work activities and leisure activities.
Eco-footprinting figures in WWF’s Living Planet Report 20025, inform us that it takes around5.35 global hectares of biologically productive land to support each person in the UK6. Researchcarried out by Stockholm Environment Institute (SEI-Y) for this study suggests that if the EF fora typical UK citizen is calculated using the methodology and criteria established in this study, itwould be approximately 5.71 global hectares. The actual available productive area on Earth is1.9 global hectares per person.
Hence, it can be concluded that if everyone on the planet consumed as much as the averageperson in the UK, we would need three planets to support us.
This analysis suggests the UK needs to reduce its consumption of fossil fuels and virginmaterials by two-thirds to be environmentally sustainable as part of a concept of living within afair share of the Earth’s resources. To achieve this reduction in consumption we need todevelop lifestyles that are consistent with one planet sustainable ways of living.
Ecological footprinting (EF) analysis indicates that how people live, work, play and consume intheir day-to-day lives is as important as the environmental impact of their homes in themselves.It is probable that the only way to reduce the ecological footprint from a three-planet level toOne Planet Living is a through a coherent approach based on the compact city form7, based ona circular metabolism8 and bioregional principles of meeting more of everyday needs from localrenewable and waste resources9.
A wider definition of sustainability covers more than environmental impact. It is frequentlydefined in terms of the ‘triple bottom line’ comprising social, environmental and economicsustainability. For our future developments and communities to be truly sustainable, they mustaddress the social amenity, creating sustainable communities with spaces people want to liveand work in. Developments must also offer financially sustainable solutions which are viablewithin a market economy.
5 WWF International (2002), ‘Living Planet Report 2002’, Avenue de Mont-Blanc, 1196 Gland, Switzerland6 Stockholm Environment Institute (York) refer to the latest figure of 5.45 gha, calculated by Mathis Wackernagel.7 Richard Rogers, Cities of a Small Planet8 Herbert Girardet, The Metabolism of Cities9 Desai and Riddlestone, BioRegional Solutions for Living on One Planet
One Planet Living in the Thames GatewayA WWF-UK One Million Sustainable Homes Campaign ReportBioRegional Development Group
Page 15 of 66
The environmental, social and financial issues surrounding sustainable development areparticularly closely interlinked in the housing sector. Ensuring access to appropriate, efficientand safe homes plays an important role in community wellbeing and regeneration, as doesensuring that such homes are affordable to build, buy and run, in addition to being designed totackle issues such as fuel poverty.
Four Scenarios for the Thames Gateway
BioRegional has developed data-sets for 4 lifestyle scenarios with the purpose of comparing thesustainability of different ways of living suggested from the occupation of different homes. Thescenarios were developed to reflect the impact of different lifestyles facilitated by living incommunities and homes built to differing environmental standards. These range from a new UKhome built to current Building Regulations occupied by a ‘typical’ UK resident with averageconsumption patterns and energy demands, to an enthusiastic sustainability-minded residentliving in an energy efficient home based on the ZED model developed at Beddington ZeroEnergy Development (see below) within a compact Z2 (zero fossil energy, zero waste)community. Located between these two scenarios are two scenarios based on communities ofhomes which achieve a score of ‘Very Good’ on EcoHomes, the Building ResearchEstablishment’s sustainability assessment tool. In the first, the residents live typical lifestyles, inthe second they have made lifestyle decisions to try to reduce their environmental impact.
Scenario Description1 Typical UK resident in typical new UK home to 2002 Building Regulations2 Typical UK resident in typical new UK home to EcoHomes ‘Very Good’3 Environmentally aware resident in typical new home to EcoHomes ‘Very Good’4 Keen resident living in a Z2 – zero fossil energy, zero waste Community
Scenario 1: Building Regulations
The Building Regulations are made under powers provided in the Building Act 1984. They applyin England and Wales where the majority of building projects are required to comply with them.They contain a list of requirements designed to ensure the health, safety and welfare of peoplein and around buildings, as well as providing for energy conservation. The Building Regulationsdeal with the minimum standards required for buildings.
The Building Regulations contain various sections dealing with definitions, procedures, andwhat is expected in terms of the technical performance of building work. Anyone wanting tocarry out building work which is subject to the Building Regulations is required by law to makesure it complies with the regulations.
The new Building Regulations took effect on 1 April 2002 in England and Wales; there are majorchanges regarding the conservation of the fuel and power from the previous 1995 edition. As aresult of the Kyoto Protocol and UK government targets to reduce CO2 emissions, the newApproved Documents L1 and L2 have switched to a measurement of performance based oncarbon output. The legal requirements set out under Approved Document L1: Conservation offuel and power in dwellings are as follows:
‘Reasonable provision shall be made for the conservation of fuel and power in dwellings by:
a) Limiting heat loss: i. through the fabric of the building; ii. from hot water pipes and hot air ducts used for space heating; iii. from hot water vessels;
One Planet Living in the Thames GatewayA WWF-UK One Million Sustainable Homes Campaign ReportBioRegional Development Group
Page 16 of 66
b) Providing space heating and hot water systems which are energy efficient;
c) Providing lighting systems with appropriate lamps and sufficient controls so that energycan be used efficiently;
d) Providing sufficient information with the heating and hot water services so that buildingoccupiers can operate and maintain the services in such a manner as to use no moreenergy than is reasonable in the circumstances.’
The information used to compile the data-set for Scenario 1 for a resident living in the ThamesGateway and occupying a typical new home built to current Building Regulations is primarilybased on figures published by the government and the Building Research Establishment (BRE)on average lifestyle and consumption data for the UK or South-east, and energy and servicesdemands for typical new homes.
In this scenario, assumptions have been made on the levels of shared infrastructure andservices associated with typical UK living. Some of the headline data is taken from the ThamesGateway Strategic Executive Partnership’s suggested figures of 180 primary schools, 30secondary schools, 72 primary care centres and 224 GP surgeries. Further approximations onthe levels of shared infrastructure have been produced in consultation with Fulcrum Consulting.
Scenarios 2 and 3: EcoHomes ‘Very Good’
It is widely accepted in the construction sector that BRE EcoHomes is the most comprehensiveand successful sustainability assessment tool for housing currently available. EcoHomesconsiders the broad environmental concerns of climate change, resource use and impact onwildlife, and balances these against the need for a high quality of life, and a safe and healthyinternal environment. The BRE tool addresses the environmental sustainability of newdevelopments and refurbishments under seven criteria (energy, water, land use and ecology,transport, health and wellbeing, pollution, and materials) with the aim of providing an indicationof the sustainability of a home.
EcoHomes assessments can be carried out at the design stage and although every house typeon a site must be considered, the award is given for the whole development. This enables thedevelopers to use the result to promote whole sites – every house that is part of thedevelopment has the same rating. EcoHomes is the homes version of BREEAM (the BREEnvironmental Assessment Method). BREEAM is a leading benchmark for the environmentalperformance of buildings.
EcoHomes is a reasonably straightforward, flexible and independently verified environmentalassessment method. Environmental performance is expressed on a scale of Pass, Good, VeryGood and Excellent.
It is an easily understood, credible label for new and renovated homes including houses andapartments. It rewards developers who improve environmental performance through gooddesign, rather than high capital cost solutions.
As part of its One Million Sustainable Homes Campaign, WWF is calling on the UK governmentto follow through on policy directions set out in its recent Sustainable Communities Plan and theEnergy White Paper, to ensure that its sustainable development aspirations become a reality.Under WWF’s proposals, minimum construction standards would be set to ensure that all newand refurbished homes in the Thames Gateway and the other three priority growth areas meet aminimum of EcoHomes ‘Very Good’ or ‘Excellent’ standard. WWF believes that new
One Planet Living in the Thames GatewayA WWF-UK One Million Sustainable Homes Campaign ReportBioRegional Development Group
Page 17 of 66
communities should be developed to Z2 standards to enable residents to live sustainably andachieve ‘one planet living’.
EcoHomes rewards dwellings which are built with insulation levels in excess of minimumBuilding Regulation requirements and which, through energy efficient design and specification,have reduced CO2 emissions associated with meeting energy demands. Credit is also given forlocating homes with good access to public transport and amenities, and which are constructedof materials with low environmental impact. Reducing water demand and providing recyclingstorage facilities are also rewarded. Issues relating to the conservation and enhancement of theexternal natural environment and the quality of the internal environment for occupants are alsoassessed under the scheme.
Scenario 2 is based on a resident living in an EcoHomes ‘Very Good’ home and hence makessome environmental savings, but who otherwise essentially lives a typical UK lifestyle withassociated demands, resource use and pollution. Scenario 3 is based on the impact of aresident living in a similar EcoHomes ‘Very Good’ home in the same community, but who hasmade some lifestyle choices to reduce their environmental impact.
Scenario 4: Z2 for One Planet Living
The BioRegional vision for building a new community in Thames Gateway hopes todemonstrate how we can build and live sustainably in the future within the capacity of oneplanet. The vision comprises a series of well-connected smaller Z2 (zero fossil energy and zerowaste) sustainable communities, each a distinct element within the unified whole. A keyprinciple of designing sustainable communities is to build at high densities around transportinterchanges as advocated by Richard Rogers in Cities for a Small Planet. These communitiesneed to integrate a variety of residential, commercial and leisure uses so that most facilities arewithin walking distance with efficient public transport making it easier to live without a car. Inthese compact communities, heat and power are generated locally, waste is minimised andsustainably managed, and a hinterland provides space for recreation, growing food and wildlifehabitats. BioRegional believe this model of a sustainable compact community should be usedto inform future development in Thames Gateway London.
The model for such communities would build on the achievements at the ground-breakingBeddington Zero (fossil) Energy Development, but would additionally be designed and built totackle sustainable living issues at the community and urban town level.
Beddington Zero (fossil) Energy Development
BioRegional initiated the construction of an urban eco-village in South London, Beddington Zero(fossil) Energy Development – BedZED, designed by architect Bill Dunster and developed bythe Peabody Trust in partnership with BioRegional. The aim has been to show how green livingis a real, attractive and affordable option. This is created by integrating energy efficiency,renewable energy and water harvesting with services like car pools and local organic fooddeliveries.
BedZED comprises 82 homes, office space and live-work units and is the UK’s largest eco-village. It has a mix of social housing for people on low incomes and private homes for sale atprices comparable to more conventional homes in the area. It is designed for a comfortable andhighly resource-efficient way of life.
One Planet Living in the Thames GatewayA WWF-UK One Million Sustainable Homes Campaign ReportBioRegional Development Group
Page 18 of 66
BedZED was designed to push the boundaries of ‘best practice’ in environmental performance,and is widely acknowledged as a pioneering developing which sets new standards insustainability. BedZED was not designed to meet the requirements of any particular eco-label orenvironmental scheme, but to achieve net carbon neutrality, and to create the opportunity forresidents to ‘buy into’ a whole sustainable lifestyle. The development has been assessed underBRE EcoHomes and achieved the ‘Excellent’ rating.
Analysis and monitoring of BedZED in use has indicated that environmental savings can bemade by residents living there and that keen environmentally-minded occupants can reducetheir ecological footprints and get closer to living sustainably within the means of one planet.Subsequent EF assessment has shown that a significant part of a person’s environmentalimpact is related to their portion of shared infrastructure and services. It is anticipated that bybuilding developments of sustainable communities which are 2500+ homes (Scenario 4) ratherthan the 100 units of BedZED, the impact of these ‘shared’ elements can be tackled morecomprehensively. Developing at a larger scale holistic masterplan enables reductions in theamount of transport infrastructure required, the development of community-wide zero wastestrategies and designs to enable local food production.
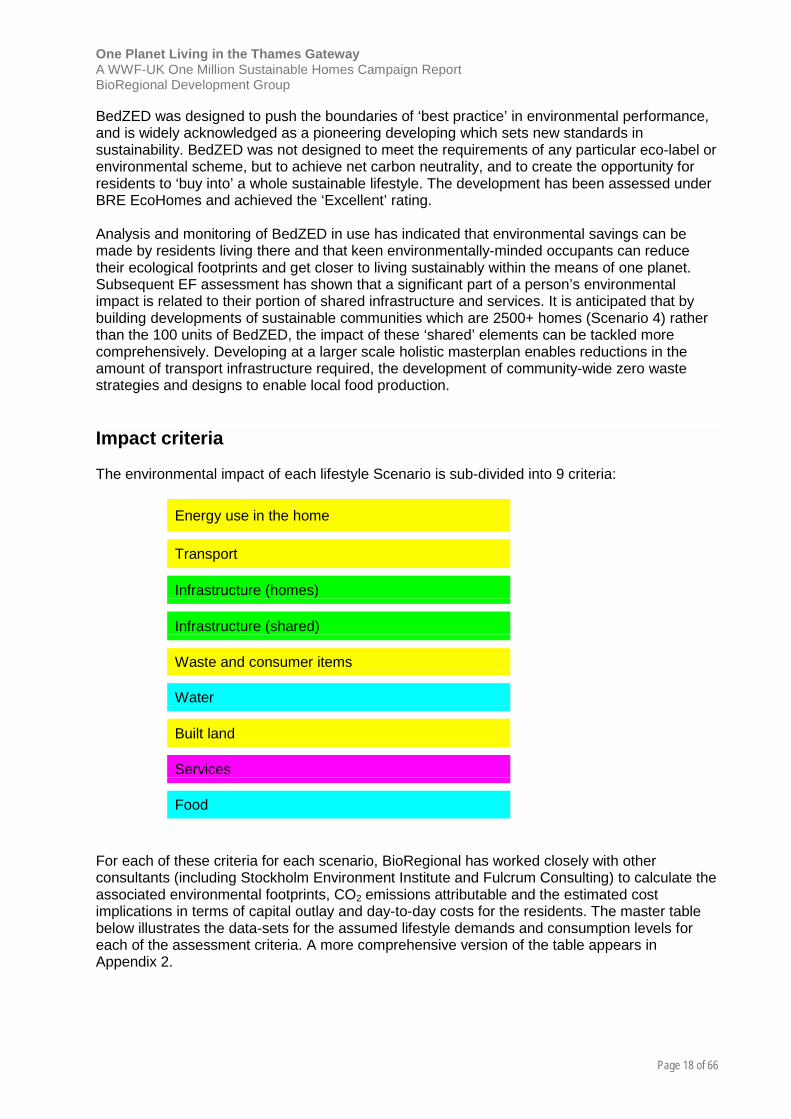
Impact criteria
The environmental impact of each lifestyle Scenario is sub-divided into 9 criteria:
Energy use in the home
Transport
Infrastructure (homes)
Infrastructure (shared)
Waste and consumer items
Water
Built land
Services
Food
For each of these criteria for each scenario, BioRegional has worked closely with otherconsultants (including Stockholm Environment Institute and Fulcrum Consulting) to calculate theassociated environmental footprints, CO2 emissions attributable and the estimated costimplications in terms of capital outlay and day-to-day costs for the residents. The master tablebelow illustrates the data-sets for the assumed lifestyle demands and consumption levels foreach of the assessment criteria. A more comprehensive version of the table appears inAppendix 2.

One Planet Living in the Thames GatewayA WWF-UK One Million Sustainable Homes Campaign ReportBioRegional Development Group
Page 19 of 66
ISSU
E Scenario 1Typical UK resident intypical new UK home to2002 BuildingRegulations
Scenario 2Typical UK resident intypical new UK hometo EcoHomes ‘VeryGood’
Scenario 3Environmentally-concerned resident Intypical new UK home toEcoHomes ‘Very Good’
Scenario 4Z2: Zero fossil energy, zero wastecommunity
Ener
gy u
sein
the
hom
e
! Typical UK energydemand for new homes
! 2002 BuildingRegulation insulationlevels
! ‘A-C’-rated white goods! Non-condensing boiler
! Lower energydemand
! Better insulationlevels
! ‘A’-rated whitegoods
! Condensing boiler
! As Scenario 2 ! Zero (fossil) Energy! Very low UK energy demand! Super-insulated! ‘A’-rated white goods! On-site waste CHP/pyrolysis plant
Tran
spor
t
! Average UK travelpattern
! No home office
! Lower private caruse
! Home office! 5% overall journey
reduction! 10% reduction in
private car use
! Resident is a memberof a car club
! Sometimes worksfrom home
! 20% overall journeyreduction
! 40% reduction in caruse
! Sustainable Travel packages! 40% overall journey reduction! Majority of journeys by foot/cycle! 85% reduction in car miles, no
private fossil fuel miles, all via carclub
! Home office & local employment
Hou
seM
ater
ials
! Typical UK new homeconstruction
! Typical UK homeconstruction, withmore insulation andmaterials with lowerenvironmentalimpacts
! As Scenario 2 ! ZED-type homes! Similar embodied energy to typical
UK new home construction, but withmuch more insulation and more inertmaterials. Reclaimed, recycled andlocally sourced materials extensivelyused
Shar
edIn
fras
truc
ture
! Current levels ofinfrastructure sharedequally
! Reduced transportand energyinfrastructure
! Less waste landfill,but some morewaste processinginfrastructure
! Reduced waterprocessinginfrastructure
! Reduced transportand energy
infrastructure! Less waste landfill,
but some more wasteprocessinginfrastructure
! Reduced waterprocessinginfrastructure
! Further reduced transport andenergy infrastructure
! Even less waste landfill, with morewaste processing infrastructure
! Further reduced water infrastructure! Reduced material extraction &
transport infrastructure, increasedmaterial recycling and reclaimingfacilities
! Fewer airports and infrastructure dueto air-freighted imported goods
Was
te &
con
sum
erite
ms
! Average UKconsumption
! Average UK domesticwaste production of520 kg/person/year
! Typical recycling rate of12%, 79% landfill and9% incineration
! Average UKconsumption
! Average UK wasteproduction of 520kg/person/year
! 25% higherrecycling levels of15.5%
! Consumption reducedby 15% throughlifestyle choices
! Waste levels reducedby 15%
! 25% of domesticwaste recycled orcomposted
! 70% landfill and 5%incinerated
! Reclaimed & recycled goodspromoted
! 25% reduced consumption! 25% lower packaging levels! 25% overall less waste than UK av.! 25% of which is recycled! 25% of which is composted! 25% of which is converted to energy
via gasification CHP! 25% of which is sent to landfill
Wat
er
! Average UK waterconsumption
! 134 litres/person/daymetered water
! Low waterconsumption
! 82 litres/person/day
! As Scenario 2 ! Very low water consumption 47litres/person/day
! On-site grey water processing! Rainwater harvesting meets external
water demand
Bui
ltla
nd
! 40 homes/hectare incore
! 2 storey developmentaverage
! 40 homes/hectare incore
! 2.5 storeydevelopmentaverage
! As Scenario 2 ! 80 homes/hectare in core! 3 storey development average
Serv
ices
! Average use of:! Retail, recreation,
healthcare, hotel &catering,communications,banking and finance
! As Scenario 1 ! Fewer commercialservices used due toreduced consumption
! Fewer commercial services used! Less healthcare needed! Less consumption! Less travel
Food
! Average UKconsumption
! As Scenario 1 ! Increasedconsumption of localand organic food
! Low meat and dairy lifestyle! Increased fruit and vegetable intake! Promotion of local and organic food! Less packaging
One Planet Living in the Thames GatewayA WWF-UK One Million Sustainable Homes Campaign ReportBioRegional Development Group
Page 20 of 66
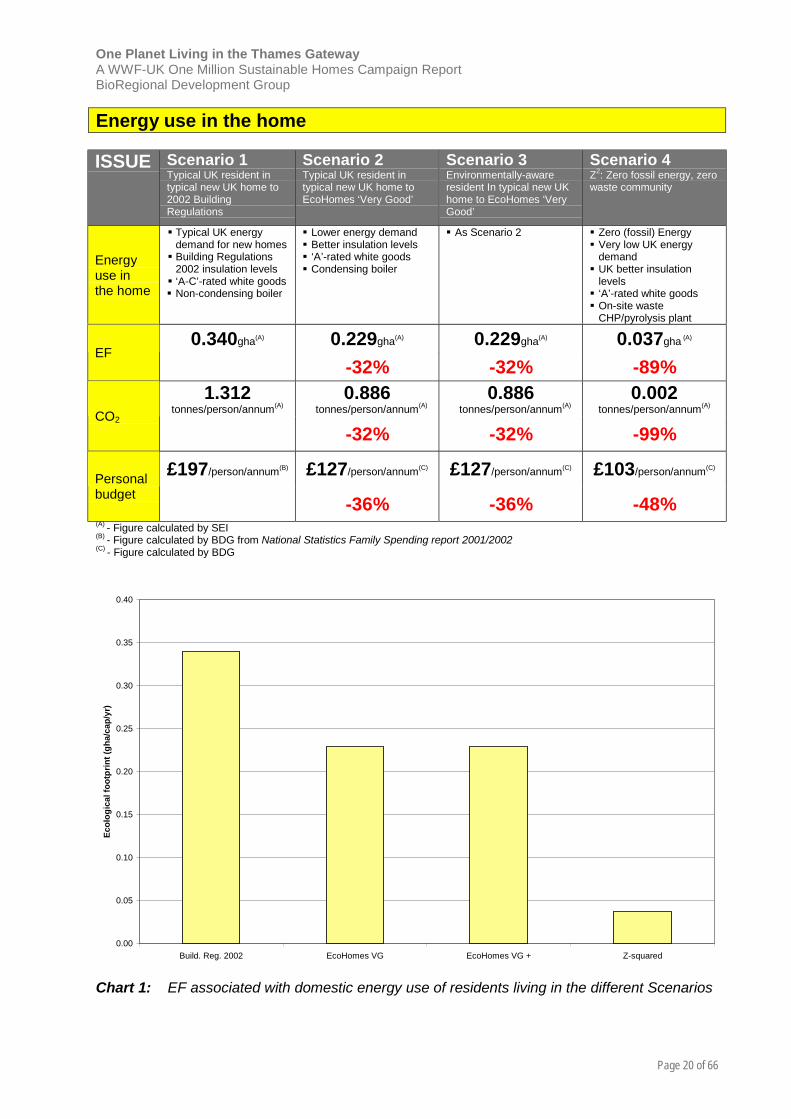
Energy use in the home
ISSUE Scenario 1Typical UK resident intypical new UK home to2002 BuildingRegulations
Scenario 2Typical UK resident intypical new UK home toEcoHomes ‘Very Good’
Scenario 3Environmentally-awareresident In typical new UKhome to EcoHomes ‘VeryGood’
Scenario 4Z2: Zero fossil energy, zerowaste community
Energyuse inthe home
! Typical UK energydemand for new homes
! Building Regulations2002 insulation levels
! ‘A-C’-rated white goods! Non-condensing boiler
! Lower energy demand! Better insulation levels! ‘A’-rated white goods! Condensing boiler
! As Scenario 2 ! Zero (fossil) Energy! Very low UK energy
demand! UK better insulation
levels! ‘A’-rated white goods! On-site waste
CHP/pyrolysis plant
0.340gha(A) 0.229gha(A) 0.229gha(A) 0.037gha (A)
EF-32% -32% -89%
1.312tonnes/person/annum(A)
0.886tonnes/person/annum(A)
0.886tonnes/person/annum(A)
0.002tonnes/person/annum(A)
CO2
-32% -32% -99%
£197/person/annum(B) £127/person/annum(C) £127/person/annum(C) £103/person/annum(C)
Personalbudget -36% -36% -48%(A) - Figure calculated by SEI(B) - Figure calculated by BDG from National Statistics Family Spending report 2001/2002(C) - Figure calculated by BDG
Chart 1: EF associated with domestic energy use of residents living in the different Scenarios
0.00
0.05
0.10
0.15
0.20
0.25
0.30
0.35
0.40
Build. Reg. 2002 EcoHomes VG EcoHomes VG + Z-squared
Ecol
ogic
al fo
otpr
int (
gha/
cap/
yr)
One Planet Living in the Thames GatewayA WWF-UK One Million Sustainable Homes Campaign ReportBioRegional Development Group
Page 21 of 66
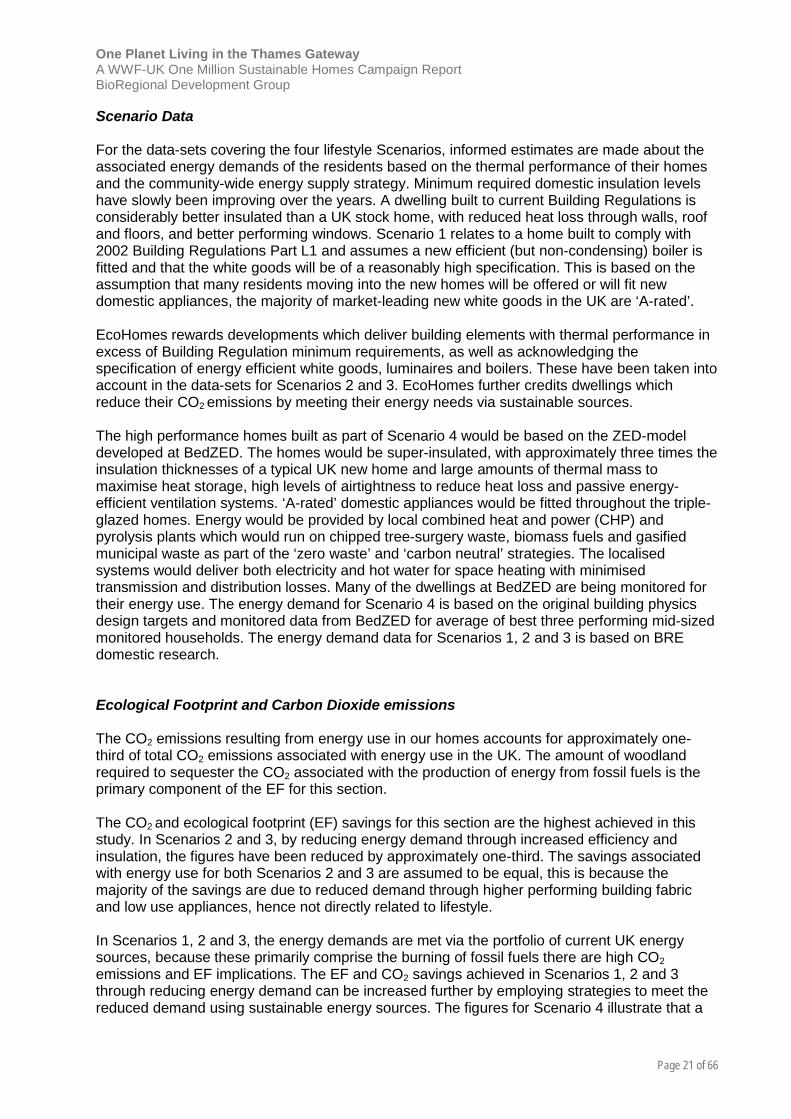
Scenario Data
For the data-sets covering the four lifestyle Scenarios, informed estimates are made about theassociated energy demands of the residents based on the thermal performance of their homesand the community-wide energy supply strategy. Minimum required domestic insulation levelshave slowly been improving over the years. A dwelling built to current Building Regulations isconsiderably better insulated than a UK stock home, with reduced heat loss through walls, roofand floors, and better performing windows. Scenario 1 relates to a home built to comply with2002 Building Regulations Part L1 and assumes a new efficient (but non-condensing) boiler isfitted and that the white goods will be of a reasonably high specification. This is based on theassumption that many residents moving into the new homes will be offered or will fit newdomestic appliances, the majority of market-leading new white goods in the UK are ‘A-rated’.
EcoHomes rewards developments which deliver building elements with thermal performance inexcess of Building Regulation minimum requirements, as well as acknowledging thespecification of energy efficient white goods, luminaires and boilers. These have been taken intoaccount in the data-sets for Scenarios 2 and 3. EcoHomes further credits dwellings whichreduce their CO2 emissions by meeting their energy needs via sustainable sources.
The high performance homes built as part of Scenario 4 would be based on the ZED-modeldeveloped at BedZED. The homes would be super-insulated, with approximately three times theinsulation thicknesses of a typical UK new home and large amounts of thermal mass tomaximise heat storage, high levels of airtightness to reduce heat loss and passive energy-efficient ventilation systems. ‘A-rated’ domestic appliances would be fitted throughout the triple-glazed homes. Energy would be provided by local combined heat and power (CHP) andpyrolysis plants which would run on chipped tree-surgery waste, biomass fuels and gasifiedmunicipal waste as part of the ‘zero waste’ and ‘carbon neutral’ strategies. The localisedsystems would deliver both electricity and hot water for space heating with minimisedtransmission and distribution losses. Many of the dwellings at BedZED are being monitored fortheir energy use. The energy demand for Scenario 4 is based on the original building physicsdesign targets and monitored data from BedZED for average of best three performing mid-sizedmonitored households. The energy demand data for Scenarios 1, 2 and 3 is based on BREdomestic research.
Ecological Footprint and Carbon Dioxide emissions
The CO2 emissions resulting from energy use in our homes accounts for approximately one-third of total CO2 emissions associated with energy use in the UK. The amount of woodlandrequired to sequester the CO2 associated with the production of energy from fossil fuels is theprimary component of the EF for this section.
The CO2 and ecological footprint (EF) savings for this section are the highest achieved in thisstudy. In Scenarios 2 and 3, by reducing energy demand through increased efficiency andinsulation, the figures have been reduced by approximately one-third. The savings associatedwith energy use for both Scenarios 2 and 3 are assumed to be equal, this is because themajority of the savings are due to reduced demand through higher performing building fabricand low use appliances, hence not directly related to lifestyle.
In Scenarios 1, 2 and 3, the energy demands are met via the portfolio of current UK energysources, because these primarily comprise the burning of fossil fuels there are high CO2emissions and EF implications. The EF and CO2 savings achieved in Scenarios 1, 2 and 3through reducing energy demand can be increased further by employing strategies to meet thereduced demand using sustainable energy sources. The figures for Scenario 4 illustrate that a
One Planet Living in the Thames GatewayA WWF-UK One Million Sustainable Homes Campaign ReportBioRegional Development Group
Page 22 of 66
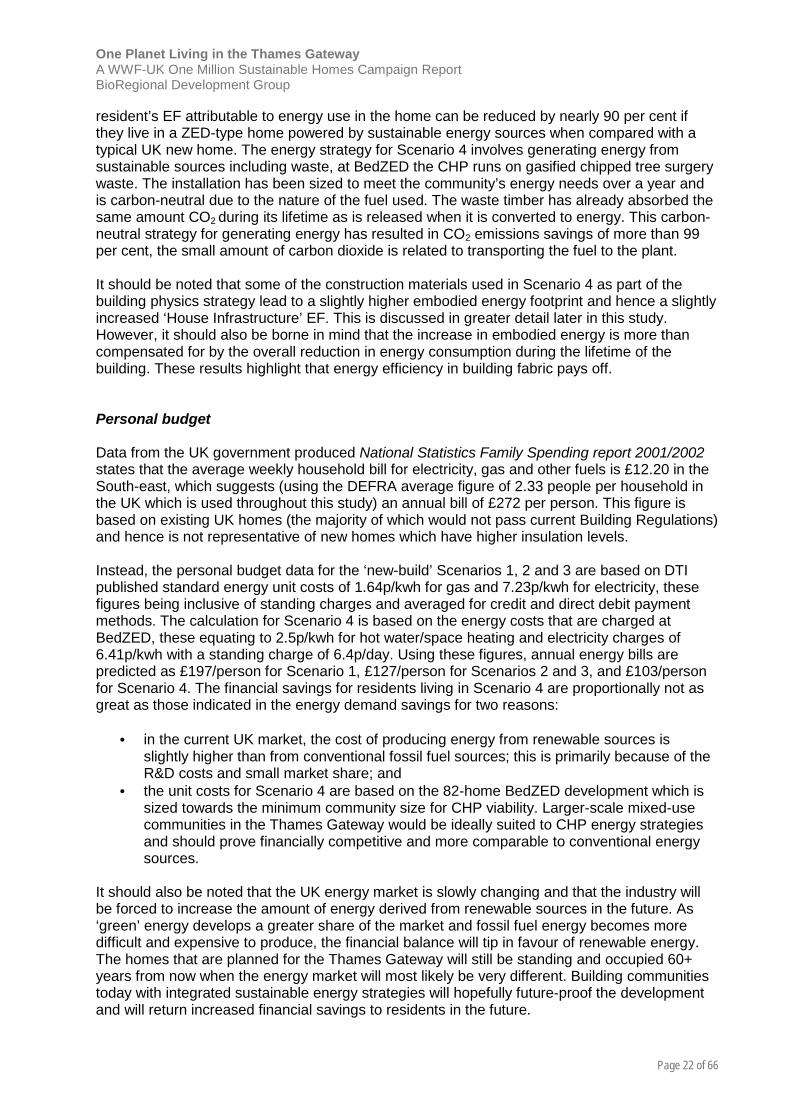
resident’s EF attributable to energy use in the home can be reduced by nearly 90 per cent ifthey live in a ZED-type home powered by sustainable energy sources when compared with atypical UK new home. The energy strategy for Scenario 4 involves generating energy fromsustainable sources including waste, at BedZED the CHP runs on gasified chipped tree surgerywaste. The installation has been sized to meet the community’s energy needs over a year andis carbon-neutral due to the nature of the fuel used. The waste timber has already absorbed thesame amount CO2 during its lifetime as is released when it is converted to energy. This carbon-neutral strategy for generating energy has resulted in CO2 emissions savings of more than 99per cent, the small amount of carbon dioxide is related to transporting the fuel to the plant.
It should be noted that some of the construction materials used in Scenario 4 as part of thebuilding physics strategy lead to a slightly higher embodied energy footprint and hence a slightlyincreased ‘House Infrastructure’ EF. This is discussed in greater detail later in this study.However, it should also be borne in mind that the increase in embodied energy is more thancompensated for by the overall reduction in energy consumption during the lifetime of thebuilding. These results highlight that energy efficiency in building fabric pays off.
Personal budget
Data from the UK government produced National Statistics Family Spending report 2001/2002states that the average weekly household bill for electricity, gas and other fuels is £12.20 in theSouth-east, which suggests (using the DEFRA average figure of 2.33 people per household inthe UK which is used throughout this study) an annual bill of £272 per person. This figure isbased on existing UK homes (the majority of which would not pass current Building Regulations)and hence is not representative of new homes which have higher insulation levels.
Instead, the personal budget data for the ‘new-build’ Scenarios 1, 2 and 3 are based on DTIpublished standard energy unit costs of 1.64p/kwh for gas and 7.23p/kwh for electricity, thesefigures being inclusive of standing charges and averaged for credit and direct debit paymentmethods. The calculation for Scenario 4 is based on the energy costs that are charged atBedZED, these equating to 2.5p/kwh for hot water/space heating and electricity charges of6.41p/kwh with a standing charge of 6.4p/day. Using these figures, annual energy bills arepredicted as £197/person for Scenario 1, £127/person for Scenarios 2 and 3, and £103/personfor Scenario 4. The financial savings for residents living in Scenario 4 are proportionally not asgreat as those indicated in the energy demand savings for two reasons:
• in the current UK market, the cost of producing energy from renewable sources isslightly higher than from conventional fossil fuel sources; this is primarily because of theR&D costs and small market share; and
• the unit costs for Scenario 4 are based on the 82-home BedZED development which issized towards the minimum community size for CHP viability. Larger-scale mixed-usecommunities in the Thames Gateway would be ideally suited to CHP energy strategiesand should prove financially competitive and more comparable to conventional energysources.
It should also be noted that the UK energy market is slowly changing and that the industry willbe forced to increase the amount of energy derived from renewable sources in the future. As‘green’ energy develops a greater share of the market and fossil fuel energy becomes moredifficult and expensive to produce, the financial balance will tip in favour of renewable energy.The homes that are planned for the Thames Gateway will still be standing and occupied 60+years from now when the energy market will most likely be very different. Building communitiestoday with integrated sustainable energy strategies will hopefully future-proof the developmentand will return increased financial savings to residents in the future.
One Planet Living in the Thames GatewayA WWF-UK One Million Sustainable Homes Campaign ReportBioRegional Development Group
Page 23 of 66
Transport
ISSUE Scenario 1Typical UK resident intypical new UK home to2002 BuildingRegulations
Scenario 2Typical UK resident intypical new UK home toEcoHomes ‘Very Good’
Scenario 3Environmentally-awareresident In typical newUK home to EcoHomes‘Very Good’
Scenario 4Z2: Zero fossil energy, zerowaste community
Transport
! Average UK travelpattern
! No home office
! Lower private car use! Home office! 5% overall journey
reduction! 10% reduction in
private car use
! Resident is a memberof a car club
! Sometimes works fromhome
! 20% overall journeyreduction
! 40% lower car use
! Sustainable Travel packages! 40% overall journey reduction! Majority of journeys by
foot/cycle! 85% reduction in car miles, no
private fossil fuel miles, all viacar club
! Home office & localemployment
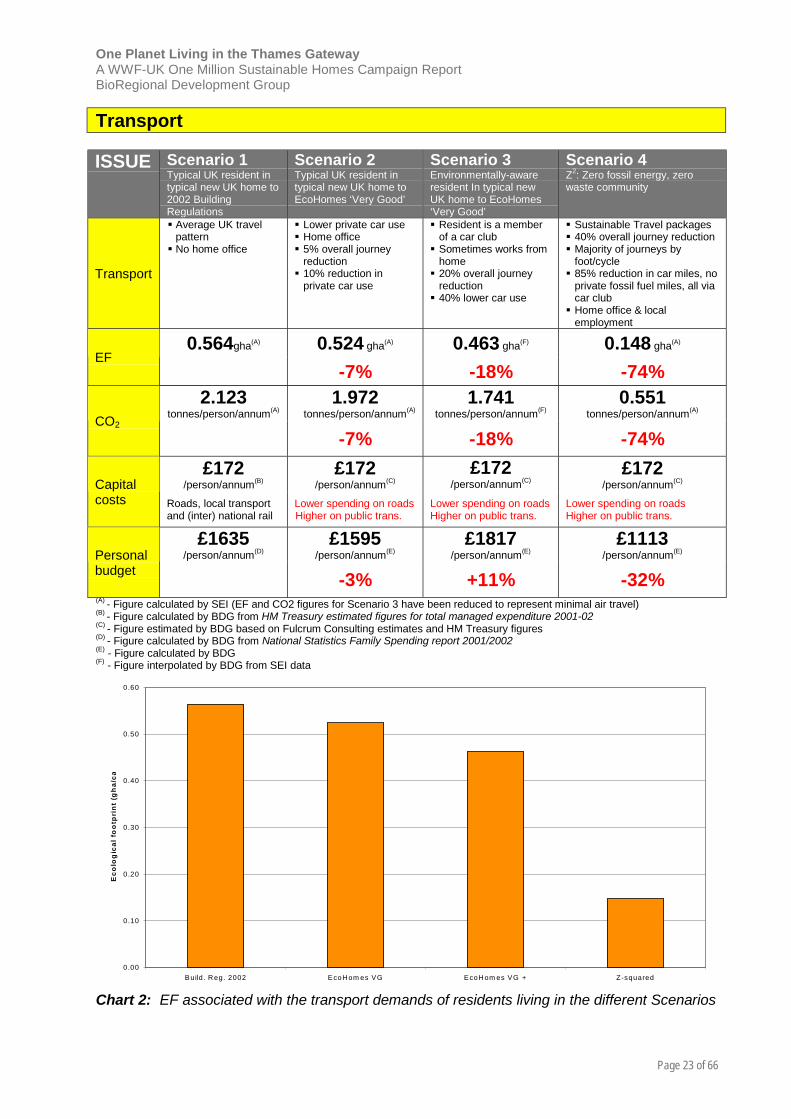
0.564gha(A) 0.524 gha(A) 0.463 gha(F) 0.148 gha(A)
EF-7% -18% -74%
2.123tonnes/person/annum(A)
1.972tonnes/person/annum(A)
1.741tonnes/person/annum(F)
0.551tonnes/person/annum(A)
CO2
-7% -18% -74%£172
/person/annum(B)£172
/person/annum(C)£172
/person/annum(C)£172
/person/annum(C)Capitalcosts Roads, local transport
and (inter) national railLower spending on roadsHigher on public trans.
Lower spending on roadsHigher on public trans.
Lower spending on roadsHigher on public trans.
£1635/person/annum(D)
£1595/person/annum(E)
£1817/person/annum(E)
£1113/person/annum(E)Personal
budget -3% +11% -32%(A) - Figure calculated by SEI (EF and CO2 figures for Scenario 3 have been reduced to represent minimal air travel)(B) - Figure calculated by BDG from HM Treasury estimated figures for total managed expenditure 2001-02(C) - Figure estimated by BDG based on Fulcrum Consulting estimates and HM Treasury figures(D) - Figure calculated by BDG from National Statistics Family Spending report 2001/2002(E) - Figure calculated by BDG(F) - Figure interpolated by BDG from SEI data
Chart 2: EF associated with the transport demands of residents living in the different Scenarios
0.00
0.10
0.20
0.30
0.40
0.50
0.60
Build. R eg. 2002 EcoH om es VG EcoH om es VG + Z-squared
Eco
log
ical
fo
otp
rin
t (g
ha/
ca

One Planet Living in the Thames GatewayA WWF-UK One Million Sustainable Homes Campaign ReportBioRegional Development Group
Page 24 of 66
Scenario Data
The energy use and emissions levels associated with transport greatly depend on the relativelocation of home, place of work, shops and other amenities, as well as the availability of carparking and types of vehicles used. By reducing the length of common journeys and byencouraging the use of public transport over the private car, CO2 emissions and energy use canbe substantially reduced.
In areas of high transport, congestion, noise and airborne pollution can become problems andadversely affect the wellbeing and quality of life for local residents. The disturbance caused bytransport and the potential for accidents can also be reduced. In addition, these healthimplications have associated financial and environmental impacts resulting from the increasedlevels of healthcare needed. BioRegional has worked with a health consultant, Dr Robin Stott,regarding this matter and other health benefits of living in sustainable communities. Hiscomments are to be found in Appendix 1.
The data-set for Scenario 1 is taken from UK average travel data in the 2001 Travel Surveycompiled by the Department for Transport (DfT). It represents the typical travel pattern includingtotal distances travelled by different modes of transport.
EcoHomes rewards building developments with safe and convenient access to local amenitiesand public transport, and it is assumed that compact city form masterplanning principles wouldprovide such access under Scenarios 2 and 3. The provision of home office space isacknowledged as a means of reducing commuting requirements and associated environmentalimpact. Secure storage for bicycles is also rewarded. For Scenario 2, BioRegional hasestimated that the provision of some of these facilities could result in a reduction in the totalamount of journeys made (5 per cent less) and the percentage of those undertaken in a privatecar (10 per cent less). Scenario 3 is based on residents working from home where possible andbeing a member of a car club to negate the need for a second household vehicle. A Scenario 3resident would also walk or cycle for most day-to-day short journeys.
The transport strategy for Z2 communities under Scenario 4 would be based around a greentravel plan which would be formulated at an early stage to form an integral part of the designmethodology. The communities would be developed using compact city principles comprisingdense mixed-use urban areas offering homes, workspace and shared facilities within easyaccess of each other. This masterplanning strategy would be expected to deliver a 40 per centoverall journey reduction and facilitate walking and cycling as the main means of day-to-daytransport.
The strategy for meeting travel demands in Scenario 4 is based around the provision of ‘mobilitypackages’. Cars provide so-called ‘mobility insurance’, but once people have purchased a carthey tend to use it for all journeys. Cars enable freedom and flexibility in travel and althoughmany journeys are unnecessary, there are some for which a car is the only practical option.
Z2 residents will be able to join car clubs. The service allows them to hire a car by the hour whenthey need one, thereby providing mobility insurance without the need to own a car. Car clubsprovide a variety of vehicle sizes to suit differing requirements and can empower the majority ofpeople who do not have access to a private car. For financial reasons, car clubs work mostsuccessfully in mixed-use developments which offer primarily business use during the day andprivate use in the evenings and at weekends to keep utilisation rates high.
A car club is successfully in operation at BedZED (in partnership with Smart Moves) and there isan increasing number of similar clubs being set up across the capital by London City Car Clubs.BioRegional believes that the strategy is equally applicable for larger scale communities where
One Planet Living in the Thames GatewayA WWF-UK One Million Sustainable Homes Campaign ReportBioRegional Development Group
Page 25 of 66
clubs would be located in individual neighbourhoods as part of a region-wide network. AtBedZED, local train operators have agreed to offer discounted season tickets and travelincentives to car club members. When this is coordinated with safe cycle routes and storagefacilities, ‘mobility packages’ can be developed enabling residents to make a variety of journeysby sustainable means, combining different modes of transport when necessary.
Ecological Footprint and Carbon Dioxide emissions
In the UK, transporting people between buildings accounted for 22 per cent of national energyuse in1996. Overall car traffic has increased almost 15 times in the last 50 years and CO2emissions due to transport are growing at roughly 4 per cent each year. These increases areprimarily due to the rise in personal transport, but also freight transport (about half of whichtransports construction materials) which is responsible for 10 per cent of UK energy use.
To calculate the environmental impact of travel, data concerning the emissions of greenhousegases, the energy requirements of manufacturing and maintenance, the fuel consumption andthe land area occupied by roads are collected.
The ecological footprint (EF) and CO2 figures for this section illustrate that a saving ofapproximately three-quarters can be made through addressing sustainable transport whencomparing Scenario 4 with Scenario 1. This is based on a Scenario 4 resident making the mostof the ‘mobility packages’ made available and choosing to fly less than average. Air travel has avery high environmental impact and if average flight pattern data is included for Scenario 4, theEF and CO2 savings drop to nearer 60 per cent.
The figures for Scenario 2 and 3 (7 per cent and 18 per cent savings for EF/CO2 compared witha typical UK resident) demonstrate that using public transport instead of a car can result insome environmental savings. The environmental impact per kilometre travelled for a car isapproximately 2.5 times higher than for the train and 1.5 times higher than for bus travel.
The car club at BedZED includes a duel-fuelled car, using alternative fuels such as LPG canhelp to reduce the environmental impact of driving. The car clubs in Z2 communities in Scenario4 would form an integral part of the ‘mobility packages’ and could offer access to conventionallyfuelled and hybrid club cars. These fleets could be augmented by electric vehicles in the futureas the associated technology moves into the mainstream. Powering vehicles with electricitywhich has been derived from renewable sources reduces the environmental impact further still.
Personal budget
Data from the government-produced National Statistics Family Spending report 2001/2002states that the average weekly household bill for transport (including the purchase of vehicles,associated running costs, insurance and public spending on transport) is approximately £81 inthe South-east, which suggests (using the DEFRA average figure of 2.33 people per householdin the UK) an annual bill of £1,635 per person.
The costs associated with the travel patterns identified in Scenario 2 are estimated as £1,595per person per annum. This has been calculated using percentage reductions of the NationalStatistics spending data based on the reduced travel needs and lower private car use identifiedin Scenario 2. The financial savings (3 per cent) are smaller than the EF savings (7 per cent)because proportionately, mile for mile, the prices paid for using public transport compared withprivate vehicles do not reflect the environmental benefits. For Scenario 3 the personal budget isslightly increased to an estimated £1,817 because of the greater public transport spending and
One Planet Living in the Thames GatewayA WWF-UK One Million Sustainable Homes Campaign ReportBioRegional Development Group
Page 26 of 66
the assumption that although one person in each household is a car club member, private carownership may only be reduced to one car per household.
Despite some increases in public transport expenditure, a resident living in Scenario 4 wouldappear to spend less on transport (£1113/person/annum). These costs have been calculatedusing rates based on National Statistics data and costs based on existing car clubs at BedZEDand across London and the South-east. Joining a car club can clearly save residents money asmembers do not have the cost of purchasing and keeping a car on the road. Furthermore, atBedZED (and the Z2 communities) none of the units have allocated parking and althoughresidents can choose to buy a parking permit, this is priced at around twice the cost of joiningthe car club. It should be emphasised that the success of car clubs is very much dependent onhaving strict on-site parking restrictions for private vehicles.
Government capital spending
The expenditure figures detailed above only consider the financial outlay by residents as part oftheir household budget and do not consider the amount of money raised via taxes and spent bythe government on our behalf on shared transport infrastructure and subsidies. Treasury figuresindicate that total managed expenditure on transport by the government in 2001-02 wasestimated at more than £10 billion, which equates to approximately £172 per person per yearbased on a UK population of 58.79 million. Further analysis of the Treasury figures suggestsannual spending on roads of £99/person/year, local transport of £32/person/year andnational/international rail of £28/person/year.
In the table above, the costs for Scenarios 2, 3 and 4 have been maintained at the same level of£172 per person per annum. The aim of this study is not necessarily to demonstrate how thegovernment could make savings in its expenditure on developing Thames Gateway (althoughthis may prove to be the case), but to illustrate how environmental benefits and governmentsustainable development and energy targets can be met using the same budget.
There will be additional costs to both the taxpayer and the private sector to pay for the amountof new major transport infrastructure that will be required to enable the development of theThames Gateway. Estimates of the amount of money required are discussed in the ‘Sharedinfrastructure’ section.
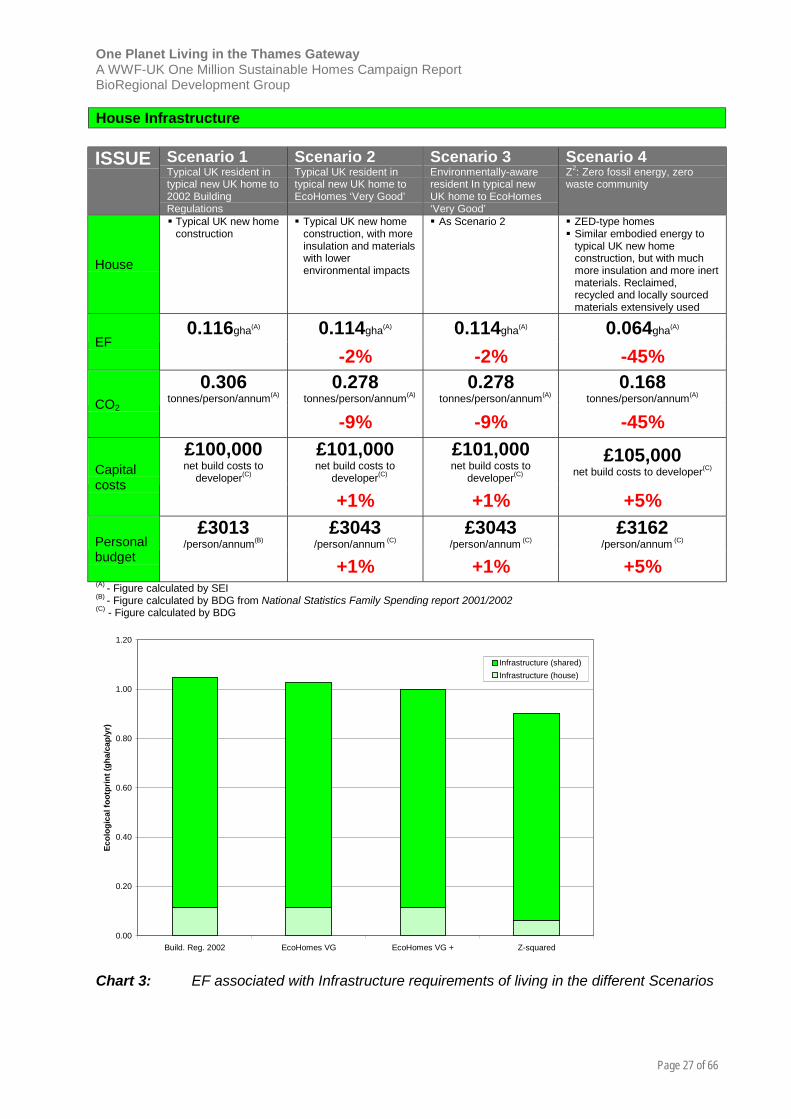
One Planet Living in the Thames GatewayA WWF-UK One Million Sustainable Homes Campaign ReportBioRegional Development Group
Page 27 of 66
House Infrastructure
ISSUE Scenario 1Typical UK resident intypical new UK home to2002 BuildingRegulations
Scenario 2Typical UK resident intypical new UK home toEcoHomes ‘Very Good’
Scenario 3Environmentally-awareresident In typical newUK home to EcoHomes‘Very Good’
Scenario 4Z2: Zero fossil energy, zerowaste community
House
! Typical UK new homeconstruction
! Typical UK new homeconstruction, with moreinsulation and materialswith lowerenvironmental impacts
! As Scenario 2 ! ZED-type homes! Similar embodied energy to
typical UK new homeconstruction, but with muchmore insulation and more inertmaterials. Reclaimed,recycled and locally sourcedmaterials extensively used
0.116gha(A) 0.114gha(A) 0.114gha(A) 0.064gha(A)
EF-2% -2% -45%
0.306tonnes/person/annum(A)
0.278tonnes/person/annum(A)
0.278tonnes/person/annum(A)
0.168tonnes/person/annum(A)
CO2
-9% -9% -45%£100,000net build costs to
developer(C)
£101,000net build costs to
developer(C)
£101,000net build costs to
developer(C)
£105,000net build costs to developer(C)Capital
costs+1% +1% +5%
£3013/person/annum(B)
£3043/person/annum (C)
£3043/person/annum (C)
£3162/person/annum (C)Personal
budget +1% +1% +5%(A) - Figure calculated by SEI(B) - Figure calculated by BDG from National Statistics Family Spending report 2001/2002(C) - Figure calculated by BDG
Chart 3: EF associated with Infrastructure requirements of living in the different Scenarios
0.00
0.20
0.40
0.60
0.80
1.00
1.20
Build. Reg. 2002 EcoHomes VG EcoHomes VG + Z-squared
Ecol
ogic
al fo
otpr
int (
gha/
cap/
yr)
Infrastructure (shared)Infrastructure (house)
One Planet Living in the Thames GatewayA WWF-UK One Million Sustainable Homes Campaign ReportBioRegional Development Group
Page 28 of 66
Scenario Data
This section considers the materials that are used in the construction of dwellings, the costs ofbuilding them and the purchase costs to residents. There is a lack of published informationregarding the quantities and types of materials incorporated in the average home, althoughmore accurate data would assist the calculations, BioRegional anticipates that the percentagesavings indicated in this section are broadly representative. The materials that are used forlandscaping and external works are generally not included in this section, but are accounted forin the ‘Shared infrastructure’ section below. Data for Scenario 1 is based on BRE informationdetailing the amounts of construction materials used in a development of 100 typical UK homes.
EcoHomes rewards homes which have u-values10 in excess of Building Regulation minimumrequirements and consequently the homes proposed under Scenarios 2 and 3 contain moreinsulation and higher specification windows than a typical ‘new build’ home. The EcoHomesscheme also assesses the materials that are used in terms of environmental impact and creditsthe use of components with low impact. The majority of the higher scoring materialspecifications rewarded under the scheme could be broadly classified as ‘traditionalconstruction’ and hence not substantially different from typical UK new-build. Two exceptions tothis are the window frames which are considered to be timber in Scenarios 2 and 3 and uPVC inScenario 1, and the insulation material specifications which would have zero Ozone DepletingPotential (ODP) in Scenarios 2 and 3.
At BedZED, the materials specification strategy was designed to reduce environmental impact.A policy of sourcing materials locally was developed to reduce the transport impact of thematerials, 52 per cent were sourced within a 56km radius. Large quantities of reclaimed andrecycled materials were also specified at BedZED to reduce the amount of finite virgin materialsused and to further lessen the environmental impact through reduced haulage. A similarstrategy could be employed for the homes built under Scenario 4. Since undertaking BedZED,the market in reclaimed and recycled construction materials has grown and has been enhancedthrough better guidance and legislation, BioRegional believes that targets for the specification ofnon-virgin material in Scenario 4 could exceed those set at BedZED.
Ecological Footprint and Carbon Dioxide emissions
The ecological footprints and CO2 emissions for Scenarios 1, 2 and 3 are broadly similarbecause of the minor differences in the amount and type of materials used. The minor savingsindicated are primarily associated with the increased amount of insulation used offset by thespecification of zero ODP materials and timber windows.
ZED homes are specified and constructed with a design life of 120 years compared with thetypical value of 60 years in the UK. This strategy facilitates a reduction in the EF for Scenario 4,because the environmental impact of the materials incorporated in each home (althoughcomparable overall) is divided by twice the amount of time, the impact is halved. If the homesbuilt under Scenario 4 were constructed with 60 lifespans equal to those under Scenarios 1, 2and 3, then the associated EF would be slightly higher. ZED-type developments contain slightlymore construction materials than would be used in a more conventional home, in particularglazing, insulation and mass for thermal reasons. However, the environmental impact istempered by the local sourcing policy and high use of reclaimed and recycled building materialswhich have lower embodied energy values.
10 U values (overall coefficient of heat transmission) indicate the heat flow through materials. The values vary for each particularmaterial and method of construction; lower u-values indicate better insulating properties.
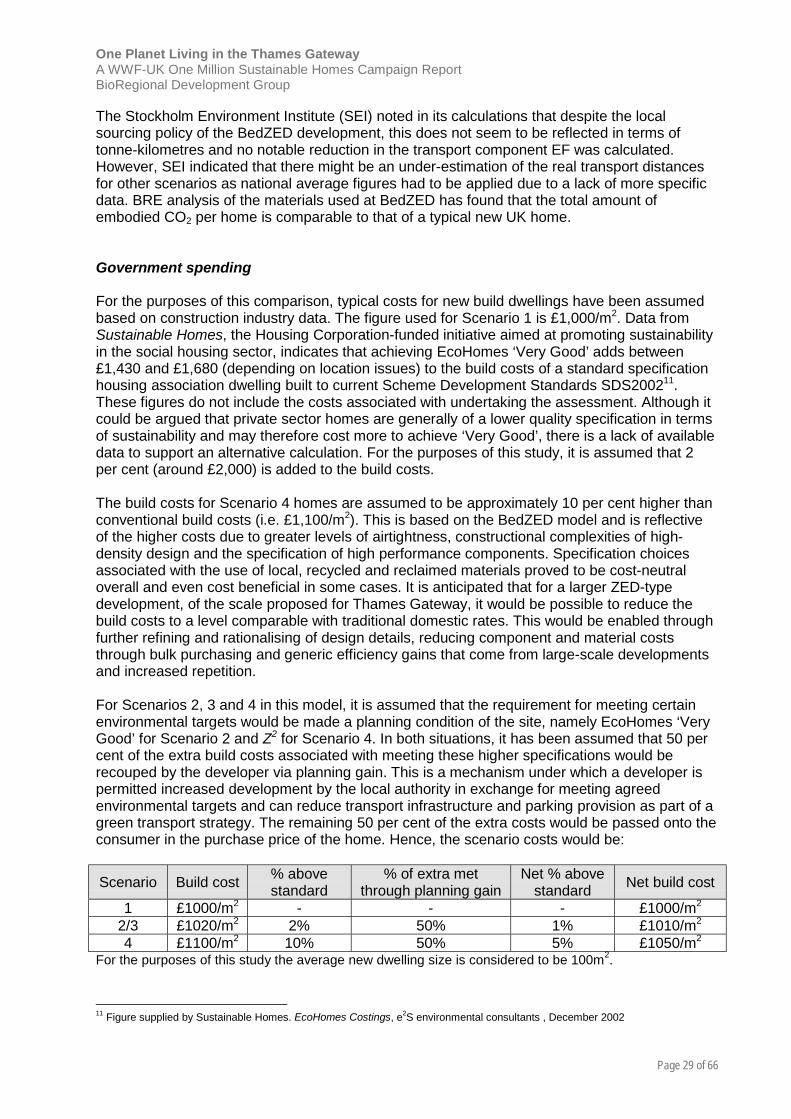
One Planet Living in the Thames GatewayA WWF-UK One Million Sustainable Homes Campaign ReportBioRegional Development Group
Page 29 of 66
The Stockholm Environment Institute (SEI) noted in its calculations that despite the localsourcing policy of the BedZED development, this does not seem to be reflected in terms oftonne-kilometres and no notable reduction in the transport component EF was calculated.However, SEI indicated that there might be an under-estimation of the real transport distancesfor other scenarios as national average figures had to be applied due to a lack of more specificdata. BRE analysis of the materials used at BedZED has found that the total amount ofembodied CO2 per home is comparable to that of a typical new UK home.
Government spending
For the purposes of this comparison, typical costs for new build dwellings have been assumedbased on construction industry data. The figure used for Scenario 1 is £1,000/m2. Data fromSustainable Homes, the Housing Corporation-funded initiative aimed at promoting sustainabilityin the social housing sector, indicates that achieving EcoHomes ‘Very Good’ adds between£1,430 and £1,680 (depending on location issues) to the build costs of a standard specificationhousing association dwelling built to current Scheme Development Standards SDS200211.These figures do not include the costs associated with undertaking the assessment. Although itcould be argued that private sector homes are generally of a lower quality specification in termsof sustainability and may therefore cost more to achieve ‘Very Good’, there is a lack of availabledata to support an alternative calculation. For the purposes of this study, it is assumed that 2per cent (around £2,000) is added to the build costs.
The build costs for Scenario 4 homes are assumed to be approximately 10 per cent higher thanconventional build costs (i.e. £1,100/m2). This is based on the BedZED model and is reflectiveof the higher costs due to greater levels of airtightness, constructional complexities of high-density design and the specification of high performance components. Specification choicesassociated with the use of local, recycled and reclaimed materials proved to be cost-neutraloverall and even cost beneficial in some cases. It is anticipated that for a larger ZED-typedevelopment, of the scale proposed for Thames Gateway, it would be possible to reduce thebuild costs to a level comparable with traditional domestic rates. This would be enabled throughfurther refining and rationalising of design details, reducing component and material coststhrough bulk purchasing and generic efficiency gains that come from large-scale developmentsand increased repetition.
For Scenarios 2, 3 and 4 in this model, it is assumed that the requirement for meeting certainenvironmental targets would be made a planning condition of the site, namely EcoHomes ‘VeryGood’ for Scenario 2 and Z2 for Scenario 4. In both situations, it has been assumed that 50 percent of the extra build costs associated with meeting these higher specifications would berecouped by the developer via planning gain. This is a mechanism under which a developer ispermitted increased development by the local authority in exchange for meeting agreedenvironmental targets and can reduce transport infrastructure and parking provision as part of agreen transport strategy. The remaining 50 per cent of the extra costs would be passed onto theconsumer in the purchase price of the home. Hence, the scenario costs would be:
Scenario Build cost % abovestandard
% of extra metthrough planning gain
Net % abovestandard Net build cost
1 £1000/m2 - - - £1000/m2
2/3 £1020/m2 2% 50% 1% £1010/m2
4 £1100/m2 10% 50% 5% £1050/m2
For the purposes of this study the average new dwelling size is considered to be 100m2.
11 Figure supplied by Sustainable Homes. EcoHomes Costings, e2S environmental consultants , December 2002
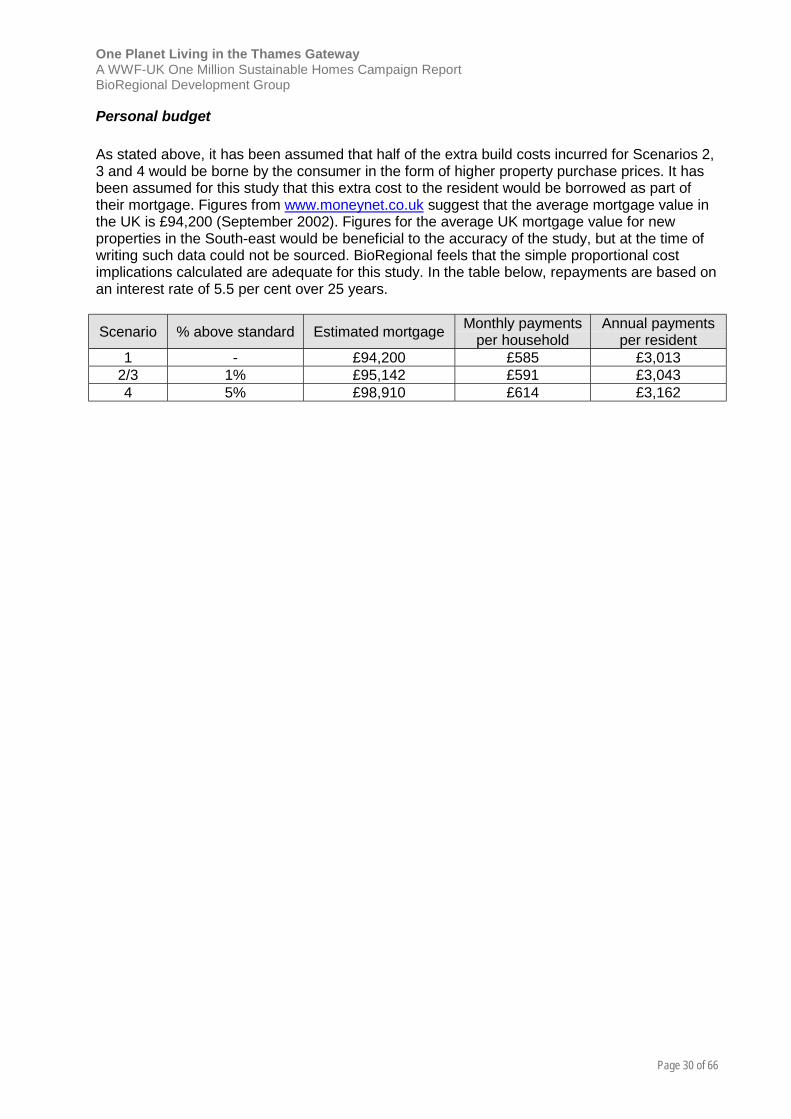
One Planet Living in the Thames GatewayA WWF-UK One Million Sustainable Homes Campaign ReportBioRegional Development Group
Page 30 of 66
Personal budget
As stated above, it has been assumed that half of the extra build costs incurred for Scenarios 2,3 and 4 would be borne by the consumer in the form of higher property purchase prices. It hasbeen assumed for this study that this extra cost to the resident would be borrowed as part oftheir mortgage. Figures from www.moneynet.co.uk suggest that the average mortgage value inthe UK is £94,200 (September 2002). Figures for the average UK mortgage value for newproperties in the South-east would be beneficial to the accuracy of the study, but at the time ofwriting such data could not be sourced. BioRegional feels that the simple proportional costimplications calculated are adequate for this study. In the table below, repayments are based onan interest rate of 5.5 per cent over 25 years.
Scenario % above standard Estimated mortgage Monthly paymentsper household
Annual paymentsper resident
1 - £94,200 £585 £3,0132/3 1% £95,142 £591 £3,0434 5% £98,910 £614 £3,162
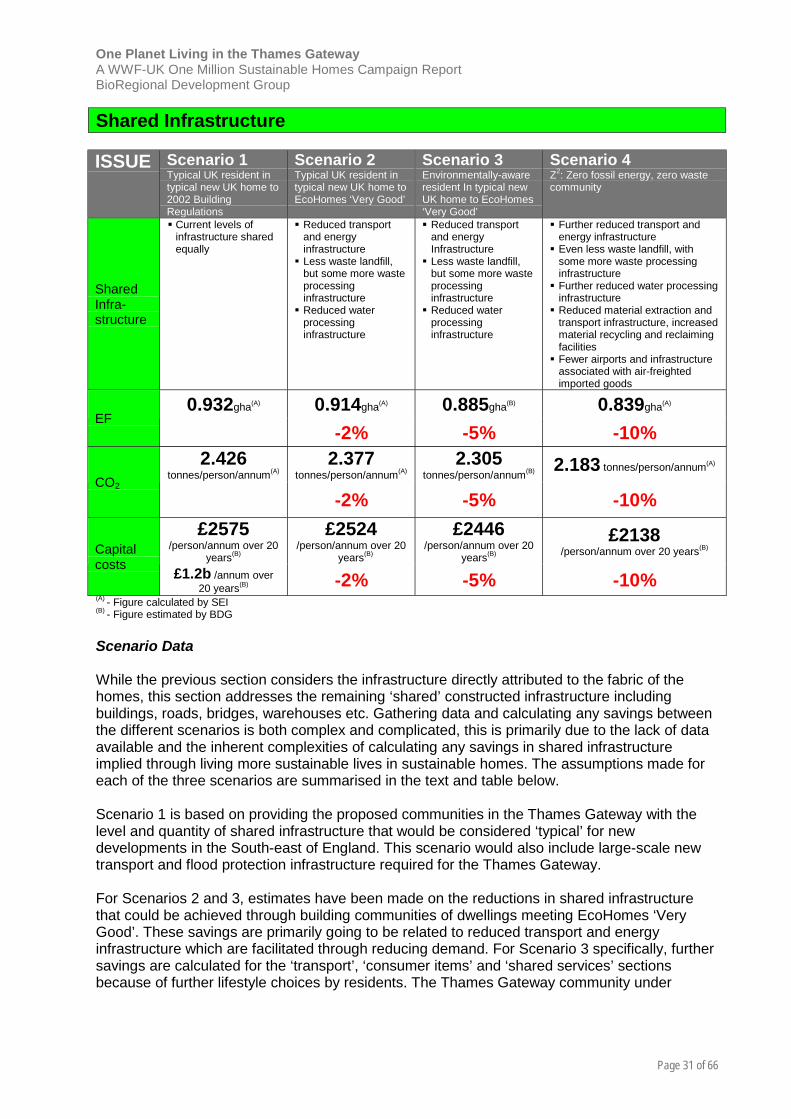
One Planet Living in the Thames GatewayA WWF-UK One Million Sustainable Homes Campaign ReportBioRegional Development Group
Page 31 of 66
Shared Infrastructure
ISSUE Scenario 1Typical UK resident intypical new UK home to2002 BuildingRegulations
Scenario 2Typical UK resident intypical new UK home toEcoHomes ‘Very Good’
Scenario 3Environmentally-awareresident In typical newUK home to EcoHomes‘Very Good’
Scenario 4Z2: Zero fossil energy, zero wastecommunity
SharedInfra-structure
! Current levels ofinfrastructure sharedequally
! Reduced transportand energyinfrastructure
! Less waste landfill,but some more wasteprocessinginfrastructure
! Reduced waterprocessinginfrastructure
! Reduced transportand energyInfrastructure
! Less waste landfill,but some more wasteprocessinginfrastructure
! Reduced waterprocessinginfrastructure
! Further reduced transport andenergy infrastructure
! Even less waste landfill, withsome more waste processinginfrastructure
! Further reduced water processinginfrastructure
! Reduced material extraction andtransport infrastructure, increasedmaterial recycling and reclaimingfacilities
! Fewer airports and infrastructureassociated with air-freightedimported goods
0.932gha(A) 0.914gha(A) 0.885gha(B) 0.839gha(A)
EF-2% -5% -10%
2.426tonnes/person/annum(A)
2.377tonnes/person/annum(A)
2.305tonnes/person/annum(B) 2.183 tonnes/person/annum(A)
CO2
-2% -5% -10%£2575
/person/annum over 20years(B)
£2524/person/annum over 20
years(B)
£2446/person/annum over 20
years(B)
£2138/person/annum over 20 years(B)Capital
costs £1.2b /annum over20 years(B) -2% -5% -10%
(A) - Figure calculated by SEI(B) - Figure estimated by BDG
Scenario Data
While the previous section considers the infrastructure directly attributed to the fabric of thehomes, this section addresses the remaining ‘shared’ constructed infrastructure includingbuildings, roads, bridges, warehouses etc. Gathering data and calculating any savings betweenthe different scenarios is both complex and complicated, this is primarily due to the lack of dataavailable and the inherent complexities of calculating any savings in shared infrastructureimplied through living more sustainable lives in sustainable homes. The assumptions made foreach of the three scenarios are summarised in the text and table below.
Scenario 1 is based on providing the proposed communities in the Thames Gateway with thelevel and quantity of shared infrastructure that would be considered ‘typical’ for newdevelopments in the South-east of England. This scenario would also include large-scale newtransport and flood protection infrastructure required for the Thames Gateway.
For Scenarios 2 and 3, estimates have been made on the reductions in shared infrastructurethat could be achieved through building communities of dwellings meeting EcoHomes ‘VeryGood’. These savings are primarily going to be related to reduced transport and energyinfrastructure which are facilitated through reducing demand. For Scenario 3 specifically, furthersavings are calculated for the ‘transport’, ‘consumer items’ and ‘shared services’ sectionsbecause of further lifestyle choices by residents. The Thames Gateway community under
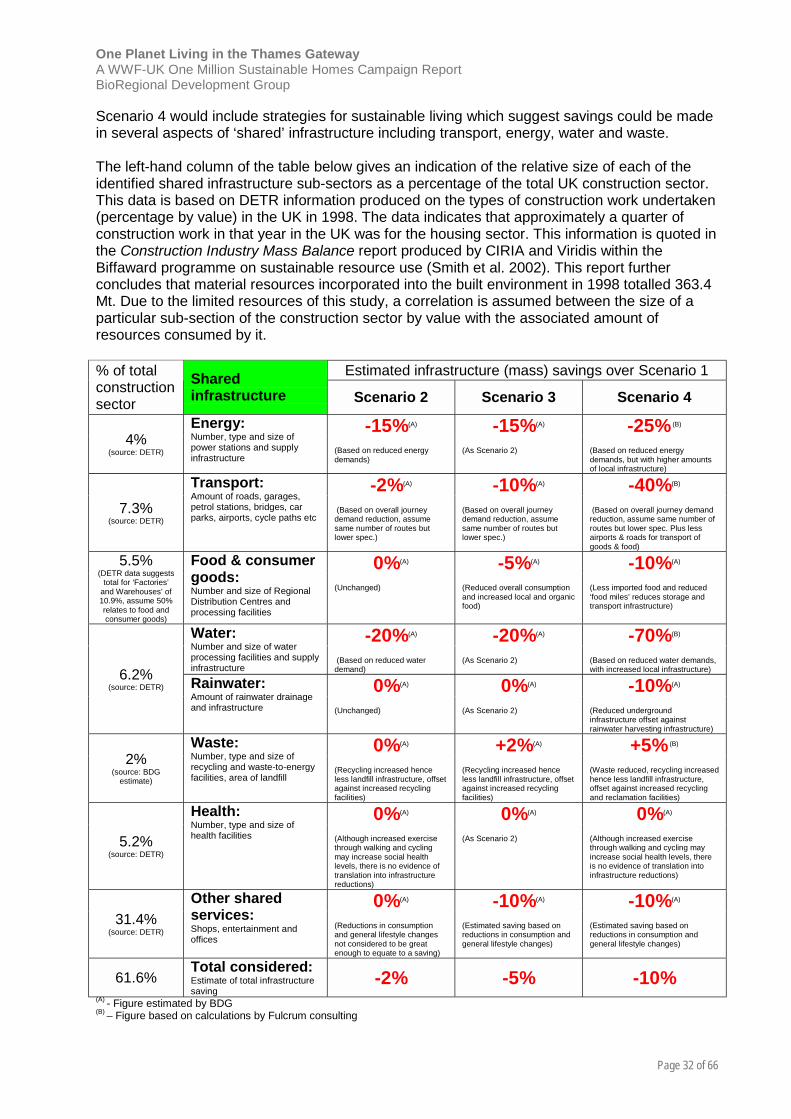
One Planet Living in the Thames GatewayA WWF-UK One Million Sustainable Homes Campaign ReportBioRegional Development Group
Page 32 of 66
Scenario 4 would include strategies for sustainable living which suggest savings could be madein several aspects of ‘shared’ infrastructure including transport, energy, water and waste.
The left-hand column of the table below gives an indication of the relative size of each of theidentified shared infrastructure sub-sectors as a percentage of the total UK construction sector.This data is based on DETR information produced on the types of construction work undertaken(percentage by value) in the UK in 1998. The data indicates that approximately a quarter ofconstruction work in that year in the UK was for the housing sector. This information is quoted inthe Construction Industry Mass Balance report produced by CIRIA and Viridis within theBiffaward programme on sustainable resource use (Smith et al. 2002). This report furtherconcludes that material resources incorporated into the built environment in 1998 totalled 363.4Mt. Due to the limited resources of this study, a correlation is assumed between the size of aparticular sub-section of the construction sector by value with the associated amount ofresources consumed by it.
Estimated infrastructure (mass) savings over Scenario 1% of totalconstructionsector
Sharedinfrastructure Scenario 2 Scenario 3 Scenario 4
-15%(A) -15%(A) -25% (B)
4%(source: DETR)
Energy:Number, type and size ofpower stations and supplyinfrastructure
(Based on reduced energydemands)
(As Scenario 2) (Based on reduced energydemands, but with higher amountsof local infrastructure)
-2%(A) -10%(A) -40%(B)
7.3%(source: DETR)
Transport:Amount of roads, garages,petrol stations, bridges, carparks, airports, cycle paths etc
(Based on overall journeydemand reduction, assumesame number of routes butlower spec.)
(Based on overall journeydemand reduction, assumesame number of routes butlower spec.)
(Based on overall journey demandreduction, assume same number ofroutes but lower spec. Plus lessairports & roads for transport ofgoods & food)
0%(A) -5%(A) -10%(A)5.5%(DETR data suggests
total for ‘Factories’and Warehouses’ of10.9%, assume 50%relates to food andconsumer goods)
Food & consumergoods:Number and size of RegionalDistribution Centres andprocessing facilities
(Unchanged) (Reduced overall consumptionand increased local and organicfood)
(Less imported food and reduced‘food miles’ reduces storage andtransport infrastructure)
-20%(A) -20%(A) -70%(B)Water:Number and size of waterprocessing facilities and supplyinfrastructure
(Based on reduced waterdemand)
(As Scenario 2) (Based on reduced water demands,with increased local infrastructure)
0%(A) 0%(A) -10%(A)6.2%
(source: DETR) Rainwater:Amount of rainwater drainageand infrastructure (Unchanged) (As Scenario 2) (Reduced underground
infrastructure offset againstrainwater harvesting infrastructure)
0%(A) +2%(A) +5% (B)
2%(source: BDG
estimate)
Waste:Number, type and size ofrecycling and waste-to-energyfacilities, area of landfill
(Recycling increased henceless landfill infrastructure, offsetagainst increased recyclingfacilities)
(Recycling increased henceless landfill infrastructure, offsetagainst increased recyclingfacilities)
(Waste reduced, recycling increasedhence less landfill infrastructure,offset against increased recyclingand reclamation facilities)
0%(A) 0%(A) 0%(A)
5.2%(source: DETR)
Health:Number, type and size ofhealth facilities (Although increased exercise
through walking and cyclingmay increase social healthlevels, there is no evidence oftranslation into infrastructurereductions)
(As Scenario 2) (Although increased exercisethrough walking and cycling mayincrease social health levels, thereis no evidence of translation intoinfrastructure reductions)
0%(A) -10%(A) -10%(A)
31.4%(source: DETR)
Other sharedservices:Shops, entertainment andoffices
(Reductions in consumptionand general lifestyle changesnot considered to be greatenough to equate to a saving)
(Estimated saving based onreductions in consumption andgeneral lifestyle changes)
(Estimated saving based onreductions in consumption andgeneral lifestyle changes)
61.6%Total considered:Estimate of total infrastructuresaving
-2% -5% -10%(A) - Figure estimated by BDG(B) – Figure based on calculations by Fulcrum consulting
One Planet Living in the Thames GatewayA WWF-UK One Million Sustainable Homes Campaign ReportBioRegional Development Group
Page 33 of 66
Ecological Footprint and Carbon Dioxide emissions
As mentioned previously, calculating the environmental impact of shared infrastructure iscomplicated by the lack of available source data. For this study the Stockholm EnvironmentInstitute has used PRODCOM (PRODucts of the European COMmunity statistics) data todeduce an EF figure of 0.932gha/cap/annum and CO2 figure of 2.426 tonnes/person/annum asthe benchmark values for Scenario 1.
Linear and proportional reductions have been assumed for both the EF and CO2 components forthe other scenarios. This is based on the percentage decreases in mass of materialsincorporated into shared infrastructure as suggested in the table above with an additional savingof 2 per cent added to Scenario 4 for EF, CO2 and cost estimates to account for the use of local,reclaimed and recycled materials in the shared infrastructure.
Government spending
There is scarce publicly available data on the anticipated costs of building the infrastructurerequired to facilitate the development of the Thames Gateway. Some of the available data andestimates are indicated below, with a rationale for the figures used in this study.
• the Environment Agency (EA) anticipates the costs of improving flood protection to theThames and defending the Thames Gateway could be approximately £4billion; and
• government figures regarding the expected infrastructure costs total £1.2 billion with onlya 3 per cent government contribution towards the total crossrail costs of £5.5billion
Thames Gateway Kent Partnership has produced figures regarding the public sector costs ofdelivering the North Kent Area Investment Framework (AIF) as part of the overall ThamesGateway redevelopment. The figures are indicated briefly below and are used as the basis fordeveloping estimates for the 200,000 homes proposed as part of the Thames Gateway. Thebase assumptions regarding the level of investment required to achieve the objectives set out inthe North Kent AIF are:
• 56,000 net increase in North Kent's population;• 2.5 million m2 of additional floor space;• 84,000 new job opportunities that are taken up by North Kent residents; and• 45,000 new dwellings that will accommodate some 104,000 people.
This model has been used to estimate very approximate public spending implications for thissection. The extract below is taken from www.thamesgateway-kent.org.uk
“We estimate that the total gross additional public investment required in North Kent, over theperiod 2002-2021, to achieve the objectives set out in the North Kent AIF is around £11.6 billion.This is equivalent to additional annual expenditure averaging around £580 million p.a. over aperiod of 20 years.
The net cost to the public sector is likely to be considerably lower because of expected privatesector contributions to the cost of development sites, new housing and other key projects. Aftertaking these contributions into account, we estimate that the net additional cost to the publicsector will be reduced from a gross figure of £11.6 billion to a net £4.3 billion or around £215million p.a. over a 20-year period. There are also likely to be a number of development gainssuch as lower social security and higher receipts from business rates. If these are included, then

One Planet Living in the Thames GatewayA WWF-UK One Million Sustainable Homes Campaign ReportBioRegional Development Group
Page 34 of 66
the cost of the North Kent AIF to the public sector is likely to fall further to £2.1 billion or £210million p.a.
This equates to a per capita spend of some £4,500 p.a. (an increase of £230 per person p.a.over a 20-year period on the current level of expenditure of £4,300 per capita p.a.). This level ofper capital investment would still be below the estimate of £5,000 average per capita spendingin other UK regeneration areas.”
Using the TGKP model, a very approximate estimate for public sector expenditure associatedwith the planned 200,000 homes in the Thames Gateway can be suggested. The calculationassumes the same proportions of floor space created and jobs created, but does not takeaccount of any particular key projects (e.g. transport links and flood defences):
North Kent AIF £215 million / 45,000 homes = £4,778 per homeThames Gateway 200,000 homes x £4,778/home = £955m per annum over 20 years
If an estimate for specific transport and flood prevention infrastructure is added:
Flood prevention (see EA estimate above) £4 billion = £200m per annum over 20 yearsTransport infrastructure (see above) £1.2 billion = £60m per annum over 20 years
Total £24.3 billion = £1.2 billion per annum
In the calculations above, the costs for Scenarios 2, 3 and 4 have been reduced based crudelyon the percentage infrastructure materials savings. Alternatively, public spending could bemaintained at the same level of £2,575 per person per annum over 20 years. The aim of thisstudy is not primarily to demonstrate how the government could make savings in its expenditureon developing Thames Gateway, although this may prove to be the case, but to illustrate howenvironmental benefits and government sustainable development and energy targets could bemet using the same budget.
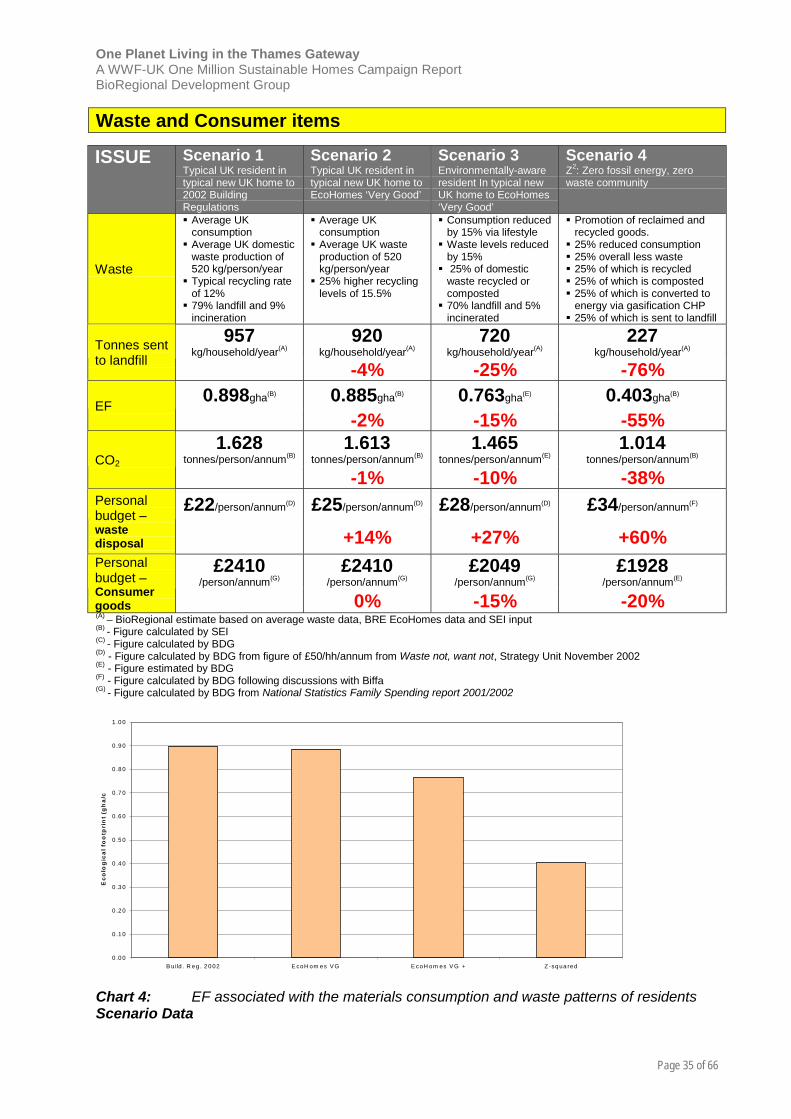
One Planet Living in the Thames GatewayA WWF-UK One Million Sustainable Homes Campaign ReportBioRegional Development Group
Page 35 of 66
Waste and Consumer items
ISSUE Scenario 1Typical UK resident intypical new UK home to2002 BuildingRegulations
Scenario 2Typical UK resident intypical new UK home toEcoHomes ‘Very Good’
Scenario 3Environmentally-awareresident In typical newUK home to EcoHomes‘Very Good’
Scenario 4Z2: Zero fossil energy, zerowaste community
Waste
! Average UKconsumption
! Average UK domesticwaste production of520 kg/person/year
! Typical recycling rateof 12%
! 79% landfill and 9%incineration
! Average UKconsumption
! Average UK wasteproduction of 520kg/person/year
! 25% higher recyclinglevels of 15.5%
! Consumption reducedby 15% via lifestyle
! Waste levels reducedby 15%
! 25% of domesticwaste recycled orcomposted
! 70% landfill and 5%incinerated
! Promotion of reclaimed andrecycled goods.
! 25% reduced consumption! 25% overall less waste! 25% of which is recycled! 25% of which is composted! 25% of which is converted to
energy via gasification CHP! 25% of which is sent to landfill
957kg/household/year(A)
920kg/household/year(A)
720kg/household/year(A)
227kg/household/year(A)Tonnes sent
to landfill -4% -25% -76%0.898gha(B) 0.885gha(B) 0.763gha(E) 0.403gha(B)
EF-2% -15% -55%
1.628tonnes/person/annum(B)
1.613tonnes/person/annum(B)
1.465tonnes/person/annum(E)
1.014tonnes/person/annum(B)CO2
-1% -10% -38%£22/person/annum(D) £25/person/annum(D) £28/person/annum(D) £34/person/annum(F)Personal
budget –wastedisposal +14% +27% +60%
£2410/person/annum(G)
£2410/person/annum(G)
£2049/person/annum(G)
£1928/person/annum(E)
Personalbudget –Consumergoods 0% -15% -20%(A) – BioRegional estimate based on average waste data, BRE EcoHomes data and SEI input(B) - Figure calculated by SEI(C) - Figure calculated by BDG(D) - Figure calculated by BDG from figure of £50/hh/annum from Waste not, want not, Strategy Unit November 2002(E) - Figure estimated by BDG(F) - Figure calculated by BDG following discussions with Biffa(G) - Figure calculated by BDG from National Statistics Family Spending report 2001/2002
Chart 4: EF associated with the materials consumption and waste patterns of residentsScenario Data
0 .0 0
0 .1 0
0 .2 0
0 .3 0
0 .4 0
0 .5 0
0 .6 0
0 .7 0
0 .8 0
0 .9 0
1 .0 0
B u ild . R eg . 2 0 02 E coH om es V G E coH om es V G + Z -sq ua red
Eco
log
ical
fo
otp
rin
t (g
ha/
c
One Planet Living in the Thames GatewayA WWF-UK One Million Sustainable Homes Campaign ReportBioRegional Development Group
Page 36 of 66
The data-sets for Scenarios 1 and 2 are broadly the same. They are based on typical UKhousehold waste production levels, but with increased recycling rates for the EcoHomes ‘VeryGood’ Scenario because the scheme rewards the provision of segregated bins in homes toencourage recycling (EcoHomes also awards credits for integration with the local authority’srecycling schemes). Scenario 3 is based on a resident reviewing their personal consumptionlevels to facilitate a reduction of 15 per cent in consumer goods12 and a corresponding savingin total waste produced. The residents under this scenario also recycle and compost more thantheir neighbours under Scenario 2, but the remaining waste is still mostly sent to landfill.
For Scenario 4, the waste and recycling strategy is more comprehensive and extends fromsegregated bins in all kitchens to external bulk bins and integration into the local authority’srecycling schemes. There are also on-site composting facilities for organic kitchen waste andlocal ‘waste-to-energy’ gasification or pyrolysis combined heat and power plants.
For Scenario 1, the waste management breakdown for England in 2000/01 has been used (i.e.79 per cent of waste sent to landfill, 9 per cent to incineration and 12 per cent being recycled orcomposted). For Scenario 2, recycling rates have been increased although overall waste levelsremain the same, the rest of the waste going either to landfill (90 per cent of that rest) or toincineration (10 per cent of that rest). For Scenario 3, waste production is reduced and recyclingincreased. For Scenario 4, a four-quarters strategy has been proposed with 25 per cent ofwaste being composted, 25 per cent being recycled, 25 per cent being converted into energyand 25 per cent landfilled. Additionally, it has been calculated that an overall reduction indomestic waste levels of one-quarter could be achieved.
Ecological Footprint and Carbon Dioxide emissions
The EF for ‘waste and consumer items’ has the potential to be reduced considerably throughchanges in lifestyle and attitudes towards waste implied in the four scenarios. The savings areparticularly noticeable for Z2 residents in Scenario 4 where the measures taken on wasteavoidance and recycling result in a 55 per cent overall EF reduction compared to the UKaverage. This illustrates that shifting perceptions to view waste as a resource can havesignificant environmental benefits.
The Stockholm Environment Institute notes that with increased recycling rates, the associatedEF increases slightly. However, this increase is still far less than the corresponding decrease ofthe landfill footprint. The EF of incineration is relatively small due to the small amount ofmaterials that are incinerated. It must be stated however, that this depends on the regionalwaste management strategy and that EF methodology does not take account of pollution.
The most significant reduction in the EF of waste is due to waste avoidance. It can beconcluded from this that there is little sense in viewing alternative treatment technologiesoutside of the wider question of society’s pattern of resource consumption, which currently givesrise to a vast amount of waste through ever-increasing consumption levels. Our consumptionpatterns themselves need to change, because the replacement of one mass disposal methodwith another will not lead to a sustainable solution.
Personal budget 12 Figure for ‘personal budget’ for consumer goods is based on National Statistics Family Spending report 2001/2002. Sections oftotal household budget taken into account are: 3 – Clothing & footwear, 5 – Household goods and services, 9 (9.1, 9.2, 9.3, & 9.5only) Recreation and culture, and 12 (12.1 & 12.2 only) Miscellaneous goods and services. Data for South east households is usedand assumed occupancy of 2.33 residents per household.
One Planet Living in the Thames GatewayA WWF-UK One Million Sustainable Homes Campaign ReportBioRegional Development Group
Page 37 of 66
In the Waste not, want not report published by the UK government in 2002, it is stated thatbecause of this country’s reliance on landfill, householders pay some of the lowest rates forwaste collection and disposal in Europe – around £50 per year on average. This figure isapproximately half the EU average and about 30 per cent of the rate of high-performingcountries.
Figures from Biffa waste management suggest that a ‘four-quarters’ waste strategy (asdiscussed above) for a reasonably sized community of at least 100,000 households could beimplemented for approximately £80 per household per year (Scenario 4). This highlights the factthat under current market conditions, landfilling waste is not priced in step with the associatedenvironmental impact, or at a price to make people carefully consider alternative ways ofmanaging their unwanted goods and services. For Scenarios 2 and 3, assumptions have beenmade on small increases in expenditure on waste disposal (via Council Tax payments) to reflectthe increased infrastructure and costs currently associated with increased recycling levels.
Costs for the collection and disposal of domestic waste are passed on to residents as part oftheir Council Tax payments to local government. In the future, as local authorities cope withhigher government targets and higher Landfill Tax levels, it is likely that homes will be chargedmore for their waste sent to landfill and may pay based on the amount they produce.
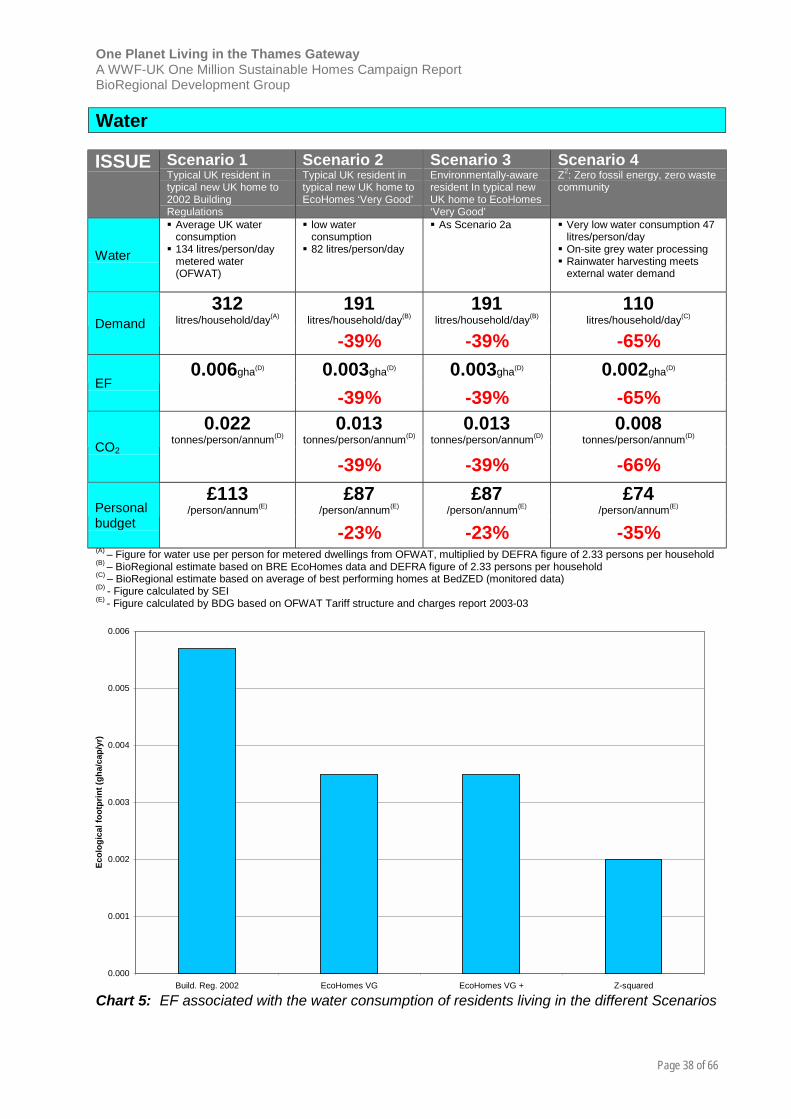
One Planet Living in the Thames GatewayA WWF-UK One Million Sustainable Homes Campaign ReportBioRegional Development Group
Page 38 of 66
Water
ISSUE Scenario 1Typical UK resident intypical new UK home to2002 BuildingRegulations
Scenario 2Typical UK resident intypical new UK home toEcoHomes ‘Very Good’
Scenario 3Environmentally-awareresident In typical newUK home to EcoHomes‘Very Good’
Scenario 4Z2: Zero fossil energy, zero wastecommunity
Water
! Average UK waterconsumption
! 134 litres/person/daymetered water(OFWAT)
! low waterconsumption
! 82 litres/person/day
! As Scenario 2a ! Very low water consumption 47litres/person/day
! On-site grey water processing! Rainwater harvesting meets
external water demand
312litres/household/day(A)
191litres/household/day(B)
191litres/household/day(B)
110litres/household/day(C)
Demand-39% -39% -65%
0.006gha(D) 0.003gha(D) 0.003gha(D) 0.002gha(D)
EF-39% -39% -65%
0.022tonnes/person/annum(D)
0.013tonnes/person/annum(D)
0.013tonnes/person/annum(D)
0.008tonnes/person/annum(D)
CO2
-39% -39% -66%£113
/person/annum(E)£87
/person/annum(E)£87
/person/annum(E)£74
/person/annum(E)Personalbudget -23% -23% -35%(A) – Figure for water use per person for metered dwellings from OFWAT, multiplied by DEFRA figure of 2.33 persons per household(B) – BioRegional estimate based on BRE EcoHomes data and DEFRA figure of 2.33 persons per household(C) – BioRegional estimate based on average of best performing homes at BedZED (monitored data)(D) - Figure calculated by SEI(E) - Figure calculated by BDG based on OFWAT Tariff structure and charges report 2003-03
Chart 5: EF associated with the water consumption of residents living in the different Scenarios
0.000
0.001
0.002
0.003
0.004
0.005
0.006
Build. Reg. 2002 EcoHomes VG EcoHomes VG + Z-squared
Ecol
ogic
al fo
otpr
int (
gha/
cap/
yr)
One Planet Living in the Thames GatewayA WWF-UK One Million Sustainable Homes Campaign ReportBioRegional Development Group
Page 39 of 66
Scenario Data
While the UK as a whole is not water-stressed, local and regional areas are increasinglysuffering from water management problems. Areas such as the South-east are getting drier asthey become more developed and population density increases, whereas previously industrialareas find their water tables rising as water demand falls.
Average UK water consumption data is used for Scenario 1, these figures being based ontypical consumption in a metered home and are calculated per person (sources: OFWAT).Consumption data for Scenarios 2 and 3 has been estimated based on reduced water demandwhich is rewarded under the EcoHomes scheme. It is assumed that the homes built underScenarios 2 and 3 would have low-flush toilets, showers with flow restrictors, low water useappliances and water butts for collecting rainwater for external use. The water demand andhence savings are assumed to be equal for Scenarios 2 and 3, because although lifestylechoices and water use patterns can clearly effect overall demand, the savings are mainlyfacilitated through the ‘hardware’ of low flow and low demand appliances and fittings.
Scenario 4 is based on the sustainable water management strategy developed at BedZED.The three facets of the strategy are reducing water demand through the specification of lowuse fittings and appliances, collection of rainwater to reduce potable water demand further,and treatment of ‘waste’ water locally for re-use.
At BedZED, an on-site indoor reed bed system treats sewage from the homes and businesseson the development. The technology used mirrors processes that occur in the natural world, butreplicates them more intensively. The installation uses plants to reduce the amount of nitrogenand phosphorous in the ‘black water’, producing sufficiently clean ‘green water’ to be used forirrigation and flushing toilets. The treated water is mixed with filtered harvested rainwater inunderground storage tanks before being used in the dwellings, any excess treated water is usedfor irrigation of the landscape, and the remainder is discharged under licence into a localwatercourse. For larger Thames Gateway communities, the sustainable water managementprinciples would be similar although the implementation may differ.
The management of water falling on developments as rain would also be considered inScenario 4. The use of permeable paving would allow the absorption of rainwater peaks therebyreducing the stresses on drainage and river systems. Using porous drainage systems allowsrainwater to replenish ground water supplies and reduce the need for extensive undergrounddrainage.
As mentioned previously with respect to energy use, monitored consumption data has beengathered at BedZED and the values have been used to inform the water consumption forScenario 4.
Ecological Footprint and Carbon Dioxide emissions
The ecological footprint (EF) and CO2 emissions associated with water use is insignificant whencompared with other resource consumption patterns and lifestyle elements. This is primarilybecause the energy input per litre of pumping potable water and treating waste water is low. Byreducing the water consumption as detailed in the four scenarios, the EF and CO2 levels can bereduced accordingly.
One Planet Living in the Thames GatewayA WWF-UK One Million Sustainable Homes Campaign ReportBioRegional Development Group
Page 40 of 66
Personal budget
The charges for the domestic supply of water and collection of sewerage for Scenarios 1, 2 and3 are calculated using figures reported in the OFWAT Tariff structure and charges report 2002-03. The saving achieved under Scenario 4 is calculated using a different methodology and isbased on the BedZED charging strategy. Under the scheme, residents are charged meteredunit rates for mains water, whilst ‘green water’ and sewerage are charged according to aformula based on the metered mains consumption and the size of the property. The figuressuggest that residents could reduce their annual water bills by up to 35 per cent by living in a Z2
community compared with a more conventional new-build development.
The unit rates and standing charges for supply and collection under Scenario 4 are broadlycomparable to the OFWAT average UK data. It should be noted however, that the sustainablewater management strategy employed at BedZED is towards the lower end of financial viabilityon a development of 100 properties. The scales of the communities in the Thames Gateway willbe more suited to large-scale water management strategies which could be realisedeconomically.
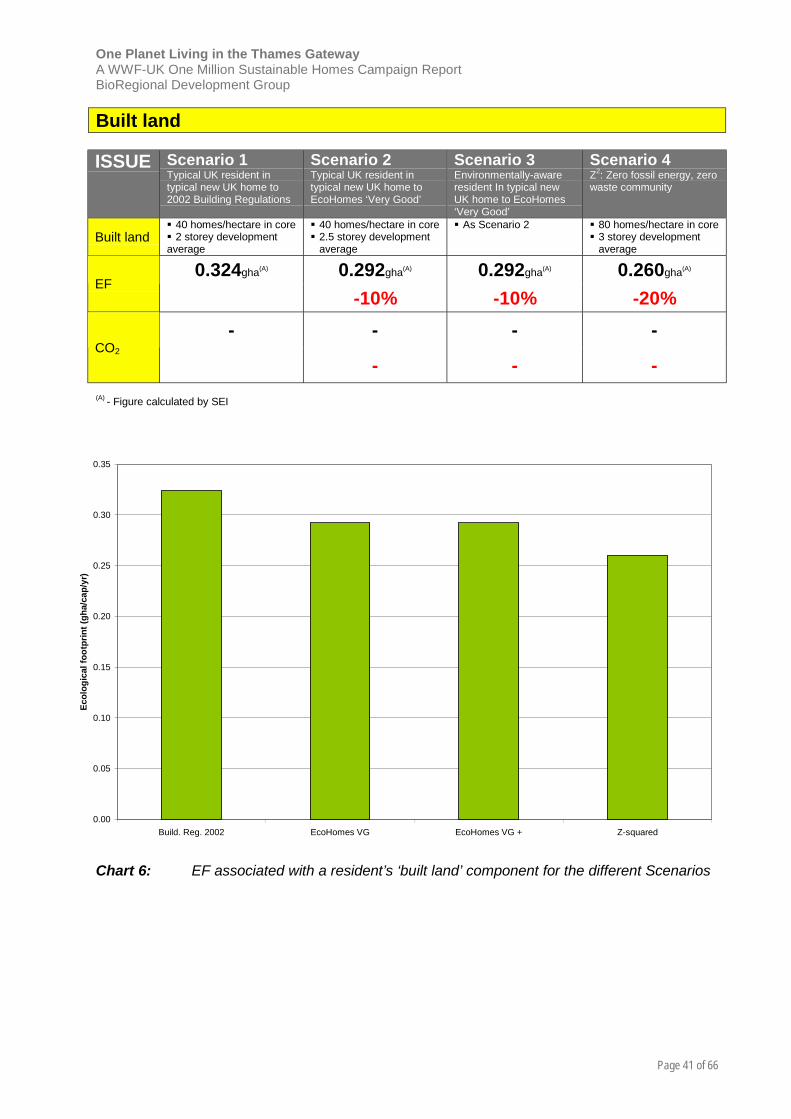
One Planet Living in the Thames GatewayA WWF-UK One Million Sustainable Homes Campaign ReportBioRegional Development Group
Page 41 of 66
Built land
ISSUE Scenario 1Typical UK resident intypical new UK home to2002 Building Regulations
Scenario 2Typical UK resident intypical new UK home toEcoHomes ‘Very Good’
Scenario 3Environmentally-awareresident In typical newUK home to EcoHomes‘Very Good’
Scenario 4Z2: Zero fossil energy, zerowaste community
Built land! 40 homes/hectare in core! 2 storey developmentaverage
! 40 homes/hectare in core! 2.5 storey development
average
! As Scenario 2 ! 80 homes/hectare in core! 3 storey development
average
0.324gha(A) 0.292gha(A) 0.292gha(A) 0.260gha(A)
EF-10% -10% -20%
- - - -CO2
- - -(A) - Figure calculated by SEI
Chart 6: EF associated with a resident’s ‘built land’ component for the different Scenarios
0.00
0.05
0.10
0.15
0.20
0.25
0.30
0.35
Build. Reg. 2002 EcoHomes VG EcoHomes VG + Z-squared
Ecol
ogic
al fo
otpr
int (
gha/
cap/
yr)
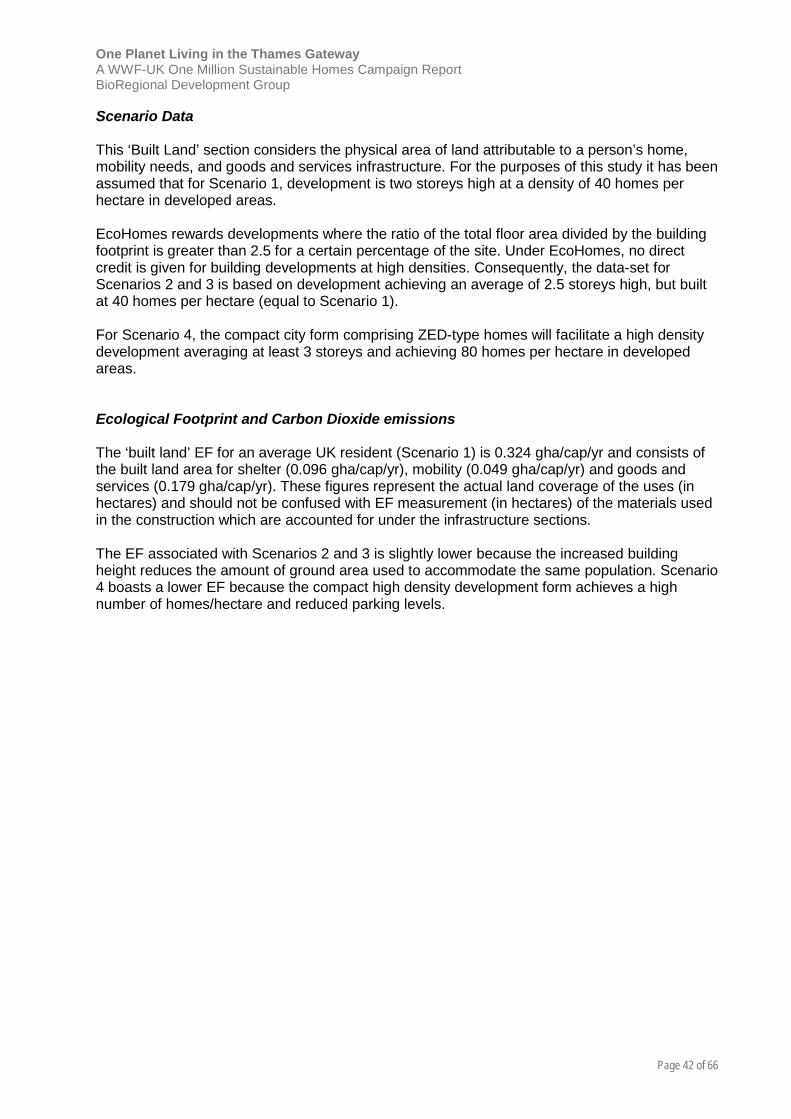
One Planet Living in the Thames GatewayA WWF-UK One Million Sustainable Homes Campaign ReportBioRegional Development Group
Page 42 of 66
Scenario Data
This ‘Built Land’ section considers the physical area of land attributable to a person’s home,mobility needs, and goods and services infrastructure. For the purposes of this study it has beenassumed that for Scenario 1, development is two storeys high at a density of 40 homes perhectare in developed areas.
EcoHomes rewards developments where the ratio of the total floor area divided by the buildingfootprint is greater than 2.5 for a certain percentage of the site. Under EcoHomes, no directcredit is given for building developments at high densities. Consequently, the data-set forScenarios 2 and 3 is based on development achieving an average of 2.5 storeys high, but builtat 40 homes per hectare (equal to Scenario 1).
For Scenario 4, the compact city form comprising ZED-type homes will facilitate a high densitydevelopment averaging at least 3 storeys and achieving 80 homes per hectare in developedareas.
Ecological Footprint and Carbon Dioxide emissions
The ‘built land’ EF for an average UK resident (Scenario 1) is 0.324 gha/cap/yr and consists ofthe built land area for shelter (0.096 gha/cap/yr), mobility (0.049 gha/cap/yr) and goods andservices (0.179 gha/cap/yr). These figures represent the actual land coverage of the uses (inhectares) and should not be confused with EF measurement (in hectares) of the materials usedin the construction which are accounted for under the infrastructure sections.
The EF associated with Scenarios 2 and 3 is slightly lower because the increased buildingheight reduces the amount of ground area used to accommodate the same population. Scenario4 boasts a lower EF because the compact high density development form achieves a highnumber of homes/hectare and reduced parking levels.
One Planet Living in the Thames GatewayA WWF-UK One Million Sustainable Homes Campaign ReportBioRegional Development Group
Page 43 of 66
Services
ISSUE Scenario 1Typical UK resident intypical new UK home to2002 Building Regulations
Scenario 2Typical UK resident intypical new UK home toEcoHomes ‘Very Good’
Scenario 3Environmentally-awareresident In typical new UKhome to EcoHomes ‘VeryGood’
Scenario 4Z2: Zero fossil energy, zerowaste community
Services
! Average use of:Retail, recreation,healthcare, hotel &catering, communications,banking and finance
! As Scenario 1 ! Fewer commercialservices used due toreduced consumption
! Fewer commercialservices used
! Less healthcare needed! Less consumption! Less travel
0.782gha(A) 0.782gha(A) 0.679gha(C) 0.610gha(A)
EF0% -13% -22%
1.397tonnes/person/annum(A)
1.397tonnes/person/annum(A)
1.213tonnes/person/annum(C)
1.090tonnes/person/annum(A)
CO2
0% -13% -22%£6682
/person/annum(B)£6682
/person/annum(C)£5813
/person/annum(C)£5212
/person/annum(C)Personalbudget 0% -13% -22%(A) - Figure calculated by SEI(B) - Figure calculated by BDG from National Statistics Family Spending report 2001/2002(C) - Figure estimated by BDG
Chart 7: EF associated with a resident’s ‘services’ component for the different Scenarios
0.00
0.10
0.20
0.30
0.40
0.50
0.60
0.70
0.80
0.90
Build. Reg. 2002 EcoHomes VG EcoHomes VG + Z-squared
Ecol
ogic
al fo
otpr
int (
gha/
cap/
yr)
One Planet Living in the Thames GatewayA WWF-UK One Million Sustainable Homes Campaign ReportBioRegional Development Group
Page 44 of 66
Scenario Data
When considering the environmental impact associated with our lifestyles, there is one sectorthat is used by everyone (to a varying degree), but which is difficult to define and quantify. Thisis the Service sector which includes retailing, hotel and catering, communications, banking andfinance, insurance and recreation. Our use of health services is also included under this section.
This sector can be further divided into commercial and public services. For Scenario 2, the useof commercial services has been reduced by 15 per cent to reflect an equivalent reduction inconsumer goods demand, whilst Scenario 4 has a 25 per cent saving in commercial services toreflect its one-quarter reduction in consumption of consumer goods. For all four scenarios, thelevel of public services used is assumed to be equal, it is beyond the scope of this study toconsider the complex matter of any savings in the sector.
Ecological Footprint and Carbon Dioxide emissions
SEI is currently working on a methodology to calculate the material flows and footprints for theservices sector as part of a major study, first estimates indicate that the EF for services isapproximately 0.7-0.8 global hectares/person/year (approximately 0.7 gha is associated withcommercial services and 0.1 gha with public services). The CO2 emissions for the two sectorstogether are approximately 1.4 tonnes/person/annum as a UK average.
Calculating accurate potential environmental savings on these figures resulting from living in thefour different scenarios is a complex matter and beyond the scope of this study, estimates havebeen made by BioRegional. These are based on the assumption that people who consume lessthan average, live a healthier lifestyle and travel less, will use fewer resources from the servicessector.
Personal budget
The personal annual spending figure of £6682/person/annum for Scenarios 1 and 2 is based ondata from the National Statistics Family Spending report 2001/2002 and estimates for Scenarios3 and 4 have been made based on proportional percentage reductions in line withenvironmental savings.
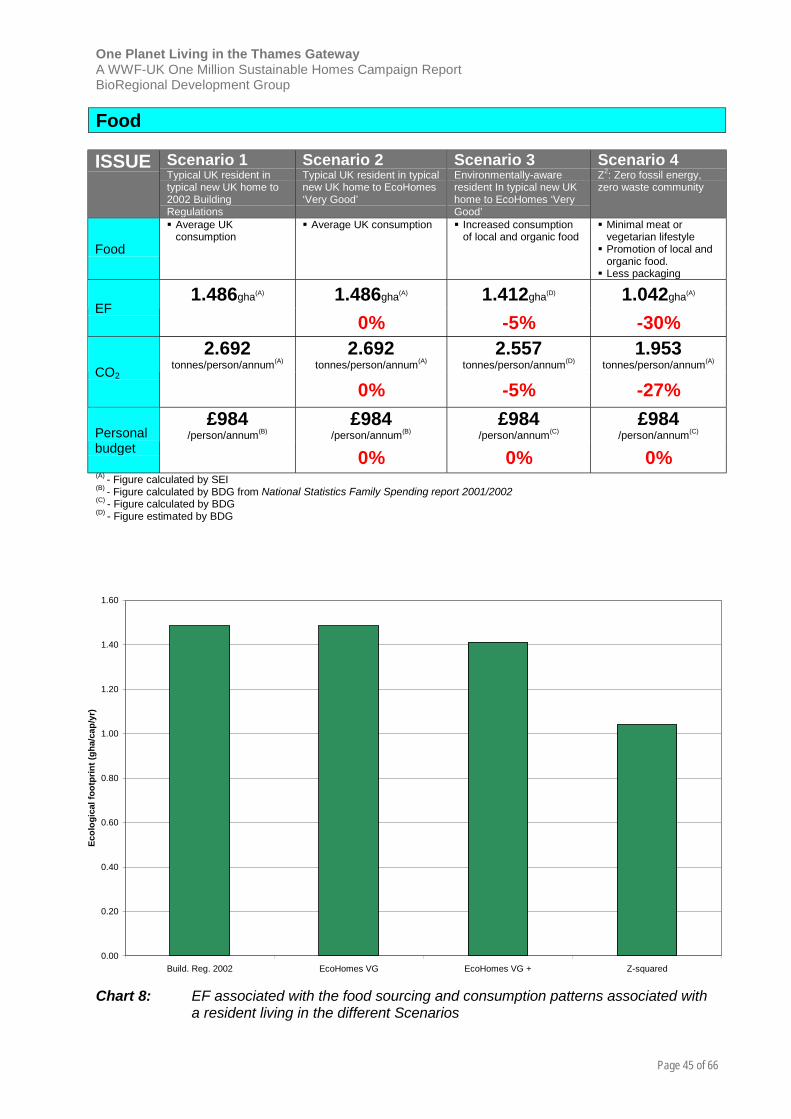
One Planet Living in the Thames GatewayA WWF-UK One Million Sustainable Homes Campaign ReportBioRegional Development Group
Page 45 of 66
Food
ISSUE Scenario 1Typical UK resident intypical new UK home to2002 BuildingRegulations
Scenario 2Typical UK resident in typicalnew UK home to EcoHomes‘Very Good’
Scenario 3Environmentally-awareresident In typical new UKhome to EcoHomes ‘VeryGood’
Scenario 4Z2: Zero fossil energy,zero waste community
Food
! Average UKconsumption
! Average UK consumption ! Increased consumptionof local and organic food
! Minimal meat orvegetarian lifestyle
! Promotion of local andorganic food.
! Less packaging
1.486gha(A) 1.486gha(A) 1.412gha(D) 1.042gha(A)
EF0% -5% -30%
2.692tonnes/person/annum(A)
2.692tonnes/person/annum(A)
2.557tonnes/person/annum(D)
1.953tonnes/person/annum(A)
CO2
0% -5% -27%£984
/person/annum(B)£984
/person/annum(B)£984
/person/annum(C)£984
/person/annum(C)Personalbudget 0% 0% 0%(A) - Figure calculated by SEI(B) - Figure calculated by BDG from National Statistics Family Spending report 2001/2002(C) - Figure calculated by BDG(D) - Figure estimated by BDG
Chart 8: EF associated with the food sourcing and consumption patterns associated witha resident living in the different Scenarios
0.00
0.20
0.40
0.60
0.80
1.00
1.20
1.40
1.60
Build. Reg. 2002 EcoHomes VG EcoHomes VG + Z-squared
Ecol
ogic
al fo
otpr
int (
gha/
cap/
yr)
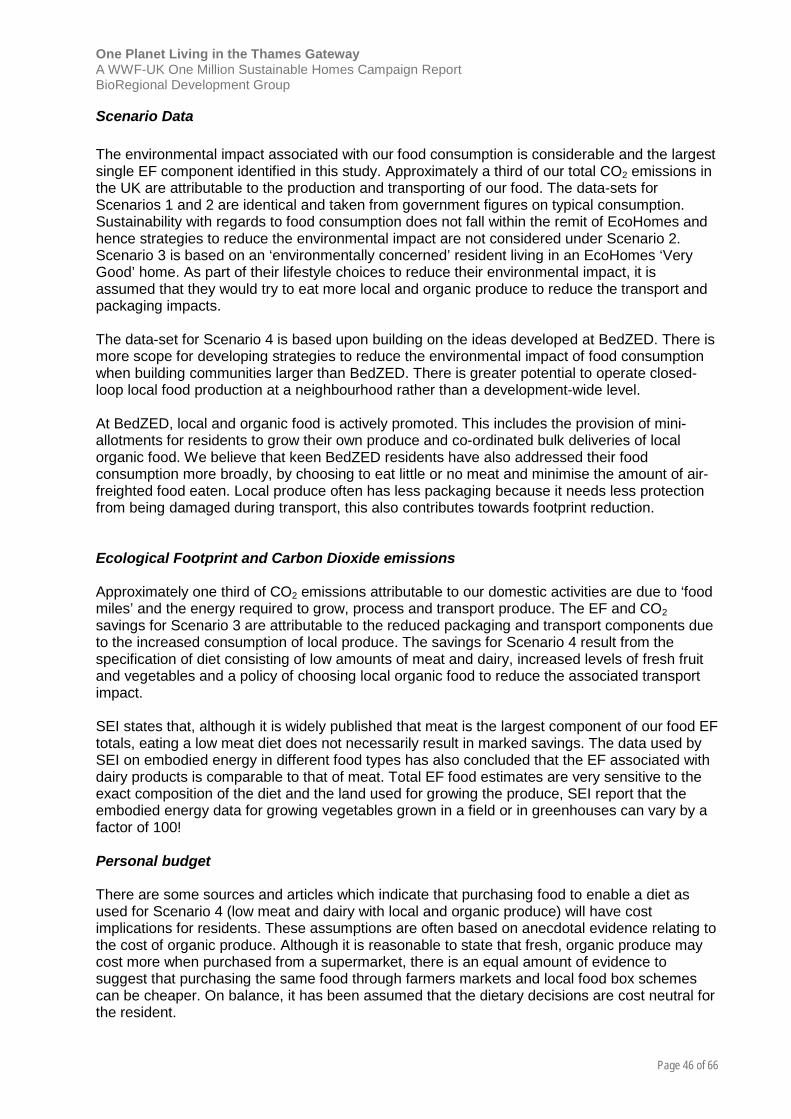
One Planet Living in the Thames GatewayA WWF-UK One Million Sustainable Homes Campaign ReportBioRegional Development Group
Page 46 of 66
Scenario Data
The environmental impact associated with our food consumption is considerable and the largestsingle EF component identified in this study. Approximately a third of our total CO2 emissions inthe UK are attributable to the production and transporting of our food. The data-sets forScenarios 1 and 2 are identical and taken from government figures on typical consumption.Sustainability with regards to food consumption does not fall within the remit of EcoHomes andhence strategies to reduce the environmental impact are not considered under Scenario 2.Scenario 3 is based on an ‘environmentally concerned’ resident living in an EcoHomes ‘VeryGood’ home. As part of their lifestyle choices to reduce their environmental impact, it isassumed that they would try to eat more local and organic produce to reduce the transport andpackaging impacts.
The data-set for Scenario 4 is based upon building on the ideas developed at BedZED. There ismore scope for developing strategies to reduce the environmental impact of food consumptionwhen building communities larger than BedZED. There is greater potential to operate closed-loop local food production at a neighbourhood rather than a development-wide level.
At BedZED, local and organic food is actively promoted. This includes the provision of mini-allotments for residents to grow their own produce and co-ordinated bulk deliveries of localorganic food. We believe that keen BedZED residents have also addressed their foodconsumption more broadly, by choosing to eat little or no meat and minimise the amount of air-freighted food eaten. Local produce often has less packaging because it needs less protectionfrom being damaged during transport, this also contributes towards footprint reduction.
Ecological Footprint and Carbon Dioxide emissions
Approximately one third of CO2 emissions attributable to our domestic activities are due to ‘foodmiles’ and the energy required to grow, process and transport produce. The EF and CO2savings for Scenario 3 are attributable to the reduced packaging and transport components dueto the increased consumption of local produce. The savings for Scenario 4 result from thespecification of diet consisting of low amounts of meat and dairy, increased levels of fresh fruitand vegetables and a policy of choosing local organic food to reduce the associated transportimpact.
SEI states that, although it is widely published that meat is the largest component of our food EFtotals, eating a low meat diet does not necessarily result in marked savings. The data used bySEI on embodied energy in different food types has also concluded that the EF associated withdairy products is comparable to that of meat. Total EF food estimates are very sensitive to theexact composition of the diet and the land used for growing the produce, SEI report that theembodied energy data for growing vegetables grown in a field or in greenhouses can vary by afactor of 100!
Personal budget
There are some sources and articles which indicate that purchasing food to enable a diet asused for Scenario 4 (low meat and dairy with local and organic produce) will have costimplications for residents. These assumptions are often based on anecdotal evidence relating tothe cost of organic produce. Although it is reasonable to state that fresh, organic produce maycost more when purchased from a supermarket, there is an equal amount of evidence tosuggest that purchasing the same food through farmers markets and local food box schemescan be cheaper. On balance, it has been assumed that the dietary decisions are cost neutral forthe resident.
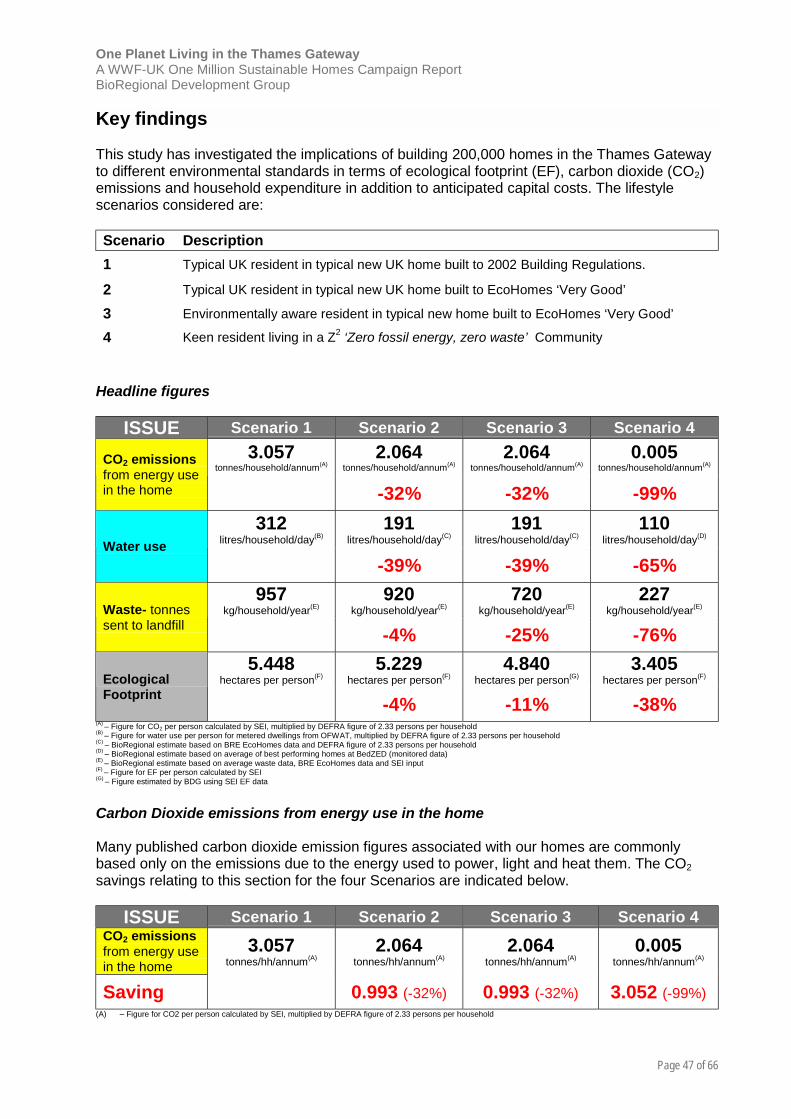
One Planet Living in the Thames GatewayA WWF-UK One Million Sustainable Homes Campaign ReportBioRegional Development Group
Page 47 of 66
Key findings
This study has investigated the implications of building 200,000 homes in the Thames Gatewayto different environmental standards in terms of ecological footprint (EF), carbon dioxide (CO2)emissions and household expenditure in addition to anticipated capital costs. The lifestylescenarios considered are:
Scenario Description1 Typical UK resident in typical new UK home built to 2002 Building Regulations.
2 Typical UK resident in typical new UK home built to EcoHomes ‘Very Good’
3 Environmentally aware resident in typical new home built to EcoHomes ‘Very Good’
4 Keen resident living in a Z2 ‘Zero fossil energy, zero waste’ Community
Headline figures
ISSUE Scenario 1 Scenario 2 Scenario 3 Scenario 43.057
tonnes/household/annum(A)2.064
tonnes/household/annum(A)2.064
tonnes/household/annum(A)0.005
tonnes/household/annum(A)CO2 emissionsfrom energy usein the home -32% -32% -99%
312litres/household/day(B)
191litres/household/day(C)
191litres/household/day(C)
110litres/household/day(D)
Water use-39% -39% -65%
957kg/household/year(E)
920kg/household/year(E)
720kg/household/year(E)
227kg/household/year(E)Waste- tonnes
sent to landfill -4% -25% -76%5.448
hectares per person(F)5.229
hectares per person(F)4.840
hectares per person(G)3.405
hectares per person(F)EcologicalFootprint -4% -11% -38%
(A) – Figure for CO2 per person calculated by SEI, multiplied by DEFRA figure of 2.33 persons per household(B) – Figure for water use per person for metered dwellings from OFWAT, multiplied by DEFRA figure of 2.33 persons per household(C) – BioRegional estimate based on BRE EcoHomes data and DEFRA figure of 2.33 persons per household(D) – BioRegional estimate based on average of best performing homes at BedZED (monitored data)(E) – BioRegional estimate based on average waste data, BRE EcoHomes data and SEI input(F) – Figure for EF per person calculated by SEI(G) – Figure estimated by BDG using SEI EF data
Carbon Dioxide emissions from energy use in the home
Many published carbon dioxide emission figures associated with our homes are commonlybased only on the emissions due to the energy used to power, light and heat them. The CO2savings relating to this section for the four Scenarios are indicated below.
ISSUE Scenario 1 Scenario 2 Scenario 3 Scenario 4CO2 emissionsfrom energy usein the home
3.057tonnes/hh/annum(A)
2.064tonnes/hh/annum(A)
2.064tonnes/hh/annum(A)
0.005tonnes/hh/annum(A)
Saving 0.993 (-32%) 0.993 (-32%) 3.052 (-99%)(A) – Figure for CO2 per person calculated by SEI, multiplied by DEFRA figure of 2.33 persons per household

One Planet Living in the Thames GatewayA WWF-UK One Million Sustainable Homes Campaign ReportBioRegional Development Group
Page 48 of 66
Based on these figures, it is then possible to extrapolate the total figures of carbon dioxide andcarbon for the planned 200,000 homes and to compare this to the government’s 2020projection of CO2 reductions of 4-6 MtC (a mid-point of 5MtC is assumed) in the domestic sectorby 2020.
Scenarios 2 and 3: 200,000 homes in the Thames Gateway
Saves 0.993 tonnes of CO2 per household per year
Saves 198,840 tonnes of CO2 per year for 200,000 homes
Equates to 54,220 tonnes of Carbon per year for 200,000 homes
This equates to approximately 1.1 per cent of 5MtC domestic sector reduction target for202013
Scenario 4: 200,000 homes in the Thames Gateway
Saves 3.052 tonnes of CO2 per household per year
Saves 610,640 tonnes of CO2 per year for 200,000 homes
Equates to 166,540 tonnes of Carbon per year for 200,000 homes
This equates to approximately 3.3 per cent of 5MtC domestic sector reduction target for 2020
Carbon Dioxide emissions associated with built form and utilities use
The CO2 emissions resulting from providing power, heat and light, account for only part of thetotal emissions attributable to our homes. To get a more complete picture of the CO2 emissions,the energy embodied within the construction materials and that resulting from the provision andtreatment of domestic water can also be considered. Extracting, refining, manufacturing andtransporting materials requires large amounts of energy and this has an associated carbondioxide emission, this energy is embodied within the products and components. The energydemands associated with the supply and processing of water for the domestic sector isrelatively small per litre, hence the carbon dioxide emissions are also small. The results for thefour scenarios (if these components are considered) are shown below.
ISSUE Scenario 1 Scenario 2 Scenario 3 Scenario 4Energy useHouse infrastructureSharedinfrastructureWater
9.473tonnes/hh/annum(B)
8.281tonnes/hh/annum(B)
8.113tonnes/hh/annum(B)
5.501tonnes/hh/annum(B)
Saving 1.192 (-13%) 1.360 (-14%) 3.972 (-42%)(B) – Figure for CO2 per person calculated by SEI, multiplied by DEFRA figure of 2.33 persons per household
13 The Government White Paper on energy, Our energy future – creating a low carbon economy; identifies an intermediate reductiontarget of 15-25 million tonnes of carbon (MtC) by 2020. The White Paper indicates that 4-6 MtC of the total 15-25 MtC reductioncould be achieved through energy efficiency in households. A mid-point figure of 5MtC is taken as a target for the domestic sector inthis study.
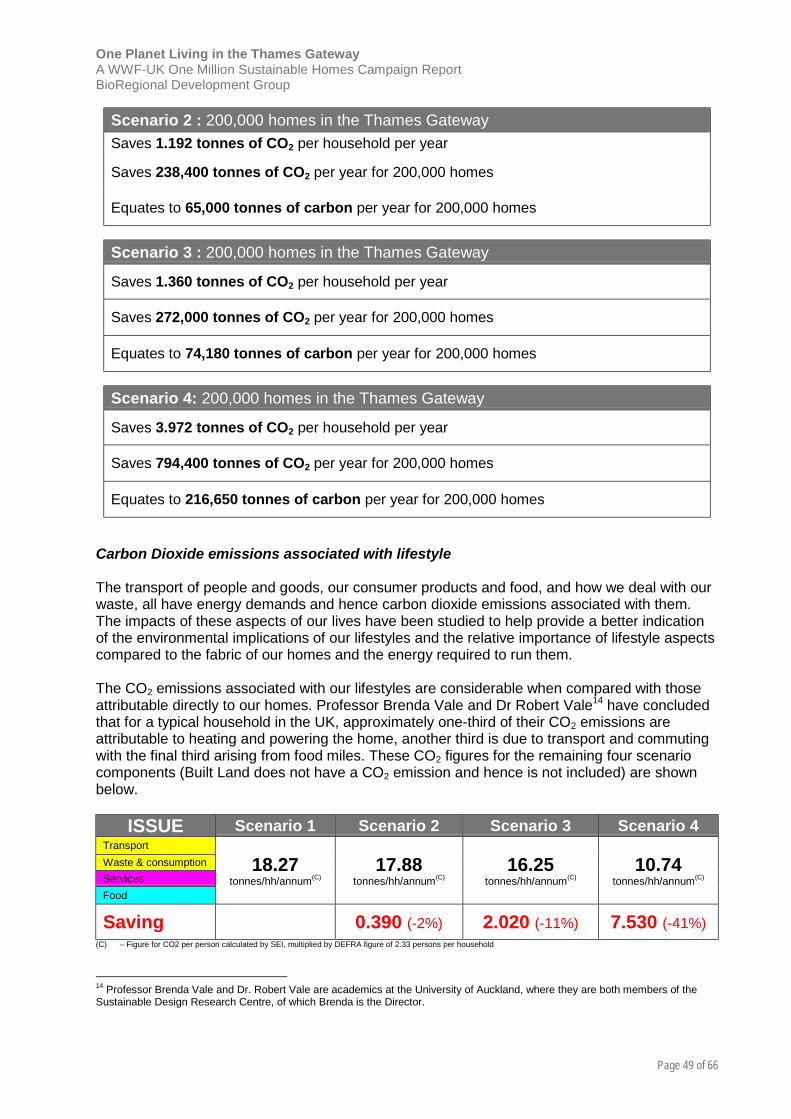
One Planet Living in the Thames GatewayA WWF-UK One Million Sustainable Homes Campaign ReportBioRegional Development Group
Page 49 of 66
Scenario 2 : 200,000 homes in the Thames GatewaySaves 1.192 tonnes of CO2 per household per year
Saves 238,400 tonnes of CO2 per year for 200,000 homes
Equates to 65,000 tonnes of carbon per year for 200,000 homes
Scenario 3 : 200,000 homes in the Thames Gateway
Saves 1.360 tonnes of CO2 per household per year
Saves 272,000 tonnes of CO2 per year for 200,000 homes
Equates to 74,180 tonnes of carbon per year for 200,000 homes
Scenario 4: 200,000 homes in the Thames Gateway
Saves 3.972 tonnes of CO2 per household per year
Saves 794,400 tonnes of CO2 per year for 200,000 homes
Equates to 216,650 tonnes of carbon per year for 200,000 homes
Carbon Dioxide emissions associated with lifestyle
The transport of people and goods, our consumer products and food, and how we deal with ourwaste, all have energy demands and hence carbon dioxide emissions associated with them.The impacts of these aspects of our lives have been studied to help provide a better indicationof the environmental implications of our lifestyles and the relative importance of lifestyle aspectscompared to the fabric of our homes and the energy required to run them.
The CO2 emissions associated with our lifestyles are considerable when compared with thoseattributable directly to our homes. Professor Brenda Vale and Dr Robert Vale14 have concludedthat for a typical household in the UK, approximately one-third of their CO2 emissions areattributable to heating and powering the home, another third is due to transport and commutingwith the final third arising from food miles. These CO2 figures for the remaining four scenariocomponents (Built Land does not have a CO2 emission and hence is not included) are shownbelow.
ISSUE Scenario 1 Scenario 2 Scenario 3 Scenario 4TransportWaste & consumptionServicesFood
18.27tonnes/hh/annum(C)
17.88tonnes/hh/annum(C)
16.25tonnes/hh/annum(C)
10.74tonnes/hh/annum(C)
Saving 0.390 (-2%) 2.020 (-11%) 7.530 (-41%)(C) – Figure for CO2 per person calculated by SEI, multiplied by DEFRA figure of 2.33 persons per household
14 Professor Brenda Vale and Dr. Robert Vale are academics at the University of Auckland, where they are both members of theSustainable Design Research Centre, of which Brenda is the Director.

One Planet Living in the Thames GatewayA WWF-UK One Million Sustainable Homes Campaign ReportBioRegional Development Group
Page 50 of 66
Scenario 2 : 200,000 homes in the Thames Gateway
Saves 0.390 tonnes of CO2 per household per year
Saves 78,000 tonnes of CO2 per year for 200,000 homes
Equates to 21,270 tonnes of carbon per year for 200,000 homes
Scenario 3 : 200,000 homes in the Thames Gateway
Saves 2.020 tonnes of CO2 per household per year
Saves 404,000 tonnes of CO2 per year for 200,000 homes
Equates to 110,180 tonnes of carbon per year for 200,000 homes
Scenario 4: 200,000 homes in the Thames Gateway
Saves 7.530 tonnes of CO2 per household per year
Saves 1,506,000 tonnes of CO2 per year for 200,000 homes
Equates to 410,720 tonnes of carbon per year for 200,000 homes
Total Carbon Dioxide emissions
The figures representing total CO2 emissions resulting from the fabric and running demands ofour homes in addition to the emissions due to our lifestyles are shown below. These areindicated in tonnes/person/year, figures for emissions per household are based on occupationrates of 2.33 residents/household. Sub-dividing the impact of our lifestyles into the 9 aspectsshown, enables the calculation of total CO2 emissions and ecological footprint values as well asoffering an insight into the relative importance of each aspect.
ISSUE Scenario1
Scenario 2
Scenario3
Scenario 4
Energy use in thehome 1.312 0.886 -32% 0.886 -32% 0.002 -99%Transport 2.123 1.972 -7% 1.741 -18% 0.551 -74%House Infrastructure 0.306 0.278 -9% 0.278 -9% 0.168 -45%Shared Infrastructure 2.426 2.377 -2% 2.305 -5% 2.183 -10%Waste & consumeritems 1.628 1.613 -1% 1.465 -10% 1.014 -38%Water 0.022 0.013 -40% 0.013 -40% 0.008 -60%Built land - - - - - - -Services 1.397 1.397 -0% 1.213 -13% 1.090 -27%Food 2.692 2.692 -0% 2.557 -5% 1.953 -22%
TOTAL11.91t/CO2/person/annum
11.23t/CO2/person/annum
-6% 10.46t/CO2/person/annum
-12% 6.969t/CO2/person/annum
-41%
SavingoverScenario 1
SavingoverScenario 1
SavingoverScenario 1

One Planet Living in the Thames GatewayA WWF-UK One Million Sustainable Homes Campaign ReportBioRegional Development Group
Page 51 of 66
Chart 9: Total CO2 emissions per resident associated with each of the Scenarios
Scenario 2 : 200,000 homes in the Thames Gateway
Saves 1.584 tonnes of CO2 per household per year
This represents a saving of 6 per cent compared to UK new build figure of 27.74 and 13per cent compared with UK average figures for all homes
Saves 316,880 tonnes of CO2 per year for 200,000 homes
Equates to 86,420 tonnes of carbon per year for 200,000 homes
Scenario 3 : 200,000 homes in the Thames Gateway
Saves 3.379 tonnes of CO2 per household per year
This represents a saving of 12 per cent compared with UK new build figure of 27.74 percent and 19 per cent compared with UK average figures for all homes
Saves 675,700 tonnes of CO2 per year for 200,000 homes
Equates to 184,280 tonnes of carbon per year for 200,000 homes
1 2 3 4
0.00
2.00
4.00
6.00
8.00
10.00
12.00
14.00
Typical UK Build. Reg. 2002 EcoHomes VG EcoHomes VG + Z-squared
Car
bon
diox
ide
emis
sion
s (t/
CO
2/pe
rson
/yr)
SERVICESFOODBUILT LANDWATERWASTE + CONSUMER ITEMSINFRASTRUCTURE (shared)INFRASTRUCTURE (house)TRANSPORTENERGY
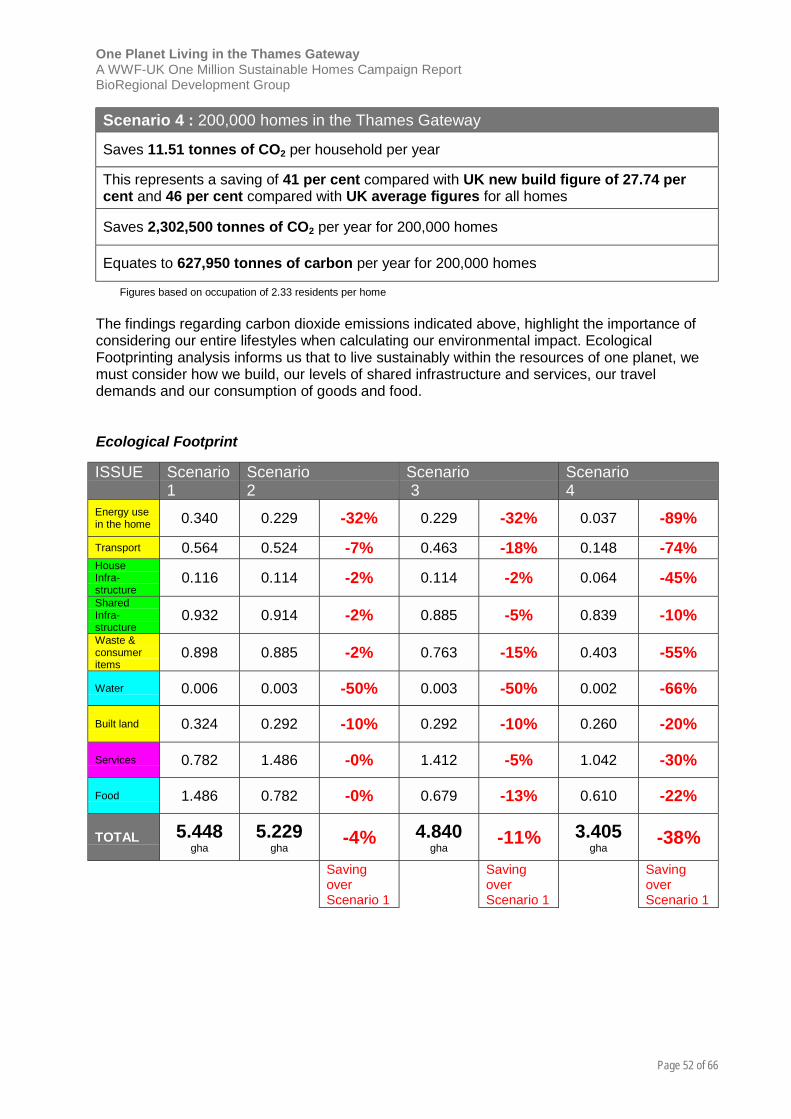
One Planet Living in the Thames GatewayA WWF-UK One Million Sustainable Homes Campaign ReportBioRegional Development Group
Page 52 of 66
Scenario 4 : 200,000 homes in the Thames Gateway
Saves 11.51 tonnes of CO2 per household per year
This represents a saving of 41 per cent compared with UK new build figure of 27.74 percent and 46 per cent compared with UK average figures for all homes
Saves 2,302,500 tonnes of CO2 per year for 200,000 homes
Equates to 627,950 tonnes of carbon per year for 200,000 homes
Figures based on occupation of 2.33 residents per home
The findings regarding carbon dioxide emissions indicated above, highlight the importance ofconsidering our entire lifestyles when calculating our environmental impact. EcologicalFootprinting analysis informs us that to live sustainably within the resources of one planet, wemust consider how we build, our levels of shared infrastructure and services, our traveldemands and our consumption of goods and food.
Ecological Footprint
ISSUE Scenario1
Scenario2
Scenario 3
Scenario4
Energy usein the home 0.340 0.229 -32% 0.229 -32% 0.037 -89%Transport 0.564 0.524 -7% 0.463 -18% 0.148 -74%HouseInfra-structure
0.116 0.114 -2% 0.114 -2% 0.064 -45%SharedInfra-structure
0.932 0.914 -2% 0.885 -5% 0.839 -10%Waste &consumeritems
0.898 0.885 -2% 0.763 -15% 0.403 -55%
Water 0.006 0.003 -50% 0.003 -50% 0.002 -66%
Built land 0.324 0.292 -10% 0.292 -10% 0.260 -20%
Services 0.782 1.486 -0% 1.412 -5% 1.042 -30%
Food 1.486 0.782 -0% 0.679 -13% 0.610 -22%
TOTAL 5.448gha
5.229gha
-4% 4.840gha
-11% 3.405gha
-38%SavingoverScenario 1
SavingoverScenario 1
SavingoverScenario 1
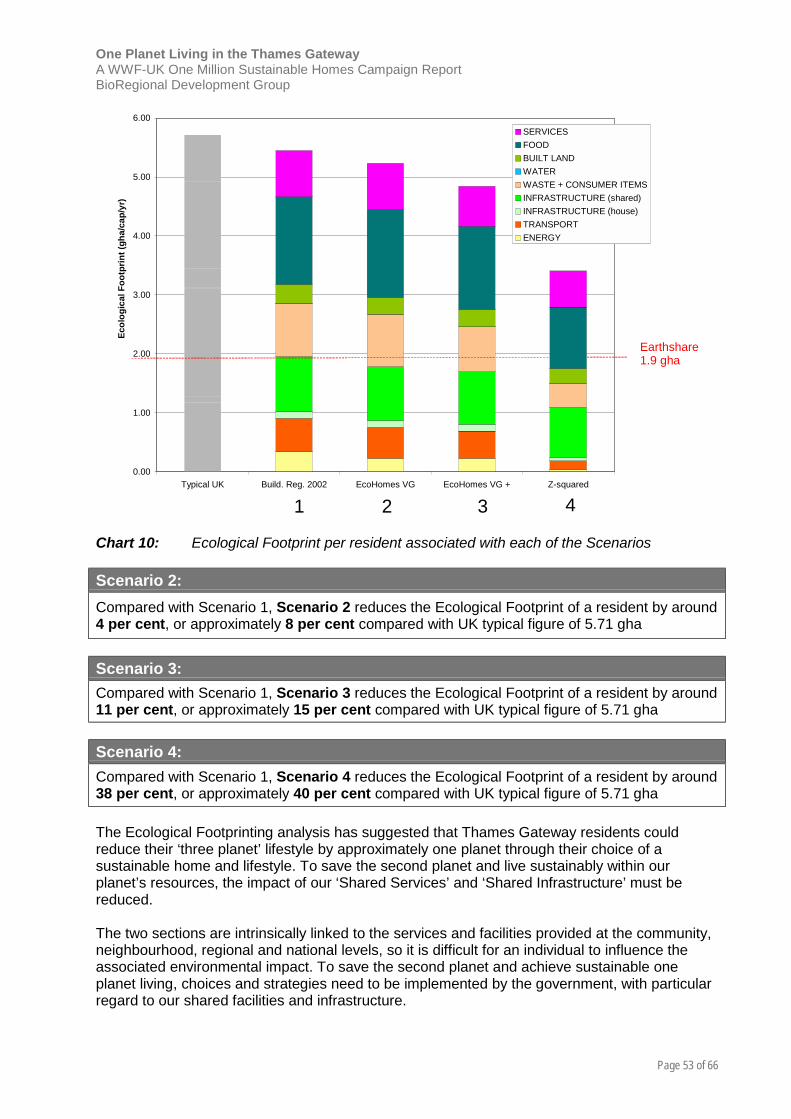
One Planet Living in the Thames GatewayA WWF-UK One Million Sustainable Homes Campaign ReportBioRegional Development Group
Page 53 of 66
Chart 10: Ecological Footprint per resident associated with each of the Scenarios
Scenario 2:Compared with Scenario 1, Scenario 2 reduces the Ecological Footprint of a resident by around4 per cent, or approximately 8 per cent compared with UK typical figure of 5.71 gha
Scenario 3:Compared with Scenario 1, Scenario 3 reduces the Ecological Footprint of a resident by around11 per cent, or approximately 15 per cent compared with UK typical figure of 5.71 gha
Scenario 4:Compared with Scenario 1, Scenario 4 reduces the Ecological Footprint of a resident by around38 per cent, or approximately 40 per cent compared with UK typical figure of 5.71 gha
The Ecological Footprinting analysis has suggested that Thames Gateway residents couldreduce their ‘three planet’ lifestyle by approximately one planet through their choice of asustainable home and lifestyle. To save the second planet and live sustainably within ourplanet’s resources, the impact of our ‘Shared Services’ and ‘Shared Infrastructure’ must bereduced.
The two sections are intrinsically linked to the services and facilities provided at the community,neighbourhood, regional and national levels, so it is difficult for an individual to influence theassociated environmental impact. To save the second planet and achieve sustainable oneplanet living, choices and strategies need to be implemented by the government, with particularregard to our shared facilities and infrastructure.
0.00
1.00
2.00
3.00
4.00
5.00
6.00
Typical UK Build. Reg. 2002 EcoHomes VG EcoHomes VG + Z-squared
Ecol
ogic
al F
ootp
rint (
gha/
cap/
yr)
SERVICESFOODBUILT LANDWATERWASTE + CONSUMER ITEMSINFRASTRUCTURE (shared)INFRASTRUCTURE (house)TRANSPORTENERGY
Earthshare1.9 gha
2 31 4
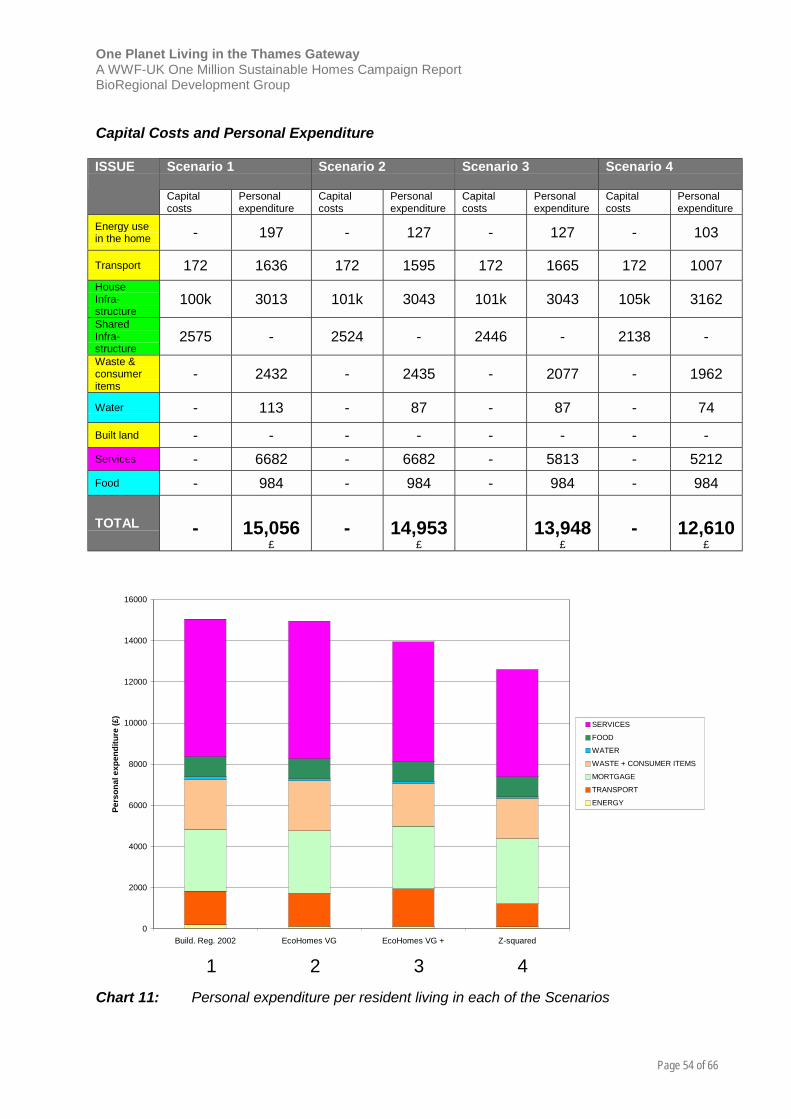
One Planet Living in the Thames GatewayA WWF-UK One Million Sustainable Homes Campaign ReportBioRegional Development Group
Page 54 of 66
Capital Costs and Personal Expenditure
Scenario 1 Scenario 2 Scenario 3 Scenario 4ISSUE
Capitalcosts
Personalexpenditure
Capitalcosts
Personalexpenditure
Capitalcosts
Personalexpenditure
Capitalcosts
Personalexpenditure
Energy usein the home - 197 - 127 - 127 - 103
Transport 172 1636 172 1595 172 1665 172 1007HouseInfra-structure
100k 3013 101k 3043 101k 3043 105k 3162SharedInfra-structure
2575 - 2524 - 2446 - 2138 -Waste &consumeritems
- 2432 - 2435 - 2077 - 1962
Water - 113 - 87 - 87 - 74
Built land - - - - - - - -Services - 6682 - 6682 - 5813 - 5212Food - 984 - 984 - 984 - 984
TOTAL - 15,056£
- 14,953£
13,948£
- 12,610£
Chart 11: Personal expenditure per resident living in each of the Scenarios
4
0
2000
4000
6000
8000
10000
12000
14000
16000
Build. Reg. 2002 EcoHomes VG EcoHomes VG + Z-squared
Pers
onal
exp
endi
ture
(£)
SERVICES
FOOD
WATER
WASTE + CONSUMER ITEMS
MORTGAGE
TRANSPORT
ENERGY
2 31
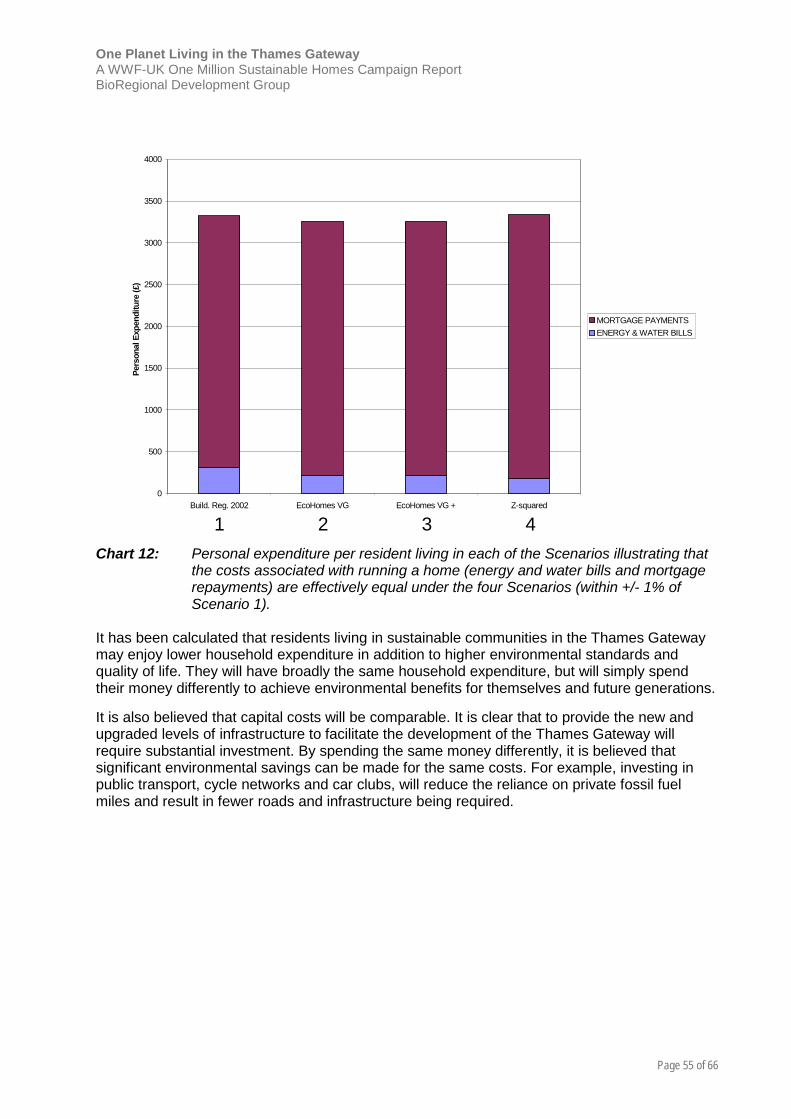
One Planet Living in the Thames GatewayA WWF-UK One Million Sustainable Homes Campaign ReportBioRegional Development Group
Page 55 of 66
Chart 12: Personal expenditure per resident living in each of the Scenarios illustrating thatthe costs associated with running a home (energy and water bills and mortgagerepayments) are effectively equal under the four Scenarios (within +/- 1% ofScenario 1).
It has been calculated that residents living in sustainable communities in the Thames Gatewaymay enjoy lower household expenditure in addition to higher environmental standards andquality of life. They will have broadly the same household expenditure, but will simply spendtheir money differently to achieve environmental benefits for themselves and future generations.
It is also believed that capital costs will be comparable. It is clear that to provide the new andupgraded levels of infrastructure to facilitate the development of the Thames Gateway willrequire substantial investment. By spending the same money differently, it is believed thatsignificant environmental savings can be made for the same costs. For example, investing inpublic transport, cycle networks and car clubs, will reduce the reliance on private fossil fuelmiles and result in fewer roads and infrastructure being required.
2 31 4
0
500
1000
1500
2000
2500
3000
3500
4000
Build. Reg. 2002 EcoHomes VG EcoHomes VG + Z-squared
Pers
onal
Exp
endi
ture
(£)
MORTGAGE PAYMENTSENERGY & WATER BILLS
One Planet Living in the Thames GatewayA WWF-UK One Million Sustainable Homes Campaign ReportBioRegional Development Group
Page 56 of 66
Conclusions
This study has investigated the implications of building the planned 200,000 new homes in theThames Gateway to four different environmental standards:
Scenario 1 Current Building Regulations with ‘average’ UK residents;Scenario 2 Building Research Establishment’s (BRE) EcoHomes ‘Very Good’ standard
with ‘average’ UK residents;Scenario 3 BRE’s EcoHomes ‘Very Good’ standard with environmentally aware
residents; andScenario 4 ‘Z2’ standard (Zero fossil Energy, Zero Waste) with environmentally aware
residents.
The environmental impacts of the various scenarios have been measured in terms of specificissues such as carbon dioxide emissions, water use and waste, as well as in terms of overallecological footprint. The study has also assessed the impacts on the costs of house buildingand associated infrastructure and household expenditure of the four different scenarios.
Environmental Impacts
The research undertaken in this study has shown that significant environmental savings can bemade through developing sustainable homes and communities which enable residents to livesustainable lifestyles.
The following figures are compared to Scenario 1, which estimates the impacts of homesdeveloped to current Building Regulations. (It is important to remember that current BuildingRegulations represent much higher standards in terms of energy efficiency than most existingUK housing.)
Scenarios 2 and 3: EcoHomes Very Good
The study has shown that by developing 200,000 new homes in Thames Gateway to aminimum of BRE’s EcoHomes ‘Very Good’ standard, significant savings could be made perhome per year:
• a 32 per cent reduction in CO2 emissions from energy use in the home;• a 39 per cent reduction in water use;• a 4 per cent reduction in the amount of household waste sent to landfill for Scenario 2;
and• a 25 per cent reduction in the amount of household waste sent to landfill for Scenario 3.
The study has assumed that the carbon dioxide emissions resulting from energy use in thehome and the amount of water used will remain about the same for both Scenario 2 and 3 (i.e.regardless of the kind of resident living in the home). This is because these homes are designedfor efficiency, and therefore facilitate efficient use of energy and water.
This figure for carbon dioxide reduction per home can be used to estimate the potential CO2savings of developing 200,000 homes in the Thames Gateway to EcoHomes ‘Very Good’standard compared with current Building Regulations. The saving of 0.993 tonnes ofCO2/home/year, equates to 198,840 tonnes of CO2 or 54,220 tonnes of carbon for the 200,000homes.
One Planet Living in the Thames GatewayA WWF-UK One Million Sustainable Homes Campaign ReportBioRegional Development Group
Page 57 of 66
Scenario 4: Z2
The study illustrates that if all new homes in the Thames Gateway were built to ‘Z2’ standards,the savings per home per year could be:
• a 99 per cent reduction in CO2 emissions from energy use in the home;• a 65 per cent reduction in water use; and• a 76 per cent reduction in the amount of household waste sent to landfill.
Building the 200,000 homes in the Thames Gateway to Z2 standards saves an estimated 3.052tonnes of CO2/home/year compared with dwellings built to current Building Regulations. Thisequates to 610,640 tonnes of CO2 or 166,540 tonnes of carbon for the 200,000 homes.
However, the carbon dioxide emissions resulting from powering and heating our homesaccounts for only part of the total emissions attributable to our lifestyles. The carbon dioxideemissions associated with the transport of people and goods, the energy embodied in ourconstruction materials, consumer goods and our food, and how we deal with our waste, shouldall be considered in order to assess our full ‘carbon footprint’.
This study demonstrates that for a typical UK citizen living in an average UK home, the carbondioxide emission levels associated with their food and those associated with their transportdemands are both comparable to the amount of CO2 attributable to energy use in the home.
In the study, the total carbon dioxide emissions associated with our lifestyles have beencalculated for each of the scenarios. This includes the energy used in our homes, fortransporting ourselves and our goods, the farming, packaging and delivery of our food and thedisposal of our waste. Also considered are the CO2
emissions arising from the energy embodiedin the materials used to build our homes and infrastructure. These figures provide acomprehensive picture of the full carbon footprint of residents in the different scenarios.
The total carbon dioxide emissions reduction attributable to the lifestyle described in scenario 2would save 316,880 tonnes of CO2 per year if applied to the 200,000 homes in the ThamesGateway (based on 2.33 residents per household). This equates to 86,420 tonnes of carbon.
A resident occupying an EcoHomes ‘Very Good’ home who had made lifestyle choices toreduce their environmental impact (Scenario 3), could increase their total CO2 savings, witheach of the 200,000 homes saving 3.379 tonnes of CO2 per year(based on 2.33 residents perhousehold), totalling 675,700 tonnes of CO2 per year for the Thames Gateway. This equates to184,280 tonnes of carbon.
Scenario 4 is based on a resident living in a very efficient home as part of a compactsustainable community which enables them to make lifestyle choices to minimise their impacton the environment. Total savings across the 200,000 Thames Gateway homes (based on 2.33residents per household) would be 2,302,500 tonnes of CO2 per year. This equates to 627,950tonnes of carbon.
Cost of Homes and Infrastructure
The study demonstrates that in terms of infrastructure capital costs and personal expenditurerelated to the purchase and running of a home, the cost of developing 200,000 homes toEcoHomes ‘Very Good’ and Z2 standards would be comparable to developing to current
One Planet Living in the Thames GatewayA WWF-UK One Million Sustainable Homes Campaign ReportBioRegional Development Group
Page 58 of 66
Building Regulations. This is because any additional build costs for Scenarios 2, 3 and 4 couldbe offset by savings in other areas. The additional build costs are estimated to be:
• 2 per cent for EcoHomes• 10 per cent for Z2
Half of these additional costs could be offset by planning gain (this is a mechanism under whicha developer is permitted to increase development by the local authority in exchange for meetingagreed environmental targets.) The other half could be paid for by consumers through slightlyhigher cost homes. However, the increased mortgage repayments would be compensated forby the savings resulting from lower utility bills. If the household expenditure estimates arebroadened to include transport, waste and the purchase of consumer goods, the averagepersonal expenditure (on the elements considered in this study) per annum for residents livingin the 4 scenarios will be:
• Scenario 1 £ 15,056• Scenario 2 £ 14,953• Scenario 3 £ 13,948• Scenario 4 £ 12,620
In other words, the findings indicate that increased spending on public transport and mortgagecosts are offset by the savings returned from lower energy and water bills, and not keeping acar on the road. This suggests that sustainable living in the Thames Gateway would result inlower household expenditure for residents in addition to the environmental benefits.
The study suggests that the infrastructure costs for all four scenarios would be comparable. Thegovernment already recognises that it must provide the necessary investment to facilitate thedevelopment of the Thames Gateway. Taking into account private sector expenditure, this studyestimates that public sector investment of approximately £1.2 billion per annum for 20 years willbe necessary for the development of 200,000 homes in the Thames Gateway, includinginfrastructure costs such as transport and flood prevention. Based on the estimated reducedinfrastructure materials needed for Scenarios 2, 3 and 4, this study suggests that theinfrastructure costs could in fact be less than for Scenario 1:
• Scenario 2 suggests a 2 per cent reduction;• Scenario 3 suggests a 5 per cent reduction; and• Scenario 4 suggests a 10 per cent reduction.
The aim of this study is not primarily to demonstrate how the government could make savings inits expenditure on developing Thames Gateway (although this may indeed prove to be thecase), but to illustrate how environmental and social benefits and government sustainabledevelopment targets could be met using the same budget. Provision of the new and upgradedlevels of infrastructure to facilitate the development of the Thames Gateway will requiresubstantial investment, but by spending the money differently, it is believed that significantenvironmental savings can be made for the same capital costs. For example, investing in publictransport, cycle networks and car clubs will reduce the reliance on private fossil fuel miles andresult in fewer roads being required.
Ecological footprint
Ecological footprinting (EF) is a comprehensive methodology which considers the environmentalimpact of our lifestyles. It informs us that the average UK citizen is currently significantly
One Planet Living in the Thames GatewayA WWF-UK One Million Sustainable Homes Campaign ReportBioRegional Development Group
Page 59 of 66
exceeding their fair share of the Earth’s resources. In fact, if everyone on the planet were to liveas UK citizens currently do, we would need three planets to support us!
This study demonstrates that even with significant savings in terms of carbon dioxide, water useand waste in Scenarios 2 and 3, the overall savings in terms of an individual’s ecologicalfootprint when compared with Scenario 1 are limited:
• 4 per cent for Scenario 2 (or 8 per cent compared with UK average)• 11 per cent for Scenario 3 (15 per cent compared with UK average)
This is because the ecological footprinting methodology considers a comprehensive range ofthe impacts associated with an individual’s lifestyle, from the food miles they create bypurchasing imported food to the energy needed to dispose of their waste. This study has shownthat a considerable component of an individual’s ecological footprint is attributable to their shareof infrastructure and services. These are beyond the scope of the EcoHomes standard.
The figures in Scenario 4 show that an individual can reduce his/her footprint by 38 per cent(or 40 per cent compared with UK average). This is because Scenario 4 facilitates moresustainable lifestyle decisions, (e.g. by providing car clubs to minimise personal car use, and byenabling deliveries of locally produced organic food). This study shows that while Scenario 4goes a long way in reducing an individual’s ecological footprint, it would still not be enough toenable an individual to live a truly ‘one planet’ lifestyle.
Living on One Planet
If the ecological footprints of residents in each of the four scenarios are compared to an averageUK citizen, the relative importance of each of the nine contributory lifestyle elements can beseen. It is clear (particularly in Scenario 4) that there are four components which make up themajority of our ecological footprints: food, waste, services and shared infrastructure. Developingstrategies to tackle the environmental impact associated with these would represent a big stepon the route to truly sustainable living.
As discussed in the main body of this report, our Food EF is a product of the physical arearequired to grow the food, the energy required to grow (excluding free energy from the sun),harvest, process and transport it. The energy associated with any fertilisers used is also addedwhereas the EF of the packaging is considered under the ‘Materials and Waste’ section. Meatand dairy products have a high EF because of the cumulative effects of the EF due to raisingand farming the animal in addition to the EF of the food it eats.
The data-set for scenario 4 assumes that a resident enjoys a low meat and low dairy diet withincreased amounts of fresh fruit and vegetables, as well as eating mostly local and organicproduce. A resident who chooses to become a vegan or low dairy vegetarian and source thevast majority of food locally or grow food themselves (in individual or neighbourhood plots) couldreduce their EF further.
The waste and materials strategy developed for scenario 4 is based on a consumption ratereduction of 25 per cent (and an equivalent waste output saving). Of the waste produced,25 per cent is recycled, 25 per cent is composted, 25 per cent is converted cleanly to energyand 25 per cent is sent to landfill. It is anticipated that any further EF savings could be achievedby a combination of reducing the amount of domestic waste produced and increasing theamount recycled and minimising the amount landfilled. To facilitate this, it is believed that thegovernment would need to provide incentives to individuals and industry.
One Planet Living in the Thames GatewayA WWF-UK One Million Sustainable Homes Campaign ReportBioRegional Development Group
Page 60 of 66
The remaining two sections, ‘Shared Services’ and ‘Shared Infrastructure’, are both intrinsicallylinked to the services and facilities provided at the community, neighbourhood, regional andnational levels. The EF of these two sections makes up more than 40 per cent of the total EF forscenario 4, but it is difficult for an individual to influence the associated environmental impact.
Under scenario 4, some of these shared aspects are addressed as part of the Z2- zero fossilenergy, zero waste community. For example, it has been assumed that the compact urban formwould deliver shared infrastructure savings and that reduced demand for consumer goodswould translate into some savings with regards to the retail sector. The EF and CO2 figures havebeen calculated accordingly using informed estimates, but it is clear that more research isrequired to clarify the extent of reductions achievable.
It is also apparent from this report that an individual resident living in any of the scenarios islimited in the scope of the environmental savings they can realise through their choice of homeand lifestyle alone. It would be reasonable to state that an environmentally-aware Z2 residentcould reduce their environmental impact by one planet from the UK’s three-planet to a two-planet level.
It is evident that construction standards play a significant role in reducing environmentalimpacts, and that individuals can make very significant contributions to reducing their impactthrough the lifestyle choices they make. However, the study also demonstrates the vitalimportance of shared infrastructure and services. The ecological footprinting analysis suggeststhat a UK resident can reduce their ‘three planet lifestyle’ by approximately one planet throughliving in a Z2 home and through their lifestyle choices. To save the second planet and live withinour fair share of the Earth’s resources, we must also reduce the impact of our sharedinfrastructure and services.
Next Steps
If the government wishes to meet its own sustainable development targets and realise theaspirations set out in the Sustainable Communities Plan, it must set minimum sustainableconstruction standards and create the necessary infrastructure and services to enable peopleto live within their fair share of the Earth’s resources. Provision of the new and upgraded levelsof infrastructure to facilitate development in the Thames Gateway will require substantialinvestment. By spending this money differently, significant environmental savings could bemade for the same costs.
Key decisions about the Thames Gateway and the other growth areas will be made before thereforms of the planning and building regulations are implemented. In the absence of a reformedregulatory framework, WWF believes the government must intervene to ensure thatdevelopment throughout the Thames Gateway and the other growth areas meets the highestpossible sustainable development standards. New communities should be developed to Z2
standards to enable residents to live sustainably and achieve ‘one planet living’. As an absoluteminimum, the government should require that homes be built to the highest BRE EcoHomesstandards of ‘Very Good’ or ‘Excellent’.
If the government is serious about ensuring that new communities are truly sustainable andabout meeting its other sustainable development targets, it must take a lead. To enable us tolive sustainably within the resources of one planet, the government must tackle constructionstandards and how it provides shared infrastructure and services, and we must tackle our traveldemands and our individual consumption of goods and food.

One Planet Living in the Thames GatewayA WWF-UK One Million Sustainable Homes Campaign ReportBioRegional Development Group
Page 61 of 66
Appendix 1: The health benefits of a compact environmentallyfriendly city
Dr Robin Stott. 05.05.03
Good health is based on a number of well recognised determinants, most of which are affectedby the built environment. These determinants have been grouped together as social,environmental and economic. For the best possible individual and societal health all thedeterminants have to be in place. A society in which these determinants are in place would besuffused with social, environmental and economic justice, and so would not only be healthy, butsustainable.
A compact, eco-friendly city as defined in the Z2 Scenario can beneficially impact on manydeterminants. We discuss these under three headings:
1. direct benefit to individual inhabitants;2. indirect benefit to individual inhabitants; and3. benefit to the wider and global community.
Direct benefits
a) Exercise. The reliance in a compact city on bicycles, walking and public transport willincrease exercise levels. This will improve people’s present health, and also on average giveindividuals years of healthy added life. A good comparator is Amsterdam, where 25 per centof all journeys are by bicycle, and levels of obesity are much lower than in London.
b) Enhanced sense of community. The public spaces in compact cities will be peoplefriendly, and the increase in walking and bicycling will increase the street life. Contactbetween individuals in a community is helpful in increasing trust and promoting goodneighbourly behaviour. These are important in the nurturing of social capital, in its turnbeneficial to health.
c) Reduction in ambient noise and dislocation of community. Motor cars are noisy, andstreets dominated by motor traffic are disruptive to interactions between neighbours. Thenumber of neighbourly contacts is inversely related to traffic density. The reduction in trafficwill help enhance the sense of community. There would also be a reduction in trafficaccidents, a major cause of death in many ‘traditional ‘neighbourhoods.
d) Availability of locally produced, organically grown food, and elimination of food deserts
Indirect benefits
a) Reduction in respiratory disease consistent with a fall in the level of air pollution.Respiratory diseases, including provocation of attacks of asthma, are more prevalent whenair pollution levels are high. There are 20,000 deaths each year in the UK attributable to airpollution. Reducing levels will contribute to a reduction in these deaths.
b) The enhanced sense of trust which comes with interactive communities diminishes theperception of dangerous streets because of antisocial behaviour and crime. Anxieties aboutthe danger people face on streets is an oft-cited cause of ill health.
c) Elimination of fuel poverty would be a part of all the scenarios, but in the compact city thiswould be accompanied by a lowering of CO2 production, and thus link the social andeconomic benefits of relief of fuel poverty with the environmental benefits of CO2 reduction.Networked CHP plants could be a feature of any of the scenarios. A fuel poor household is
One Planet Living in the Thames GatewayA WWF-UK One Million Sustainable Homes Campaign ReportBioRegional Development Group
Page 62 of 66
defined as one which cannot sustain reasonable health (21°C in the living room, 18°C in therest of the house) at a reasonable cost (< 10 per cent of income). In 1999 there were 4.5million fuel poor homes in the UK, 50 per cent of which housed people over 60 years and 20per cent of which housed children. There are estimated to be 20-50,000 excess deaths inthe UK between December and March each year, and a significant proportion of these relateto fuel poverty. Respiratory disease, heart disease, domestic accidents, problems ofimmobility and social isolation are all contributory causes.
d) Compact environmentally-friendly communities are an example of a virtuous cycle ofactivity, in which social, economic and environmental determinants of health are promotedin synergy. These virtuous cycles are important, as in conventional cities, the wax of one setof determinants may be the wane of others, a situation which cannot in the medium and longterm sustain health.
e) Benefits of exemplary public buildings. Health premises and other public servicebuildings which encouraged local employment, sustained local production and consumptioncycles, and were zero emission buildings would not only provide the relevant public service,but act as inspirational models for the rest of the community.
f) Local production and consumption cycles, while not impossible in conventional cities,will be facilitated by compact cities. Many such cycles of consumption create virtuous cyclesof activity which are of crucial importance in promoting health and sustainability. Localproduction of organic food is an example of such a virtuous cycle. Organic food grown inallotments and roof or other gardens produces readily available fresh food, reducespesticide residues in food, reduces food miles, supports local traders, and gives employmentto local people.
g) Compact cities will thus in many ways promote a greater sense of community and agreater degree of control over one’s own destiny. This is likely to increase theparticipation level of citizens in all aspects of their lives. Such participation is the bedrock ofsustainability and health.
Global benefits
The footprint of compact, eco-friendly cities will be substantially lower than the norm, and willcontribute to the amelioration of climate change. Climate change is associated with manyadverse health consequences, although most of these relate to people living in the poorer areasof the world. Samples of these are:a) The rise in sea levels will lead to the flooding of many densely populated areas, such as the
Delta of the Brahmaputra in Bangladesh. This will have devastating consequences for thehealth and wellbeing of the population.
b) The warming of present temperate climates will lead to the spread of vectors of manydiseases, including malaria. There are 500 million cases of malaria each year, with a milliondeaths. Young children and pregnant mothers are most affected, and every 30 seconds achild dies of malaria. Each episode causes an average 12 days loss of productive work, andas malaria is most common in the agricultural season, this is doubly incapacitating. It isestimated that malaria destroys 35 million years of productive human life each year. Climatechange is one significant cause of the re-emergence and spread of malaria.
c) Climate change is predicted to increase the extremes of weather worldwide, so droughts,hurricanes and other 'natural’ disasters will become more common. The resultant disruptionof agriculture in many marginal areas of the world will lead to starvation and social unrestand mass migration in these areas.

One Planet Living in the Thames GatewayA WWF-UK One Million Sustainable Homes Campaign ReportBioRegional Development Group
Page 63 of 66
The organisation Global Environmental Change estimates that climate change will causelosses of up to 10 million tonnes of maize, affecting more than140 million people in thedeveloping world. There are already one billion people living at starvation level and this lossof the staple diet of sub-Saharan Africa will seriously exacerbate this problem.Starvation, through reduction in both total calories and essential nutrients such as iron,causes many disease syndromes and chronic ill health, as well as leading to prematuredeath. Children and pregnant mothers are always worst affected. For instance, in Bihar(India) 60 per cent of pregnant women have significant Iron Deficiency Anaemia.
Clearly, even a large eco-friendly city will only have a small impact on these global problems,but it will be exemplary, and thousands of compact eco-friendly cities will make a substantialdifference.
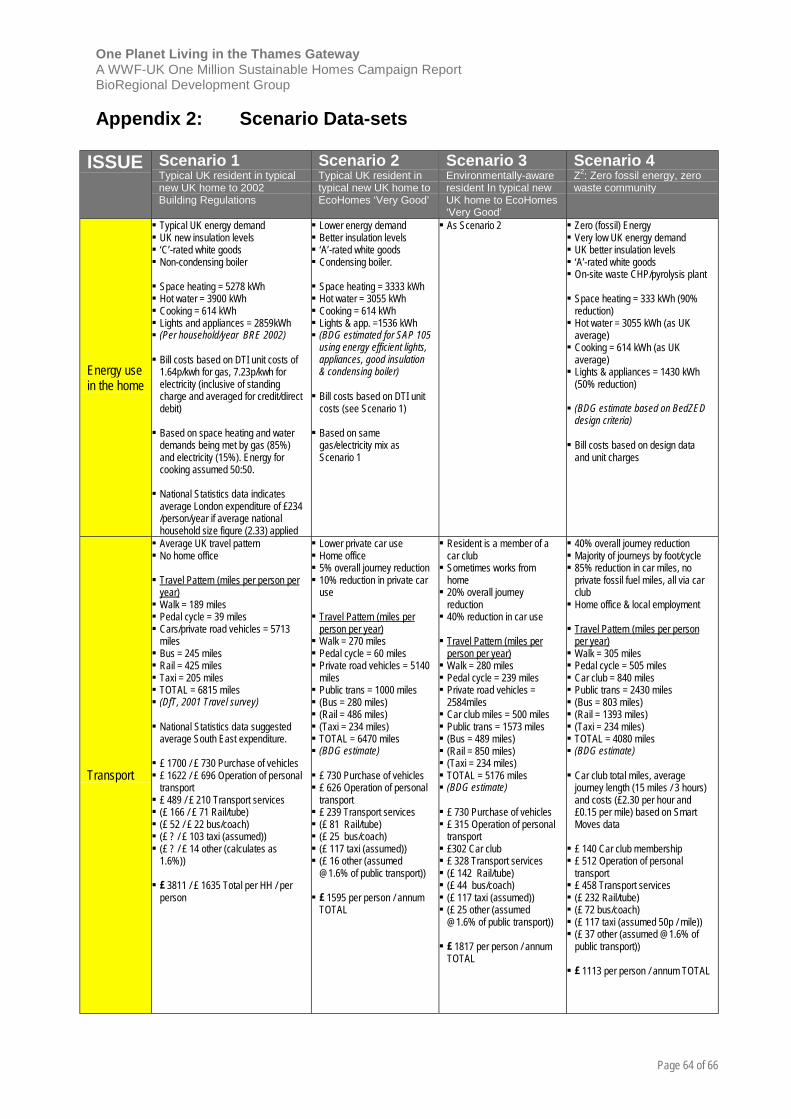
One Planet Living in the Thames GatewayA WWF-UK One Million Sustainable Homes Campaign ReportBioRegional Development Group
Page 64 of 66
Appendix 2: Scenario Data-sets
ISSUE Scenario 1Typical UK resident in typicalnew UK home to 2002Building Regulations
Scenario 2Typical UK resident intypical new UK home toEcoHomes ‘Very Good’
Scenario 3Environmentally-awareresident In typical newUK home to EcoHomes‘Very Good’
Scenario 4Z2: Zero fossil energy, zerowaste community
Energy usein the home
! Typical UK energy demand! UK new insulation levels! ‘C’-rated white goods! Non-condensing boiler
! Space heating = 5278 kWh! Hot water = 3900 kWh! Cooking = 614 kWh! Lights and appliances = 2859kWh! (Per household/year BRE 2002)
! Bill costs based on DTI unit costs of1.64p/kwh for gas, 7.23p/kwh forelectricity (inclusive of standingcharge and averaged for credit/directdebit)
! Based on space heating and waterdemands being met by gas (85%)and electricity (15%). Energy forcooking assumed 50:50.
! National Statistics data indicatesaverage London expenditure of £234/person/year if average nationalhousehold size figure (2.33) applied
! Lower energy demand! Better insulation levels! ‘A’-rated white goods! Condensing boiler.
! Space heating = 3333 kWh! Hot water = 3055 kWh! Cooking = 614 kWh! Lights & app. =1536 kWh! (BDG estimated for SAP 105
using energy efficient lights,appliances, good insulation& condensing boiler)
! Bill costs based on DTI unitcosts (see Scenario 1)
! Based on samegas/electricity mix asScenario 1
! As Scenario 2 ! Zero (fossil) Energy! Very low UK energy demand! UK better insulation levels! ‘A’-rated white goods! On-site waste CHP/pyrolysis plant
! Space heating = 333 kWh (90%reduction)
! Hot water = 3055 kWh (as UKaverage)
! Cooking = 614 kWh (as UKaverage)
! Lights & appliances = 1430 kWh(50% reduction)
! (BDG estimate based on BedZEDdesign criteria)
! Bill costs based on design dataand unit charges
Transport
! Average UK travel pattern! No home office
! Travel Pattern (miles per person peryear)
! Walk = 189 miles! Pedal cycle = 39 miles! Cars/private road vehicles = 5713
miles! Bus = 245 miles! Rail = 425 miles! Taxi = 205 miles! TOTAL = 6815 miles! (DfT, 2001 Travel survey)
! National Statistics data suggestedaverage South East expenditure.
! £ 1700 / £ 730 Purchase of vehicles! £ 1622 / £ 696 Operation of personal
transport! £ 489 / £ 210 Transport services! (£ 166 / £ 71 Rail/tube)! (£ 52 / £ 22 bus/coach)! (£ ? / £ 103 taxi (assumed))! (£ ? / £ 14 other (calculates as
1.6%))
! £ 3811 / £ 1635 Total per HH / perperson
! Lower private car use! Home office! 5% overall journey reduction! 10% reduction in private car
use
! Travel Pattern (miles perperson per year)
! Walk = 270 miles! Pedal cycle = 60 miles! Private road vehicles = 5140
miles! Public trans = 1000 miles! (Bus = 280 miles)! (Rail = 486 miles)! (Taxi = 234 miles)! TOTAL = 6470 miles! (BDG estimate)
! £ 730 Purchase of vehicles! £ 626 Operation of personal
transport! £ 239 Transport services! (£ 81 Rail/tube)! (£ 25 bus/coach)! (£ 117 taxi (assumed))! (£ 16 other (assumed
@1.6% of public transport))
! £ 1595 per person / annumTOTAL
! Resident is a member of acar club
! Sometimes works fromhome
! 20% overall journeyreduction
! 40% reduction in car use
! Travel Pattern (miles perperson per year)
! Walk = 280 miles! Pedal cycle = 239 miles! Private road vehicles =
2584miles! Car club miles = 500 miles! Public trans = 1573 miles! (Bus = 489 miles)! (Rail = 850 miles)! (Taxi = 234 miles)! TOTAL = 5176 miles! (BDG estimate)
! £ 730 Purchase of vehicles! £ 315 Operation of personal
transport! £302 Car club! £ 328 Transport services! (£ 142 Rail/tube)! (£ 44 bus/coach)! (£ 117 taxi (assumed))! (£ 25 other (assumed
@1.6% of public transport))
! £ 1817 per person / annumTOTAL
! 40% overall journey reduction! Majority of journeys by foot/cycle! 85% reduction in car miles, no
private fossil fuel miles, all via carclub
! Home office & local employment
! Travel Pattern (miles per personper year)
! Walk = 305 miles! Pedal cycle = 505 miles! Car club = 840 miles! Public trans = 2430 miles! (Bus = 803 miles)! (Rail = 1393 miles)! (Taxi = 234 miles)! TOTAL = 4080 miles! (BDG estimate)
! Car club total miles, averagejourney length (15 miles / 3 hours)and costs (£2.30 per hour and£0.15 per mile) based on SmartMoves data
! £ 140 Car club membership! £ 512 Operation of personal
transport! £ 458 Transport services! (£ 232 Rail/tube)! (£ 72 bus/coach)! (£ 117 taxi (assumed 50p / mile))! (£ 37 other (assumed @1.6% of
public transport))
! £ 1113 per person / annum TOTAL
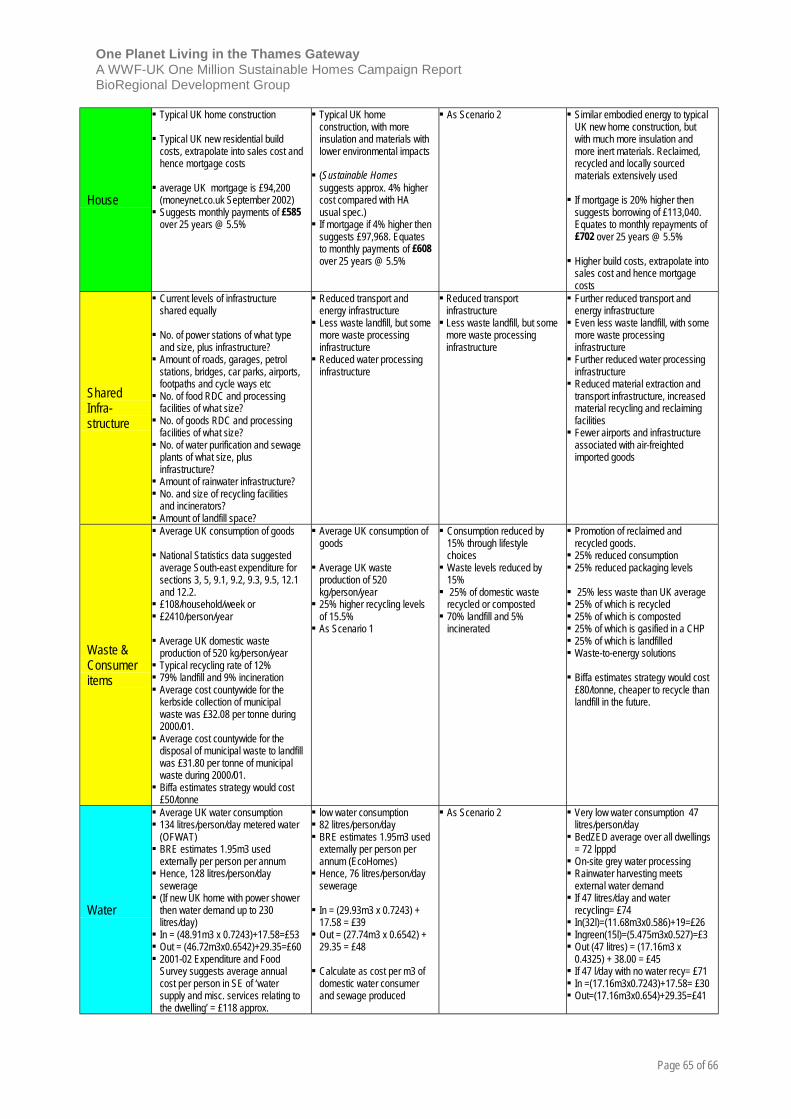
One Planet Living in the Thames GatewayA WWF-UK One Million Sustainable Homes Campaign ReportBioRegional Development Group
Page 65 of 66
House
! Typical UK home construction
! Typical UK new residential buildcosts, extrapolate into sales cost andhence mortgage costs
! average UK mortgage is £94,200(moneynet.co.uk September 2002)
! Suggests monthly payments of £585over 25 years @ 5.5%
! Typical UK homeconstruction, with moreinsulation and materials withlower environmental impacts
! (Sustainable Homessuggests approx. 4% highercost compared with HAusual spec.)
! If mortgage if 4% higher thensuggests £97,968. Equatesto monthly payments of £608over 25 years @ 5.5%
! As Scenario 2 ! Similar embodied energy to typicalUK new home construction, butwith much more insulation andmore inert materials. Reclaimed,recycled and locally sourcedmaterials extensively used
! If mortgage is 20% higher thensuggests borrowing of £113,040.Equates to monthly repayments of£702 over 25 years @ 5.5%
! Higher build costs, extrapolate intosales cost and hence mortgagecosts
SharedInfra-structure
! Current levels of infrastructureshared equally
! No. of power stations of what typeand size, plus infrastructure?
! Amount of roads, garages, petrolstations, bridges, car parks, airports,footpaths and cycle ways etc
! No. of food RDC and processingfacilities of what size?
! No. of goods RDC and processingfacilities of what size?
! No. of water purification and sewageplants of what size, plusinfrastructure?
! Amount of rainwater infrastructure?! No. and size of recycling facilities
and incinerators?! Amount of landfill space?
! Reduced transport andenergy infrastructure
! Less waste landfill, but somemore waste processinginfrastructure
! Reduced water processinginfrastructure
! Reduced transportinfrastructure
! Less waste landfill, but somemore waste processinginfrastructure
! Further reduced transport andenergy infrastructure
! Even less waste landfill, with somemore waste processinginfrastructure
! Further reduced water processinginfrastructure
! Reduced material extraction andtransport infrastructure, increasedmaterial recycling and reclaimingfacilities
! Fewer airports and infrastructureassociated with air-freightedimported goods
Waste &Consumeritems
! Average UK consumption of goods
! National Statistics data suggestedaverage South-east expenditure forsections 3, 5, 9.1, 9.2, 9.3, 9.5, 12.1and 12.2.
! £108/household/week or! £2410/person/year
! Average UK domestic wasteproduction of 520 kg/person/year
! Typical recycling rate of 12%! 79% landfill and 9% incineration! Average cost countywide for the
kerbside collection of municipalwaste was £32.08 per tonne during2000/01.
! Average cost countywide for thedisposal of municipal waste to landfillwas £31.80 per tonne of municipalwaste during 2000/01.
! Biffa estimates strategy would cost£50/tonne
! Average UK consumption ofgoods
! Average UK wasteproduction of 520kg/person/year
! 25% higher recycling levelsof 15.5%
! As Scenario 1
! Consumption reduced by15% through lifestylechoices
! Waste levels reduced by15%
! 25% of domestic wasterecycled or composted
! 70% landfill and 5%incinerated
! Promotion of reclaimed andrecycled goods.
! 25% reduced consumption! 25% reduced packaging levels
! 25% less waste than UK average! 25% of which is recycled! 25% of which is composted! 25% of which is gasified in a CHP! 25% of which is landfilled! Waste-to-energy solutions
! Biffa estimates strategy would cost£80/tonne, cheaper to recycle thanlandfill in the future.
Water
! Average UK water consumption! 134 litres/person/day metered water
(OFWAT)! BRE estimates 1.95m3 used
externally per person per annum! Hence, 128 litres/person/day
sewerage! (If new UK home with power shower
then water demand up to 230litres/day)
! In = (48.91m3 x 0.7243)+17.58=£53! Out = (46.72m3x0.6542)+29.35=£60! 2001-02 Expenditure and Food
Survey suggests average annualcost per person in SE of ‘watersupply and misc. services relating tothe dwelling’ = £118 approx.
! low water consumption! 82 litres/person/day! BRE estimates 1.95m3 used
externally per person perannum (EcoHomes)
! Hence, 76 litres/person/daysewerage
! In = (29.93m3 x 0.7243) +17.58 = £39
! Out = (27.74m3 x 0.6542) +29.35 = £48
! Calculate as cost per m3 ofdomestic water consumerand sewage produced
! As Scenario 2 ! Very low water consumption 47litres/person/day
! BedZED average over all dwellings= 72 lpppd
! On-site grey water processing! Rainwater harvesting meets
external water demand! If 47 litres/day and water
recycling= £74! In(32l)=(11.68m3x0.586)+19=£26! Ingreen(15l)=(5.475m3x0.527)=£3! Out (47 litres) = (17.16m3 x
0.4325) + 38.00 = £45! If 47 l/day with no water recy= £71! In =(17.16m3x0.7243)+17.58= £30! Out=(17.16m3x0.654)+29.35=£41
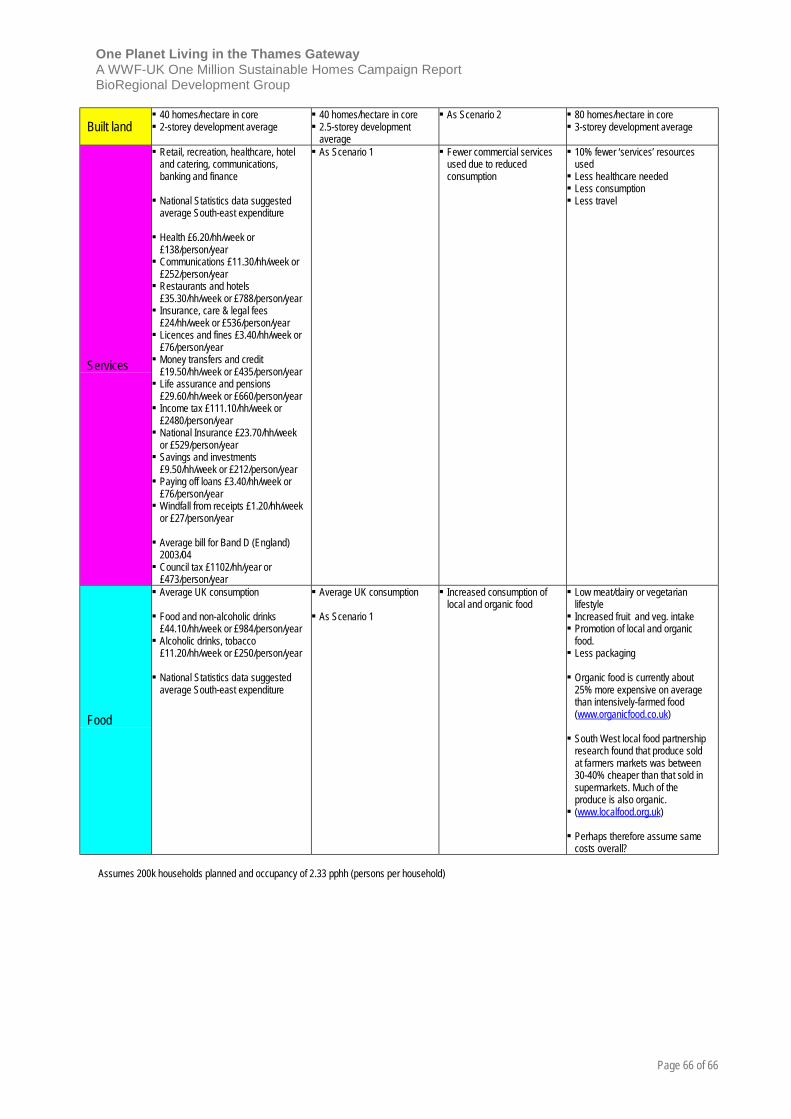
One Planet Living in the Thames GatewayA WWF-UK One Million Sustainable Homes Campaign ReportBioRegional Development Group
Page 66 of 66
Built land! 40 homes/hectare in core! 2-storey development average
! 40 homes/hectare in core! 2.5-storey development
average
! As Scenario 2 ! 80 homes/hectare in core! 3-storey development average
Services
! Retail, recreation, healthcare, hoteland catering, communications,banking and finance
! National Statistics data suggestedaverage South-east expenditure
! Health £6.20/hh/week or£138/person/year
! Communications £11.30/hh/week or£252/person/year
! Restaurants and hotels£35.30/hh/week or £788/person/year
! Insurance, care & legal fees£24/hh/week or £536/person/year
! Licences and fines £3.40/hh/week or£76/person/year
! Money transfers and credit£19.50/hh/week or £435/person/year
! Life assurance and pensions£29.60/hh/week or £660/person/year
! Income tax £111.10/hh/week or£2480/person/year
! National Insurance £23.70/hh/weekor £529/person/year
! Savings and investments£9.50/hh/week or £212/person/year
! Paying off loans £3.40/hh/week or£76/person/year
! Windfall from receipts £1.20/hh/weekor £27/person/year
! Average bill for Band D (England)2003/04
! Council tax £1102/hh/year or£473/person/year
! As Scenario 1 ! Fewer commercial servicesused due to reducedconsumption
! 10% fewer ‘services’ resourcesused
! Less healthcare needed! Less consumption! Less travel
Food
! Average UK consumption
! Food and non-alcoholic drinks£44.10/hh/week or £984/person/year
! Alcoholic drinks, tobacco£11.20/hh/week or £250/person/year
! National Statistics data suggestedaverage South-east expenditure
! Average UK consumption
! As Scenario 1
! Increased consumption oflocal and organic food
! Low meat/dairy or vegetarianlifestyle
! Increased fruit and veg. intake! Promotion of local and organic
food.! Less packaging
! Organic food is currently about25% more expensive on averagethan intensively-farmed food(www.organicfood.co.uk)
! South West local food partnershipresearch found that produce soldat farmers markets was between30-40% cheaper than that sold insupermarkets. Much of theproduce is also organic.
! (www.localfood.org.uk)
! Perhaps therefore assume samecosts overall?
Assumes 200k households planned and occupancy of 2.33 pphh (persons per household)

The mission of WWF, the global environment network – is to stopthe degradation of the planet’s natural environment and to build afuture in which humans live in harmony with nature, by:• conserving the world’s biological diversity• ensuring that the use of renewable resources is sustainable• promoting the reduction of pollution and wasteful consumption
www.wwf.org.uk
WWF-UKPanda House, Weyside ParkGodalming, Surrey GU7 1XRt: 01483 426444f: 01483 426409
Taking action for a living planet