oncogenic regulators and substrates of the anaphase...
TRANSCRIPT

Tumorigenesis and Neoplastic Progression
Oncogenic Regulators and Substrates of theAnaphase Promoting Complex/Cyclosome AreFrequently Overexpressed in Malignant Tumors
Norman L. Lehman,*† Rob Tibshirani,‡
Jerry Y. Hsu,§ Yasodha Natkunam,*Brent T. Harris,*† Robert B. West,*Marilyn A. Masek,* Kelli Montgomery,*Matt van de Rijn,* and Peter K. Jackson*§
From the Departments of Pathology,* Health Research and Policy,
and Statistics,‡ the Division of Neuropathology,† and the Program
in Cancer Biology,§ Stanford University, Stanford, California
The fidelity of cell division is dependent on the accu-mulation and ordered destruction of critical proteinregulators. By triggering the appropriately timed,ubiquitin-dependent proteolysis of the mitotic regu-latory proteins securin, cyclin B, aurora A kinase,and polo-like kinase 1, the anaphase promoting com-plex/cyclosome (APC/C) ubiquitin ligase plays an es-sential role in maintaining genomic stability. Misex-pression of these APC/C substrates, individually, hasbeen implicated in genomic instability and cancer.However, no comprehensive survey of the extent oftheir misregulation in tumors has been performed.Here, we analyzed more than 1600 benign and malig-nant tumors by immunohistochemical staining of tis-sue microarrays and found frequent overexpressionof securin, polo-like kinase 1, aurora A, and Skp2 inmalignant tumors. Positive and negative APC/C regu-lators, Cdh1 and Emi1, respectively, were also morestrongly expressed in malignant versus benign tu-mors. Clustering and statistical analysis supports thefinding that malignant tumors generally show broadmisregulation of mitotic APC/C substrates not seen inbenign tumors, suggesting that a “mitotic profile” intumors may result from misregulation of the APC/Cdestruction pathway. This profile of misregulated mi-totic APC/C substrates and regulators in malignant tu-mors suggests that analysis of this pathway may bediagnostically useful and represent a potentially impor-tant therapeutic target. (Am J Pathol 2007, 170:1793–1805;
DOI: 10.2353/ajpath.2007.060767)
Tumor progression is characterized by misregulation ofcritical growth regulatory mechanisms. Typically, activa-tion of growth factor pathways, eg, through tyrosine ki-nases or growth factors up-regulating cyclin D, and lossof growth regulatory tumor suppressors, eg, pRb, p16,and p53, directs unscheduled cell division.1 In manytumors, neoplastic transformation is strongly linked to thedevelopment of chromosome instability, leading to acti-vation of the aforementioned and additional oncogenicprocesses.
Recent studies have demonstrated that failure of nor-mal chromosome segregation leading to subsequent mi-totic catastrophe is a central mechanism among eventsleading to chromosome or genomic instability. Mitoticcatastrophe is often linked to a failure of cytokinesis,giving rise to tetraploid or aneuploid cells. Tetraploidy isthought to provide a buffer against genetic loss ingenomically unstable cells, having recently been shownto be the preferred pathway for cells that fail mitosis2 andto otherwise independently lead to a tumorigenic state inp53-null cells.3 Mitotic catastrophe also leads to aneu-ploidy, possibly through tetraploid intermediates, and thegenomic rearrangement typically seen in malignanttumors.
Misregulation of specific mitotic regulators can drivemitotic catastrophe in model genetic organisms, in cul-tured mammalian cells, and in mouse models. Notably,over- or underexpression of the mitotic kinases aurora Aand polo-like kinase 1 (Plk1) and the chromosome seg-regation regulator securin can each give rise to mitoticcatastrophe.4–7 Each of these proteins, along with themitotic entry regulator Skp2,8,9 have been suggested to
Supported by National Institute of Neurological Disorders and Strokegrant K08 NS45077 (to N.L.L.) and National Institute of General MedicalSciences grant RO1 GM60439 (to P.K.J.).
Accepted for publication February 13, 2007.
Supplemental material for this article can be found on http://ajp.amjpathol.org.
Current address of P.K.J.: Genentech, Inc., South San Francisco, CA.
Address reprint requests to Norman L. Lehman, Department of Pathol-ogy, MC5324, Stanford University Medical Center, 300 Pasteur Dr., Stan-ford, CA 94305. E-mail: [email protected].
The American Journal of Pathology, Vol. 170, No. 5, May 2007
Copyright © American Society for Investigative Pathology
DOI: 10.2353/ajpath.2007.060767
1793
be oncogenic, possibly by driving chromosomal rear-rangement. Of interest, these proteins are substrates ofthe anaphase promoting complex or cyclosome (APC/C),the E3 ubiquitin ligase controlling destruction of mitoticcyclins, and other mitotic regulators, among other pro-teins.10 A biologically consistent model is that the care-fully timed destruction of these proteins in mitosis reflectsthe importance of restricting their abundance and thattheir overexpression disrupts the timing of mitotic events.
The APC/C is a multisubunit ubiquitin ligase that rec-ognizes critical RXXL or KEN amino acid motifs (degrons)within protein substrates to assemble polyubiquitinchains on these substrates, thereby targeting them to the26S proteasome for proteolytic destruction. The APC/Cexists in two forms depending on its associated activatorprotein, Cdc20 or Cdh1 (homologous to the Drosophilaprotein Fizzy-related and should not be confused withcadherin E, previously referred to as Cdh1 for cadherin1). The APC/CCdc20 functions in early mitosis to destroycyclin A and securin and is regulated by the mitoticspindle assembly checkpoint (discussed below). TheAPC/CCdh1 functions later in mitosis to direct the destruc-tion of a host of mitotic regulators, thereby promotingmitotic exit.
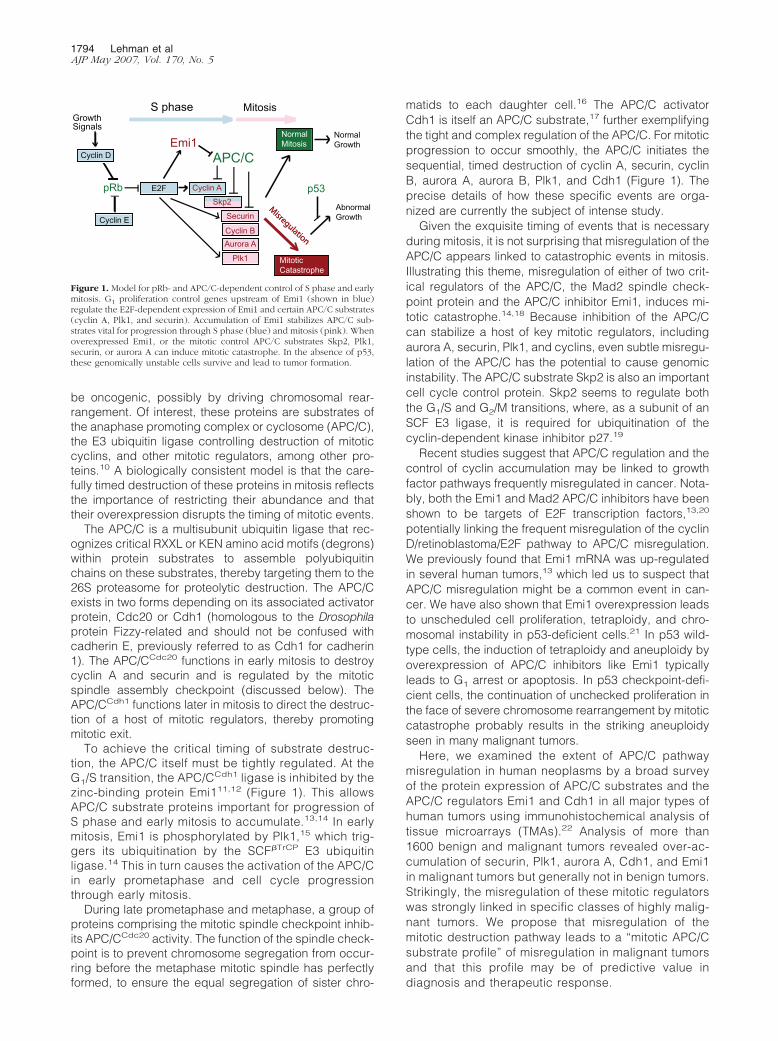
To achieve the critical timing of substrate destruc-tion, the APC/C itself must be tightly regulated. At theG1/S transition, the APC/CCdh1 ligase is inhibited by thezinc-binding protein Emi111,12 (Figure 1). This allowsAPC/C substrate proteins important for progression ofS phase and early mitosis to accumulate.13,14 In earlymitosis, Emi1 is phosphorylated by Plk1,15 which trig-gers its ubiquitination by the SCF�TrCP E3 ubiquitinligase.14 This in turn causes the activation of the APC/Cin early prometaphase and cell cycle progressionthrough early mitosis.
During late prometaphase and metaphase, a group ofproteins comprising the mitotic spindle checkpoint inhib-its APC/CCdc20 activity. The function of the spindle check-point is to prevent chromosome segregation from occur-ring before the metaphase mitotic spindle has perfectlyformed, to ensure the equal segregation of sister chro-
matids to each daughter cell.16 The APC/C activatorCdh1 is itself an APC/C substrate,17 further exemplifyingthe tight and complex regulation of the APC/C. For mitoticprogression to occur smoothly, the APC/C initiates thesequential, timed destruction of cyclin A, securin, cyclinB, aurora A, aurora B, Plk1, and Cdh1 (Figure 1). Theprecise details of how these specific events are orga-nized are currently the subject of intense study.
Given the exquisite timing of events that is necessaryduring mitosis, it is not surprising that misregulation of theAPC/C appears linked to catastrophic events in mitosis.Illustrating this theme, misregulation of either of two crit-ical regulators of the APC/C, the Mad2 spindle check-point protein and the APC/C inhibitor Emi1, induces mi-totic catastrophe.14,18 Because inhibition of the APC/Ccan stabilize a host of key mitotic regulators, includingaurora A, securin, Plk1, and cyclins, even subtle misregu-lation of the APC/C has the potential to cause genomicinstability. The APC/C substrate Skp2 is also an importantcell cycle control protein. Skp2 seems to regulate boththe G1/S and G2/M transitions, where, as a subunit of anSCF E3 ligase, it is required for ubiquitination of thecyclin-dependent kinase inhibitor p27.19
Recent studies suggest that APC/C regulation and thecontrol of cyclin accumulation may be linked to growthfactor pathways frequently misregulated in cancer. Nota-bly, both the Emi1 and Mad2 APC/C inhibitors have beenshown to be targets of E2F transcription factors,13,20
potentially linking the frequent misregulation of the cyclinD/retinoblastoma/E2F pathway to APC/C misregulation.We previously found that Emi1 mRNA was up-regulatedin several human tumors,13 which led us to suspect thatAPC/C misregulation might be a common event in can-cer. We have also shown that Emi1 overexpression leadsto unscheduled cell proliferation, tetraploidy, and chro-mosomal instability in p53-deficient cells.21 In p53 wild-type cells, the induction of tetraploidy and aneuploidy byoverexpression of APC/C inhibitors like Emi1 typicallyleads to G1 arrest or apoptosis. In p53 checkpoint-defi-cient cells, the continuation of unchecked proliferation inthe face of severe chromosome rearrangement by mitoticcatastrophe probably results in the striking aneuploidyseen in many malignant tumors.
Here, we examined the extent of APC/C pathwaymisregulation in human neoplasms by a broad surveyof the protein expression of APC/C substrates and theAPC/C regulators Emi1 and Cdh1 in all major types ofhuman tumors using immunohistochemical analysis oftissue microarrays (TMAs).22 Analysis of more than1600 benign and malignant tumors revealed over-ac-cumulation of securin, Plk1, aurora A, Cdh1, and Emi1in malignant tumors but generally not in benign tumors.Strikingly, the misregulation of these mitotic regulatorswas strongly linked in specific classes of highly malig-nant tumors. We propose that misregulation of themitotic destruction pathway leads to a “mitotic APC/Csubstrate profile” of misregulation in malignant tumorsand that this profile may be of predictive value indiagnosis and therapeutic response.
GrowthSignals
pRb
APC/C
Mitotic Catastrophe
p53
Emi1
E2F
S phase
NormalGrowth
AbnormalGrowth
Cyclin A
Skp2
Aurora A
Plk1
Cyclin B
E2F
Cyclin E
Cyclin D
Mitosis
NormalMitosis
Misregulation
Misregulation
Securin
Figure 1. Model for pRb- and APC/C-dependent control of S phase and earlymitosis. G1 proliferation control genes upstream of Emi1 (shown in blue)regulate the E2F-dependent expression of Emi1 and certain APC/C substrates(cyclin A, Plk1, and securin). Accumulation of Emi1 stabilizes APC/C sub-strates vital for progression through S phase (blue) and mitosis (pink). Whenoverexpressed Emi1, or the mitotic control APC/C substrates Skp2, Plk1,securin, or aurora A can induce mitotic catastrophe. In the absence of p53,these genomically unstable cells survive and lead to tumor formation.
1794 Lehman et alAJP May 2007, Vol. 170, No. 5
Materials and Methods
Short Interferring RNA (siRNA)
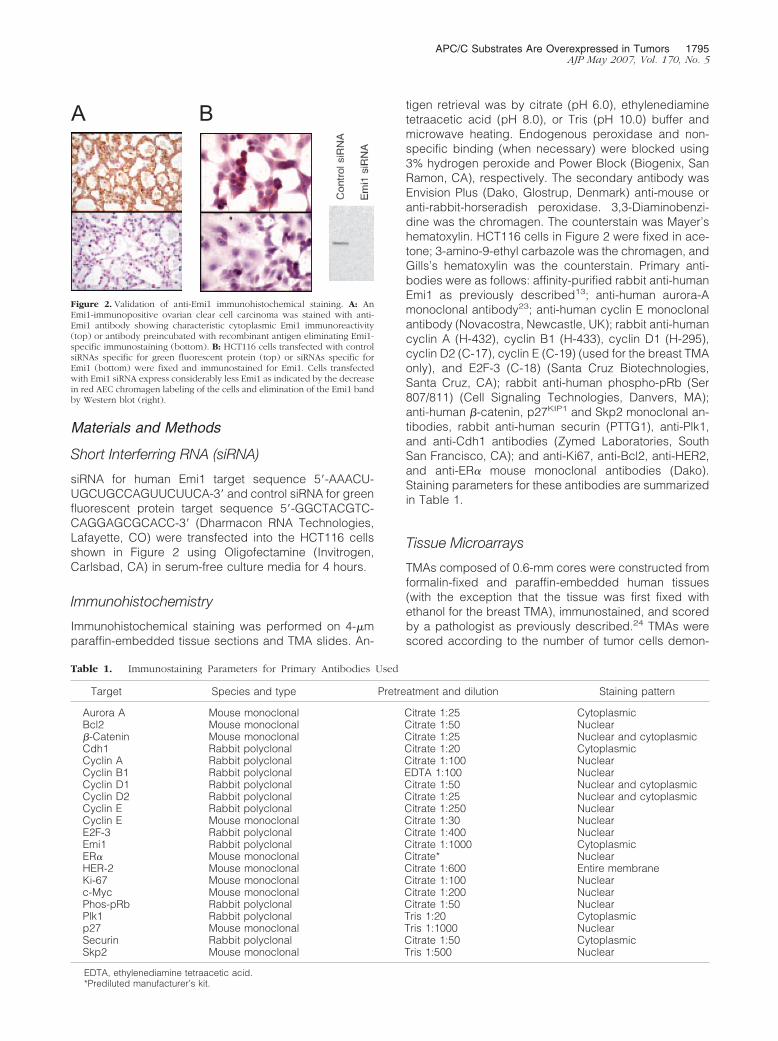
siRNA for human Emi1 target sequence 5�-AAACU-UGCUGCCAGUUCUUCA-3� and control siRNA for greenfluorescent protein target sequence 5�-GGCTACGTC-CAGGAGCGCACC-3� (Dharmacon RNA Technologies,Lafayette, CO) were transfected into the HCT116 cellsshown in Figure 2 using Oligofectamine (Invitrogen,Carlsbad, CA) in serum-free culture media for 4 hours.
Immunohistochemistry
Immunohistochemical staining was performed on 4-�mparaffin-embedded tissue sections and TMA slides. An-
tigen retrieval was by citrate (pH 6.0), ethylenediaminetetraacetic acid (pH 8.0), or Tris (pH 10.0) buffer andmicrowave heating. Endogenous peroxidase and non-specific binding (when necessary) were blocked using3% hydrogen peroxide and Power Block (Biogenix, SanRamon, CA), respectively. The secondary antibody wasEnvision Plus (Dako, Glostrup, Denmark) anti-mouse oranti-rabbit-horseradish peroxidase. 3,3-Diaminobenzi-dine was the chromagen. The counterstain was Mayer’shematoxylin. HCT116 cells in Figure 2 were fixed in ace-tone; 3-amino-9-ethyl carbazole was the chromagen, andGills’s hematoxylin was the counterstain. Primary anti-bodies were as follows: affinity-purified rabbit anti-humanEmi1 as previously described13; anti-human aurora-Amonoclonal antibody23; anti-human cyclin E monoclonalantibody (Novacostra, Newcastle, UK); rabbit anti-humancyclin A (H-432), cyclin B1 (H-433), cyclin D1 (H-295),cyclin D2 (C-17), cyclin E (C-19) (used for the breast TMAonly), and E2F-3 (C-18) (Santa Cruz Biotechnologies,Santa Cruz, CA); rabbit anti-human phospho-pRb (Ser807/811) (Cell Signaling Technologies, Danvers, MA);anti-human �-catenin, p27KIP1 and Skp2 monoclonal an-tibodies, rabbit anti-human securin (PTTG1), anti-Plk1,and anti-Cdh1 antibodies (Zymed Laboratories, SouthSan Francisco, CA); and anti-Ki67, anti-Bcl2, anti-HER2,and anti-ER� mouse monoclonal antibodies (Dako).Staining parameters for these antibodies are summarizedin Table 1.
Tissue Microarrays
TMAs composed of 0.6-mm cores were constructed fromformalin-fixed and paraffin-embedded human tissues(with the exception that the tissue was first fixed withethanol for the breast TMA), immunostained, and scoredby a pathologist as previously described.24 TMAs werescored according to the number of tumor cells demon-
A B
Figure 2. Validation of anti-Emi1 immunohistochemical staining. A: AnEmi1-immunopositive ovarian clear cell carcinoma was stained with anti-Emi1 antibody showing characteristic cytoplasmic Emi1 immunoreactivity(top) or antibody preincubated with recombinant antigen eliminating Emi1-specific immunostaining (bottom). B: HCT116 cells transfected with controlsiRNAs specific for green fluorescent protein (top) or siRNAs specific forEmi1 (bottom) were fixed and immunostained for Emi1. Cells transfectedwith Emi1 siRNA express considerably less Emi1 as indicated by the decreasein red AEC chromagen labeling of the cells and elimination of the Emi1 bandby Western blot (right).
Table 1. Immunostaining Parameters for Primary Antibodies Used
Target Species and type Pretreatment and dilution Staining pattern
Aurora A Mouse monoclonal Citrate 1:25 CytoplasmicBcl2 Mouse monoclonal Citrate 1:50 Nuclear�-Catenin Mouse monoclonal Citrate 1:25 Nuclear and cytoplasmicCdh1 Rabbit polyclonal Citrate 1:20 CytoplasmicCyclin A Rabbit polyclonal Citrate 1:100 NuclearCyclin B1 Rabbit polyclonal EDTA 1:100 NuclearCyclin D1 Rabbit polyclonal Citrate 1:50 Nuclear and cytoplasmicCyclin D2 Rabbit polyclonal Citrate 1:25 Nuclear and cytoplasmicCyclin E Rabbit polyclonal Citrate 1:250 NuclearCyclin E Mouse monoclonal Citrate 1:30 NuclearE2F-3 Rabbit polyclonal Citrate 1:400 NuclearEmi1 Rabbit polyclonal Citrate 1:1000 CytoplasmicER� Mouse monoclonal Citrate* NuclearHER-2 Mouse monoclonal Citrate 1:600 Entire membraneKi-67 Mouse monoclonal Citrate 1:100 Nuclearc-Myc Mouse monoclonal Citrate 1:200 NuclearPhos-pRb Rabbit polyclonal Citrate 1:50 NuclearPlk1 Rabbit polyclonal Tris 1:20 Cytoplasmicp27 Mouse monoclonal Tris 1:1000 NuclearSecurin Rabbit polyclonal Citrate 1:50 CytoplasmicSkp2 Mouse monoclonal Tris 1:500 Nuclear
EDTA, ethylenediamine tetraacetic acid.*Prediluted manufacturer’s kit.
APC/C Substrates Are Overexpressed in Tumors 1795AJP May 2007, Vol. 170, No. 5

strating specific immunoreactivity for a given primary an-tibody within a given sample core. Immunostaining wasdefined as negative (�3% of tumor cells positive), weak(3 to 29% of tumor cells positive), and strong (�30%tumor cells positive). Each tumor or tissue sample wasrepresented once on the TMAs, except for the connectivetissue tumor TMA where each sample was representedby two cores. In the latter case, the greatest percentageof positive cells of either core was scored. Data wereprocessed, and complete-linkage hierarchical clusteringwas performed using samples in which 80 to 100% ofmarker data were available using Cluster and Tree Viewsoftware.24 To facilitate comparison of Emi1 and APC/Csubstrate accumulation with that of other markers, weweighted clustering on Emi1 expression, which orderedthe tumors into Emi1-negative and -positive groups. Thisyielded identical cluster dendrograms of tumor markerscompared with unweighted clustering. The neural TMAcontained 180 tumors; the lymphoma TMA, 265 prolifer-ative lesions; the breast TMA, 255 proliferative lesions;two cancer TMAs, 523 tumors of diverse tissues; and theconnective tissue TMA, 460 tumors. TMAs contained vari-able numbers of control and normal tissue cores.
Statistical Analysis
To assess significance, we tabulated Pearson corre-lation coefficients and corresponding two-sided Pvalues, based on normal theory,25 for immunoposi-tivity for protein markers relative to each otherwithin TMAs (Supplemental Table 1, see http://ajp.amjpathol.org).
Results and Discussion
The APC/C Regulator Emi1 Is Highly Expressedin Tumors
To determine the possible extent of APC/C misregulationin human cancer, we used immunohistochemical stainingto examine whether the APC/C regulators Emi1 and Cdh1and several APC/C substrates were overexpressed intumors. We began by extending our initial observation ofEmi1 mRNA up-regulation in human tumors to the proteinlevel. Validation of our anti-human Emi1 antibodies isshown in Figure 2.
Lymphoma (DLBCL) T-Cell LymphomaNormal Lymph Node
Meningioma ChordomaOligodendroglioma
Endometrial Cancer
Retinoblastoma
Lung Adenocarcinoma Renal Cell Cancer
Ductal Cancer In SituBreast Fibroadenoma
Hepatic Carcinoma
Ewing's Sarcoma
Normal Breast
Seminoma
Ependymoma
Retinoblastoma
Ovary Clear Cell Ca
Ductal Cancer
Melanoma
Figure 3. Analysis of Emi1 protein expression in human tumors. Emi1 is highly expressed in retinoblastoma (eye whole mount and retinoblastoma rosette) andother major tumor types (TMA cores). The viable peripheral tumor tissue within the eye whole mount is Emi1 immunopositive, whereas the necrotic center isnonreactive. Normal lymph nodes and breast tissue exhibit less intense Emi1 staining than lymphomas and breast ductal cancer, respectively. Benign fibrocysticbreast tissue and endometrial stroma show very little Emi1 staining in the ductal carcinoma in situ and endometrial cancer cores, respectively. Positiveimmunoreactivity is indicated by the brown diaminobenzidine chromagen.
1796 Lehman et alAJP May 2007, Vol. 170, No. 5

Since Emi1 transcription is driven by E2F, we expectedthat Emi1 would be highly expressed in retinoblastomas,where E2Fs are not inhibited by pRb, and found strongEmi1 immunopositivity in retinoblastomas (Figure 3).
Because overexpression of Emi1 protein in tumorswould be expected to lead to inappropriate APC/C inhi-bition and hyperaccumulation of APC/C substrates, wenext used TMAs22 to screen a large sample of humantumors for Emi1 and APC/C substrate protein accumula-tion. Immunohistochemical staining of TMAs has severaladvantages over RNA-based methods for analyzinggene expression in tumors, particularly when examiningcomponents and substrates of the ubiquitin proteasomesystem.26 Most importantly, relative message levels oftendo not accurately reflect relative protein levels in tumors,and TMAs allow semiquantitative measurement of proteinlevels within tumor cells specifically, without a confound-ing contribution from nontumorous stromal cells, as is thecase with other methods.26 Background staining can bea limitation of immunohistochemistry, but this can gener-ally be minimized by careful optimization of antibodydilutions and antigen retrieval techniques and by inter-pretation performed by experienced pathologists usingconsistent criteria for immunopositivity between varioustissues for a given antibody.
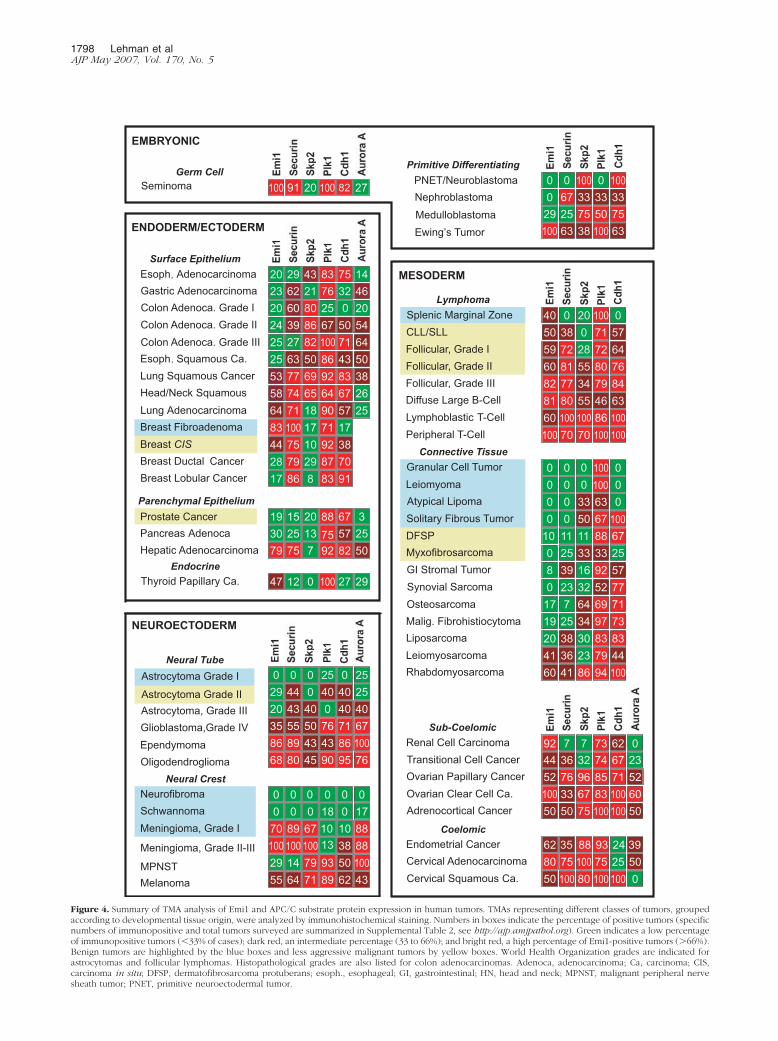
We found that Emi1 protein is highly expressed in asignificant fraction of human neoplasms. Examples ofTMA immunostaining for Emi1 and other markers areshown in Figure 3 and Supplemental Figures 1 and 2, seehttp://ajp.amjpathol.org. A summary of the immunohisto-chemical protein expression of Emi1, Cdh1, and the on-cogenic APC/C substrates securin, Plk1, Skp2, and au-rora A in many of the more common human tumors ispresented in Figure 4. Here, tumors are grouped accord-ing to a classification system based on common devel-opmental origin.27 The figure depicts the percentage ofimmunopositive individual tumor specimens for each pro-tein marker.
Notably, we found that 92% of renal cell carcinomas,80% of cervical adenocarcinomas, 79% of hepatocellularcarcinomas, 68% of oligodendrogliomas, 64% of lungadenocarcinomas, 62% of endometrial cancers, 55% ofmelanomas, and many lymphomas are Emi1 immunopo-sitive. All germ cell tumors and all clear carcinomas of theovary examined strongly expressed Emi1. A large frac-tion of other carcinomas, nonastrocytic neural tumors,and some sarcomas were also Emi1 immunopositive.Many astrocytomas, gastrointestinal adenocarcinomas,sarcomas, and most low-grade connective tissue tumorswere Emi1 negative (Figure 4).
A number of trends were observed in specific classesof tumors. First, among neural and connective tissueneoplasms, benign tumors (indicated in blue in Figure 4)were typically Emi1-negative, whereas a subset of malig-nant tumors were Emi1-positive.
Second, in lymphomas, Emi1 expression generallyparalleled increasing tumor grade. Here, 59% of WorldHealth Organization grade I follicular lymphomas wereEmi1 immunopositive compared with 82% of grade IIIfollicular lymphomas and 81% of diffuse large B-cell lym-
phomas. Peripheral T-cell lymphomas, a particularly ag-gressive lymphoma, were 100% Emi1 immunopositive.
Third, in some cancers, notably colon and breast can-cer, substantial numbers of tumors lacked Emi1 immuno-reactivity. Although some Emi1 immunoreactivity waspresent in corresponding normal tissues, it was of lowerintensity and of a more compartmentalized manner withinindividual cells compared with staining in Emi1-positivetumors (Figure 3; Supplemental Figures 1 and 2, seehttp://ajp.amjpathol.org). The corresponding nonmalig-nant neoplasms, breast ductal papilloma and fibroade-noma, and premalignant neoplasm, colon tubular ade-noma, showed Emi1 staining of intermediate intensity.
In breast cancer, more Emi1-positive tumors were lowgrade (43.8% grade 1, 31.3% grade 2, and 25.0% grade3), whereas more Emi1-negative tumors tended to behigher grade (15.8% grade 1, 47.4% grade 2, and 36.8%grade 3). Emi1 (Fbx05) maps to chromosomal region6q25,28 close to the estrogen receptor � and Parkingenes, which frequently undergo loss of heterozygosity inbreast cancers.29 Likewise, papillary serous ovarian car-cinomas, in which chromosomal region 6q25 is also fre-quently deleted, were Emi1 negative in approximately50% of cases (Figure 4; Supplemental Figure 3, http://ajp.amjpathol.org). In these tumors, Emi1 is likely impor-tant at some early phase of tumor progression, but laterEmi1 loss may provide a second step in tumor progres-sion or may simply be a consequence of further genomicinstability. Of biological note, the magnitude of differ-ences in Emi1 protein levels between low- and high-Emi1-expressing ovarian tumors determined by Westernblot (Supplemental Figure 3, http://ajp.amjpathol.org) wasgreater than the level of Emi1 overexpression that re-sulted in chromosomal instability in cell culture models.21
APC/C Substrates Are FrequentlyOverexpressed in Malignant Tumors
Because the extent of misregulation of APC/C substratesin human neoplasms is largely unknown, we surveyedAPC/C misregulation in cancers by immunostainingTMAs for the APC/C substrates cyclin A, cyclin B, se-curin, aurora A, Plk1, Skp2, and Cdh1. To look for corre-lations, we analyzed these data using complete-linkagehierarchical clustering adapted for TMAs.24 In many tu-mors with elevated Emi1 protein, several or all of theAPC/C substrates clustered together, consistent with themodel that Emi1 causes their stabilization. These includethe following tumors: lung and cervical adenocarcino-mas; lung, esophageal and head and neck squamouscell cancers; melanomas; lymphomas; urothelial transi-tional cell tumors; seminomas; ovarian clear cell carcino-mas; several malignant neural tumors; and some sarco-mas (Figures 4–6; Supplemental Tables 1 and 2, seehttp://ajp.amjpathol.org). Thus, it seems that APC/C mis-regulation by Emi1 overexpression or other factors maydirect a broad program of APC/C substrate stabilizationin tumors.
Specific APC/C substrates, notably Skp2, fail to followthe pattern in some tumors (Skp2 staining is not prevalent
APC/C Substrates Are Overexpressed in Tumors 1797AJP May 2007, Vol. 170, No. 5
Lymphoma
28
55
5572
46
8064
63
7672
80
81
20 0040
59
81
6034 79 847782Follicular, Grade III
Follicular, Grade IIFollicular, Grade I
Diffuse Large B-Cell
Splenic Marginal Zone
7588100
357593
2524
8062
5039Endometrial Cancer
Cervical Adenocarcinoma
33 67 83 100100 60Ovarian Clear Cell Ca.
91 20 100 82100 27Seminoma
Adrenocortical Cancer 50 7550 100 100
100 80 100 10050 0
36 32 74 6744 23Transitional Cell Cancer
Cervical Squamous Ca.
76 96 85 7152 52Ovarian Papillary Cancer
7 73 6292 0Renal Cell Carcinoma 7
0 71 573850
100 70 10070
CLL/SLL
Lymphoblastic T-CellPeripheral T-Cell
100
60 100 100 86100100
Germ Cell
Connective Tissue
19
0
60
17
8
41
0
25
0
41
7
39
36
25
34
50
86
64
16
23
33
97
67
94
69
92
79
33
73
100
100
71
57
44
25
RhabdomyosarcomaLeiomyosarcoma
OsteosarcomaMalig. Fibrohistiocytoma
GI Stromal TumorSynovial Sarcoma
Myxofibrosarcoma
0 23 32 52 77
Solitary Fibrous Tumor
100 633863100Ewing’s TumorMedulloblastoma
PNET/Neuroblastoma
29 25 75 50 75
0 0 100 0 10033 3333670Nephroblastoma
EMBRYONIC
LeiomyomaGranular Cell Tumor
DFSP 10 11 11 88 67
0 0 0 100 00 0 0 100 0
Liposarcoma
Atypical Lipoma 0 0 33 0
20 38 30 83 83
63
MESODERM
Sub-Coelomic
Coelomic
Primitive Differentiating
Hepatic Adenocarcinoma
Esoph. Adenocarcinoma
Esoph. Squamous Ca.
Pancreas Adenoca
Gastric Adenocarcinoma
75
63
8
25
2962
7
50
13
4321
25
30
2023
92
86
75
8376
82
43
57
7532
50
Colon Adenoca. Grade I
50
25
1446
79
44 75 92 3810
17 86 83 91828 79 87 7029
83 100 71 1717
Breast Lobular CancerBreast Ductal CancerBreast CISBreast Fibroadenoma
Thyroid Papillary Ca. 12 047 100 27
ENDODERM/ECTODERM
Neural Crest0
700
0
890
0
670
0
1018
0
38
0Meningioma, Grade I
MPNST
NeurofibromaSchwannoma
0
8817
86 89 43 43 86OligodendrogliomaEpendymoma 100
68 80 45 90 95 76
20
029
43
044
40
00
0
2540
40
040
Astrocytoma, Grade IIIAstrocytoma Grade II
Astrocytoma Grade I
40
25
35 55 50 76 71 67Glioblastoma,Grade IV
Neural Tube
Melanoma
Lung Squamous CancerHead/Neck Squamous
7774
696558
9264
8367
3826
Lung Adenocarcinoma 71 18 90 57 2564
89 62716455 4329 14 79 93 50 100
Meningioma, Grade II-III 10010
13100100 88
Parenchymal Epithelium
Surface Epithelium
NEUROECTODERM
53
15 20 88 6719 3Prostate Cancer
Endocrine
50
29
25
60 8020 0 2039 8624 67 50 5427 8225 100 71 64
25 Colon Adenoca. Grade II Colon Adenoca. Grade III
Figure 4. Summary of TMA analysis of Emi1 and APC/C substrate protein expression in human tumors. TMAs representing different classes of tumors, groupedaccording to developmental tissue origin, were analyzed by immunohistochemical staining. Numbers in boxes indicate the percentage of positive tumors (specificnumbers of immunopositive and total tumors surveyed are summarized in Supplemental Table 2, see http://ajp.amjpathol.org). Green indicates a low percentageof immunopositive tumors (�33% of cases); dark red, an intermediate percentage (33 to 66%); and bright red, a high percentage of Emi1-positive tumors (�66%).Benign tumors are highlighted by the blue boxes and less aggressive malignant tumors by yellow boxes. World Health Organization grades are indicated forastrocytomas and follicular lymphomas. Histopathological grades are also listed for colon adenocarcinomas. Adenoca, adenocarcinoma; Ca, carcinoma; CIS,carcinoma in situ; DFSP, dermatofibrosarcoma protuberans; esoph., esophageal; GI, gastrointestinal; HN, head and neck; MPNST, malignant peripheral nervesheath tumor; PNET, primitive neuroectodermal tumor.
1798 Lehman et alAJP May 2007, Vol. 170, No. 5
in hepatic, pancreatic, or renal carcinomas, despitestrong involvement of other APC/C substrates), possiblybecause of genomic rearrangement or regulatory differ-ences, eg, tissue-specific signaling factors or repressors.This is supported by the fact that Skp2 was infrequentlyoverexpressed in all of the different types of breast tu-mors and all of the tumors derived from organ parenchy-mal epithelium (Figure 4).
APC/C misregulation by Emi1 is closely linked to thepRb/E2F transcriptional activation pathway.13 This mayexplain the lack of a uniform up-regulation of all APC/Csubstrates in some tumor types. Up-regulation of E2F-mediated transcription due to pRb loss or hyperphospho-rylation (eg, from cyclin E up-regulation) may dominateover the effects of altered protein stability due to APC/Cmisregulation. Securin and Plk1 are both E2F targets;therefore, they would tend to cluster together when pRbtranscription repression is misregulated. The effects oftheir overexpression on genomic instability would remainno matter what the mechanism of their misregulation. pRbis characteristically altered in seminoma, lung cancer,and transitional cell carcinoma. This would explain in-creased expression of Emi1 and/or Plk1 and securin inthese tumors without concomitant aurora or Skp2 over-expression (Figure 4). It is important to note that overex-pression of a single oncogenic APC/C substrate, such asaurora A, is sufficient to cause chromosomal instability ormorphological transformation in vitro.5–9
Another parameter that might explain some of the non-uniformity of the APC/C cluster data are the inherentlimitations of immunohistochemical analysis. Immunohis-tochemistry detects various thresholds of protein expres-sion for different markers due to a variety of factors,including differences in expression ranges for differentproteins, differences in the efficiencies of primary anti-bodies to bind target proteins, and differences in efficien-cies of detecting target proteins in different cellular com-partments (nucleus versus cytoplasm) in formalin-fixed,paraffin-embedded tissues.26
Our data also support the incidence of overexpressionof each APC/C substrate as a strong predictor of malig-nancy, whereas the absence of overexpression of APC/Csubstrates in most cases correlates with benign lesions.Using nearest shrunken centroids analysis,25 the predic-tive value of having a single APC/C marker up-regulatedis only slightly improved by including additional markers(Supplemental Figure 4, see http://ajp.amjpathol.org).This analysis suggests that misregulation of APC/C sub-strate accumulation is a fairly uniform program down-stream of APC/C misregulation and that Emi1 overex-pression is linked to a high percentage of APC/Csubstrate-positive tumors.
Within specific tumors, varying percentages of tu-mors are APC/C substrate positive but Emi1 negative,including a percentage of neural tumors, gastrointes-tinal tumors, breast cancers, primitive differentiatingembryonic tumors, sarcomas, and lymphomas (Figures4 – 6). In colon tumors, decreased or absent Emi1 maybe explained by high levels of Plk130 and/or �-TrCp,31
the kinase15 and SCF substrate adapter14 that triggerubiquitin-dependent destruction of Emi1, respectively.
Accumulation of APC/C substrates such as Skp2, Plk1,and aurora A is common in colon cancer (Figure 4).Here, we suspect that another form of APC/C misregu-lation may be occurring, such as APC/C subunit muta-tion, alterations of other APC/C regulators includingspindle checkpoint proteins such as Mad2, or directtranscriptional activation or amplification of specificAPC/C substrates (discussed below).
Activation of the G1/S Cyclin/pRb/E2F PathwayCorrelates with Emi1 and APC/C SubstrateProtein Levels in Malignant Tumors
To test our hypothesis that activation of the G1/S cyclinprogram is linked to oncogenic APC/C substrate positiv-ity, we examined the status of other proliferation path-ways including proteins critical for G1/S control. Accord-ingly, we immunostained TMAs for several regulators ofcellular proliferation including cyclins D and E, phosphor-ylated pRb, E2F3, p27, Bcl2, c-Myc, and �-catenin (Fig-ures 5 and 6). Here, we looked for linkages betweenthese G1/S programs and misregulation of the APC/C.
We first considered the status of pRb and its regulatorypartners. Tumors with a high incidence of pRb loss in-cluding lung and hepatic adenocarcinomas showed asimilarly high incidence of Emi1 overexpression andAPC/C substrate positivity, as did cervical adenocarcino-mas in which pRb is inactivated by human papillomavirusE7 protein.
In addition to cyclin D/cdk4/6, cyclin E/cdk2 maintainspRb phosphorylation in S phase through early mitosis,32
and cyclin E overexpression can induce chromosome in-stability, similarly to Emi1.33 We found that cyclin E expres-sion clustered with Emi1 in several malignant tumor typesincluding ovarian, lung, breast, and bladder cancers; oligo-dendroglial and meningeal neural tumors; leiomyosarcoma,rhabdomyosarcoma, and malignant fibrous histiocytomaconnective tissue tumors; and rare lymphomas (Figures 5and 6). Cyclin E immunopositivity statistically correlated withEmi1 expression in the breast, connective tissue, and can-cer TMAs (P � 0.001) (Supplemental Table 1, see http://ajp.amjpathol.org). Likewise, cyclin D1 expression corre-lated with Emi1 in the breast, connective tissue, andlymphoma TMAs (P � 0.002), and phosphorylated-pRbcorrelated with Emi1 in all of four TMAs in which it wasexamined (breast, connective tissue, cancer, and neural)(P � 0.001). Tumors with a high incidence of loss of thecyclin D/cdk4 inhibitor p16, an important inhibitor of pRbphosphorylation, including melanoma, ovarian clear cellcarcinoma, transitional cell cancer, and head and neckcancer, also showed strong correlations with Emi1 andAPC/C substrate positivity. Thus, Emi1 protein was stronglyexpressed in tumors expected to highly express Emi1mRNA due to biological alterations leading to increasedpRb phosphorylation, namely increased cyclin D or E ex-pression, or loss of p16.
Emi1 protein expression also clustered with �-cateninin a large cross section of tumors (Figures 5 and 6). Thiscorrelation was statistically significant across all of theTMAs (P � 0.001) and was strongest for the cancer
APC/C Substrates Are Overexpressed in Tumors 1799AJP May 2007, Vol. 170, No. 5
Cyc
lin D
2C
yclin
D1
Cyc
lin E
E
mi1
β-ca
teni
nS
kp2
Sec
urin
Cdh
1C
yclin
A
Ki6
7B
cl2
Plk
1C
yclin
Bp2
7
meningioma | angioblastic medulloblastomaschwannomaschwannoma | acousticschwannomaanaplastic astrocytomafibrillary astrocytomaanaplastic astrocytoma pilocytic astrocytomaneurofibromaneurofibromaneurofibromaschwannomaschwannomapilocytic astrocytomapilocytic astrocytomaschwannoma | acousticastrocytoma | gemistocyticschwannoma | acoustic glioblastomaschwannoma | acousticschwannoma | acousticoligodendrogliomameningioma | secretoryoligodendrogliomaanaplastic oligodendroglioma anaplastic oligodendroglioma glioblastomaglioblastomamedulloblastomaPNETanaplastic oligodendrogliomamedulloblastomaglioblastomaPNETPNETmalignant ependymoma anaplastic astrocytomapilocytic astrocytomamalignant gangliogliomaanaplastic astrocytoma astrocytoma | gemistocyticoligodendrogliomaglioblastomaglioblastomaglioblastomaglioblastomaglioblastomaMPNSToligodendrogliomaglioblastomaanaplastic oligodendroglioma anaplastic oligodendrogliomaoligodendrogliomaoligodendrogliomaanaplastic oligodendrogliomaoligodendrogliomamalignant | meningiomamalignant meningioma malignant papillary meningioma malignant meningiomamalignant meningiomagliosarcomamalignant | meningiomachoroid plexus papilloma meningioma | secretory ATRThemangioblastomamalignant | meningiomahemangioblastomaependymoma | myxopapillaryependymomachordomafibrillary astrocytomaanaplastic oligodendrogliomaoligodendrogliomaoligodendrogliomaoligodendrogliomafibrillary astrocytoma oligodendrogliomaoligodendrogliomahemangiopericytomaependymomaependymomaoligodendrogliomaoligodendrogliomaoligodendrogliomaoligodendrogliomaoligodendrogliomagliosarcomaoligodendrogliomaoligoastrocytomaoligodendrogliomaoligodendrogliomaanaplastic oligodendrogliomameningioma | meningothialleiomyoscarcomamedulloblastomameningioma | meningothialhemangioblastomameningioma | meningothialanaplastic astrocytomaependymomamalignant | meningiomameningioma | meningothial malignant | meningiomahemangioblastomahemangioblastomaependymomamalignant meningiomaglioblastoma
E2F
3c-
Myc
Bcl
2p2
7C
yclin
A
Ki6
7ph
os-p
Rb
Skp
2C
yclin
Eβ-
cate
nin
Aur
ora
AE
mi1
Cyc
lin D
1S
ecur
inP
lk1
Cdh
1
Neural TMA Lymphoma TMA
A B
Emi1 - / APC Substrate -
Low Grade Neural Tumors:Neurofibromas, Schwanomas,Pilocytic AstrocytomasFew Intermediate Grade & High GradeTumors
Emi1 - / APC Substrate +
High Grade Malignant Tumors:Anaplastic Astrocytomas, Anaplastic Oligodendrogliomas,Glioblastomas, PNETs, MeduloblastomasOne Low Grade &Few Intermediate Grade Tumors
Emi1 + /APC Substrate +
Intermediate Grade Tumors:Oligodendroglioma,Ependymoma
High Grade Tumors:Gliosarcoma, Medulloblastoma, ATRT, Leiomyosarcoma
Few Low Grade Tumors:Hemangioblastoma, Meningioma
FL1FL3FL1FL3FL1DLBCLDLBCLFL3BurkittCLL/SLLFL1FL1FL3FL2FL1FL2Marginal Zone | splenicMarginal Zone | splenicMarginal Zone | splenicMaginal ZoneMarginal Zone | splenicCLL/SLLFL1CLL/SLLFL3FL1FL1FL1FL1FL1FL2FL2FL1FL2FL2FL1FL1FL1FL2malignant mast cellmalignant mast cellDLBCLFL3FL3Mantle CellMantle CellMantle CellMantle CellMantle CellHodgkin | mixed celllymphoblastic T-celllymphoblastic T-cellFL3FL3DLBCLFL3DLCLDLBCLFL3FL3DLBCLDLBCLDLBCLMantle Cell | colonFL3DLBCLFL2DLBCLDLBCLDLBCL | small bowel Marginal Zone | extranodalFL3FL1 | soft tissueDLBCL | tonsillymphoblastic T-cell | skin Marginal Zone | extranodalFL3FL2FL3FL2FL2FL3peripheral T-cellFL3lymphoblastic T-celllymphoblastic T-cellDLBCL | parotidDLBCLMaliginant Histiocytosis DLBCL | lacrimal saclymphoblastic T-cellDLBCLPTLD | NKC | small bowelDLBCLmalignant NKC | stomachHodgkin | NLPHodgkin | NLPFL3DLCLFL3multiple myeloma FL3FL3CLLSLLCLLSLLFL1FL1FL1DLBCLDLBCLDLBCLDLBCLDLBCLDLBCLMarginal Zone | extranodal FL1peripheral T-cell DLBCLPTLD | malignant B cell Marginal Zone | extranodalFL3LPLperipheral T-cell DLBCL T-cell richFL3DLBCL T-cell richFL2DLBCLFL3DLBCLDLBCLDLBCLDLBCLDLBCLanaplastic large cellNKC | skinperipheral T-cellanaplastic large cellperipheral T-cellMarginal Zone | extranodalperipheral T-cellFL3peripheral T-cell | Lennert’sanaplastic large cell
Emi1- /APC Substrate -
Low Grade Lymphomas:Folicular Lymphoma Grade ISplenic Marginal ZoneCLL/SLL
Few High Grade Lymphomas
Emi1- /APC Substrate +
Intermediate Grade Lymphomas:Folicular Grade II, Mantle Cell
High Grade Lymphomas:Folicular Grade III, DLBCL
Few Low Grade Lymphomas
Emi1 + /APC Substrate +
Mostly High Grade Lymphomas:Folicular Grade III, DLBCL, Peripheral T Cell,Lymphoblastic T Cell
Some Intermediate Grade:Extranodal Marginal Zone,Folicular Grade II
Few Low Grade Lymphomas
1800 Lehman et alAJP May 2007, Vol. 170, No. 5
and connective tissue tumor arrays (P � 0.05 and0.001, respectively; Supplemental Table 1, see http://ajp.amjpathol.org). Wnt signals through �-catenin to induce Sphase.34 Interestingly, both Emi1 and �-catenin are reg-ulated by �-TrCP, which can restrain cell-nonautonomoussignaling through the Wnt and Hedgehog pathways35 aswell as the cell autonomous overduplication of centro-somes with overexpression of Emi1.14
APC/C Mitotic Substrate Misregulation IsDistinct from Up-Regulation of ProliferationProteins and Is a Marker of Aggressive Tumors
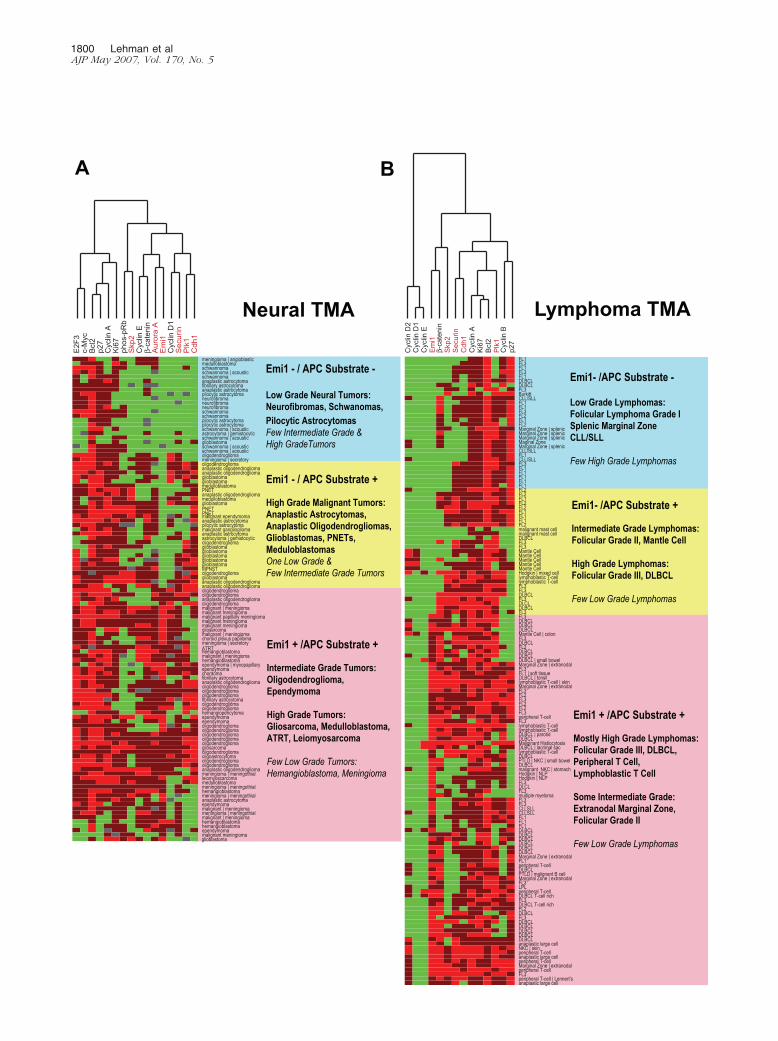
In many tissue types, including neural and connectivetissue tumors, lymphomas, and a subset of carcinomas,general S phase markers including Ki67, cyclin A, Bcl2,phosphorylated-pRb, and E2F3 form a “proliferation”cluster distinct from that containing the mitotic regulatoryand oncogenic APC/C substrates securin, aurora A, Plk1,Skp2, and the APC/C-activating subunit Cdh1, “mitoticAPC/C cluster.” With few exceptions, proliferative butbenign World Health Organization grade I neural tumors,such as neurofibromas, schwannomas, and pilocytic as-trocytomas, expressed the proliferation cluster but weregenerally negative for the APC/C cluster, whereas malig-nant tumors, such as grade II–IV gliomas, were nearlyuniformly immunopositive for both clusters (Figure 5A).
This trend also occurred for lymphoid and connectivetissue tumors. World Health Organization grade I to IIfollicular lymphomas are generally proliferation clusterpositive and APC/C cluster negative, whereas grade IIIfollicular and diffuse large B-cell lymphomas are immu-nopositive for both clusters (Figure 5B). In addition, all ofthe diffuse large B-cell lymphomas expressing cyclin D2,a marker of poor prognosis,36 were in the Emi1-positivesubset. Benign connective tissue tumors are generallyEmi1, securin, and Skp2 immunonegative. Malignantconnective tissue tumors (sarcomas) are only occasion-ally Emi1 immunopositive but frequently highly expresssecurin and Skp2 (Figure 6).
In contrast to most carcinomas, prostate and thyroidtumors, which are usually less aggressive cancers, wereoften mitotic APC/C mitotic cluster negative (Figure 4).Thus in some cases, overexpression of Emi1 and in manycases, overexpression of the oncogenic mitotic controlAPC/C substrates seem to be markers of tumoraggressiveness.
A high percentage of malignant tumors appeared tomarkedly accumulate the APC/C activator subunit Cdh1,
whereas most benign and some low-grade tumors wereCdh1 immunonegative (Figure 4). This suggests that Cdh1overexpression may be a response to APC/C inhibition.Cdh1 overexpression in tumors with reduced APC/C activitycould represent a compensatory feedback loop. It mayseem counterintuitive that both the APC/C activator Cdh1and APC/C inhibitor Emi1 are concomitantly overexpressedin some tumor types; however, this is not surprising whenone considers that Cdh1 is itself an APC/C substrate17 andthat Emi1 knockdown by siRNA decreases Cdh1 levels(N.L.L., unpublished data). Furthermore, Emi1 overexpres-sion can override the effects of Cdh1 overexpression invitro,13 possibly because of stabilization of cyclin A, be-cause Cdh1 is inactivated by phosphorylation via cyclinA/cdk.37 Specifically, Emi1 overexpression has been shownto relieve the transient cell cycle block caused by Cdh1overexpression.13 Again, this is not unexpected becauseEmi1 can bind either free Cdh1 or the APC/C core subunitcomplex and block APC/C activity.12
Cdh1 overexpression may thus reflect an imbalance ofpositive and negative APC/C regulation in tumors. Nota-bly, the APC/C activator Cdc20 has been reported to beoverexpressed at the mRNA level in gastric and lungcancers.38,39 Although Cdh1 normally acts to induce cellcycle exit and thus limit cell cycle progression, Cdh1overexpression can result in massive over-replication ofthe genome40; therefore Cdh1 overexpression could leadto genomic instability in some circumstances.
In some tumor types, particularly in mesoderm-derivedtissue tumors, Plk1 seems to be broadly expressed inboth malignant and benign neoplasms (Figure 4). Be-cause Plk1 is an E2F target gene41 that is involved innumerous phosphorylation reactions during G2 and mi-tosis,42 it may thus be more of a general marker of pro-liferation, perhaps specifically in hematolymphoid andconnective tissue (mesoderm-derived) tumors. In sup-port of this, we found that Plk1 protein expressionstrongly correlated with phosphorylated pRb in the con-nective tissue and cancer TMAs with correlation coeffi-cients of 0.267 (P � 0.000) and 0.440 (P � 0.000),respectively (Supplemental Table 1, see http://ajp.amjpathol.org). In contrast to mesoderm-derived tumors,Plk1 expression correlated with increasing histopatholog-ical grade in colon adenocarcinomas and neuroecto-derm-derived tumors (Figure 4).
The timely destruction of cyclins and other centralmitotic regulators by the APC/C is essential to the accu-rate segregation of chromosomes and the maintenanceof genomic stability. Several mechanisms may lead to
Figure 5. Hierarchical clustering analysis of Emi1, proliferation control, and mitotic control proteins in human tumors. For each tumor type, immunopositivity forEmi1, proliferation control (cyclins D1, D2, E, and A; �-catenin; p27Kip1; Bcl2; and Ki67), and mitotic control/APC/C (aurora A, Plk1, securin, Cdh1, and Skp2)substrates were identified. Dendrograms for neural tumor (A) and lymphoma (B) TMAs are shown. Green rectangles indicate a tumor showing no immuno-positivity, dark red indicates moderate positivity (3 to 29% of tumor cells positive), and bright red indicates high positivity (�30% tumor cells positive). Grayrectangles indicate unscorable TMA cores. The dendograms on the top horizontal axes show clusters of proliferation control proteins and APC/C substrateproteins. Oncogenic APC/C substrates securin, aurora A, Plk1, and Skp2 (red) form a cluster with Emi1 distinct from broader proliferation markers such as Ki67,cyclin A, and Bcl-2 in malignant neural tumors and lymphomas. The pink rectangles on the right vertical axes represent Emi1-positive tumors, which are largelymalignant and positive for both proliferation and APC/C clusters. The yellow rectangles indicate mostly malignant tumors that are largely proliferation and APC/Ccluster positive but Emi1 negative. The blue rectangles represent mostly benign or low-grade tumors that are predominantly proliferation cluster positive andAPC/C cluster negative. ALCL, anaplastic large cell lymphoma; DLBCL, diffuse large B-cell lymphoma; FL1–3, follicular lymphoma grades 1 through 3; NKC, naturalkiller cell (lymphoma); NLP, nodular lymphocyte predominant Hodgkin’s lymphoma; CLL/SLL, chronic lymphocytic leukemia/small lymphocytic lymphoma;PTLD, posttransplant lymphoproliferative disorder.
APC/C Substrates Are Overexpressed in Tumors 1801AJP May 2007, Vol. 170, No. 5

benign | atypical lipoma benign | hemangioendothelioma | epithelioid benign | DFSP benign | leiomyoma benign | leiomyomamalignant | fibromyosarcoma | metastaticbenign | schwannomamalignant | MFH malignant | leiomyosarcoma benign | fasciitis | nodularmalignant | MPNSTbenign | atypical lipoma benign | fibromatosisbenign | fibromatosismalignant | DSRCT malignant | MPNST malignant | MPNST benign | atypical lipoma malignant | liposarcoma | pleomorphicmalignant | myosarcomamalignant | synovial sarcoma malignant | angiosarcoma benign | DFSP malignant | angiosarcoma malignant | giant cell tumor | tenosynovial benign | fibroanthoma | atypical malignant | synovial sarcomamalignant | GISTmalignant | carcinosarcoma malignant | MFHmalignant | leiomyosarcomamalignant | GIST malignant | GIST malignant | GIST malignant | leiomyosarcomamalignant | carcinosarcomamalignant | carcinosarcoma | metastaticmalignant | MFHmalignant | osteosarcomamalignant | MFH malignant | clear cell sarcoma malignant | carcinosarcoma | recurrentmalignant | liposarcoma | dedifferentiatedmalignant | sarcoma | GIST malignant | GIST malignant | PNET malignant | MFHmalignant | leiomyosarcomamalignant | liposarcoma | dedifferentiatedmalignant | SFTmalignant | rhabdomyosarcoma malignant | osteosarcoma malignant | osteosarcoma malignant | leiomyosarcoma malignant | rhabdomyosarcomamalignant | osteosarcomamalignant | SFTmalignant | sarcoma | NOS malignant | liposarcoma | dedifferentiatedmalignant | MPNSTmalignant | MFH malignant | MFHmalignant | osteosarcomamalignant | SFTmalignant | SFTmalignant | SFTmalignant | osteosarcomamalignant | SFTmalignant | synovial sarcomamalignant | liposarcoma | dedifferentiatedmalignant | MFH malignant | clear cell sarcomamalignant | angiosarcomamalignant | synovial sarcomamalignant | leiomyosarcoma malignant | giant cell tumor | tenosynovialmalignant | GIST malignant | giant cell tumor | tenosynovial malignant | synovial sarcoma malignant | MFH malignant | endometrial sarcoma malignant | MFH malignant | adenosarcoma malignant | MFH malignant | MFH malignant | rhabdomyosarcoma | metastaticmalignant | MFHmalignant | MFH malignant | MFHmalignant | MFH malignant | MPNST
malignant | MPNST malignant | sarcoma | angiosarcomamalignant | giant cell tumor | tenosynovial benign | fibroanthomabenign | fibroanthomamalignant | lipomatous tumor | liposarcoma malignant | epithelioid sarcoma malignant | fibrosarcomabenign | lipoblastomatosismalignant | liposarcoma benign | lipoblastomatosis malignant | MPNST malignant | Ewing’s sarcomamalignant | rhabdomyosarcoma malignant | rhabdomyosarcoma malignant | carcinosarcomamalignant | Ewing’s sarcoma malignant | Ewing’s sarcoma malignant | rhabdomyosarcoma malignant | liposarcomamalignant | leiomyosarcomamalignant | rhabdomyosarcoma | metastaticmalignant | endometrial stromal sarcoma malignant | rhabdomyosarcomamalignant | MFH malignant | leiomyosarcomamalignant | MFH malignant | GISTmalignant | carcinosarcomamalignant | leiomyosarcoma | recurrentmalignant | GIST benign | glomus tumormalignant | sarcoma | leiomyosarcoma malignant | GISTbenign | glomus tumorbenign | hemangioendothelioma benign | hemangioendothelioma | infantilebenign | hemangioendotheliomabenign | glomus tumorbenign | atypical lipoma malignant | DRSCTmalignant | rhabdomyomamalignant | MFHbenign | fibromatosisbenign | fibroanthomamalignant | fibrosarcomamalignant | leiomyosarcoma malignant | alveolar soft part sarcomamalignant | Ewing’s sarcoma malignant | Ewing’s sarcoma malignant | chondrosarcoma | myoid malignant | fibrosarcoma benign | leiomyoma malignant | endometrial stromal sarcomabenign | glomus tumormalignant | MPNSTmalignant | Ewing’s sarcoma malignant | leiomyosarcomamalignant | leiomyosarcomamalignant | leiomyosarcomamalignant | leiomyosarcoma malignant | leiomyosarcomamalignant | leiomyosarcomamalignant | MFHmalignant | leiomyosarcoma | epitheliodmalignant | leiomyosarcoma malignant | leiomyosarcoma malignant | clear cell sarcoma benign | DFSPmalignant | osteosarcomamalignant | chondrosarcomamalignant | MFH malignant | rhabdomyosarcomamalignant | rhabdomyosarcoma malignant | carcinosarcomamalignant | MPNST malignant | rhabdomyosarcomamalignant | Ewing’s sarcomamalignant | MFHmalignant | osteosarcomamalignant | leiomyosarcoma malignant | MFHmalignant | MFH malignant | MFHmalignant | MFH
Skp
2S
ecur
inph
os-p
Rb
Cyc
lin E
cycl
in D
1P
lk1
p27
Cyc
lin A
C
dh1
Skp
2S
ecur
inph
os-p
Rb
Em
i1C
yclin
Ecy
clin
D1
Plk
1p2
7C
yclin
A
Cdh
1
Connective TissueTumor TMA
malignant | MFH
Emi1 - / APC -Mostly Benign
Emi1 + / APC+Mostly Malignant
Emi1 - / APC +Mostly Malignant
Em
i1
Figure 6. Hierarchical clustering analysis of Emi1, proliferation control, and mitotic control proteins in human connective tissue tumors. Data are represented asin Figure 4. DFSP, dermatofibrosarcoma protuberans; DSRCT, desmoplastic small round cell tumor; GIST, gastrointestinal stromal cell tumor; MFH, malignantfibrous histiocytoma; MPNST, malignant peripheral nerve sheath tumor; NOS, type not otherwise specified; PNET, primitive neuroectodermal tumor; SFT, solitaryfibrous tumor.
1802 Lehman et alAJP May 2007, Vol. 170, No. 5

APC/C misregulation in tumors including inactivating mu-tations or down-regulation of APC/C subunits43,44; muta-tion, loss, or overexpression of spindle checkpoint pro-teins such as Mad2,18,20 Bub1,45 or BubR146,47;overexpression of Emi1; or inactivation of the potentialAPC/C inhibitor RASSF1A.48 In addition, some APC/Csubstrates may themselves be misexpressed throughgenomic alterations, eg, aurora A gene amplification inbreast, gastric and colon cancers.49 Because Plk1 andsecurin are E2F transcriptional targets,41,50 they can alsobe overexpressed at the mRNA level by pRb misregula-tion or loss.
A small number of studies to date have suggested thatspecific substrates of the APC/C are misregulated in certaintumors.5–7,50–56 However, no general survey of the extent oruniformity of APC/C substrate misregulation in all classes ofhuman tumors has been published. Our analysis of morethan 1600 tumor samples, representing more than 80 tumorclasses, provides the first systematic analysis of APC/Csubstrate misregulation. We found that protein levels ofmitotic APC/C substrates are frequently and coordinatelyelevated in malignant human tumors, in many cases withconcomitant overexpression of the APC/C inhibitor Emi1.Overaccumulation of APC/C substrates could be, in somecases, directly because of their increased transcription. Inother cases, inappropriate protein stability, secondary toAPC/C misregulation by APC/C mutations, Emi1, or Mad2misexpression may be an important primary or contributingfactor. The latter is supported by the ability of overex-pressed Emi1 and Mad2 to stabilize APC/C substrates andcause genomic instability in vitro.20–21 In addition, becauseAPC/C substrates are substantially regulated by ubiquitin-dependent proteolysis, it would not be unexpected thataltered degradation plays a role in their overexpression inneoplasia.
Our analysis demonstrates a strong correlation betweenAPC/C misregulation and malignancy and an anti-correla-tion with nonmalignancy. This profile is independent of mis-regulation of G1/S phase cell cycle markers (cyclin A, Ki67,and E2F), which are also strongly accumulated in benigntumors. Importantly, in malignant tumors, both the G1/Sphase cell cycle markers and the APC/C markers are cor-related. This distinction between the prevalence of G1/Sphase cell cycle misregulation and mitotic APC/C substratemisregulation suggests several conclusions. First, it sug-gests that G1/S phase cell cycle regulation, presumablylinked to increased proliferation, is representative of abroader class of hyperproliferative processes and may belinked to the activation of growth signaling pathways. Sec-ond, it suggests that the misregulation of mitotic APC/Csubstrates occurs through an independent mechanism, notstrictly linked to G1/S phase control. A strong candidate forthis independent mechanism is the stabilization controlpathway regulated by APC/C inhibitors including Emi1 andMad2. Our present data support that Emi1 overexpressionis linked to a sizable fraction of cases where mitotic APC/Csubstrates are misregulated in tumors but not to all cases.Functional tests from our laboratory show that overexpres-sion of Emi1 is sufficient to stabilize APC/C substrates,creating a state much like that seen in tumors.14,21 For thosetumors lacking Emi1 overexpression, it may be that 1) Emi1
is reduced by loss of heterozygosity following an event ofgenomic instability, 2) other APC/C regulators such asMad2 can direct APC/C misregulation, or 3) independentcontrol mechanisms determine the increased accumulationof these mitotic regulators. Additional studies to look atMad2 in tumors are ongoing.
Besides Mad2, misexpression or mutation of otherspindle checkpoint proteins, such as BubR1, may belinked to genomic instability. BubR1 is necessary forapoptosis after prolonged spindle damage and is signif-icantly decreased in approximately 30% of colon adeno-carcinomas,46 and biallelic mutations in BUB1B, whichencodes BubR1, have recently been reported in familiesaffected by Mosaic Variegated Aneuploidy syndrome,which manifests in mosaic aneuploidy and predispositionto childhood malignancies.47
In addition to Emi1 misregulation, misregulation ofother APC/C regulators that are E2F targets, such asMad2 and BubR1, and/or E2F-regulated APC/C sub-strates, such as securin or Plk1, could be contributing oralternate mechanisms of mitotic APC/C substrate mis-regulation in cancers, independent of Emi1. Thus, bothincreased E2F-mediated transcription and inappropriateprotein stability probably work in concert in the path-way to genomic instability downstream of pRb/E2Fmisregulation.
We observed that an increase in the protein expressionlevels of the mitotic control APC/C substrates Skp2, securin,aurora A, and Plk1; the APC/C regulator Cdh1; and in manycases the APC/C inhibitor Emi1, strongly correlates withmalignancy. Furthermore, in some tumors, such as lympho-mas, increased accumulation of these proteins may corre-late with tumor aggressiveness. We suggest that this is dueto an increased propensity for mitotic catastrophe andgenomic instability. However, despite the in vitro data show-ing that overexpression of Emi1 and APC/C substrates re-sults in chromosomal instability, the ultimate biological con-sequences of APC/C substrate overexpression in tumorsare unclear. The question of whether APC/C substrate over-expression is causal or only a downstream consequence oftumorigenesis and genomic instability cannot be answeredby the present study.
Nevertheless, the observation of up-regulation of theAPC/C pathway in tumors could prove to be of clinicalimportance. The pathway may be therapeutically exploit-able through pharmacological targeting of Emi1 or otherAPC/C regulators or substrates. The propensity forgenomic instability in tumors may also be related to sen-sitivity to antimitotics; APC/C substrate profiles mightserve as a predictive marker for cancers responsive orresistant to agents that target the spindle checkpoint, eg,taxanes,52 or other regulators of mitosis. Last, becausethe mitotic APC/C expression profile not only distin-guishes nonmalignant from malignant proliferations incertain tumor classes, such as connective tissue neo-plasms and a large subset of neural tumors, but also isnearly uniform in certain specific tumor types, such asseminomas and clear cell carcinomas of the ovary, indi-vidual APC/C substrates and/or Emi1 may have broaderutility in diagnostic pathology. The near uniformity ofCdh1 overexpression in malignant versus benign tumors
APC/C Substrates Are Overexpressed in Tumors 1803AJP May 2007, Vol. 170, No. 5

may prove to be a valuable diagnostic tool. Further stud-ies will clearly be necessary to explore these importantclinical possibilities.
Acknowledgments
We thank Dr. Kenneth Ban for assistance with siRNA, Dr.Julie D. Reimann for assistance early in the study, andElizabeth Domanay and Shuchun Zhao for technical help.We thank Dr. Peter R. Egbert for providing retinoblastomacases, Dr. Teri A. Longacre for providing ovarian tumorsamples, Dr. Claude Prigent for anti-aurora A antibody,and Caroline Tudor and Anet James for assistance withdigital photo editing. We also thank Dr. Michael L. Clearyand Dr. Andrew J. Connolly for invaluable comments.
References
1. Cahill DP, Kinzler KW, Vogelstein B, Lengauer C: Genetic instabilityand Darwinian selection in tumours. Trends Cell Biol 1999,9:M57–M60
2. Shi Q, King RW: Chromosome nondisjunction yields tetraploid ratherthan aneuploid cells in human cell lines. Nature 2005, 437:1038–1042
3. Fujiwara T, Bandi M, Nitta M, Ivanova EV, Bronson RT, Pellman D:Cytokinesis failure generating tetraploids promotes tumorigenesis inp53-null cells. Nature 2005, 437:1043–1047
4. Lane HA, Nigg EA: Antibody microinjection reveals an essential rolefor human polo-like kinase 1 (Plk1) in the functional maturation ofmitotic centrosomes. J Cell Biol 1996, 135:1701–1713
5. Zhou H, Kuang J, Zhong L, Kuo WL, Gray JW, Sahin A, Brinkley BR,Sen S: Tumour amplified kinase STK15/BTAK induces centrosomeamplification, aneuploidy and transformation. Nat Genet 1998,20:189–193
6. Meraldi P, Honda R, Nigg EA: Aurora-A overexpression reveals tet-raploidization as a major route to centrosome amplification in p53�/�cells. EMBO J 2002, 21:483–492
7. Zou H, McGarry TJ, Bernal T, Kirschner MW: Identification of a ver-tebrate sister-chromatid separation inhibitor involved in transforma-tion and tumorigenesis. Science 1999, 285:418–422
8. Smith MR, Wilson ML, Hamanaka R, Chase D, Kung H, Longo DL,Ferris DK: Malignant transformation of mammalian cells initiated byconstitutive expression of the polo-like kinase. Biochem Biophys ResCommun 1997, 234:397–405
9. Gstaiger M, Jordan R, Lim M, Catzavelos C, Mestan J, Slingerland J,Krek W: Skp2 is oncogenic and overexpressed in human cancers.Proc Natl Acad Sci USA 2001, 98:5043–5048
10. Harper JW, Burton JL, Solomon MJ: The anaphase-promotingcomplex: it’s not just for mitosis any more. Genes Dev 2002,16:2179–2206
11. Reimann JD, Gardner BE, Margottin-Goguet F, Jackson PK: Emi1regulates the anaphase-promoting complex by a different mecha-nism than Mad2 proteins. Genes Dev 2001, 15:3278–3285
12. Miller JJ, Summers MK, Hansen DV, Nachury MV, Lehman NL, LoktevA, Jackson PK: Emi1 stably binds and inhibits the anaphase-promot-ing complex/cyclosome as a pseudosubstrate inhibitor. Genes Dev2006, 20:2410–2420
13. Hsu JY, Reimann JD, Sorensen CS, Lukas J, Jackson PK: E2F-dependent accumulation of hEmi1 regulates S phase entry by inhib-iting APC/(Cdh1). Nat Cell Biol 2002, 4:358–366
14. Margottin-Goguet F, Hsu JY, Loktev A, Hsieh HM, Reimann JD,Jackson PK: Prophase destruction of Emi1 by the SCF(betaTrCP/Slimb) ubiquitin ligase activates the anaphase promoting complex toallow progression beyond prometaphase. Dev Cell 2003, 4:813–826
15. Hansen DV, Loktev AV, Ban KH, Jackson PK: Plk1 regulates activa-tion of the anaphase promoting complex by phosphorylating andtriggering SCFbetaTrCP-dependent destruction of the APC/C inhibi-tor Emi1. Mol Biol Cell 2004, 15:5623–5634
16. Nasmyth K: How do so few control so many? Cell 2005, 120:739–746
17. Listovsky T, Oren YS, Yudkovsky Y, Mahbubani HM, Weiss AM,Lebendiker M, Brandeis M: Mammalian Cdh1/Fzr mediates its owndegradation. EMBO J 2004, 23:1619–1626
18. Michel L, Diaz-Rodriguez E, Narayan G, Hernando E, Murty VV,Benezra R: Complete loss of the tumor suppressor MAD2 causespremature cyclin B degradation and mitotic failure in human somaticcells. Proc Natl Acad Sci USA 2004, 101:4459–4464
19. Nakayama K, Nagahama H, Minamishima YA, Miyake S, Ishida N,Hatakeyama S, Kitagawa M, Iemura S, Natsume T, Nakayama KI:Skp2-mediated degradation of p27 regulates progression into mito-sis. Dev Cell 2004, 6:661–672
20. Hernando E, Nahle Z, Juan G, Diaz-Rodriguez E, Alaminos M, He-mann M, Michel L, Mittal V, Gerald W, Benezra R, Lowe SW, Cordon-Cardo C: Rb inactivation promotes genomic instability by uncouplingcell cycle progression from mitotic control. Nature 2004,430:797–802
21. Lehman NL, Verschuren EW, Hsu JY, Cherry AM, Jackson PK: Over-expression of the anaphase promoting complex/cyclosome inhibitorEmi1 leads to tetraploidy and genomic instability of p53-deficientcells. Cell Cycle 2006, 5:1569–1573
22. Kononen J, Bubendorf L, Kallioniemi A, Barlund M, Schraml P, Leigh-ton S, Torhorst J, Mihatsch MJ, Sauter G, Kallioniemi OP: Tissuemicroarrays for high-throughput molecular profiling of tumor speci-mens. Nat Med 1998, 4:844–847
23. Conte N, Delaval B, Ginestier C, Ferrand A, Isnardon D, Larroque C,Prigent C, Seraphin B, Jacquemier J, Birnbaum D: TACC1-chTOG-Aurora A protein complex in breast cancer. Oncogene 2003,22:8102–8116
24. Liu CL, Prapong W, Natkunam Y, Alizadeh A, Montgomery K, GilksCB, van de Rijn M: Software tools for high-throughput analysis andarchiving of immunohistochemistry staining data obtained with tissuemicroarrays. Am J Pathol 2002, 161:1557–1565
25. Tibshirani R, Hastie T, Narasimhan B, Chu G: Diagnosis of multiplecancer types by shrunken centroids of gene expression. Proc NatlAcad Sci USA 2002, 99:6567–6572
26. Lehman NL, van de Rijn M, Jackson PK: Screening of tissue microar-rays for ubiquitin proteasome system components in tumors. Meth-ods Enzymol 2005, 399:334–355
27. Berman JJ: Tumor classification: molecular analysis meets Aristotle.BMC Cancer 2004, 4:10
28. Chiaur DS, Murthy S, Cenciarelli C, Parks W, Loda M, Inghirami G,Demetrick D, Pagano M: Five human genes encoding F-box proteins:chromosome mapping and analysis in human tumors. Cytogenet CellGenet 2000, 88:255–258
29. Cesari R, Martin ES, Calin GA, Pentimalli F, Bichi R, McAdams H,Trapasso F, Drusco A, Shimizu M, Masciullo V, D’Andrilli G, ScambiaG, Picchio MC, Alder H, Godwin AK, Croce CM: Parkin, a geneimplicated in autosomal recessive juvenile parkinsonism, is a candi-date tumor suppressor gene on chromosome 6q25–q27. Proc NatlAcad Sci USA 2003, 100:5956–5961
30. Takahashi T, Sano B, Nagata T, Kato H, Sugiyama Y, Kunieda K,Kimura M, Okano Y, Saji S: Polo-like kinase 1 (PLK1) is overex-pressed in primary colorectal cancers. Cancer Sci 2003, 94:148–152
31. Ougolkov A, Zhang B, Yamashita K, Bilim V, Mai M, Fuchs SY,Minamoto T: Associations among beta-TrCP, an E3 ubiquitin ligasereceptor, beta-catenin, and NF-kappaB in colorectal cancer. J NatlCancer Inst 2004, 96:1161–1170
32. Sherr CJ, Roberts JM: CDK inhibitors: positive and negative regula-tors of G1-phase progression. Genes Dev 1999, 13:1501–1512
33. Spruck CH, Won KA, Reed SI: Deregulated cyclin E induces chro-mosome instability. Nature 1999, 401:297–300
34. Orford K, Orford CC, Byers SW: Exogenous expression of beta-catenin regulates contact inhibition, anchorage-independent growth,anoikis, and radiation-induced cell cycle arrest. J Cell Biol 1999,146:855–868
35. Jiang J, Struhl G: Regulation of the Hedgehog and Wingless signal-ling pathways by the F-box/WD40-repeat protein Slimb. Nature 1998,391:493–946
36. Lossos IS, Czerwinski DK, Alizadeh AA, Wechser MA, Tibshirani R,Botstein D, Levy R: Prediction of survival in diffuse large-B-cell lym-phoma based on the expression of six genes. N Engl J Med 2004,350:1828–1837
37. Lukas C, Sorensen CS, Kramer E, Santoni-Rugiu E, Lindeneg C,Peters JM, Bartek J, Lukas J: Accumulation of cyclin B1 requires E2F
1804 Lehman et alAJP May 2007, Vol. 170, No. 5
and cyclin-A-dependent rearrangement of the anaphase-promotingcomplex. Nature 1999, 401:815–818
38. Kim JM, Sohn HY, Yoon SY, Oh JH, Yang JO, Kim JH, Song KS, RhoSM, Yoo HS, Kim YS, Kim JG, Kim NS: Identification of gastriccancer-related genes using a cDNA microarray containing novelexpressed sequence tags expressed in gastric cancer cells. ClinCancer Res 2005, 11:473–482
39. Singhal S, Amin KM, Kruklitis R, DeLong P, Friscia ME, Litzky LA, PuttME, Kaiser LR, Albelda SM: Alterations in cell cycle genes in earlystage lung adenocarcinoma identified by expression profiling. Can-cer Biol Ther 2003, 2:291–298
40. Sorensen CS, Lukas C, Kramer ER, Peters JM, Bartek J, Lukas J:Nonperiodic activity of the human anaphase-promoting complex-Cdh1 ubiquitin ligase results in continuous DNA synthesis uncoupledfrom mitosis. Mol Cell Biol 2000, 20:7613–7623
41. Gunawardena RW, Siddiqui H, Solomon DA, Mayhew CN, Held J,Angus SP, Knudsen ES: Hierarchical requirement of SWI/SNF inretinoblastoma tumor suppressor-mediated repression of Plk1. J BiolChem 2004, 279:29278–29285
42. van Vugt MA, Medema RH: Getting in and out of mitosis with Polo-likekinase-1. Oncogene 2005, 24:2844–2859
43. Wang Q, Moyret-Lalle C, Couzon F, Surbiguet-Clippe C, Saurin JC,Lorca T, Navarro C, Puisieux A: Alterations of anaphase-promotingcomplex genes in human colon cancer cells. Oncogene 2003,22:1486–1490
44. Park KH, Choi SE, Eom M, Kang Y: Downregulation of the anaphase-promoting complex (APC/C)7 in invasive ductal carcinomas of thebreast and its clinicopathologic relationships. Breast Cancer Res2005, 7:R238–R247
45. Cahill DP, Lengauer C, Yu J, Riggins GJ, Willson JK, Markowitz SD,Kinzler KW, Vogelstein B: Mutations of mitotic checkpoint genes inhuman cancers. Nature 1998, 392:300–303
46. Shin HJ, Baek KH, Jeon AH, Park MT, Lee SJ, Kang CM, Lee HS, YooSH, Chung DH, Sung YC, McKeon F, Lee CW: Dual roles of humanBubR1, a mitotic checkpoint kinase, in the monitoring of chromo-somal instability. Cancer Cell 2003, 4:483–497
47. Hanks S, Coleman K, Reid S, Plaja A, Firth H, Fitzpatrick D, Kidd A,
Mehes K, Nash R, Robin N, Shannon N, Tolmie J, Swansbury J,Irrthum A, Douglas J, Rahman N: Constitutional aneuploidy and can-cer predisposition caused by biallelic mutations in BUB1B. Nat Genet2004, 36:1159–1161
48. Agathanggelou A, Cooper WN, Latif F: Role of the Ras-associationdomain family 1 tumor suppressor gene in human cancers. CancerRes 2005, 65:3497–3508
49. Anand S, Penrhyn-Lowe S, Venkitaraman AR: AURORA-A amplifica-tion overrides the mitotic spindle assembly checkpoint, inducingresistance to Taxol. Cancer Cell 2003, 3:51–62
50. Ren B, Cam H, Takahashi Y, Volkert T, Terragni J, Young RA,Dynlacht BD: E2F integrates cell cycle progression with DNA repair,replication, and G(2)/M checkpoints. Gene Dev 2002, 16:245–256
51. Bischoff JR, Anderson L, Zhu Y, Mossie K, Ng L, Souza B, SchryverB, Flanagan P, Clairvoyant F, Ginther C, Chan CS, Novotny M, SlamonDJ, Plowman GD: A homologue of Drosophila aurora kinase is onco-genic and amplified in human colorectal cancers. EMBO J 1998,17:3052–3065
52. Tanaka T, Kimura M, Matsunaga K, Fukada D, Mori H, Okano Y:Centrosomal kinase AIK1 is overexpressed in invasive ductal carci-noma of the breast. Cancer Res 1999, 59:2041–2044
53. Sen S, Zhou H, Zhang RD, Yoon DS, Vakar-Lopez F, Ito S, Jiang F,Johnston D, Grossman HB, Ruifrok AC, Katz RL, Brinkley W, CzerniakB: Amplification/overexpression of a mitotic kinase gene in humanbladder cancer. J Natl Cancer Inst 2002, 94:1320–1329
54. Latres E, Chiarle R, Schulman BA, Pavletich NP, Pellicer A, InghiramiG, Pagano M: Role of the F-box protein Skp2 in lymphomagenesis.Proc Natl Acad Sci USA 2001, 98:2515–2520
55. Knecht R, Elez R, Oechler M, Solbach C, von Ilberg C, Strebhardt K:Prognostic significance of polo-like kinase (PLK) expression in squa-mous cell carcinomas of the head and neck. Cancer Res 1999,59:2794–2797
56. Weichert W, Kristiansen G, Winzer KJ, Schmidt M, Gekeler V, NoskeA, Muller BM, Niesporek S, Dietel M, Denkert C: Polo-like kinaseisoforms in breast cancer: expression patterns and prognostic impli-cations. Virchows Arch 2005, 446:442–450
APC/C Substrates Are Overexpressed in Tumors 1805AJP May 2007, Vol. 170, No. 5