on the use of digital image correlation for the analysis ... · franc¸ois hild, amine bouterf,...
TRANSCRIPT

HAL Id: hal-01674588https://hal.archives-ouvertes.fr/hal-01674588
Submitted on 3 Jan 2018
HAL is a multi-disciplinary open accessarchive for the deposit and dissemination of sci-entific research documents, whether they are pub-lished or not. The documents may come fromteaching and research institutions in France orabroad, or from public or private research centers.
L’archive ouverte pluridisciplinaire HAL, estdestinée au dépôt et à la diffusion de documentsscientifiques de niveau recherche, publiés ou non,émanant des établissements d’enseignement et derecherche français ou étrangers, des laboratoirespublics ou privés.
On the Use of Digital Image Correlation for the Analysisof the Dynamic Behavior of Materials
François Hild, Amine Bouterf, Pascal Forquin, Stéphane Roux
To cite this version:François Hild, Amine Bouterf, Pascal Forquin, Stéphane Roux. On the Use of Digital Image Corre-lation for the Analysis of the Dynamic Behavior of Materials. The Micro-World Observed by UltraHigh-Speed Cameras, pp.185-206, 2018, 978-3-319-61490-8. <hal-01674588>
On the Use of Digital Image Correlation for theAnalysis of the Dynamic Behavior of Materials
Francois Hild, Amine Bouterf, Pascal Forquin and Stephane Roux
Abstract The present chapter is devoted to the analysis of the mechanical behaviorof materials subjected to dynamic loadings via digital image correlation (DIC). Thismeasurement technique provides 2D or 3D displacement fields that can be evalu-ated thanks to the use of high-speed cameras. Various declinations of DIC are firstpresented. Uncertainty quantifications are also discussed. Last, different examplesillustrate how DIC can be used to analyze and quantify deformation, damage andfracture mechanisms of brittle and ductile materials.
1 Introduction
The development of reliable measurement techniques is very important when char-acterizing heterogeneous mechanical manifestations at various scales. Solids, bethey heterogeneous or homogeneous under complex loading, induce deformationswhose multiscale analysis is needed to relate them to the underlying microstructureand / or to the type of prescribed loading. From the knowledge of kinematic fields,it is possible to identify global and local material parameters, or validate materialmodels and numerical tools [1].
Different techniques are used to measure displacement and strain fields under dy-namic loading conditions. When utilizing optics concepts, and when coupled withmechanics, it is referred to as photomechanics [2, 3, 1]. Photoelasticity was the firsttechnique that was used to study dynamic phenomena [4, 5, 6, 7], in particular prop-
Amine Bouterf, Francois Hild, Stephane RouxLaboratoire de Mecanique et Technologie (LMT)ENS Paris-Saclay / CNRS / Universite Paris-Saclay, 61 avenue du President Wilson94235 Cachan cedex, France, e-mail: [email protected]
Pascal ForquinLaboratoire 3SR, Universite Grenoble Alpes, 1270 rue de la piscine, Domaine Universitaire38400 Saint Martin d’Heres, France, e-mail: [email protected]
1
2 Francois Hild, Amine Bouterf, Pascal Forquin and Stephane Roux
agating cracks [8]. Moire interferometry was then introduced [9, 10]. Although itspractical use was more difficult than photoelasticity [11], some applications wereshown in the 90s [11, 12, 13]. In contrast to photoelasticity, this technique as wellas the following ones, deal with the actual material of interest and not a substitutechosen for its birefringence properties. Caustics proved to be very useful for es-timating stress intensity factors and crack propagation velocities [14, 15, 16, 17].Digital image correlation [18], high-speed photography of laser and white lightspeckles [19, 20, 21] started being utilized to analyze dynamic tests in the 80s. Inter-ferometric holography [22] and shearography [23] were subsequently introduced.
In the following, the measurement technique that is nowadays becoming verypopular, namely, digital image correlation and its extensions will be presented. InSection 2, the general principles of image correlation and stereocorrelation are in-troduced. These techniques are utilized very frequently to monitor dynamic experi-ments with high-speed cameras. In many cases, the displacement (and strain) fieldsare not the final data to be assessed. They are generally post-processed to analyzethe deformation and failure of various materials subjected to dynamic loadings. Dif-ferent case studies dealing with such analyses of the dynamic behavior of materialsare discussed in Section 3.
2 Digital image correlation
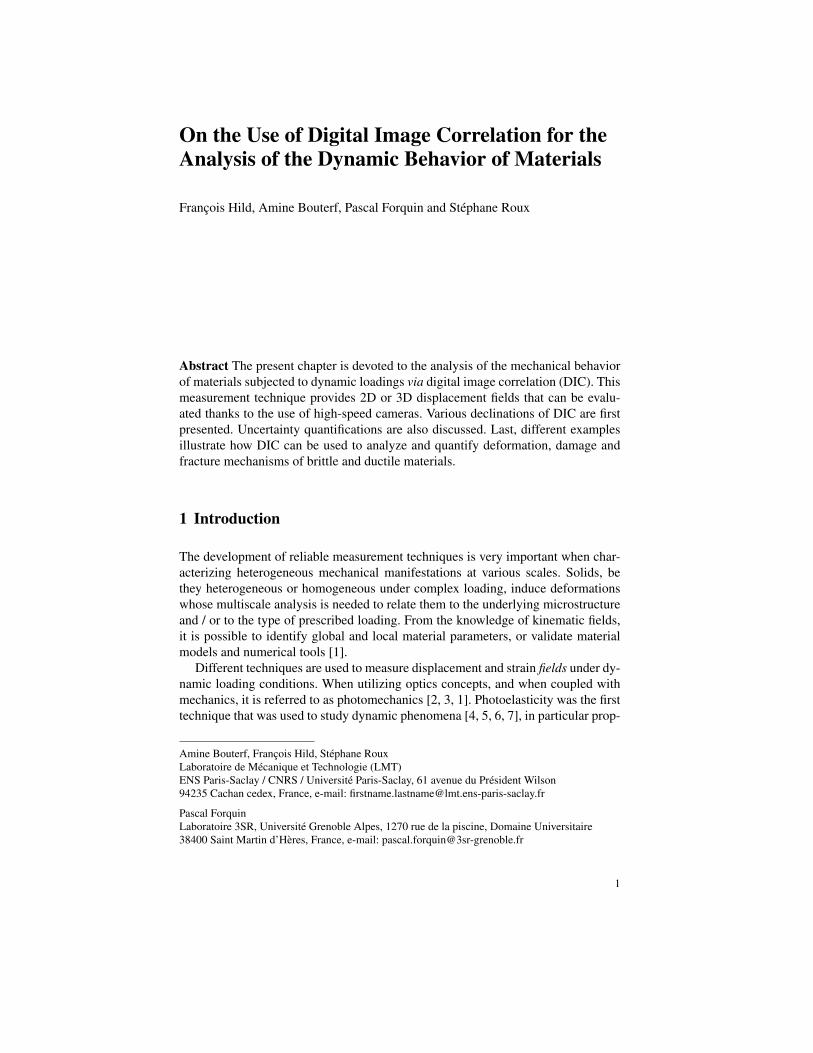
Digital image correlation consists in measuring displacement (or velocity) fields byregistering (or correlating) a series of digital images (i.e., a set of pixels whose graylevel is known). The first step of this and related approaches is the acquisition of thepictures during the experiment by use of cameras. It requires good quality imagingsystems. It is to be emphasized that image correlation is not specific to — but can beused with — high speed imaging. High speed imaging opens up a range of new pos-sibilities to tackle dynamic or impact mechanical behavior, but the basic principle ofDIC in itself is unchanged. It is however fair to add that the usually small image defi-nition and its potentially high noise level have motivated specific developments suchas spatiotemporal regularization, which will be discussed below. Figure 1 shows twoexperimental configurations that were used in some of the cases discussed hereinwith a single high-speed camera (FASTCAM APX RS, Photron, Japan). Powerfullights (Dedolight 400D, Dedotec, Germany) were utilized to monitor experimentsperformed with in-house Hopkinson bars or a high-speed tension/compression test-ing machine (Dytesys, France).
2.1 Incremental DIC
Digital pictures are represented by matrices of (pixel) position xxx, which are takenat different instants of time t. Incremental DIC (or 2D-DIC) is the first image cor-
On the Use of DIC for the Analysis of the Dynamic Behavior of Materials 3
(a) taken from [24]
(b) courtesy of N. Swiergiel (Airbus Group Innovations)
Fig. 1 Two experimental configurations using one high-speed camera (FASTCAM APX RS,Photron, Japan) and powerful lighting (Dedolight 400D, Dedotec, Germany). The monitored sam-ple is encircled in red
relation technique that was introduced in the early 1980s [25, 26, 27]. Only onecamera (or imaging system) facing the region of interest is considered (Fig. 1) sothat 2D displacements are measured. Its first use under dynamic loading conditionswas reported in 1985 [18]. The stress intensity factor was evaluated and (favorably)compared to estimations with caustics. With the development of digital high-speedcameras, 2D-DIC has become popular for monitoring dynamic tests since the early21st century (see e.g., Refs. [28, 29, 24, 30, 31, 32, 33]).
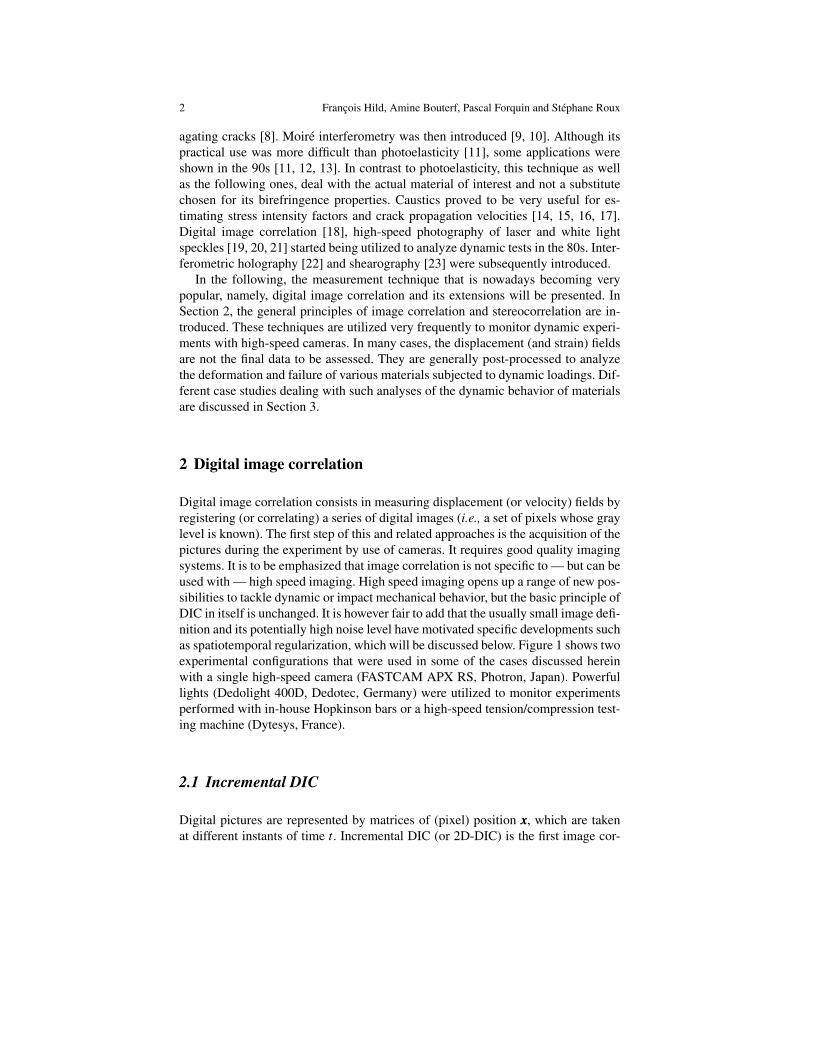
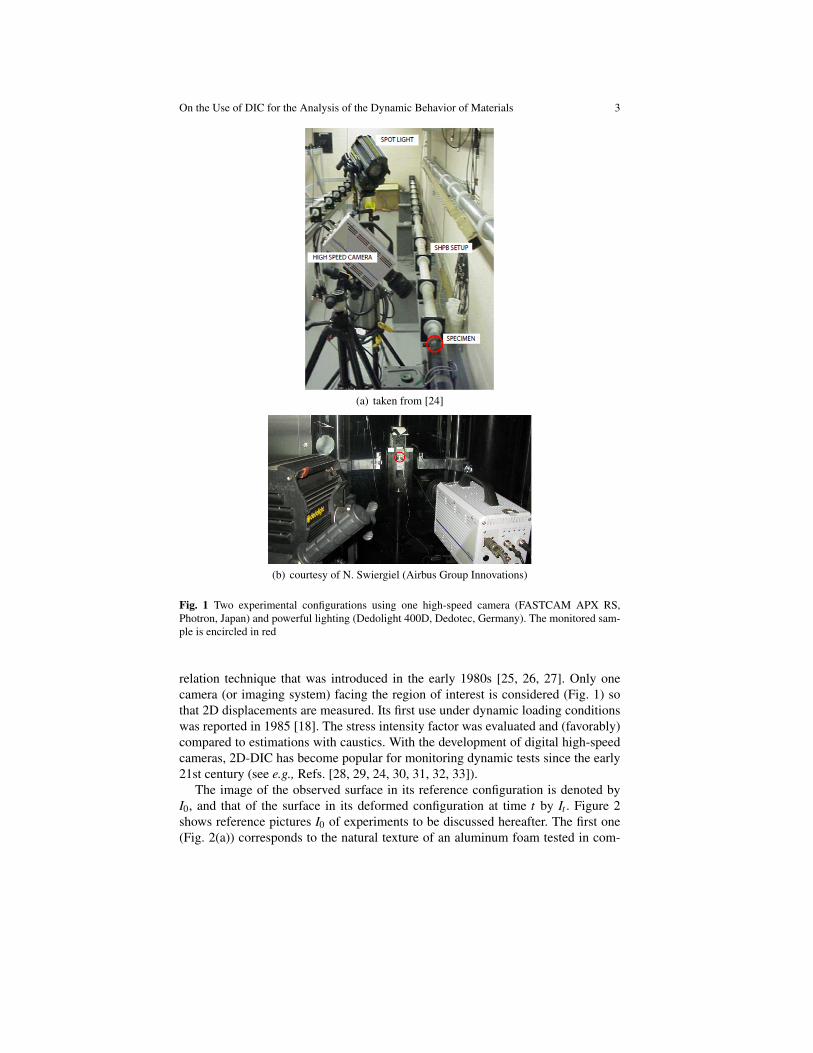
The image of the observed surface in its reference configuration is denoted byI0, and that of the surface in its deformed configuration at time t by It . Figure 2shows reference pictures I0 of experiments to be discussed hereafter. The first one(Fig. 2(a)) corresponds to the natural texture of an aluminum foam tested in com-
4 Francois Hild, Amine Bouterf, Pascal Forquin and Stephane Roux
(a) Al foam (b) concrete (c) copper cylinder
(d) aluminum (e) composite
Fig. 2 Examples of pictures analyzed herein
pression (see Fig. 1(a)). Figure 2(b) shows a concrete sample fractured in dynamicspalling test. The random pattern was obtained by spraying a uniform white coatingof paint and black dots. The third one (Fig. 2(c)) is one part of an image acquiredduring cylindrical expansion (Fig. 2(c)). In that case a sponge was used to deposit avery thin white speckle. Figure 2(d) shows the surface of a cylindrical sample to betested in Hopkinson bars (Fig. 2(b)), which was sprayed with B/W paint to create arandom pattern. Similarly, Fig. 2(e) shows the surface of a composite sample to betested in tension.
Pictures I0 and It are related by
I0(xxx) = It(xxx+uuu(xxx, t))+n(xxx, t), (1)
where uuu(xxx, t) is the displacement at pixel xxx and time t, and n(xxx, t) is a randomcomponent (e.g., photon noise, digitization when pictures are obtained by CCDor CMOS sensors, see Chapter 3). When n = 0, Eq. (1) corresponds to the localbrightness conservation (or gray level conservation). The determination of uuu is anill-posed problem when no additional hypotheses are made. The information at hand(i.e., gray level of each pixel) does not allow for the evaluation of a vector field atthe pixel scale. The registration is almost never performed down to the pixel level,but on a set of pixels referred to as zone of interest (ZOI), or on the region of interest(ROI) itself. Let us introduce the functional R of a trial displacement uuu
R[uuu] = ‖I0− It(•+uuu)‖2Ω , (2)
On the Use of DIC for the Analysis of the Dynamic Behavior of Materials 5
where “•” denotes a dummy variable, Ω the considered domain where the reg-istration will be performed (i.e., either any ZOI or the whole ROI). This settingcorresponds to a weak formulation of the brightness conservation. When the usualL2 norm is considered, i.e., ‖I0‖2
Ω= ∑Ω |I0(xxx)|2, the determination of uuu consists in
minimizing the sum of quadratic differences for, say, a rigid body translation [34].The functional Rc
Rc[uuu] = ∑Ω
[I0(xxx)− It(xxx+uuu(xxx, t))]2 (3)
is minimized with respect to the degrees of freedom of the sought displacementfield. When the correct kinematics is found, and if n = 0 [see Eq. (1)], Rc vanishes.Any offset will indicate that the registration was not perfect.
2.1.1 Local approach
Let us assume that uuu is a rigid body translation. The minimization of Eq. (3) can besolved with correlation techniques that consist in maximizing the superposition ofshifted copies of It and I0 [25, 26, 27]. The previous minimization is equivalent tomaximizing (in the limit of large ZOIs) the quantity c(uuu)
c(uuu) = (I0 ? It)(uuu)≡ ∑ZOI
I0(xxx)It(xxx+uuu) (4)
where ? denotes the cross-correlation product. The value that maximizes the cross-correlation product is an estimate of the unknown translation vector. The evaluationof the correlation product can be performed either in the reference space [27, 35] orFourier space [36, 37, 38]. The measured field is composed of a set of displacementsassigned to the center of all analyzed ZOIs.
Let us note that the hypothesis made so far (i.e., piece-wise constant displace-ments) can be relaxed. Nowadays academic and commercial correlation codes uselocal displacement interpolations of degree one or higher. However, only the meanvalue is kept and assigned to the center of each ZOI. It allows more complex featuresto be better captured, and leads to uncertainties whose amplitude depends, amongothers, on the texture and its gray level interpolation, but also on the type of localinterpolation, and on the ZOI size [39, 47].
2.1.2 Global approach
The space of trial displacements EM is introduced and satisfies the continuity re-quirement usually valid in experiments. The sought displacement is written as alinear combination in a basis of EM , namely, uuu(xxx, t) = ∑i υi(t)ΨΨΨ i(xxx). The functionalto minimize now reads
Rc[υυυ] = ∑ROI
[I0(xxx)− It(xxx+υi(t)ΨΨΨ i(xxx))]2 (5)

6 Francois Hild, Amine Bouterf, Pascal Forquin and Stephane Roux
where υυυ is the column vector that gathers all unknown amplitudes υi(t). More-over, the displacement field is generally evaluated by successive iterations and cor-rections [40]. Let us assume that I0 and It be sufficiently regular at the smallestscales, and that the displacement corrections δuuu be small so that a first order Tay-lor expansion is possible, and Rc is a quadratic form of the unknown displacementcorrections
Rc[δυυυ] = ∑ROI
[I0(xxx)− It(xxx)−δυi(t)ΨΨΨ i(xxx) ·∇∇∇I0(xxx)]2 (6)
where It denotes the corrected deformed picture (i.e., It(xxx) = It(xxx+u(n)(xxx, t)) for thecurrent evaluation of the displacement field at iteration n), and ∇∇∇It(xxx+u(n)(xxx, t))≈∇∇∇I0(xxx)). The extremality condition for each amplitude υi(t) reads[
∑ROI
(∇∇∇I0 ·ΨΨΨ i)(xxx)(∇∇∇I0 ·ΨΨΨ k)(xxx)
]υk(t) = ∑
ROI(I0− It)(xxx)(∇∇∇I0 ·ΨΨΨ i)(xxx) (7)
This linear system can be written in matrix-vector form
Mikυk(t) = ai (8)
The regularity condition, which seems restrictive, can still allow non differentiabletextures to be analyzed within the present framework [41]; the regularity of uuu al-lows one to bypass in many cases that of I0 by integrations by parts and filtering.By implementing multiscale approaches to address the issue of large displacementsand strains, the high frequency displacement components are progressively intro-duced [38, 42].
At this level of generality, various measurement spaces EM can be chosen. Thisis one of the advantages of the present framework. For example, Fourier decompo-sitions of the displacement field [43, 41] were considered to capture displacementfluctuations. A very often used alternative in solid mechanics is to discretize dis-placement fields with finite elements. The simplest choice when dealing with pic-tures is to consider 4-noded quadrilaterals with bilinear displacement interpolation(i.e., Q4-DIC [42]). More recently, unstructured meshes made of 3-noded triangleshave also been utilized [44, 45].
2.1.3 Uncertainty quantification
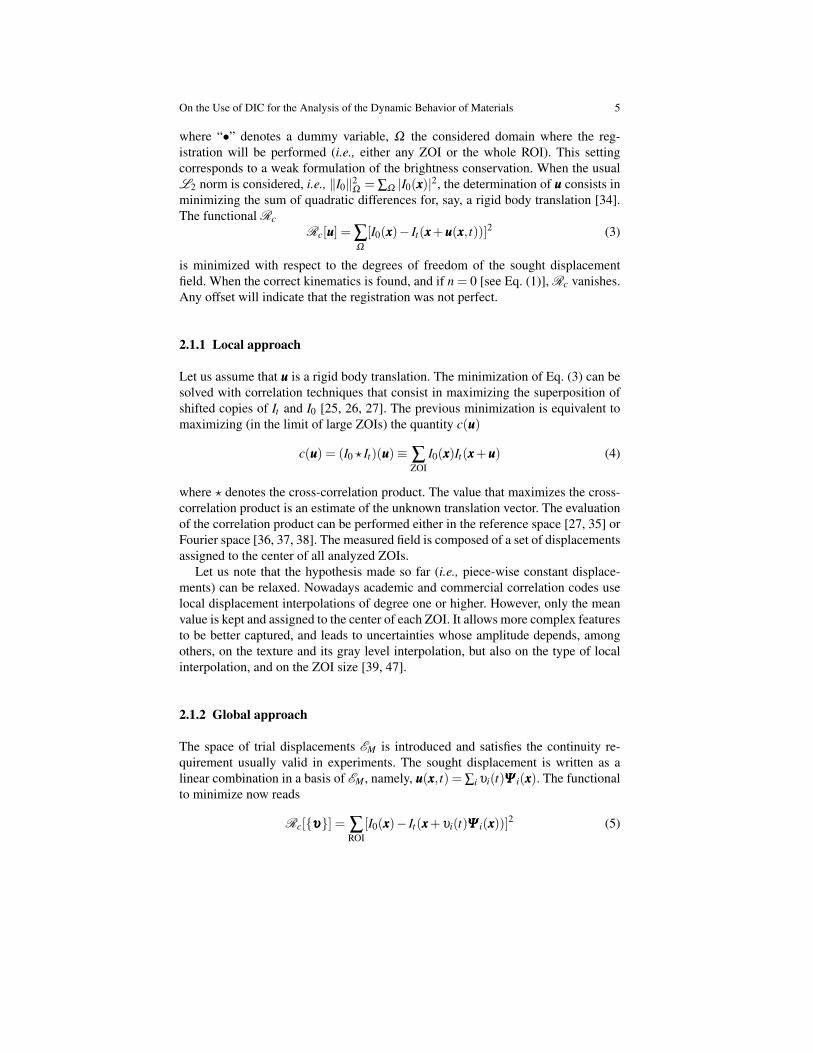
One key aspect associated with kinematic measurements is related to the estima-tion of displacement uncertainties [39]. In particular, the hardware associated withhigh-speed cameras plays a significant role in the overall performance of such equip-ment [46]. Figure 3 compares the measurement uncertainty for three different high-speed and ultra high-speed cameras with different Q4 element sizes. This analy-sis was performed by acquiring a series of pictures in the reference configurationprior to an actual experiment. All the experimental conditions (e.g., acquisition pa-
On the Use of DIC for the Analysis of the Dynamic Behavior of Materials 7
rameters, lighting (Dedocool COOLH, Dedotec, Germany)) were identical to thesubsequent test. This series of images was analyzed via Q4-DIC and the standarddisplacement uncertainty was obtained.
Fig. 3 Uncertainty quantification for three different high-speed cameras. For a given camera, thehighest points correspond to a higher number of frames per second. Reference picture I0 shot bythe three analyzed cameras are also shown
The larger the element size, the lower the measurement uncertainty, which isexpected. However, the three cameras do not yield the same type of result. Twocameras (i.e., B and C) lead to standard displacement uncertainties that are mostlycontrolled by acquisition noise [47]
σu =
√6κσI pGI`
(9)
where κ is a constant of the order of 1 that depends whether it is an inner node,edge node or corner note, p denotes the physical size of one pixel, and GI the rootmean square gradient of the reference picture I0. It is believed that camera A hard-ware leads to displacement fields that do not have a random signature associatedwith acquisition noise. Last, it is worth noting that for any camera, the higher theacquisition rate, the higher the measurement uncertainty (i.e., the lower the signalto noise ratio).
2.2 Spatiotemporal DIC
Virtually all applications of DIC for the investigation of dynamic experiments havenot required specific algorithmic developments in comparison with quasi static tests.However, many high-speed cameras lead to image definitions that become very

8 Francois Hild, Amine Bouterf, Pascal Forquin and Stephane Roux
small as the number of frames per second increases. To compensate for this de-crease in spatial definition, spatiotemporal algorithms have been introduced [48, 49]in which movies are analyzed.
An additional way of regularizing correlation procedures is to analyze a series ofpictures (instead of an image pair in the previous section). This approach is referredto as spatiotemporal correlation (or 2D + t DIC) since the displacement field is nowevaluated as a space / time decomposition uuu(xxx, t) = ∑i ∑ j υi jΨΨΨ i(xxx)φ j(t). The sum ofsquared differences
Rc[υυυ] = ∑[t0,tmax]
∑ROI
[I0(xxx)− It(xxx+υi jΨΨΨ i(xxx)φ j(t))]2 (10)
is minimized with respect to the unknown degrees of freedom υi j over the ROI andtime interval [t0, tmax]. The time discretization may consist of linear temporal ele-ments extending over n frames so that a spatiotemporal analysis considers ‘volumes’of size `2n (expressed in voxels by equivalence with volume correlation) when thespatial discretization is based upon 4-noded quadrilaterals of edge size `.
To illustrate the gain in terms of displacement uncertainty, a picture (Fig. 2(e))acquired with a high-speed camera (FASTCAM APX RS, Photron, Japan) is consid-ered. Its definition is rather small (i.e., 224×449 pixels) and the analyzed ROI hasa definition of 175×336 pixels. In the following a purely artificial uncertainty anal-ysis is performed. It consists of adding to the picture of Fig. 2(e) a Gaussian whitenoise (zero mean, standard deviation σI equal to 3 % of the dynamic range) for eachpicture of the artificial movie. This level of noise is quite high for illustration pur-poses and also to check whether a priori predictions of the standard displacementuncertainty [49] are still valid for a series of n pictures per time step in a singleanalysis
σu =
√2σI pGI`
√α +
β
n(11)
where α +β is of the order of 3, and the lower α the higher the gain when consid-ering a spatiotemporal analysis.
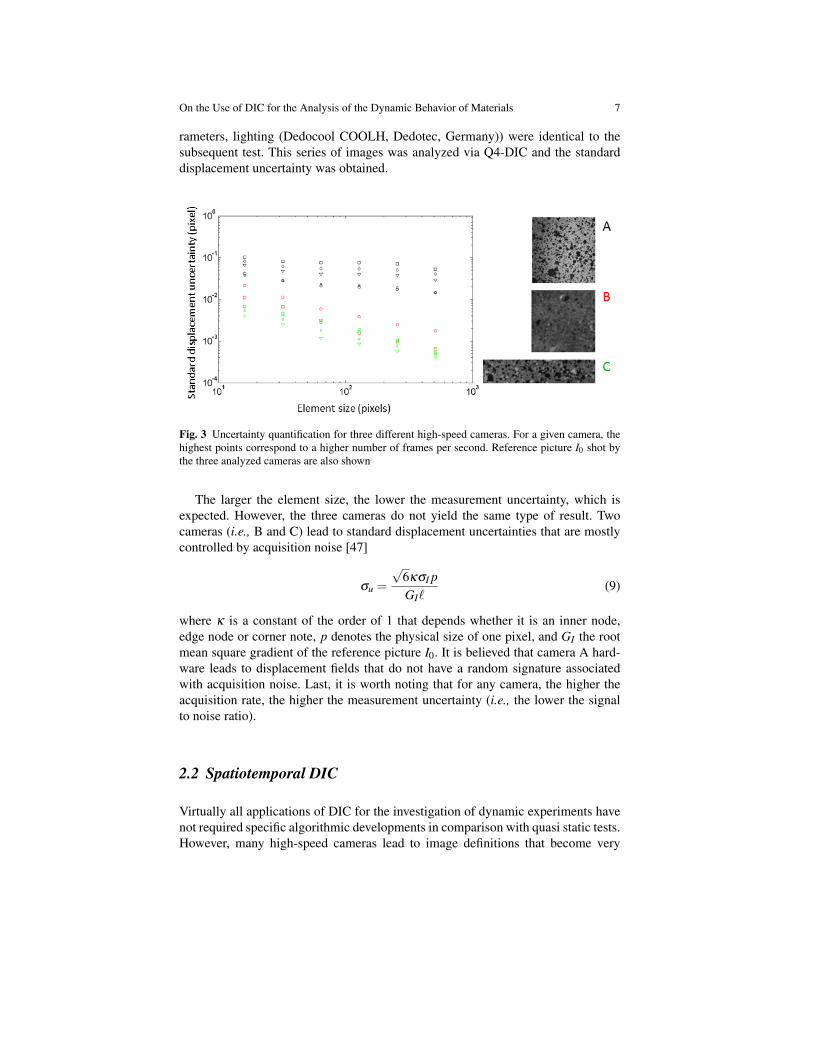
Figure 4 shows a comparison between the standard displacement uncertainty σuachieved with incremental (n = 1) and spatiotemporal (n > 1) analyses. As expectedfrom the previous result, the larger the number of pictures per time step (i.e., thelarger the size of the spatiotemporal volume), the smaller the standard displacementuncertainty. The fact that it levels off for large spatiotemporal volumes is due to thefirst picture that is also corrupted by noise. In the present case, a 30 % gain can beexpected when large spatiotemporal volumes are considered when compared withan incremental analysis.
On the Use of DIC for the Analysis of the Dynamic Behavior of Materials 9
Fig. 4 Standard displacement uncertainty σu as a function of the spatiotemporal volume. Compar-ison between incremental and spatiotemporal approaches
2.3 Stereocorrelation
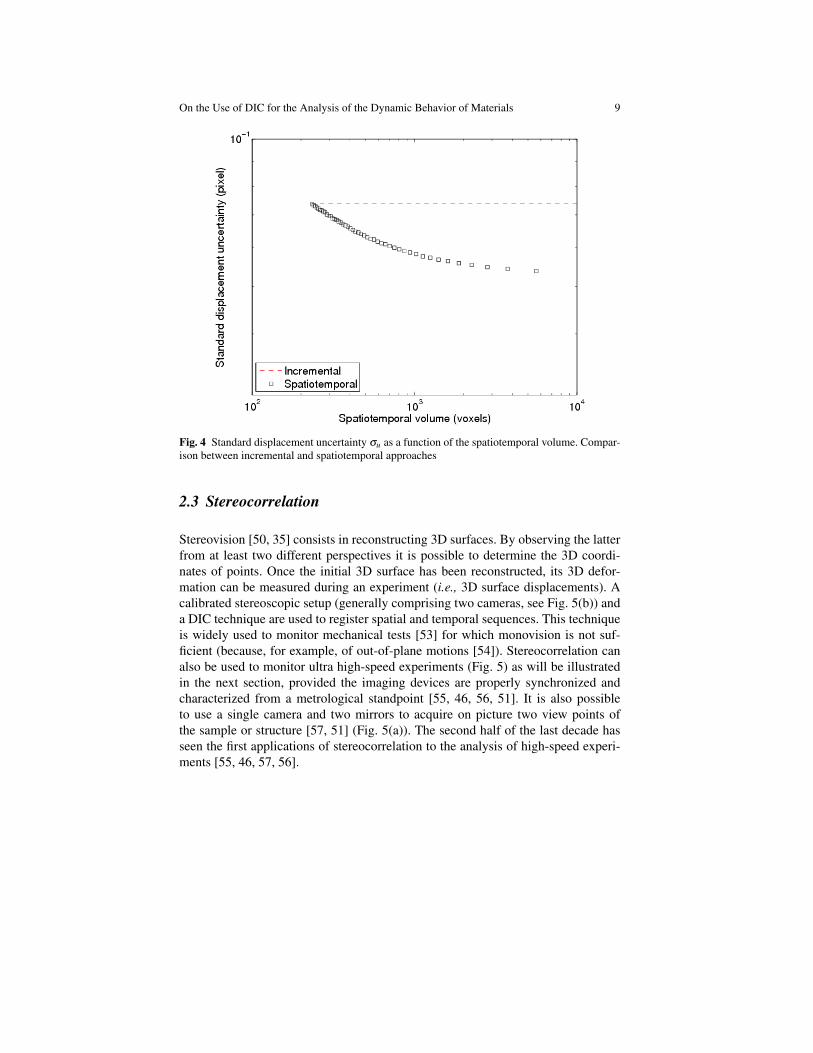
Stereovision [50, 35] consists in reconstructing 3D surfaces. By observing the latterfrom at least two different perspectives it is possible to determine the 3D coordi-nates of points. Once the initial 3D surface has been reconstructed, its 3D defor-mation can be measured during an experiment (i.e., 3D surface displacements). Acalibrated stereoscopic setup (generally comprising two cameras, see Fig. 5(b)) anda DIC technique are used to register spatial and temporal sequences. This techniqueis widely used to monitor mechanical tests [53] for which monovision is not suf-ficient (because, for example, of out-of-plane motions [54]). Stereocorrelation canalso be used to monitor ultra high-speed experiments (Fig. 5) as will be illustratedin the next section, provided the imaging devices are properly synchronized andcharacterized from a metrological standpoint [55, 46, 56, 51]. It is also possibleto use a single camera and two mirrors to acquire on picture two view points ofthe sample or structure [57, 51] (Fig. 5(a)). The second half of the last decade hasseen the first applications of stereocorrelation to the analysis of high-speed experi-ments [55, 46, 57, 56].
10 Francois Hild, Amine Bouterf, Pascal Forquin and Stephane Roux
(a) taken from [51] (b) taken from [52]
Fig. 5 Experimental configurations using either (a) one rotating mirror framing camera (LCA,France) or (b) two FASTCAM APX RS (Photron, Japan) cameras for stereocorrelation analyses.The monitored sample is encircled in red
3 Applications
3.1 Shock enhancement of cellular materials
The analysis of the deformation of different foams under shock loading is possiblethanks to 2D-DIC.
(a) (b) (c)
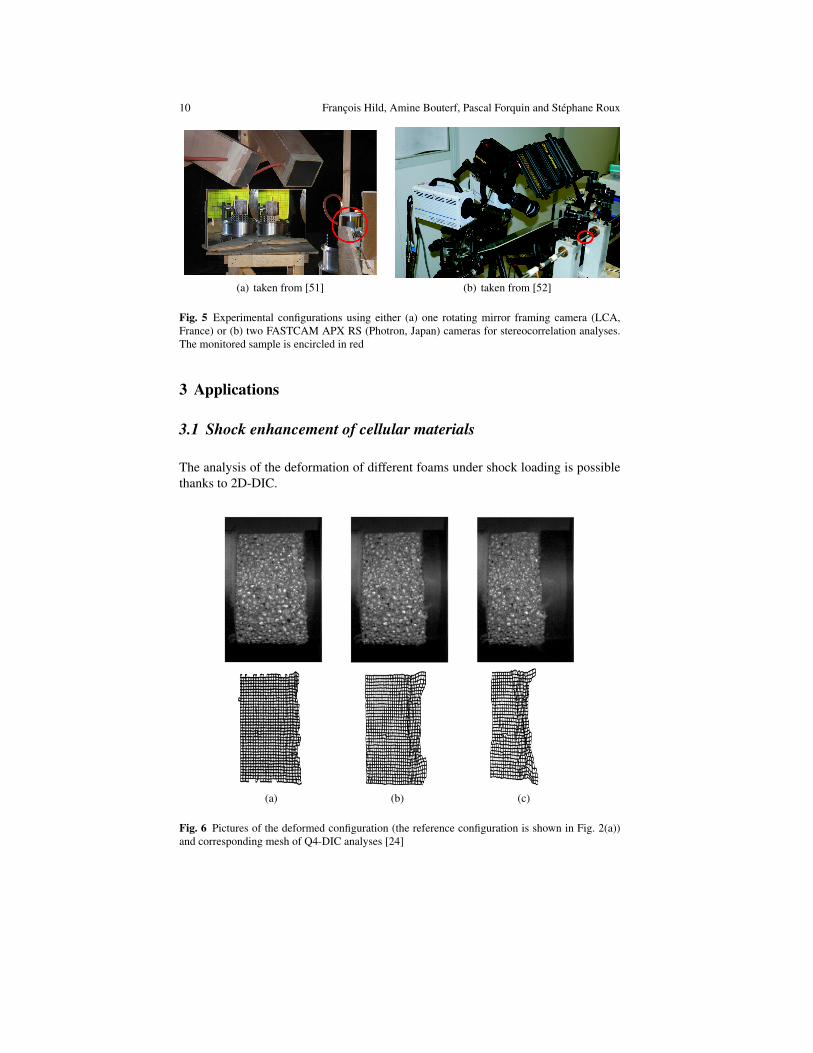
Fig. 6 Pictures of the deformed configuration (the reference configuration is shown in Fig. 2(a))and corresponding mesh of Q4-DIC analyses [24]

On the Use of DIC for the Analysis of the Dynamic Behavior of Materials 11
An original testing procedure using a large diameter Nylon Hopkinson bar is in-troduced. Tests under two different configurations (i.e., pressure bar behind/ahead ofthe assumed shock front) at the same shock speed are used to obtain the force/timehistories behind and ahead of the shock front within cellular material samples [24].Figure 1(a) shows one of the experimental configurations monitored by a high-speed camera (FASTCAM APX RS, Photron, Japan) for a tested aluminum foam(Fig. 2(a)). One of the two Dedocool 400D (Dedotec, Germany) lighting systemsis also shown. A shock front is clearly revealed in the Q4-DIC analysis shown inFig. 6 for a rather small impact velocity (here of the order of 50 m/s). From suchtype of data it could be shown that the experimentally observed shock enhancementwas not due to the foam behavior but to a structural effect [58].
3.2 Dynamic tensile damage and cracking of geomaterials
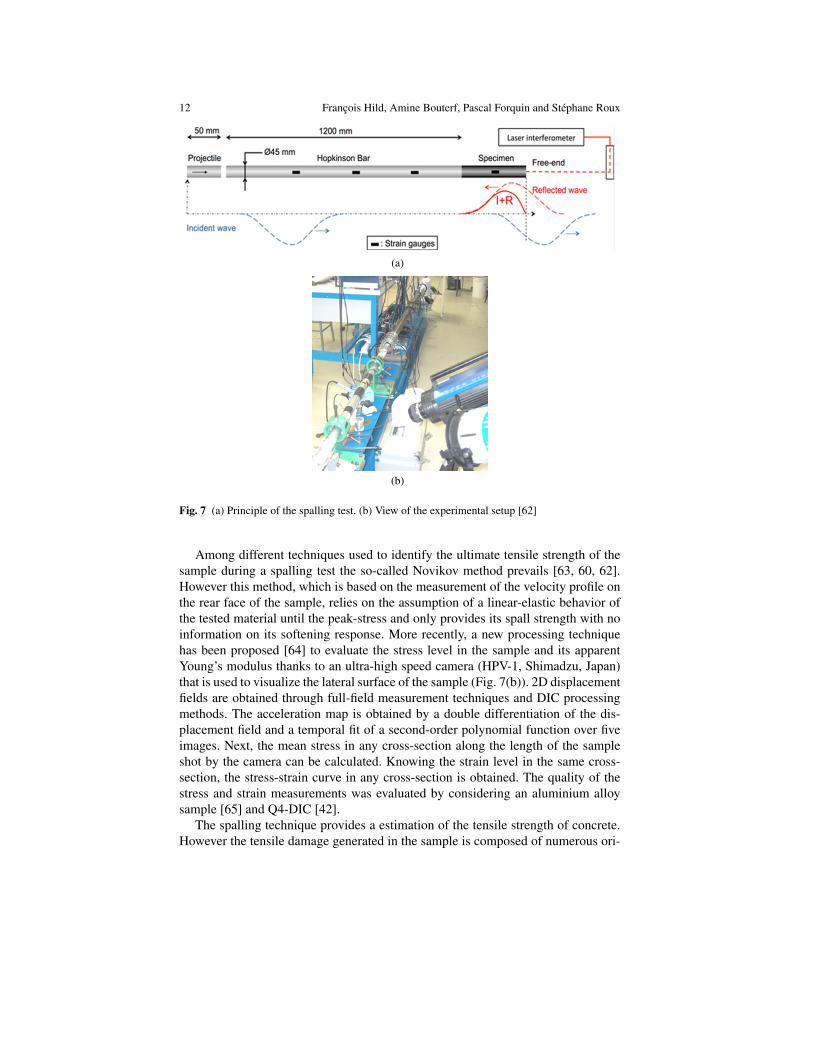
For the last two decades, spalling techniques have been widely employed for inves-tigating the tensile strength of geomaterials (e.g., standard concrete, high strengthconcrete, mortars, rocks) at strain rates ranging from 20 s−1 to 200 s−1 [59, 60, 61,62]. The experimental setup consists of using a single Hopkinson pressure bar (i.e.,input bar) that is placed in contact with the tested sample. A short compressive pulse(blue dashed line, Fig. 7(a)), which is generated by a small explosive charge or theimpact of a short projectile, propagates through the Hopkinson bar and the sampleand reflects back at its free end as a tensile pulse (red dashed line, Fig. 7(a)). Whenthe reflected pulse exceeds in amplitude the incident compressive pulse, a tensileloading is applied to the sample and causes its failure.
12 Francois Hild, Amine Bouterf, Pascal Forquin and Stephane Roux
(a)
(b)
Fig. 7 (a) Principle of the spalling test. (b) View of the experimental setup [62]
Among different techniques used to identify the ultimate tensile strength of thesample during a spalling test the so-called Novikov method prevails [63, 60, 62].However this method, which is based on the measurement of the velocity profile onthe rear face of the sample, relies on the assumption of a linear-elastic behavior ofthe tested material until the peak-stress and only provides its spall strength with noinformation on its softening response. More recently, a new processing techniquehas been proposed [64] to evaluate the stress level in the sample and its apparentYoung’s modulus thanks to an ultra-high speed camera (HPV-1, Shimadzu, Japan)that is used to visualize the lateral surface of the sample (Fig. 7(b)). 2D displacementfields are obtained through full-field measurement techniques and DIC processingmethods. The acceleration map is obtained by a double differentiation of the dis-placement field and a temporal fit of a second-order polynomial function over fiveimages. Next, the mean stress in any cross-section along the length of the sampleshot by the camera can be calculated. Knowing the strain level in the same cross-section, the stress-strain curve in any cross-section is obtained. The quality of thestress and strain measurements was evaluated by considering an aluminium alloysample [65] and Q4-DIC [42].
The spalling technique provides a estimation of the tensile strength of concrete.However the tensile damage generated in the sample is composed of numerous ori-

On the Use of DIC for the Analysis of the Dynamic Behavior of Materials 13
ented cracks that make their individual study and analysis very difficult. It is thereason why an experimental method referred to as “rocking spalling test” was pro-posed to investigate the dynamic propagation of a single crack in concrete samplesunder dynamic tensile loading [66]. The previous spalling setup is employed to ap-ply a short compressive pulse to the sample. A parallelepiped is used instead ofcylinder in which two notches are machined. The largest notch provides a “rocking”effect that produces a fast and local dynamic tensile loading in the zone near the tipof the small notch. The geometry of the specimen (size and location of notches) isshown in Fig. 8(a).
(a)
(b)
Fig. 8 (a) Specimen geometry used in rocking spalling tests. (b) Experimental setup used fordynamic crack propagation test [66]

14 Francois Hild, Amine Bouterf, Pascal Forquin and Stephane Roux
This configuration allows a single unstable crack to be initiated despite the highloading rate. Experiments were conducted on dry and water saturated concrete sam-ples. The cracking inception and propagation can be visualized with an ultra-highspeed digital camera and quantified via DIC. The results show that in most cases asingle crack is indeed initiated on the small notch and propagates perpendicularlyto the loading axis. Furthermore, the cracking velocity was evaluated with dry andwater saturated concrete samples (i.e., ≈ 1300 m/s [66]).
3.3 Tensile test on composite material
The next example corresponds to an image sequence, which was acquired by ahigh-speed camera (FASTCAM APX RS, Photron, Japan) at 65,000 fps, of a ten-sile test (Fig. 1(b)) on a T700 carbon fiber / M21 epoxy matrix composite (theplies are oriented at ±45 with respect to the loading direction) with a high-speedtension/compression testing machine (Dytesys, France). The picture definition is224×449 pixels (Fig. 2(e)). This is a case where the spatiotemporal analysis is use-ful to enable for a small spatial resolution by enlarging the temporal resolution. Theexperiment is deemed difficult because cracks appear during the analyzed sequence.The hypothesis of displacement continuity in the spatial and temporal domains willthus be violated. A spatiotemporal analysis is run with Q4 spatial elements of equiv-alent length less than 5.4 pixels. This very small length can be used since the tem-poral axis is divided into 5 increments of 18 pictures each. With these parameters,the spatiotemporal volume of interest is of the order of 5.3 Mvoxels.
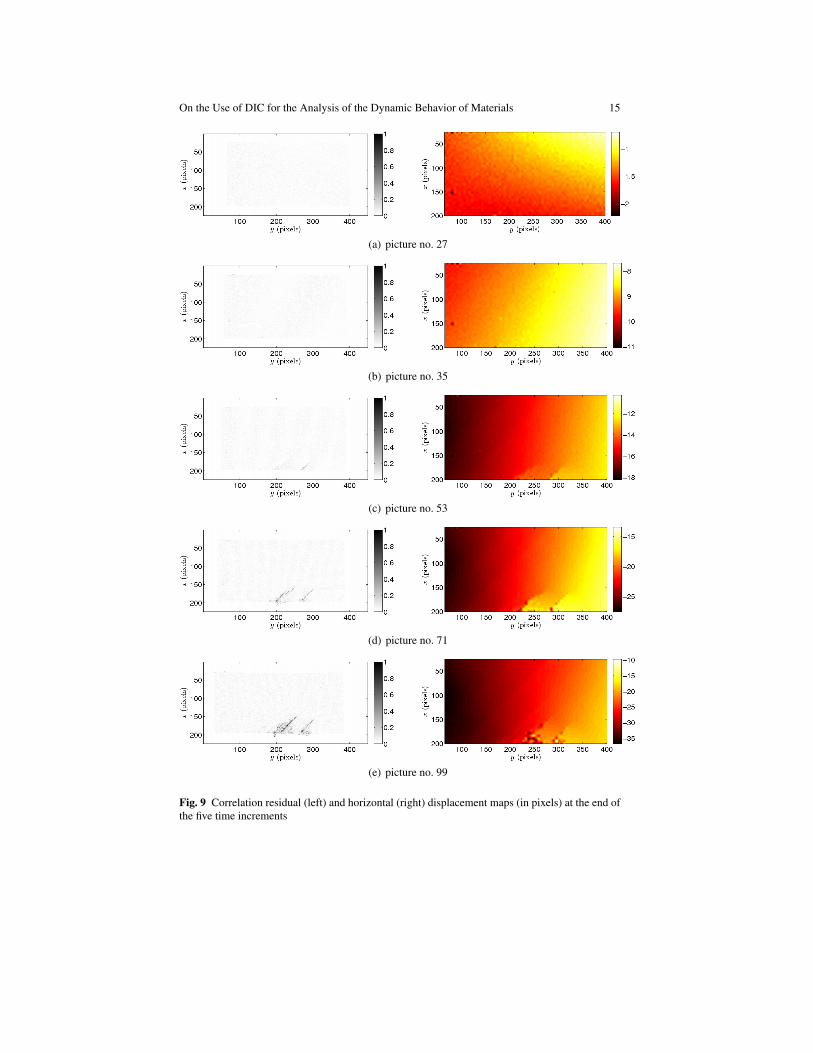
The global residuals are observed to be of the order of 3 % of the dynamic rangeof the reference picture for the analyzed sequence. There is a first regime duringwhich the mean correlation residual is of the order of 2.4 %. It corresponds to asituation where no cracks are observed (Fig. 9). The reason for the increase of themean correlation residual in the second regime (i.e., after picture no. 60) is due tocracking. This last conclusion can be drawn from the analysis of the normalizedresidual fields shown in Fig. 9. Cracks are clearly visible for the residual field cor-responding to picture no. 53. Multiple cracking zones are observed in the residualof picture no. 71. Two fully damaged zones are seen in the residual field of pictureno. 99. For the same pictures, the longitudinal displacement fields are also shownin Fig. 9. Multiple cracks are observed in the maps corresponding to picture no. 53.Their number increases and a lot of them are present in the maps corresponding topicture no. 99.
On the Use of DIC for the Analysis of the Dynamic Behavior of Materials 15
(a) picture no. 27
(b) picture no. 35
(c) picture no. 53
(d) picture no. 71
(e) picture no. 99
Fig. 9 Correlation residual (left) and horizontal (right) displacement maps (in pixels) at the end ofthe five time increments

16 Francois Hild, Amine Bouterf, Pascal Forquin and Stephane Roux
3.4 Analysis of necking
When axisymmetric samples are tested the use of stereocorrelation is desirable sinceout-of-plane motions generally occur. One counterexample was discussed in Sec-tion 3.1, namely, the foam Poisson’s ratio was close to zero so that very smallout-of-plane motions were expected, thereby making 2D-DIC approaches possible.When stereocorrelation techniques are chosen with two (or more) high-speed cam-eras (i.e., FASTCAM APX RS, Photron, Japan, in the present case), one key pointis to ensure the synchronization of the stereovision setup (Fig. 5(b)). The latter wasused to study necking in aluminum cylinders tested in high-speed tension. To reachstrain levels as high as 600 %, enhanced registration procedures had to be devel-oped [52]. Figure 10 shows two reconstructed 3D surfaces at the end of the test.Necking induces very severe radius variations.
(a) (b)
Fig. 10 Reconstructed 3D surfaces by enhanced stereocorrelation [52]. The color encodes thecurrent radius of the sample tested in tensile Hopkinson bars
From such results, it was shown that the formation of the major neck was notstrain rate sensitive up to levels equal to 1600 s−1. Conversely, the strain level atnecking inception was observed to be random.
3.5 Cylinder expansion
This last example deals with a blast experiment in which a copper cylinder is subjectto rapid expansion generated by an explosive. When following microsecond events itis impossible to synchronize two ultra high-speed cameras. Consequently, two mir-rors and a single high-speed rotating mirror framing camera (LCA, France) and py-rotechnic flashes (CEA-DAM, France) are used to monitor the expansion (Fig. 5(a)).Further, calibration, which is usually carried out prior to the experiment [35], was

On the Use of DIC for the Analysis of the Dynamic Behavior of Materials 17
not possible. Consequently two calibration targets are imaged during the experiment(Fig. 2(c)). Last, the registration is initialized with the displacement field predictedby hydrodynamic simulations of the experiment. Any offset between the measuredand predicted displacement field is an indication of model error [51].
(a) (b)
(c)
Fig. 11 3D shapes reconstructed via stereocorrelation. The blue mesh corresponds to the 3D re-constructed positions, and the red dots to the interpolated 3D surface
From a sequence of pictures it is possible to reconstruct the 3D shape of thecylinder at various instances of time (Fig. 11). For the more advanced shape, it ispossible to observe the inception of necking. This result shows that even under suchextreme conditions (i.e., very fast phenomena, lighting with pyrotechnic flashlights)it is possible to follow the deformation of surfaces up to very large strain levels (i.e.,of the order of 100 %).
18 Francois Hild, Amine Bouterf, Pascal Forquin and Stephane Roux
4 Conclusions
With the development of new digital high-speed cameras with enhanced definitionand higher acquisition rates, which become more affordable than in the past, theiruse in solid mechanics labs has increased during the last two decades. For example,one of the standard dynamic experiment (i.e., with Hopkinson bars) has been ana-lyzed in more details and phenomena that could not be observed previously were re-vealed thanks to the measurement of kinematic fields via any photomechanical tech-nique and in particular 2D-DIC or stereocorrelation techniques as above discussed.It is worth noting that one application, which was not discussed in the present chap-ter, is related to 4D tomography, which is also made possible thanks to nowadayshigh-speed cameras [67, 68]. For example, the solidification of an aluminum alloywas monitored in a nondestructive way by such means [69]. Similarly, an in-situ ten-sile test on a metal matrix composite was studied with a frequency of 20 tomogramsper second [70].
High-speed imaging allows deformation, damage and failure mechanisms to beanalyzed in a qualitative and quantitative way. Such type of information is veryuseful when developing mechanism-based constitutive models. Further, DIC tech-niques allow quantitative estimates of kinematic fields to be performed. These setsof data can be compared with numerical simulations to validate the virtual modelsand/or calibrate parameters of constitutive models. Various identification techniquesexplicitly use full-field data [1]. These new approaches not only improve the waymaterial parameters are calibrated, but they also enable the experimentalist to designnew setups in which heterogeneity is no longer a limitation. Heterogeneous experi-ments can be imagined, not to make life more complicated, but to capture in a singletest much more data so that the identification will be better conditioned.
Acknowledgements The results discussed herein have benefitted from the support of AgenceNationale de la Recherche (VULCOMP projects), CEA-DAM, CNRS and region Ile-de-France(SESAME project). The authors wish to thank G. Besnard, B. Durand, I. Elnasri, B. Erzar, Y. Gi-rard, S. Guerard, J.-M. Guimard, J.-M. Lagrange, H. Leclerc, S. Pattofatto, D. Saletti, N. Swiergiel,H. Tsitsiris and H. Zhao for fruitful discussions.
References
1. M. Grediac, F. Hild (eds.), Full-Field Measurements and Identification in Solid Mechanics(ISTE / Wiley, London (UK), 2012)
2. A. Lagarde, Advanced Optical Methods and Applications in Solid Mechanics, Solid Mechanicsand its Applications, vol. 82 (Kluwer, Dordrecht (the Netherlands), 2000)
3. P. Rastogi (ed.), Photomechanics, Topics in Applied Physics, vol. 77 (Springer, Berlin (Ger-many), 2000)
4. A. Wells, D. Post, Proc. SESA 16, 69 (1958)5. W. Bradley, A. Kobayashi, Exp. Mech. 10(3), 106 (1970)6. J. Dally, Exp. Mech. 19(10), 349 (1979)7. M. Ramulu, A. Kobayashi, D. Barker, Exp. Mech. 25(4), 344 (1985)
On the Use of DIC for the Analysis of the Dynamic Behavior of Materials 19
8. A. Rosakis, O. Samudrala, D. Coker, Science 284(5418), 1337 (1999)9. F. Chiang, G. Jaisingh, Exp. Mech. 13(4), 168 (1973)
10. J. Huntley, J. Field, Opt. Eng. 28(8), 926 (1989)11. V. Deason, J. Epstein, M. Abdallah, Optics Lasers Eng. 12(2-3), 173 (1990)12. K. Arakawa, J. Drinnon, R.H., M. Kosai, A. Kobayashi, Exp. Mech. 31(4), 306 (1991)13. T. Bertin-Mourot, C. Denoual, G. Dehors, P. Louvigne, T. Thomas, J. Phys. IV Coll. C3(Suppl.
III), 311 (1997)14. J.F. Kalthoff, J. Beinert, S. Winkler, Measurements of Dynamic Sress Intensity Factors for Fast
Running and Arresting Cracks in Double-Cantilever-Beam Specimens (1977), vol. STP 62715. P. Theocaris, Int. J. Solids Struct. 14(8), 639 (1978)16. K. Ravi-Chandar, W.G. Knauss, Int. J. Fract. 26(2), 141 (1984)17. C. Liu, A. Rosakis, L. Freund, Int. J. Solids Struct. 30(7), 875 (1993)18. W. Peters, W. Ranson, J. Kalthoff, S. Winkler, J. Phys. Coll. 46(C5), 631 (1985)19. X. Hu, S. Palmer, J. Field, Optics Lasers Technol. 16(6), 303 (1984)20. J. Huntley, S. Palmer, J. Field, Proc. SPIE 0814, 153 (1987)21. B. Asay, G. Laabs, B. Henson, D. Funk, J. Appl. Phys. 82(3), 1093 (1997)22. K.E. Fallstrom, H. Gustavsson, N.E. Molin, A. Wahlin, Exp. Mech. 29(4), 378 (1989)23. H. Tippur, A. Rosakis, Exp. Mech. 31(3), 243 (1991)24. I. Elnasri, S. Pattofatto, H. Zhao, H. Tsitsiris, F. Hild, Y. Girard, J. Mech. Phys. Solids 55,
2652 (2007)25. P. Burt, C. Yen, X. Xu, in IEEE Conf. on Pattern Recognition and Image Processing (IEEE,
New York (NY), USA, 1982), pp. 269–27426. W. Peters, W. Ranson, Opt. Eng. 21, 427 (1982)27. M. Sutton, W. Wolters, W. Peters, W. Ranson, S. McNeill, Im. Vis. Comp. 1(3), 133 (1983)28. F. Barthelat, Z. Wu, B. Prorok, H. Espinosa, Exp. Mech. 43(3), 331 (2003)29. J. Kajberg, M. Sjodahl, in IUTAM Symposium on Field Analyses for Determination of Material
Parameters – Experimental and Numerical Aspects, Solid Mechanics and its Applications, vol.109, ed. by P. Stahle, K. Sundin (Springer (the Netherlands), 2003), Solid Mechanics and itsApplications, vol. 109, pp. 37–49
30. J. Kajberg, B. Wikman, Int. J. Solids Struct. 44(1), 145 (2007)31. V. Tarigopula, O. Hopperstad, M. Langseth, A. Clausen, F. Hild, Int. J. Solids Struct. 45(2),
601 (2008)32. F. Pierron, M. Sutton, V. Tiwari, Exp. Mech. 51(4), 537 (2011)33. D. Saletti, S. Pattofatto, H. Zhao, Mech. Mat. 65, 1 (2013)34. L. Gui, W. Merzkirch, Exps. in Fluids 28, 36 (2000)35. M. Sutton, J. Orteu, H. Schreier, Image correlation for shape, motion and deformation mea-
surements: Basic Concepts, Theory and Applications (Springer, New York, NY (USA), 2009)36. D. Chen, F. Chiang, Y. Tan, H. Don, Appl. Optics 32, 1839 (1993)37. F. Chiang, Q. Wang, F. Lehman, New Developments in Full-Field Strain Measurements Using
Speckles (ASTM, Philadelphia (USA), 1997), vol. STP 1318, pp. 156–16938. F. Hild, B. Raka, M. Baudequin, S. Roux, F. Cantelaube, Appl. Optics IP 41(32), 6815 (2002)39. M. Bornert, F. Bremand, P. Doumalin, J. Dupre, M. Fazzini, M. Grediac, F. Hild, S. Mistou,
J. Molimard, J. Orteu, L. Robert, Y. Surrel, P. Vacher, B. Wattrisse, Exp. Mech. 49(3), 353(2009)
40. F. Hild, S. Roux, Digital Image Correlation (Wiley-VCH, Weinheim (Germany), 2012), pp.183–228
41. B. Wagne, S. Roux, F. Hild, Eur. Phys. J. AP 17, 247 (2002)42. G. Besnard, F. Hild, S. Roux, Exp. Mech. 46, 789 (2006)43. S. Roux, F. Hild, Y. Berthaud, Appl. Optics 41(1), 108 (2002)44. H. Leclerc, J. Perie, S. Roux, F. Hild, Integrated digital image correlation for the identification
of mechanical properties (Springer, Berlin (Germany), 2009), vol. LNCS 5496, pp. 161–17145. Z. Tomicevic, F. Hild, S. Roux, J. Strain Analysis 48, 330 (2013)46. V. Tiwari, M. Sutton, S. McNeill, Exp. Mech. 47(4), 561 (2007)47. F. Hild, S. Roux, Exp. Mech. 52(9), 1503 (2012)48. G. Besnard, S. Guerard, S. Roux, F. Hild, Optics Lasers Eng. 49, 71 (2011)

20 Francois Hild, Amine Bouterf, Pascal Forquin and Stephane Roux
49. G. Besnard, H. Leclerc, S. Roux, F. Hild, J. Strain Analysis 47(4), 214 (2012)50. P. Luo, Y. Chao, M. Sutton, W. Peters, Exp. Mech. 33, 123 (1993)51. G. Besnard, J. Lagrange, F. Hild, S. Roux, C. Voltz, EURASIP J. Im. Video. Proc.
2010(215956), 15 p. (2010)52. G. Besnard, F. Hild, J. Lagrange, P. Martinuzzi, S. Roux, Int. J. Impact Eng. 49, 179 (2012)53. J. Orteu, Optics Lasers Eng. 47, 282 (2009)54. M. Sutton, J. Yan, V. Tiwari, H. Schreier, J. Orteu, Optics Lasers Eng. 46(10), 746 (2008)55. A. Gilat, T. Schmidt, J. Tyson, J. Phys. IV 134, 687 (2006)56. P. Reu, T. Miller, J. Strain Anal. 43(8), 673 (2008)57. G. Besnard, B. Etchessahar, J. Lagrange, C. Voltz, F. Hild, S. Roux, in 28th Int. Cong. High-
Speed Imaging and Photonics (Proc. SPIE 7126, 2008), p. 71261N (DOI:10.1117/12.821892)58. S. Pattofatto, I. Elnasri, H. Zhao, H. Tsitsiris, F. Hild, Y. Girard, J. Mech. Phys. Solids 55,
2672 (2007)59. J. Klepaczko, A. Brara, Int. J. Impact Eng. 25, 387 (2001)60. H. Schuler, C. Mayrhofer, K. Thoma, Int. Journal Impact Eng. 32, 1635 (2006)61. J. Weerheijm, J. van Doormaal, Int. J. Impact. Eng. 34, 609 (2007)62. B. Erzar, P. Forquin, Exp. Mech. 50(7)63. S. Novikov, I. Divnov, A. Ivanov, Fizika Metallov i Metallovedeniye 21, 608 (1966)64. F. Pierron, M. Grediac, The Virtual Fields Method (Springer, 2012)65. D. Saletti, P. Forquin, Europ. Phys. J. Special Topics 225(2), 311 (2015)66. P. Forquin, Eur. Phys. J. Spec. Topics 206(1), 89 (2012)67. P. Lhuissier, M. Scheel, M. Di Michiel, E. Boller, J. Adrien, E. Maire, L. Salvo, J.J. Blandin,
M. Suery, Ultra Fast Tomography: New Developments for 4D Studies in Material Science(John Wiley & Sons, Inc., 2012), pp. 203–208
68. T. dos Santos Rolo, A. Ershov, T. van de Kamp, T. Baumbach, Proc. Nat. Acad. Sci. 111(11),3921 (2014)
69. L. Salvo, M. Di Michiel, M. Scheel, P. Lhuissier, B. Mireux, M. Suery, Ultra Fast In Situ X-Ray Micro-Tomography: Application to Solidification of Aluminium Alloys (Trans Tech Pub-lications, 2012), vol. 706-709, pp. 1713–1718
70. E. Maire, C. Le Bourlot, J. Adrien, A. Mortensen, R. Mokso, Int. J. Fract. 200(1), 3 (2016)