on the uncertainty of real-time predictions of epidemic
TRANSCRIPT

HAL Id: hal-02894992https://hal.archives-ouvertes.fr/hal-02894992
Submitted on 9 Jul 2020
HAL is a multi-disciplinary open accessarchive for the deposit and dissemination of sci-entific research documents, whether they are pub-lished or not. The documents may come fromteaching and research institutions in France orabroad, or from public or private research centers.
L’archive ouverte pluridisciplinaire HAL, estdestinée au dépôt et à la diffusion de documentsscientifiques de niveau recherche, publiés ou non,émanant des établissements d’enseignement et derecherche français ou étrangers, des laboratoirespublics ou privés.
On the uncertainty of real-time predictions of epidemicgrowths: A COVID-19 case study for China and Italy
Tommaso Alberti, Davide Faranda
To cite this version:Tommaso Alberti, Davide Faranda. On the uncertainty of real-time predictions of epidemic growths:A COVID-19 case study for China and Italy. Communications in Nonlinear Science and NumericalSimulation, Elsevier, 2020, 90, pp.105372. �10.1016/j.cnsns.2020.105372�. �hal-02894992�

On the uncertainty of real-time predictions of epidemic
growths: a COVID-19 case study for China and Italy
Tommaso Albertia, Davide Farandab,c,d
aINAF - Istituto di Astrofisica e Planetologia Spaziali, via del Fosso del Cavaliere 100,00133 Roma, Italy
bLaboratoire des Sciences du Climat et de l’Environnement, 5 CEA Saclay l’Orme desMerisiers, UMR 8212 CEA-CNRS-UVSQ, 6 Universite Paris-Saclay & IPSL, 91191
Gif-sur-Yvette, FrancecLondon Mathematical Laboratory, 8 Margravine Gardens, London, W6 8RH, UKdLMD/IPSL, Ecole Normale Superieure, 9 PSL research University, Paris, France
Abstract
While COVID-19 is rapidly propagating around the globe, the need for pro-viding real-time forecasts of the epidemics pushes fits of dynamical and sta-tistical models to available data beyond their capabilities. Here we focus onstatistical predictions of COVID-19 infections performed by fitting asymp-totic distributions to actual data. By taking as a case-study the epidemicevolution of total COVID-19 infections in Chinese provinces and Italian re-gions, we find that predictions are characterized by large uncertainties atthe early stages of the epidemic growth. Those uncertainties significantlyreduce after the epidemics peak is reached. Differences in the uncertaintyof the forecasts at a regional level can be used to highlight the delay in thespread of the virus. Our results warn that long term extrapolation of epi-demics counts must be handled with extreme care as they crucially dependnot only on the quality of data, but also on the stage of the epidemics, dueto the intrinsically non-linear nature of the underlying dynamics. These re-sults suggest that real-time epidemiological projections should include wideuncertainty ranges and urge for the needs of compiling high-quality datasetsof infections counts, including asymptomatic patients.
Keywords: COVID-19, Logistic model, Epidemic model, National vs.Regional diffusion
Preprint submitted to Communications in Nonlinear Science and Numerical SimulationJuly 9, 2020

1. Introduction1
The COVID-19, a disease caused by the SARS-CoV-2 virus, was firstly2
reported in the Hubei province on 31 December 2019 when the WHO China3
Country Office was informed of cases of pneumonia unknown etiology de-4
tected in Wuhan City [1, 2, 3]. On 7 January 2020 the Chinese authorities5
identified this virus as a zoonotic virus belonging to the family of coronavirus6
[4, 5, 6]. Its diffusion rapidly spread over all Chinese provinces and near-7
est countries (Thailand, Japan, Korea) [7]. On 23 January, although still8
unknown the initial source of the epidemic, the evidence that 2019-nCoV9
spreads from human-to-human and also across generations of cases quickly10
increases [8, 9]. On 30 January, the World Health Organization (WHO)11
declared the outbreak to be a public health emergency of international con-12
cern [10], believing that it is still possible to interrupt the virus spread by13
putting in place strong measures for early detecting, isolating, and treating14
cases, for tracing back all contacts, and for promoting social distancing mea-15
sures [10, 11, 12]. The main driver of transmission is still an open question16
[13, 14], and preliminary estimates of the median incubation period are 5-617
days (ranging between 2 and 14 days) [15]. On 21 February a cluster of cases18
was detected in Italy (Lombardia), then on 23 February 11 municipalities19
in northern Italy were identified as the two main Italian clusters and placed20
under quarantine [16], on 9 March the quarantine has been expanded to all21
of Italy [17], on 11 March all commercial activity except for supermarkets22
and pharmacies were prohibited [18], and on 22 March all non-essential busi-23
nesses and industries were closed [19] and additional restrictions to movement24
of people were introduced [20, 21].25
Meanwhile, the quarantined Chinese regions observed a fast decrease in26
the number of cases in Hubei and a moderate decrease in other affected re-27
gions, at the same time the virus internationally spread, and on 11 March the28
WHO declared COVID-19 a pandemic [22, 23]. To date, there are more than29
1 million confirmed cases over the globe, more than 60000 deaths, and the30
most affected areas are the European region and the United States. While31
three months were needed to reach the first 100000 confirmed cases, only 2332
days were sufficient to multiply by eight the counts, a typical signature of the33
exponential spreading of viruses. The reason for such high infectivity are cur-34
rently being explored in clinical studies and numerical simulations [24]. Due35
to the fast spread of the virus and the severity of symptoms, restrictive con-36
finement measures have been imposed in many countries. They were based37
2

on asymptotic extrapolation of infection counts obtained on the basis of com-38
partmental epidemic models as the Susceptible-Exposed-Infected-Recovered39
(SEIR) model and their variants [25] or on agent-based models [26]. Unfortu-40
nately, predictions made using these models are extremely sensitive to the un-41
derlying parameters and the quality of their extrapolation is deeply affected42
from both the lack of high-quality datasets as well as from the intrinsic sen-43
sitivity of the dynamics to initial conditions in the growing phase [27]. More-44
over, in order to provide reliable estimates of asymptotic infection counts, a45
knowledge of asymptomatic populations is needed. These data are currently46
almost unavailable and affected by great uncertainties.47
Another possibility is to extrapolate the number of infections by means48
of fitting asymptotic distributions to actual data. Using these phenomeno-49
logical statistical approach, we compare the behavior of epidemic evolution50
across China and Italy. The assumption beyond those fits is that typical51
curves of total infections in SEIR models display a sigmoid shape [28]. Sig-52
moid functions such as the logistic or Gompertz can therefore be used to53
fit actual data. When data are collected with the same protocols, e.g., in54
China and Italy, where tests are performed only to symptomatic patients,55
the statistical fitting can therefore provide an extrapolation of how many56
symptomatic cases should be recorded, although it will not inform about57
the real percentage of infected population [29]. We found that predictions58
are characterized by large uncertainties at the early stages of the epidemic59
growth, significantly reducing when a mature stage or a peak of infections60
are reached. This is observed both in China and in Italy, although some61
differences are observed across the Italian territory, possibly related with the62
time delayed diffusion of epidemic into the different Italian regions. Finally,63
we also estimate infection increments for each Italian region, with being the64
uncertainty significantly reduced for Northern and Central regions, while a65
larger one is found for Southern regions. These results can be helpful for66
each epidemic diffusion, thus highlighting that the confinement measures are67
fundamental and more effective in the early stages of the epidemic evolution68
(the first 7 days), thus producing a different spread across provinces/regions69
as these measures are considered. The main novelty introduced in this70
work is to investigate how uncertainty changes during the different71
stages of the epidemics. This is a crucial aspect that needs to be72
carefully considered when long-term extrapolations of the infection73
counts are carried out since they significantly depend not only on74
the quality of data, but also on the stage of the epidemics, due75
3

to the intrinsically non-linear nature of the underlying dynamics.76
This has also profound consequences on modeling epidemic growth77
by means of dynamical models as those based on compartments78
or agent dynamics which need to be initialized with quality data,79
faithfully representing the infected populations including asymp-80
tomatic patients [27]. Our approach, based on a sort of Bayesian81
framework to reduce uncertainty as more data and/or information82
become available, is particularly helpful for unknown viruses and83
outbreaks, and allows to suggest few practical guidelines to con-84
trol the local diffusion of epidemics and to restrict the analysis85
on specific regions, aiming at preserving the public health and at86
enforcing/relaxing confinement measures.87
2. Data88
Data for the Chinese provinces are obtained from the data repository for89
the 2019 Novel Coronavirus Visual Dashboard operated by the Johns Hop-90
kins University Center for Systems Science and Engineering (JHU CSSE),91
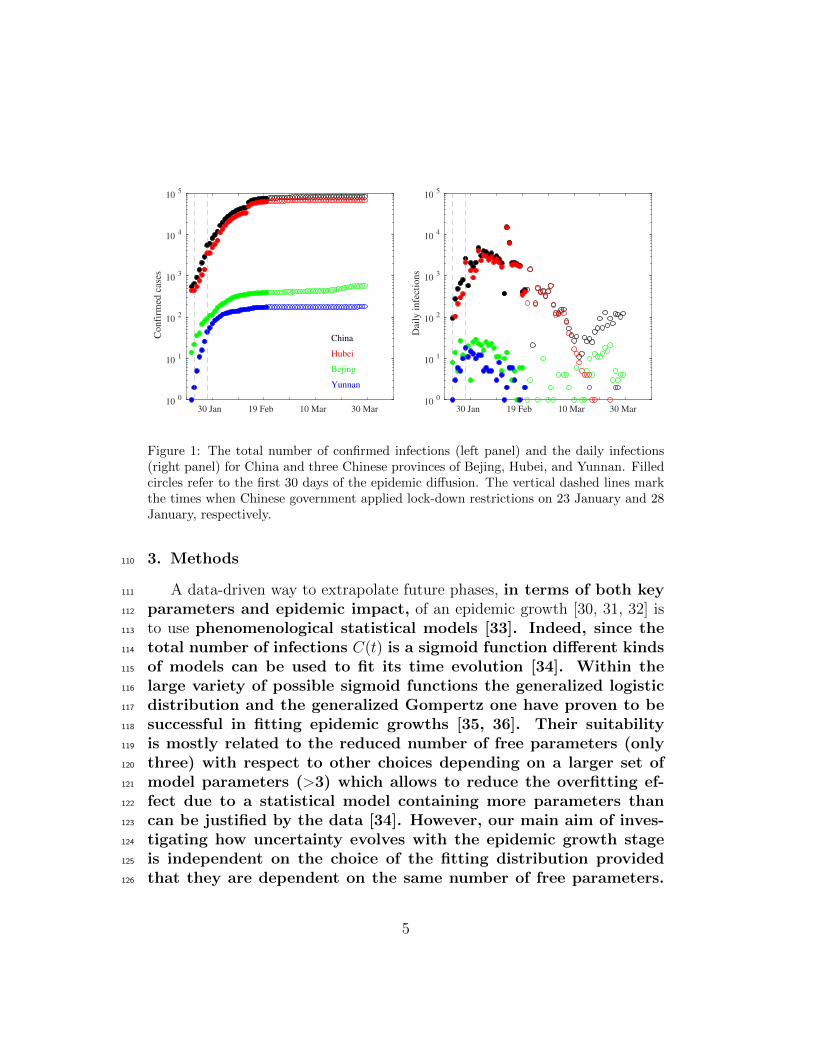
freely available at https://github.com/CSSEGISandData/COVID-19. Fig. 192
reports the total number of confirmed infections (left panel), thus including93
actual positive people to COVID-19, recovered and deaths for China and94
three Chinese provinces of Bejing, Hubei, and Yunnan, and the daily infec-95
tions (right panel), during the period between 22 January and 30 March.96
97
Data for the Italian regions are instead derived from the repository freely98
available at https://github.com/pcm-dpc/COVID-19 where data are col-99
lected from the Italian Protezione Civile from 24 February 2020. Data used100
here were last downloaded on 02 April, thus covering the period 24 February101
- 02 April, as shown in Fig. 2. It is evident that although the increments of102
infections started about 1 month after the Chinese epidemic Italy has fast103
reached and exceeded the Chinese peak values of ∼80000 infections. More-104
over, it is also apparent that epidemic diffusion in China reached its peak105
within ∼20 days from the first restriction operated to the Hubei region on 23106
January. Conversely, the Italian restrictions seem to become more efficient107
only when the Italian government adopted a lock-down confinement on 9108
March [17].109
4
30 Jan 19 Feb 10 Mar 30 Mar 10
0
101
102
103
104
105
Co
nfi
rmed
cas
es
China
Hubei
Bejing
Yunnan
30 Jan 19 Feb 10 Mar 30 Mar 10
0
101
102
103
104
105
Dai
ly i
nfe
ctio
ns
Figure 1: The total number of confirmed infections (left panel) and the daily infections(right panel) for China and three Chinese provinces of Bejing, Hubei, and Yunnan. Filledcircles refer to the first 30 days of the epidemic diffusion. The vertical dashed lines markthe times when Chinese government applied lock-down restrictions on 23 January and 28January, respectively.
3. Methods110
A data-driven way to extrapolate future phases, in terms of both key111
parameters and epidemic impact, of an epidemic growth [30, 31, 32] is112
to use phenomenological statistical models [33]. Indeed, since the113
total number of infections C(t) is a sigmoid function different kinds114
of models can be used to fit its time evolution [34]. Within the115
large variety of possible sigmoid functions the generalized logistic116
distribution and the generalized Gompertz one have proven to be117
successful in fitting epidemic growths [35, 36]. Their suitability118
is mostly related to the reduced number of free parameters (only119
three) with respect to other choices depending on a larger set of120
model parameters (>3) which allows to reduce the overfitting ef-121
fect due to a statistical model containing more parameters than122
can be justified by the data [34]. However, our main aim of inves-123
tigating how uncertainty evolves with the epidemic growth stage124
is independent on the choice of the fitting distribution provided125
that they are dependent on the same number of free parameters.126
5

20 Feb 29 Feb 10 Mar 20 Mar 30 Mar 09 Apr10
0
101
102
103
104
105
Co
nfi
rmed
cas
es
Italy
Lombardia
Marche
Puglia
20 Feb 29 Feb 10 Mar 20 Mar 30 Mar 09 Apr10
0
101
102
103
104
Dai
ly i
nfe
ctio
ns
Figure 2: The total number of confirmed infections (left panel) and the daily infections(right panel) for Italy and three Italian regions of Lombardia, Marche, and Puglia. Filledcircles refer to the first 30 days of the epidemic diffusion. The vertical dashed lines markthe times when the Italian government applied lock-down restrictions on 23 February, 01March, 09 March, and 22 March, respectively.
Thus, we selected to use the generalized logistic distribution, also127
considering that its parameters can be linked (in a non-explicit128
way) to the solution of compartmental models as the Susceptible-129
Exposed-Infected-Recovered (SEIR) model and their variants [25]130
or on agent-based models [26]. The generalized logistic distribution for131
fitting the total cumulative number of infections reads [35, 33, 36]132
C(t) =α
1 + β e−γt(1)
being α, β, and γ the parameters of the model. They can be fitted, e.g., using133
Nonlinear least-squares solver, with the Levenberg-Marquardt algorithm and134
the bisquare weight methods to minimize a weighted sum of squares. Here135
we use a MATLAB function to perform the fits. As recently pointed out in136
[27] in the early stages of the epidemics, the smoothness of COVID-19 cumu-137
lative infections data could lead to very uncertain predictions although with138
very good R2. To avoid this, here we focus only on Chinese and Italian data,139
that, to date, represent a mature stage of the epidemics. This implies, as we140
will show, that the significance of the logistic fit can be assigned with greater141
6

confidence [27]. We remark however, that when confinement measures are142
applied, the basic reproduction number R0, which regulates the growth of143
infections, is reduced [37]. We are therefore in presence not of a single lo-144
gistic distribution, but of a mixture of distributions with control parameters145
changing in time as different phases of epidemic diffusion are reached. Con-146
finement measures can reduce R0 from the exponential-like behavior of an147
uncontrolled growing phase, to a smoother logistic growth phase. Our goal148
here is to use the a-priori knowledge of the introduction of confinement mea-149
surements to investigate the perfomrance of statistical prediction of infection150
counts for different epidemic phases. Thus, we perform logistic fits as in151
Eq. (1) in the following time intervals:152
• the first 30 days of epidemic growth, as reported in Figs. 3-4 by black153
lines, thus to consider how restrictions measure globally affect the dif-154
fusion;155
• the first 7 days, roughly corresponding to the time interval during which156
first restriction measures are adopted both in China and Italy, although157
not still completely efficient (red lines in Figs. 3-4);158
• the first 14 days, corresponding to the time interval in which the initial159
confinement measures should lead the first effects (blue lines in Figs. 3-160
4);161
• the time interval between the 8th and the 14th day to investigate how162
the epidemic would be grown if starting from initial restrictions (green163
lines in Figs. 3-4);164
• the time interval between the 15th and the 30th day to investigate the165
efficiency of restriction measures (magenta lines in Figs. 3-4).166
In this way we can investigate both the efficiency of restriction measures167
in containing epidemic growth as well as the stability of prediction models168
based on logistic distribution fitting procedures. Moreover, to assess the169
significance of fits we assume that the last point of the fitting range could be170
affected by a ±30% error. This allows us to provide a simple way to estimate171
confidence intervals for our fits [27]. Finally, the Kolmogorov-Smirnov (K-S)172
test [38, 39, 40] is also used to obtain a test decision for the null hypothesis173
that the observed data are from the same logistic distribution as derived174
from the logistic fits under the different time intervals. This allows to test175
7

the efficiency in delivering reliable forecasts at different stages of the epidemic176
growth. The test is based on evaluating the maximum distance between the177
empirical distribution functions coming from two different samples x1,n and178
x2,m, being n and m the length of samples. By defining the Kolmogorov-179
Smirnov statistic as180
Dn,m = supx|F1,n(x)− F2,m(x)| , (2)
where F1,n(x) and F2,m(x) are the empirical distribution functions of the two181
samples, respectively, the null hypothesis is rejected at the confidence level182
α if183
Dn,m > c(α)
√n+m
n ·m. (3)
When m = n a general relation can be found for Dn(α) as184
Dn(α) >1√n
√− log
(α2
). (4)
The value of c(α) for the most common levels of α are reported in Table 1.
α 0.20 0.15 0.10 0.05 0.01c(α) 1.073 1.138 1.224 1.358 1.628
Table 1: The value of c(α) for the most common levels of α.
185
The closer the observed statistics Dn,obs is to 0 the more likely it is that186
the two samples were drawn from the same distribution with being Dn,obs <187
Dn(α). The use of the K-S test has two main advantages: i) the distribution188
of the K-S test statistic itself does not depend on the underlying cumulative189
distribution function being tested, and ii) it is an exact test [41, 42, 43, 44].190
Moreover, it is specifically designed for testing if data come from a normal,191
a log-normal, a Weibull, an exponential, or a logistic distribution [42, 45].192
Thus, it is particularly suitable for our investigations, being also a non-193
parametric and robust technique since it is not based on strong distributional194
assumptions [42, 45, 46, 44].195
4. Epidemic diffusion through Chinese provinces196
Fig. 3 shows logistic fits for different phases of epidemic across Chinese197
provinces, together with upper and lower confidence bounds, obtained as out-198
8

lined in the previous section. Early stage of epidemic propagation is charac-199
terized by a larger confidence interval (red lines in Fig. 3), thus highlighting200
the difficulty in making early reliable predictions of epidemic growth, with201
an exponential-like behavior. The confidence interval becomes narrower as202
the growth rate reduces, as for the case of the provinces of Bejing and Yun-203
nan being less affected from COVID-19 infections with respect to the Hubei,204
the latter mostly contributing to the overall epidemic growth in China. The205
logistic fit becomes more stable, being characterized by a narrower estimates206
of confidence intervals, when the first two weeks are considered (blue lines207
in Fig. 3), possibly related to the initial efficiency of restriction measures.208
This could be also due to both the limited number of points of the fitting209
range as well as to the particular phase of the epidemic growth. However, by210
comparing the confidence intervals of logistic fits performed using the first211
week (22/01 - 29/01, red lines in Fig. 3) and the second week (30/01 - 05/02,212
green lines in Fig. 3) it is possible to note that the stability increases for this213
second interval for all Chinese provinces, thus suggesting that estimates are214
significantly dependent on the particular epidemic phase considered. Indeed,215
the stability significantly increases when the logistic fit is performed on time216
intervals that do not include the first week of the epidemic growth (green217
and magenta lines in Fig. 3), suggesting that credible predictions could be218
assigned with a large confidence by means of a logistic fit if the beginning219
of the outbreak is not considered. However, the narrowest estimates of sig-220
nificance levels is obtained when the first 30 days are considered, thus also221
including the beginning of the outbreak, possibly suggesting that fits become222
more and more stable if data are collected at a mature stage of the epidemic223
growth. This is clearly visible for all Chinese provinces, apart for the slight224
discrepancy observed for the Bejing province where some returned cases from225
outside China were observed from 20 March. Finally, we assess the statisti-226
cal discrepancy of the logistic fits from the observed data by performing the227
Kolmogorov-Smirnov (K-S) test those results for the 95% confidence level228
are reported in Table 2.229
It can be noted that the statistical results obtained through the K-S test230
suggest that the fits performed by considering the time intervals from 22231
January to 21 February as well as from 05 February to 21 February are sta-232
tistically significant for reproducing the behavior of the observed number233
of infections at the 95% significance level. This seems to support the that234
reliable predictions can be assessed only when a mature stage of the epi-235
demic growth is approached/reached, while low-significant predictions can236
9

Dn,obs
Time interval China Hubei Bejing Yunnan22/01 - 29/01 0.750 0.750 0.750 0.62522/01 - 05/02 0.500 0.475 0.550 0.45030/01 - 05/02 0.575 0.575 0.550 0.52505/02 - 21/02 0.225 0.150 0.125 0.12522/01 - 21/02 0.100 0.100 0.100 0.100
Table 2: Results of the Kolmogorov-Smirnov test for the 95% confidence level for theChinese provinces. The decision to reject the null hypothesis is based on comparingthe observed statistics Dn,obs with the theoretical value Dn,th = 0.2329 obtained for thesignificance level α = 0.05 as in Eq. 4. If Dn,obs < Dn,th then the samples come from thesame logistic distribution and corresponding values are reported in bold.
be released at the early stages of the epidemic diffusion.237
5. Epidemic diffusion through Italian regions238
Fig. 4 shows logistic fits for different phases of epidemic across Italian239
regions, together with the upper and lower confidence lines. As for Chinese240
provinces the early stage of epidemic diffusion is characterized by a larger241
confidence interval (red lines in Fig. 4), again suggesting that reliable predic-242
tions of epidemic growth are particularly difficult in its early stages. Indeed,243
an exponential-like behavior is found for both the Italian territory and Lom-244
bardia, the latter being the first Italian region characterized by COVID-19245
infections. As for China, confidence intervals become narrower as the growth246
rate reduces (see for example Marche or Puglia with respect to Lombardia),247
with the logistic fits also becoming more stable when the initial stages of the248
outbreak are removed (green and magenta lines in Fig. 4). Unlike for Chinese249
regions, Italian regions present a wide range of different epidemic behaviors,250
that we investigate separately in the following.251
5.1. Epidemics growth in Lombardia252
As discussed above the initial phase is characterized by larger uncertain-253
ties and by an exponential-like behavior (red lines in Fig. 4), thus suggesting254
a clear difficulty in making predictions of the growth in its early stage. When255
the first two weeks (e.g., 24/02 - 08/03) are considered (blue lines in Fig. 4) a256
larger uncertainty is found, especially for the upper-bound confidence level.257
This underline the difficulty in making reliable estimates of its evolution.258
10

Similarly, the logistic fits performed between 01 March and 08 March (green259
lines in Fig. 4) suggest that the first two weeks were particularly critical in260
Lombardia, while logistic fits become more stable when removing the be-261
ginning of the outbreak, leading to more reliable estimates of the epidemic262
growth (magenta lines in Fig. 4). Finally, significance levels become narrower263
when the first 30 days are considered (e.g., 24/02 - 23/03), thus also includ-264
ing the beginning of the outbreak, possibly again suggesting that including265
data from the mature stage of the epidemic growth could allow to obtain266
more stable fits. We remark that, no matter the approach followed, logistic267
fits struggle to predict the number of infections of the successive days. This268
failure of statistical real-time forecasts of the epidemics could be related to269
all those factors that can change the instantaneous value of R0, e.g., extended270
violations of the restriction measures, changes in testing protocols or delay271
in data reporting, changes in the virus characteristics. It is worthwhile to272
note that the above features are found for all Northern regions firstly affected273
from COVID-19 diffusion (not shown here).274
5.2. Epidemics growth in Marche275
The epidemic growth throughout Marche, as well as throughout other276
Central regions (not shown), is different from Northern regions. Indeed, the277
first 7 days (e.g., 24/02 - 01/03, red lines in Fig. 4) were not characterized by278
an exponential increase of infections, as the diffusion of the virus was pretty279
slow: logistic fits are therefore meaningless in this context. The exponential280
phase started in the second week, as we can see by fitting the first two week281
of the infection counts (e.g., 24/02 - 08/03, blue lines in Fig. 4) or just the282
second week (e.g., from 01 March to 08 March, green lines in Fig. 4). During283
this week, the number of infections significantly increases (272 confirmed284
cases) enabling better fits of data to logistic distributions. This suggests a285
time delayed propagation between Northern and Central regions. Indeed,286
the logistic fits become more stable, with narrower estimates of confidence287
intervals, when the time interval from 08 March to 23 March (magenta lines in288
Fig. 4) or the first 30 days (e.g., 24/02 - 23/03, black lines in Fig. 4) are taken289
into account, suggesting that credible predictions could be assigned with a290
large confidence when a mature stage of the epidemic growth is approached.291
However, as for Norther regions the logistic fits struggle to predict the number292
of infections of the successive days (i.e., after the first 30 days).293
11

5.3. Epidemics growth in Puglia294
A completely different scenario is found for Puglia and Southern regions295
(not shown). Logistic fits cannot be performed during during the first two296
weeks (e.g., from 24 February to 08 March), as the infection counts was297
not yet exponential. By considering the time interval between 08 and 23298
March (magenta lines in Fig. 4) and the first 30 days (e.g., 24/02 - 23/03,299
black lines in Fig. 4) an increase in the confidence of logistic fits is found,300
although they struggle to predict the number of infections of the successive301
days (i.e., after the first 30 days). This is possibly due to the time delayed302
propagation of epidemic throughout Southern regions for which a mature303
stage is, to date, not yet reached. To support this hypothesis and to assess the304
statistical discrepancy of the logistic fits from the observed data we perform305
the Kolmogorov-Smirnov (K-S) test those results for the 95% confidence level306
are reported in Table 3.
Dn,obs
Time interval Italy Lombardia Marche Puglia24/02 - 01/03 0.825 0.800 0.800 0.80024/02 - 08/03 0.575 0.550 0.650 0.80001/03 - 08/03 0.550 0.425 0.600 0.80008/03 - 23/03 0.325 0.325 0.400 0.40024/02 - 23/03 0.350 0.325 0.400 0.400
Table 3: Results of the Kolmogorov-Smirnov test for the 95% confidence level for the Ital-ian regions. The decision to reject the null hypothesis is based on comparing the observedstatistics Dn,obs with the theoretical value Dn,th = 0.3037 obtained for the significancelevel α = 0.05 as in Eq. 4. If Dn,obs < Dn,th then the samples come from the same logisticdistribution and corresponding values are reported in bold.
307
It is interesting to note that, although lower values of Dn,obs are observed308
when a more mature stage of the epidemic growth is considered in the fitting309
range, as for example for time intervals from 24 February to 23 March as well310
as from 08 to 23 March, the observed values Dn,obs are all above the statistical311
threshold of Dn,th = 0.3037. This suggests that a mature stage is, to the date312
of 23 March, not yet reached, although Northern and Central regions are313
characterized by lower values than the Southern ones, thus possibly related314
to the time delayed propagation of epidemic throughout Southern regions.315
12

6. Estimation of infections for Italy and their peak time316
As discussed in Section 5 all performed logistic fits struggle to predict the317
number of infections of the successive days (i.e., after the first 30 days), thus318
we performed and compare logistic fits in three time intervals: (i) the first 30319
days (e.g., from 24 February to 23 March), (ii) the first 37 days (e.g., from 24320
February to 30 March), and (iii) the overall period from 24 February to 02321
April. The results of the Kolmogorov-Smirnov test for the 95% confidence322
level are reported in Table 4, while the behavior of logistic fits are shown in323
Fig. 5.
Dn,obs
Time interval Italy Lombardia Marche Puglia24/02 - 23/03 0.350 0.325 0.400 0.40024/02 - 30/03 0.150 0.150 0.250 0.27524/02 - 02/04 0.100 0.100 0.175 0.200
Table 4: Results of the Kolmogorov-Smirnov test for the 95% confidence level for theItalian regions. The decision to reject the null hypothesis is based on comparing theobserved statistics Dn,obs with the theoretical value Dn,th = 0.3037 obtained for the sig-nificance level α = 0.05. If Dn,obs < Dn,th then the samples come from the same logisticdistribution.
324
It is interesting to note that all regions and Italy are characterized by325
lower values of Dn,obs, below the theoretical value Dn,th = 0.3037, when326
including the next 7 days (e.g., by considering the period between 24 Febru-327
ary and 30 March) to the logistic fits and when considering the whole time328
range (e.g., 24/02 - 02/04). Lombardia presents lower values of the K-S329
statistics Dn,obs than those for Marche and Puglia, together with a nar-330
rower confidence interval when including the successive days, not observed331
for both Marche and Puglia. Particularly for Puglia the confidence interval332
remains practically unchanged, thus suggesting that logistic fits are not still333
stable, possibly due to the fact that Southern regions have not yet reached334
a mature stage of the epidemic growth. This difference in terms of sta-335
bility of logistic fits as well as on confidence of reliable estimates can be336
clearly seen by looking at the behavior of estimated daily increments. Days337
of peak significantly depends on the fitting range for Puglia, while the esti-338
mation of this quantity is more stable for Lombardia and Marche, as shown339
in Fig. 6. Indeed a wider discrepancy is found between daily increments340
13

and estimates for logistic fits performed during the three intervals, obvi-341
ously affecting both the peak time estimation and its value. By comparing342
our estimates and data collected from the daily report of the Italian Pro-343
tezione Civile (https://github.com/pcm-dpc/COVID-19) we found that the344
discrepancy significantly increases when moving from Northern to Southern345
regions, where it can also reach an error which is comparable with the pre-346
dicted value. This could be the reflection of at least two different factors: i)347
the epidemic growth is in a more mature phase in the Northern and Central348
regions with respect to the Southern ones, where it began with a time delay349
ranging from 3 to 14 days, and ii) the higher ratio between the observed350
cases and the number of tests carried out for Southern regions with respect351
to the rest of Italy (see https://github.com/pcm-dpc/COVID-19). These352
two factors could affect the performance of the logistic fits for the Southern353
regions of Italy, being characterized by wider uncertainties with respect to354
the rest of Italy. Thus, our results suggest that estimates of the ending of355
epidemic growth are affected by the statistical uncertainties, by the delayed356
propagation of infections through the different regions, and by the effective357
respect of the guidelines in terms of confinement measures.358
7. Conclusion359
In this paper we investigated the behavior of predictions of COVID-19360
infections on the particular phase of its growth and propagation in a specific361
country, as well as, on the effectiveness of social distancing and confinement362
measures. By analyzing the epidemic evolution in China and Italy we find363
that predictions are characterized by large uncertainties at the early stages of364
the epidemic growth, significantly reducing when the epidemics peak is past,365
independently on how this is reached. While infection counts for different366
Chinese provinces show a synchronised behavior, counts for Italian regions367
point to different epidemic phases. While the epidemic peak has been likely368
reached in the Northern and Central regions, COVID-19 infections are still369
in a growing phase for Southern regions, with a delay ranging from 3 to 14370
days. By assessing the performance of logistic fits we assess that a wider371
uncertainty is found during the first week of epidemic propagation. Uncer-372
tainty is reduced when data from the very beginning of the breakout are373
removed from the datasets. Moreover, the estimated infection increments374
are extremely sensitive to the epidemic growth stage and to the last points375
considered to perform statistical extrapolations. Higher significance levels376
14

are reached for the more mature stages of the epidemic growth.377
The most interesting pattern in the time-evolution of the dis-378
tribution is the observed change from an exponential-like behavior379
observed at the beginning of the epidemic growth to a sigmoid-like380
one when first restriction measures are introduced, particularly381
evident for the Italian case study. Indeed, by evaluating the ex-382
pected final number of total infections as predicted from logistic fits383
during the different stages we highlight that reliable estimates can-384
not be released until more mature stages of the epidemic growth385
are reached. We show that by only means of the first 7 days,386
corresponding to the time interval during which first restriction387
measures are adopted both in China and Italy, an overestimation388
of the final number of infections of ∼65% for China and ∼2000%389
for Italy is observed. Conversely, by considering the first 14 days,390
corresponding to the time interval in which the initial confinement391
measures should lead the first effects, an underestimation of ∼-48%392
for China and ∼-76% for Italy is obtained. A lower underestimation393
(∼-32% and ∼-69% for China and Italy, respectively) is found when394
considering the time interval between the 8th and the 14th day, e.g.,395
by investigating how the epidemic would be grown if starting from396
initial restrictions only, while a better agreement is found when397
considering the time interval between the 15th and the 30th day,398
corresponding to investigate the efficiency of restriction measures,399
with reduced underestimation of the final number of infections of400
∼-17% for China and ∼-12% for Italy. Finally, by monitoring the401
stability of logistic fits as well as their suitability on predicting402
the number of infections of the successive days (i.e., after the first403
30 days) we highlight how the uncertainty evolution can be used404
to track how the epidemics diffused at a regional level, allowing405
an estimation of the delay in the spread of the virus. Indeed,406
we found that the uncertainty significantly increases when mov-407
ing from Northern to Southern regions, where the error is almost408
comparable with the predicted value, suggesting that, to date, the409
epidemic peak has not been likely reached for Southern regions,410
being delayed with respect to Northern and Central ones.411
Our results aim at providing some guidelines for real-time epidemics fore-412
casts which should be applicable to other viruses and outbreaks. Real-time413
forecasts of the epidemics are, to date, a societal need more than a scientific414
15
field. They are crucial to plan the duration of confinement measures and to415
define the needs for health-care facilities. The aim of this letter was to show416
that those extrapolations crucially depend not only on the quality of data,417
but also on the stage of the epidemics, due to the intrinsically non-linear418
nature of the underlying dynamics. This prevents from performing success-419
ful long-term extrapolations of the infection counts with statistical models.420
As a guideline it is surely helpful to perform logistic fits every421
day and to evaluate the reliability on predicting the next day, and422
then perform a new logistic fit to investigate how the uncertainty423
grown/reduced. Moreover, reliable estimates are surely affected424
by possible source of errors in counting infections, thus we suggest425
to assess the significance of fits to the last data point of the fit-426
ting range by assuming it could be affected by a ±30% error. This427
allows us to provide a simple way to estimate confidence intervals428
[27]. Furthermore, we also suggest not only to exclude the last data429
point and check fits stability but also to consider to exclude initial430
point(s) to evaluate how epidemic would be grown if starting from431
initial restriction measures or how delayed propagation could be432
present at a regional level.433
Our approach, based on a sort of Bayesian framework to update434
the probability for a reduced uncertainty as more evidence or infor-435
mation become available (this especially true for unknown viruses436
and outbreaks), suggests that the statistical modeling of epidemic437
growth should be focused on specific stages of its evolution on time438
as well as on its spread at a more local level (e.g., regional level).439
This can help in controlling local diffusion of epidemics and to re-440
strict the analysis on specific regions depending on its uncertainty441
values. The above guidelines can be also suitable for dynamical mod-442
els such as those based on compartments or agent dynamics which need to be443
initialized with quality data, faithfully representing the infected populations444
including asymptomatic patients [27]. It is therefore crucial to pursue na-445
tional health systems to provide the most transparent and extended datasets446
as possible and obtain high quality datasets to initialize those models. We447
remind that only dynamical models can provide a coherent representation448
and evolution of the epidemics, as they are effectively based on the conser-449
vation of the total number of individuals. Characterizing and modeling450
the uncertainty can allow to preserve the public health and help451
to enforce/relax strict confinement measures.452
16

Acknowledgments453
The authors thank the anonymous reviewer for fruitful and insightful454
comments.455
References456
[1] R. F. Service, Coronavirus epidemic snarls science worldwide, Science457
367 (2020) 836–837. doi:10.1126/science.367.6480.836.458
[2] C. Huang, Y. Wang, X. Li, L. Ren, J. Zhao, Y. Hu, L. Zhang, G. Fan,459
J. Xu, X. Gu, et al., Clinical features of patients infected with 2019460
novel coronavirus in Wuhan, China, The Lancet 395 (2020) 497–506.461
doi:10.1016/S0140-6736(20)30183-5.462
[3] W.-j. Guan, Z.-y. Ni, Y. Hu, W.-h. Liang, C.-q. Ou, J.-x. He, L. Liu,463
H. Shan, C.-l. Lei, D. S. Hui, B. Du, L.-j. Li, G. Zeng, K.-Y. Yuen,464
R.-c. Chen, C.-l. Tang, T. Wang, P.-y. Chen, J. Xiang, S.-y. Li, J.-465
l. Wang, Z.-j. Liang, Y.-x. Peng, L. Wei, Y. Liu, Y.-h. Hu, P. Peng,466
J.-m. Wang, J.-y. Liu, Z. Chen, G. Li, Z.-j. Zheng, S.-q. Qiu, J. Luo,467
C.-j. Ye, S.-y. Zhu, N.-s. Zhong, Clinical characteristics of coronavirus468
disease 2019 in china, New England Journal of Medicine 0 (0) null.469
doi:10.1056/NEJMoa2002032.470
[4] W. H. Organization, Pneumonia of unknown cause471
– china, 2020. URL: https://www.who.int/csr/don/472
05-january-2020-pneumonia-of-unkown-cause-china/en/.473
[5] Q. Li, X. Guan, P. Wu, X. Wang, L. Zhou, Y. Tong, R. Ren, K. S. Leung,474
E. H. Lau, J. Y. Wong, X. Xing, N. Xiang, Y. Wu, C. Li, Q. Chen, D. Li,475
T. Liu, J. Zhao, M. Liu, W. Tu, C. Chen, L. Jin, R. Yang, Q. Wang,476
S. Zhou, R. Wang, H. Liu, Y. Luo, Y. Liu, G. Shao, H. Li, Z. Tao,477
Y. Yang, Z. Deng, B. Liu, Z. Ma, Y. Zhang, G. Shi, T. T. Lam, J. T.478
Wu, G. F. Gao, B. J. Cowling, B. Yang, G. M. Leung, Z. Feng, Early479
transmission dynamics in wuhan, china, of novel coronavirus–infected480
pneumonia, New England Journal of Medicine 382 (2020) 1199–1207.481
doi:10.1056/NEJMoa2001316.482
[6] M. Lipsitch, D. L. Swerdlow, L. Finelli, Defining the epidemiology of483
covid-19 — studies needed, New England Journal of Medicine 382 (2020)484
1194–1196. doi:10.1056/NEJMp2002125.485
17

[7] N. Zhu, D. Zhang, W. Wang, X. Li, B. Yang, J. Song, X. Zhao, B. Huang,486
W. Shi, R. Lu, P. Niu, F. Zhan, X. Ma, D. Wang, W. Xu, G. Wu, G. F.487
Gao, W. Tan, A novel coronavirus from patients with pneumonia in488
china, 2019, New England Journal of Medicine 382 (2020) 727–733.489
doi:10.1056/NEJMoa2001017.490
[8] D. Wang, B. Hu, C. Hu, F. Zhu, X. Liu, J. Zhang, B. Wang,491
H. Xiang, Z. Cheng, Y. Xiong, Y. Zhao, Y. Li, X. Wang,492
Z. Peng, Clinical Characteristics of 138 Hospitalized Pa-493
tients With 2019 Novel Coronavirus–Infected Pneumonia in494
Wuhan, China, JAMA 323 (2020) 1061–1069. URL: https:495
//doi.org/10.1001/jama.2020.1585. doi:10.1001/jama.2020.1585.496
arXiv:https://jamanetwork.com/journals/jama/articlepdf/2761044/jama wang 2020 oi 200019.pdf.497
[9] L. T. Phan, T. V. Nguyen, Q. C. Luong, T. V. Nguyen, H. T.498
Nguyen, H. Q. Le, T. T. Nguyen, T. M. Cao, Q. D. Pham, Im-499
portation and human-to-human transmission of a novel coronavirus500
in vietnam, New England Journal of Medicine 382 (2020) 872–874.501
doi:10.1056/NEJMc2001272, pMID: 31991079.502
[10] W. H. Organization, Coronavirus disease 2019 (covid-19) situ-503
ation report-10, 2020. URL: https://www.who.int/emergencies/504
diseases/novel-coronavirus-2019/situation-reports/.505
[11] W. E. Parmet, M. S. Sinha, Covid-19 — the law and limits of quar-506
antine, New England Journal of Medicine 0 (0) null. doi:10.1056/507
NEJMp2004211.508
[12] R. L. Haffajee, M. M. Mello, Thinking globally, acting locally — the509
u.s. response to covid-19, New England Journal of Medicine 0 (0) null.510
doi:10.1056/NEJMp2006740.511
[13] S. Flaxman, et al., Estimating the number of infections and the512
impact of non-pharmaceutical interventions on covid-19 in 11513
european countries, 2020. URL: https://www.imperial.ac.uk/514
media/imperial-college/medicine/sph/ide/gida-fellowships/515
Imperial-College-COVID19-Europe-estimates-and-NPI-impact-30-03-2020.516
pdf.517
18

[14] C. Rothe, M. Schunk, P. Sothmann, G. Bretzel, G. Froeschl, C. Wall-518
rauch, T. Zimmer, V. Thiel, C. Janke, W. Guggemos, M. Seil-519
maier, C. Drosten, P. Vollmar, K. Zwirglmaier, S. Zange, R. Wolfel,520
M. Hoelscher, Transmission of 2019-ncov infection from an asymp-521
tomatic contact in germany, New England Journal of Medicine 382522
(2020) 970–971. doi:10.1056/NEJMc2001468.523
[15] S. A. Lauer, K. H. Grantz, Q. Bi, F. K. Jones, Q. Zheng, H. R. Meredith,524
A. S. Azman, N. G. Reich, J. Lessler, The Incubation Period of Coro-525
navirus Disease 2019 (COVID-19) From Publicly Reported Confirmed526
Cases: Estimation and Application, Annals of Internal Medicine (2020).527
URL: https://doi.org/10.7326/M20-0504. doi:10.7326/M20-0504.528
arXiv:https://annals.org/acp/content public/journal/aim/0/aime202005050-m200504.pdf.529
[16] P. M. of Italy, Disposizioni attuative del decreto-legge 23 febbraio530
2020, n. 6, recante misure urgenti in materia di contenimento e ges-531
tione dell’emergenza epidemiologica da covid-19, 2020. URL: https:532
//www.gazzettaufficiale.it/eli/id/2020/02/23/20A01228/sg.533
[17] P. M. of Italy, Ulteriori disposizioni attuative del decreto-legge 23 feb-534
braio 2020, n. 6, recante misure urgenti in materia di contenimento e ges-535
tione dell’emergenza epidemiologica da covid-19, applicabili sull’intero536
territorio nazionale, 2020. URL: https://www.gazzettaufficiale.537
it/eli/id/2020/03/09/20A01558/sg.538
[18] P. M. of Italy, Ulteriori disposizioni attuative del decreto-legge 23 feb-539
braio 2020, n. 6, recante misure urgenti in materia di contenimento e ges-540
tione dell’emergenza epidemiologica da covid-19, applicabili sull’intero541
territorio nazionale, 2020. URL: https://www.gazzettaufficiale.542
it/eli/id/2020/03/11/20A01605/sg.543
[19] P. M. of Italy, Ulteriori disposizioni attuative del decreto-legge 23 feb-544
braio 2020, n. 6, recante misure urgenti in materia di contenimento e ges-545
tione dell’emergenza epidemiologica da covid-19, applicabili sull’intero546
territorio nazionale, 2020. URL: https://www.gazzettaufficiale.547
it/eli/id/2020/03/22/20A01807/sg.548
[20] L. Rosenbaum, Facing covid-19 in italy — ethics, logistics, and thera-549
peutics on the epidemic’s front line, New England Journal of Medicine550
0 (0) null. doi:10.1056/NEJMp2005492.551
19

[21] M. Chinazzi, J. T. Davis, M. Ajelli, C. Gioannini, M. Litvi-552
nova, S. Merler, A. Pastore y Piontti, K. Mu, L. Rossi, K. Sun,553
C. Viboud, X. Xiong, H. Yu, M. E. Halloran, I. M. Longini,554
A. Vespignani, The effect of travel restrictions on the spread555
of the 2019 novel coronavirus (covid-19) outbreak, Science556
(2020). URL: https://science.sciencemag.org/content/early/557
2020/03/05/science.aba9757. doi:10.1126/science.aba9757.558
arXiv:https://science.sciencemag.org/content/early/2020/03/05/science.aba9757.full.pdf.559
[22] A. S. Fauci, H. C. Lane, R. R. Redfield, Covid-19 — navigating the560
uncharted, New England Journal of Medicine 382 (2020) 1268–1269.561
doi:10.1056/NEJMe2002387.562
[23] W. H. Organization, Coronavirus disease 2019 (covid-19)563
situation report-51, 2020. URL: https://www.who.int/564
docs/default-source/coronaviruse/situation-reports/565
20200311-sitrep-51-covid-19.pdf?sfvrsn=1ba62e57\_10.566
[24] A. Spinello, A. Saltalamacchia, A. Magistrato, Is the Rigid-567
ity of SARS-CoV-2 Spike Receptor-Binding Motif the Hall-568
mark for Its Enhanced Infectivity and Pathogenesis? (2020).569
URL: https://chemrxiv.org/articles/Is_the_Rigidity_of_570
SARS-CoV-2_Spike_Receptor-Binding_Motif_the_Hallmark_571
for_Its_Enhanced_Infectivity_and_Pathogenesis_/12091260.572
doi:10.26434/chemrxiv.12091260.v1.573
[25] F. Brauer, Compartmental models in epidemiology, Lecture Notes in574
Mathematics, Springer Verlag, 2008, pp. 19–79.575
[26] S. L. Chang, N. Harding, C. Zachreson, O. M. Cliff, M. Prokopenko,576
Modelling transmission and control of the covid-19 pandemic in aus-577
tralia, arXiv preprint arXiv:2003.10218 (2020).578
[27] D. Faranda, I. P. Castillo, O. Hulme, A. Jezequel, J. S. W. Lamb,579
Y. Sato, E. L. Thompson, Asymptotic estimates of sars-cov-2 infection580
counts and their sensitivity to stochastic perturbation, Chaos under581
review (2020).582
[28] T. C. Wilcosky, L. E. Chambless, A comparison of direct adjustment583
and regression adjustment of epidemiologic measures, Journal of chronic584
diseases 38 (1985) 849–856.585
20

[29] M. Batista, Estimation of the final size of the covid-19 epidemic,586
Preprint.] medRxiv (2020).587
[30] C.-H. Li, C.-C. Tsai, S.-Y. Yang, Analysis of the permanence of an588
SIR epidemic model with logistic process and distributed time delay,589
Communications in Nonlinear Science and Numerical Simulations 17590
(2012) 3696–3707. doi:10.1016/j.cnsns.2012.01.018.591
[31] J. Kumar, K. P. S. S. Hembram, Epidemiological study of novel592
coronavirus (COVID-19), arXiv e-prints (2020) arXiv:2003.11376.593
arXiv:2003.11376.594
[32] J. Ma, Estimating epidemic exponential growth rate and basic re-595
production number, Infectious Disease Modelling 5 (2020) 129 –596
141. URL: http://www.sciencedirect.com/science/article/pii/597
S2468042719300491. doi:https://doi.org/10.1016/j.idm.2019.12.598
009.599
[33] G. Chowell, Fitting dynamic models to epidemic outbreaks with600
quantified uncertainty: A primer for parameter uncertainty, identi-601
fiability, and forecasts, Infectious Disease Modelling 2 (2017) 379602
– 398. URL: http://www.sciencedirect.com/science/article/pii/603
S2468042717300234. doi:https://doi.org/10.1016/j.idm.2017.08.604
001.605
[34] I. J. Wellock, G. C. Emmans, I. Kyriazakis, Describing and predicting606
potential growth in the pig, Animal Science 78 (2004) 379–388. doi:10.607
1017/S1357729800058781.608
[35] B. Gompertz, On the Nature of the Function Expressive of the Law609
of Human Mortality, and on a New Mode of Determining the Value of610
Life Contingencies, Philosophical Transactions of the Royal Society of611
London Series I 115 (1825) 513–583.612
[36] R. Burger, G. Chowell, L. Y. Lara-Dııaz, Comparative analysis of phe-613
nomenological growth models applied to epidemic outbreaks, Mathe-614
matical biosciences and engineering : MBE 16 (2019) 4250—4273. URL:615
https://doi.org/10.3934/mbe.2019212. doi:10.3934/mbe.2019212.616
[37] G. Viceconte, N. Petrosillo, Covid-19 r0: Magic number or co-617
nundrum?, Infectious Disease Reports 12 (2020). URL: https://618
21

www.pagepress.org/journals/index.php/idr/article/view/8516.619
doi:10.4081/idr.2020.8516.620
[38] A. N. Kolmogorov, Sulla determinazione empirica di una legge di dis-621
tribuzione, Giornale dell’Istituto Italiano degli Attuari 4 (1933) 83–91.622
[39] N. Smirnov, Table for estimating the goodness of fit of empirical distri-623
butions, Ann. Math. Statist. 19 (1948) 279–281. URL: https://doi.624
org/10.1214/aoms/1177730256. doi:10.1214/aoms/1177730256.625
[40] M. A. Stephens, Edf statistics for goodness of fit and some compar-626
isons, Journal of the American Statistical Association 69 (1974) 730–627
737. doi:10.1080/01621459.1974.10480196.628
[41] T. W. Anderson, D. A. Darling, A test of goodness of fit, Journal of629
the American Statistical Association 49 (1954) 765–769. doi:10.1080/630
01621459.1954.10501232.631
[42] G. Marsaglia, W. W. Tsang, J. Wang, Evaluating kolmogorov’s distribu-632
tion, Journal of Statistical Software, Articles 8 (2003) 1–4. URL: https:633
//www.jstatsoft.org/v008/i18. doi:10.18637/jss.v008.i18.634
[43] Kolmogorov–Smirnov Test, Springer New York, New York, NY, 2008,635
pp. 283–287. URL: https://doi.org/10.1007/978-0-387-32833-1_636
214. doi:10.1007/978-0-387-32833-1_214.637
[44] M. Marozzi, Nonparametric simultaneous tests for location and scale638
testing: A comparison of several methods, Communications in Statis-639
tics - Simulation and Computation 42 (2013) 1298–1317. doi:10.1080/640
03610918.2012.665546.641
[45] F. J. Massey, Distribution table for the deviation between two sample642
cumulatives, Ann. Math. Statist. 23 (1952) 435–441. URL: https://643
doi.org/10.1214/aoms/1177729388. doi:10.1214/aoms/1177729388.644
[46] W. Ghidey, E. Lesaffre, G. Verbeke, A comparison of methods for esti-645
mating the random effects distribution of a linear mixed model, Statis-646
tical Methods in Medical Research 19 (2010) 575–600.647
22

0.5
1
1.5
2
Co
nfi
rmed
- C
hin
a
105
0.5
1
1.5
2
Co
nfi
rmed
- H
ub
ei
105
200
400
600
800
1000
Co
nfi
rmed
- B
ejin
g
22/01 - 21/02
22/01 - 29/01
22/01 - 05/02
30/01 - 05/02
05/02 - 21/02
30 Jan 19 Feb 10 Mar 30 Mar
50
100
150
200
250
300
350
400
Co
nfi
rmed
- Y
un
nan
Figure 3: Logistic fits during the different time intervals of epidemic across Chineseprovinces, together with the confidence lines. From top to bottom: China and threeprovinces (Bejing, Hubei, Yunnan). The vertical dashed lines mark the times when Chinesegovernment applied lock-down restrictions on 23 January and 28 January, respectively.
23

2
4
6
8
10
12
14
Con
firm
ed -
Ita
ly
104
24/02 - 23/03
24/02 - 01/03
24/02 - 08/03
01/03 - 08/03
08/03 - 23/03
1
2
3
4
5
Con
firm
ed -
Lom
bard
ia
104
1000
2000
3000
4000
5000
Con
firm
ed -
Mar
che
20 Feb 29 Feb 10 Mar 20 Mar 30 Mar 09 Apr
500
1000
1500
2000
2500
3000
Con
firm
ed -
Pug
lia
Figure 4: Logistic fits during the different time intervals of epidemic across Italian re-gions, together with the confidence lines. From top to bottom: Italy and three regions(Lombardia, Marche, Puglia). The vertical dashed lines mark the times when Italiangovernment applied lock-down restrictions on 23 February, 01 March, 09 March, and 22March, respectively.
24

2
4
6
8
10
12
14
Co
nfi
rmed
- I
taly
104
24/02 - 23/03
24/02 - 30/03
24/02 - 02/04
1
2
3
4
5
Co
nfi
rmed
- L
om
bar
dia
104
1000
2000
3000
4000
5000
Co
nfi
rmed
- M
arch
e
20 Feb 29 Feb 10 Mar 20 Mar 30 Mar 09 Apr
500
1000
1500
2000
2500
3000
Co
nfi
rmed
- P
ug
lia
Figure 5: Logistic fits during the different time intervals of epidemic across Italian re-gions, together with the confidence lines. From top to bottom: Italy and three regions(Lombardia, Marche, Puglia). The vertical dashed lines mark the times when Italiangovernment applied lock-down restrictions on 23 February, 01 March, 09 March, and 22March, respectively.
25

1000
2000
3000
4000
5000
6000
7000
8000In
crem
ents
- I
taly
24/02 - 23/03
24/02 - 30/03
24/02 - 02/04
500
1000
1500
2000
2500
3000
3500
4000
Incr
emen
ts -
Lo
mb
ard
ia
50
100
150
200
250
300
Incr
emen
ts -
Mar
che
20 Feb 29 Feb 10 Mar 20 Mar 30 Mar 09 Apr
50
100
150
200
Incr
emen
ts -
Pu
gli
a
Figure 6: Estimation of daily infections and their peak time during three different timeintervals of epidemic across Italian regions, together with the confidence lines. From top tobottom: Italy and three regions (Lombardia, Marche, Puglia). The vertical dashed linesmark the times when Italian government applied lock-down restrictions on 23 February,01 March, 09 March, and 22 March, respectively.
26