on the measurement of relative powder-bed compaction
TRANSCRIPT
Accepted Manuscript
On the measurement of relative powder-bed compaction densityin powder-bed additive manufacturing processes
Usman Ali, Yahya Mahmoodkhani, Shahriar Imani Shahabad,Reza Esmaeilizadeh, Farzad Liravi, Esmat Sheydaeian, Ke YinHuang, Ehsan Marzbanrad, Mihaela Vlasea, Ehsan Toyserkani
PII: S0264-1275(18)30497-0DOI: doi:10.1016/j.matdes.2018.06.030Reference: JMADE 4000
To appear in: Materials & Design
Received date: 5 April 2018Revised date: 28 May 2018Accepted date: 15 June 2018
Please cite this article as: Usman Ali, Yahya Mahmoodkhani, Shahriar Imani Shahabad,Reza Esmaeilizadeh, Farzad Liravi, Esmat Sheydaeian, Ke Yin Huang, Ehsan Marzbanrad,Mihaela Vlasea, Ehsan Toyserkani , On the measurement of relative powder-bedcompaction density in powder-bed additive manufacturing processes. Jmade (2018),doi:10.1016/j.matdes.2018.06.030
This is a PDF file of an unedited manuscript that has been accepted for publication. Asa service to our customers we are providing this early version of the manuscript. Themanuscript will undergo copyediting, typesetting, and review of the resulting proof beforeit is published in its final form. Please note that during the production process errors maybe discovered which could affect the content, and all legal disclaimers that apply to thejournal pertain.
The final publication is available at Elsevier via http://dx.doi.org/10.1016/j.matdes.2018.06.030 © 2018. This manuscript version is made available under the CC-BY-NC-ND 4.0 license http://creativecommons.org/licenses/by-nc-nd/4.0/
ACCEP
TED M
ANUSC
RIPT
Revised
On the measurement of relative powder-bed compaction density in
powder-bed additive manufacturing processes
Usman Ali, Yahya Mahmoodkhani, Shahriar Imani Shahabad, Reza Esmaeilizadeh, Farzad Liravi, Esmat
Sheydaeian, Ke Yin Huang, Ehsan Marzbanrad, Mihaela Vlasea, Ehsan Toyserkani
Multi-Scale Additive Manufacturing Lab, University of Waterloo, 200 University Avenue West, Waterloo, ON, N2L 3G1,
Canada
Re-Submission Date: May 28, 2018
Number of Pages: 15
Number of Figures: 9
Number of Tables: 3
Contact Author: Ehsan Toyserkani, PhD, P.Eng
Address: Department of Mechanical and Mechatronics Engineering, University of Waterloo,
Waterloo, Ontario, Canada, N2L 3G1, e-mail: [email protected]
ACCEPTED MANUSCRIPT
ACCEP
TED M
ANUSC
RIPT
On the measurement of relative powder-bed compaction density in
powder-bed additive manufacturing processes
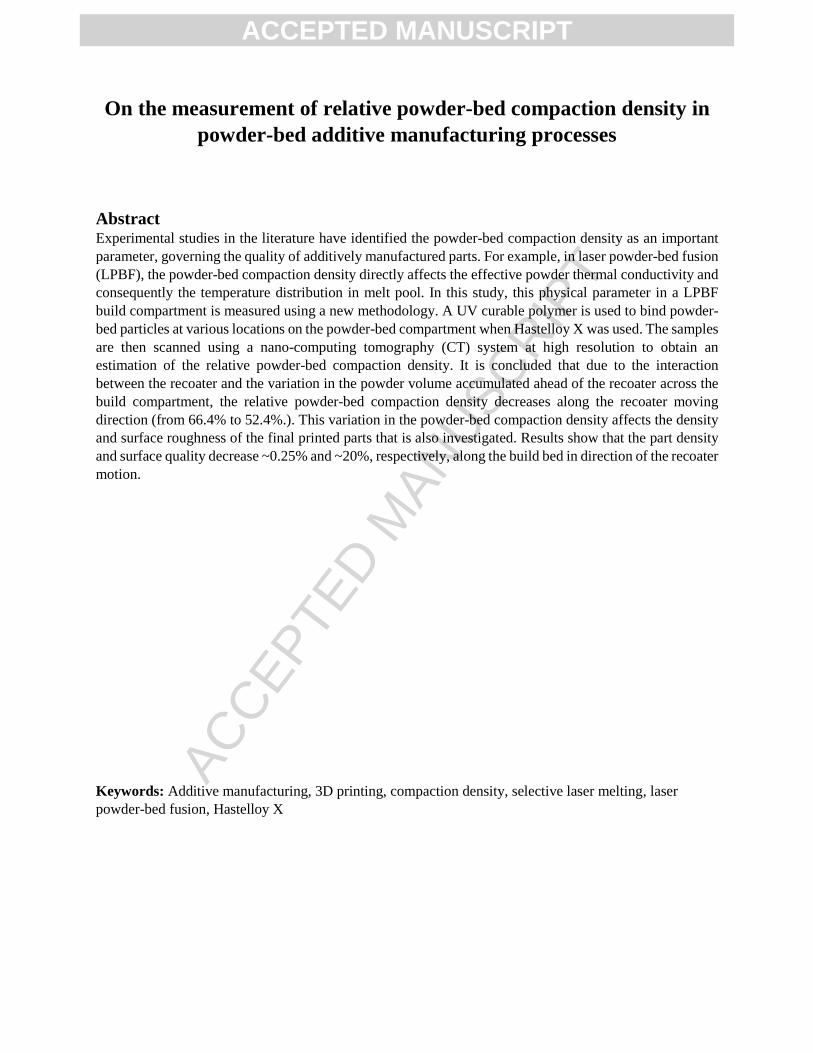
Abstract Experimental studies in the literature have identified the powder-bed compaction density as an important
parameter, governing the quality of additively manufactured parts. For example, in laser powder-bed fusion
(LPBF), the powder-bed compaction density directly affects the effective powder thermal conductivity and
consequently the temperature distribution in melt pool. In this study, this physical parameter in a LPBF
build compartment is measured using a new methodology. A UV curable polymer is used to bind powder-
bed particles at various locations on the powder-bed compartment when Hastelloy X was used. The samples
are then scanned using a nano-computing tomography (CT) system at high resolution to obtain an
estimation of the relative powder-bed compaction density. It is concluded that due to the interaction
between the recoater and the variation in the powder volume accumulated ahead of the recoater across the
build compartment, the relative powder-bed compaction density decreases along the recoater moving
direction (from 66.4% to 52.4%.). This variation in the powder-bed compaction density affects the density
and surface roughness of the final printed parts that is also investigated. Results show that the part density
and surface quality decrease ~0.25% and ~20%, respectively, along the build bed in direction of the recoater
motion.
Keywords: Additive manufacturing, 3D printing, compaction density, selective laser melting, laser
powder-bed fusion, Hastelloy X
ACCEPTED MANUSCRIPT
ACCEP
TED M
ANUSC
RIPT
1 Introduction Additive manufacturing (AM) has gained a new momentum in many industrial sectors [1], [2]. AM
processes are becoming more common in the product development lifecycle because of their remarkable
capabilities of manufacturing complex geometries compared to conventional manufacturing methods. For
instance, manufacturing of complex shapes and consolidation of assemblies are now feasible without the
use of multiple manufacturing steps, thus saving time and resources [3]. One of the disadvantages of AM
techniques, however, is the cost of raw materials and low repeatability [4].
There are various powder-bed AM processes that are classified based on the powder joining mechanisms.
The most common methods of joining powder particles in powder-bed systems are the deployment of
thermal energy generated by the irradiation of laser, electron beam, and plasma, or the use of binders [5]–
[7]. In the binder jetting 3D printing process, powder particles are adhered to each other using a liquid-
based binder that is jetted through a printhead at selected locations within each layer [5]. Electron beam
and laser processes adhere the powder particles by melting or sintering. Laser powder-bed based AM
processes are commonly known as Laser Beam Melting (LBM), Selective Laser Melting (SLM), Laser
Powder-bed Fusion (LPBF) [2].
Laser powder-bed fusion (LPBF) is categorized as one of the main metal AM processes based on ASTM
standard ISO/ASTM 52900 [8]. The LPBF process consists of a series of steps for manufacturing complex
parts by typically using a high intensity laser as an energy source to melt and fuse selective regions of
powder, layer-by-layer, to build the final shape [9]. Similar to other AM processes, LPBF includes various
process parameters. The most common process parameters studied in the literature include laser power,
scanning speed, hatch spacing, layer thickness etc. [10], [11] that need to be optimized for achieving high
quality parts [12]. In addition to the above mentioned laser process parameters, one of such parameters,
which can significantly affect the final product properties (e.g., density, surface roughness) is the powder-
bed compaction density in the build compartment [13], [14]. In general, the successful industry adoption of
metal AM relies on understanding the complex interactions between the design, the used materials, and the
process to ensure high product quality and reliability. These relationships are typically developed using
costly empirical approaches. To enable a lean manufacturing approach, simulations, monitoring and process
control of LPBF are becoming a high interest research and development area [15].
In order to effectively simulate the complex laser-material interaction occurring during the LPBF process,
the relative values for powder compaction density in the powder-bed are required [16]–[18]. For example,
Denlinger et al. [19] used volume of voids between particles as input to their simulations to calculate
thermal history. Other researchers used various types of functions to relate the bulk and powder densities
of materials [16], [17]. Powder-scale simulations, such as Discrete Element Method (DEM), do not consider
the powder-bed compaction density as they can directly account for the powder distribution and packing in
the powder-bed [20]. Due to the lack of information in the literature on the exact values for the powder-bed
compaction density, this process property is assumed a fixed number across the bed, where in many cases
the chosen values are approximated [16], [18]. Therefore, it is important to develop a systematic approach
for the measurement of powder-bed compaction density as this parameter directly governs the final part
quality and the simulated behavior of the laser-material interaction [21].
There are various methods presented in the literature to quantify the powder-bed compaction density during
AM processes. Liu et al. [14] investigated the effect of powder-bed compaction density on the final part
properties by printing a 30 x 30 x 30 mm container during the AM process and weighing the powder inside.
They concluded that a wider range of particle size distribution provides higher powder-bed compaction
density and results in parts with high density and surface quality. Jacob et al. [13] conducted an
experimental study to measure the powder-bed density. They used a custom container (closed hollow
ACCEPTED MANUSCRIPT
ACCEP
TED M
ANUSC
RIPT
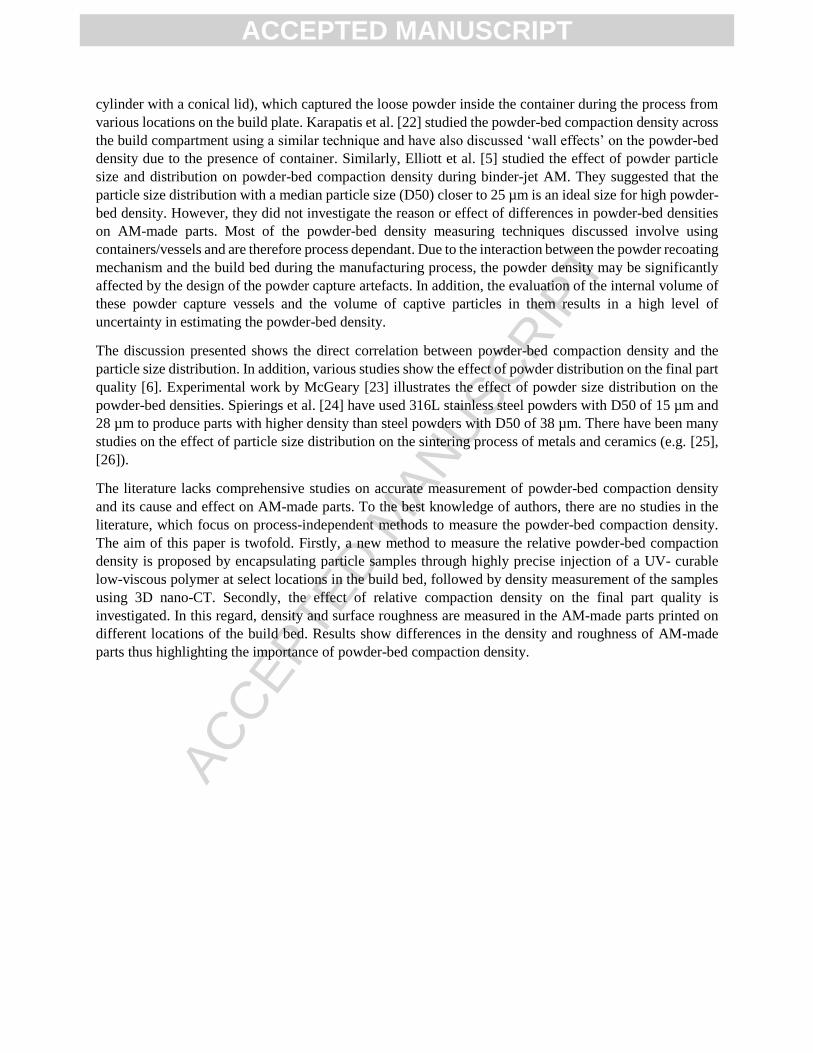
cylinder with a conical lid), which captured the loose powder inside the container during the process from
various locations on the build plate. Karapatis et al. [22] studied the powder-bed compaction density across
the build compartment using a similar technique and have also discussed ‘wall effects’ on the powder-bed
density due to the presence of container. Similarly, Elliott et al. [5] studied the effect of powder particle
size and distribution on powder-bed compaction density during binder-jet AM. They suggested that the
particle size distribution with a median particle size (D50) closer to 25 µm is an ideal size for high powder-
bed density. However, they did not investigate the reason or effect of differences in powder-bed densities
on AM-made parts. Most of the powder-bed density measuring techniques discussed involve using
containers/vessels and are therefore process dependant. Due to the interaction between the powder recoating
mechanism and the build bed during the manufacturing process, the powder density may be significantly
affected by the design of the powder capture artefacts. In addition, the evaluation of the internal volume of
these powder capture vessels and the volume of captive particles in them results in a high level of
uncertainty in estimating the powder-bed density.
The discussion presented shows the direct correlation between powder-bed compaction density and the
particle size distribution. In addition, various studies show the effect of powder distribution on the final part
quality [6]. Experimental work by McGeary [23] illustrates the effect of powder size distribution on the
powder-bed densities. Spierings et al. [24] have used 316L stainless steel powders with D50 of 15 µm and
28 µm to produce parts with higher density than steel powders with D50 of 38 µm. There have been many
studies on the effect of particle size distribution on the sintering process of metals and ceramics (e.g. [25],
[26]).
The literature lacks comprehensive studies on accurate measurement of powder-bed compaction density
and its cause and effect on AM-made parts. To the best knowledge of authors, there are no studies in the
literature, which focus on process-independent methods to measure the powder-bed compaction density.
The aim of this paper is twofold. Firstly, a new method to measure the relative powder-bed compaction
density is proposed by encapsulating particle samples through highly precise injection of a UV- curable
low-viscous polymer at select locations in the build bed, followed by density measurement of the samples
using 3D nano-CT. Secondly, the effect of relative compaction density on the final part quality is
investigated. In this regard, density and surface roughness are measured in the AM-made parts printed on
different locations of the build bed. Results show differences in the density and roughness of AM-made
parts thus highlighting the importance of powder-bed compaction density.
ACCEPTED MANUSCRIPT
ACCEP
TED M
ANUSC
RIPT
2 Experimental procedures
2.1 Powder material characterization Commercially available Hastelloy X powder from EOS GmbH (EOS NickelAlloy HX, Krailling, Germany)
with a D10 (diameter at 10% cumulative volume), D50 (median diameter) and D90 (diameter at 90%
cumulative volume) of 15 µm, 30 µm and 46 µm respectively was used in this study. An average material
composition for each element of Hastelloy X alloy provided by EOS® is given in Table 1.
Table 1: Elemental composition of Hastelloy X
Element Cr Fe Mo W Co C Si Mn S P B Cu Al Ti Ni
Weight
%
21 18 9 0.7 1.5 0.1 1 1 0.03 0.04 0.01 0.5 0.50 0.15 Bal.
An EOS M290 (EOS GmbH, Krailling, Germany) was used for the LPBF process and relative powder-bed
compaction density measurements. Parts were printed with laser power of 220 W and speed of 1000 mm/s
with a layer thickness of 60 µm. All other parameters such as scanning strategies, core and skin parameters,
etc. were kept as default for all parts
A dynamic optical particle analyzer (Retsch Camsizer X2, Retsch Technology GmbH, Haan, Germany)
was used to measure the powder size distribution from various locations on the build bed. Surface roughness
measurements of metal LPBF samples were taken with a high performance confocal laser scanning
microscope (Keyence VK-X250, Keyence Corporation, Osaka, Japan). Density measurements of the LPBF
samples (𝜌𝑃) were taken using a temperature corrected Archimedes water displacement method using the
equation:
𝜌𝑃 =
𝑊𝐷𝜌𝑤
𝑊𝐷 − 𝑊𝑊
Eq. 1
where 𝑊𝐷 is the dry weight, 𝑊𝑤 is the wet weight and 𝜌𝑤 is the temperature corrected density of distilled
water ASTM B311-17 [27].
2.2 Relative compaction density measurement technique In this work, an ultraviolet (UV) curable polymer was used to measure the relative powder-bed compaction
density. The UV curable polymer was made using 95% Bisphenol-A ethoxylated diacrylate (BAE) and 5%
of a photoinitiator powder (5 wt%), phosphine oxide (Irgacure 819) [28]. It is important to mention that one
of the advantages of using a polymer to bind the powder over the powder capture artefact or powder
sampling techniques is that the powders are not disturbed by the sampling technique, nor by the powder
recoating mechanism interacting with the walls of the powder capture vessel or artefact. However, the
disadvantage of using a polymer is the droplet impact kinetics and the liquid spreading mechanisms [29],
[30]. The impact kinetics can be minimized by having the polymer dispensing nozzle as close as possible
to the powder build bed, whereas the liquid spreading mechanisms are influenced by the flowability and
viscosity of the dispensed polymer. The flowability of any fluid is a function of different parameters such
as media pore size and distribution, liquid-solid interfacial parameters (surface tension, contact angle) and
the viscosity of the liquid [28], [31]. If the polymer has low viscosity and flowability, the primary and
secondary liquid spread mechanisms occur fast, while the polymer covering a large area on the powder-bed
without being able to join the powder layers effectively (Figure 4a). On the other hand, if the polymer is
highly viscous, the sessile polymer droplet attaches to the powder-bed and disturbs the top layer of powder
during the primary liquid spread phase; in the secondary phase of liquid imbibition, the powders may be
dislodged, with it causing a dip in the powder-bed, substantially changing the compaction density (Figure
ACCEPTED MANUSCRIPT
ACCEP
TED M
ANUSC
RIPT
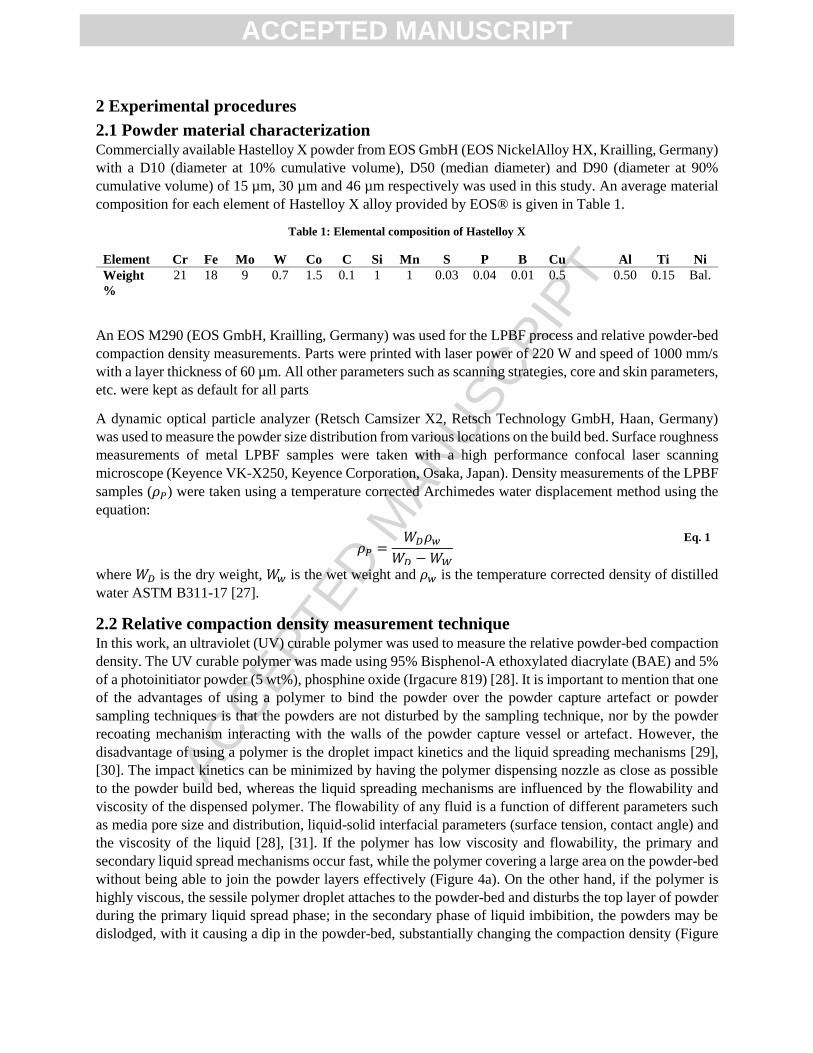
4b). Therefore, it is necessary to use proper polymer composition to achieve effective powder-bed
compaction density samples. The composition of the polymer used in this paper has been selected based on
empirical observations, where no dip was observed in the powder after infiltration, and the samples had
proper integrity during handling after UV curing (Figure 4c).
(a) (b)
(c)
Figure 1: Schematic showing the potential effect of polymer viscosity on the powder-bed compaction density samples with
(a) Less Viscous Polymer (b) High Viscous Polymer (c) A Nano-CT image of the powder-bed compaction density samples
showing proper integrity of the samples after UV curing
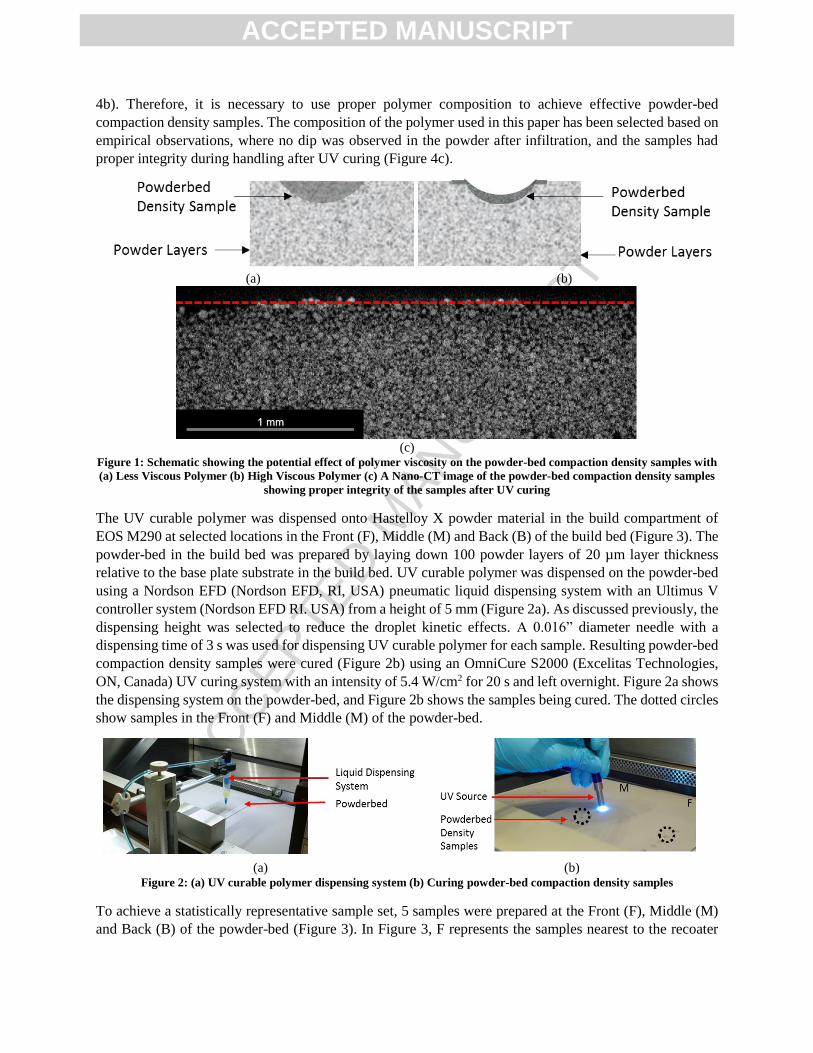
The UV curable polymer was dispensed onto Hastelloy X powder material in the build compartment of
EOS M290 at selected locations in the Front (F), Middle (M) and Back (B) of the build bed (Figure 3). The
powder-bed in the build bed was prepared by laying down 100 powder layers of 20 µm layer thickness
relative to the base plate substrate in the build bed. UV curable polymer was dispensed on the powder-bed
using a Nordson EFD (Nordson EFD, RI, USA) pneumatic liquid dispensing system with an Ultimus V
controller system (Nordson EFD RI. USA) from a height of 5 mm (Figure 2a). As discussed previously, the
dispensing height was selected to reduce the droplet kinetic effects. A 0.016” diameter needle with a
dispensing time of 3 s was used for dispensing UV curable polymer for each sample. Resulting powder-bed
compaction density samples were cured (Figure 2b) using an OmniCure S2000 (Excelitas Technologies,
ON, Canada) UV curing system with an intensity of 5.4 W/cm2 for 20 s and left overnight. Figure 2a shows
the dispensing system on the powder-bed, and Figure 2b shows the samples being cured. The dotted circles
show samples in the Front (F) and Middle (M) of the powder-bed.
(a) (b)
Figure 2: (a) UV curable polymer dispensing system (b) Curing powder-bed compaction density samples
To achieve a statistically representative sample set, 5 samples were prepared at the Front (F), Middle (M)
and Back (B) of the powder-bed (Figure 3). In Figure 3, F represents the samples nearest to the recoater
ACCEPTED MANUSCRIPT

ACCEP
TED M
ANUSC
RIPT
initial position along the spread path, while M and B refer to the intermediate and final recoater positions
along the spread path.
Figure 3: Relative powder-bed compaction density samples configuration on the Front (F), Middle (M) and Back (B) of
the powder-bed. The recoater motion is shown with dotted arrows.
The resulting polymer-encapsulated powder samples (Figure 4a) were removed from the powder-bed and
CT scanned (Xradia 520 Versa, Zeiss) to measure the powder-bed density using a 4X detector on the UV
cured powder-bed density samples with a voxel size of 3 µm at 160 kV, 10W and beam hardening of 0.05
with an exposure time of 4 s for each projection. The greyscale threshold was determined to enable the
attenuation of the polymer, thus showcasing the metal particles only in the final CT dataset.
The scanned 3D projections were reconstructed and analyzed using Dragonfly 3.1 to find the solid fraction
and thus the approximate powder-bed compaction density for all 15 samples, with one such example
illustrated in Figure 4b. Figure 4b shows one such sample, where colors show the different powder particles
trapped in the UV cured polymer.
(a) (b)
Figure 4: (a) UV cured powder-bed sample (b) Processed Nano-CT 3D image of the metal particles entrapped in the UV
polymer sample
ACCEPTED MANUSCRIPT
ACCEP
TED M
ANUSC
RIPT
The current work focuses on calculating the relative powder-bed compaction densities across the build bed
in a LPBF system. The method outlined in this work can be applied to any powder-bed processes such as
binder-jet AM.
2.3 Statistical methodology In this work, relative powder-bed compaction density at 5 locations in the Front, Middle and Back of the
build bed were measured. These replicates allow an appropriate statistical study of the effect of build bed
locations on powder-bed compaction density. A single factor (powder-bed location) analysis of variance
(ANOVA) with a significance level (α) of 0.05 is performed using MATLAB® on the measured powder-
bed compaction densities to study if the location on the build bed has an effect (𝑝 − 𝑣𝑎𝑙𝑢𝑒 < 𝛼) on the
powder-bed compaction densities.
3 Results and discussion
3.1 Relative powder-bed compaction density in the build compartment
The importance of knowing the powder-bed compaction density in AM processes, and specifically in AM
simulations of laser-powder interactions, has been previously highlighted [13], [14], [22]. In this work, the
relative powder-bed compaction densities at select locations across the build bed are measured by
encapsulating powder using a UV curable polymer resin. Results from Section 2.2 show the methodology
used to manufacture and measure the powder-bed compaction density parts using nano-CT. Nano-CT
datasets were processed to extract the encapsulated metal powder matrix and completely attenuate the
polymer volume fraction, having it appear as a void. Correspondingly, for each of the 15 polymer-
encapsulated metal powder samples, the relative powder-bed compaction density was determined using:
𝜌𝑃𝐵 =
𝑉𝑝
𝑉𝑝 + 𝑉𝑟× 100
Eq. 2
where 𝜌𝑃𝐵 is the relative powder-bed compaction density, 𝑉𝑝 is the volume of the particles and 𝑉𝑟 is the
remaining volume occupied by the polymer and any trapped voids in the encapsulated polymer/metal
matrix.
The authors acknowledge the uncertainty margin introduced by using polymer infiltration as a method of
capturing powder-bed density. Although no visible deviation is seen in the powder clusters, there are factors
that may cause unseen deviation drifting the results from sample to sample. The most important factors
contributing to measurement uncertainty are related to the powder-polymer interactions such as, but not
limited to, the droplet impact kinetics with the powder-bed, powder migration due to the initial phase in
sessile droplet imbibition, as well as the shrinkage due to UV polymer cross-linking. Quantifying the
measurement uncertainty for these types of effects is of importance and will be the focus of the authors’
upcoming work. In the context of this work, the authors use the measurements to quantify the “relative”
change between locations across the build bed and not as “absolute” density measurement values.
Corresponding compaction densities from F, M and B of the powder-bed are shown in Table 2 and Figure
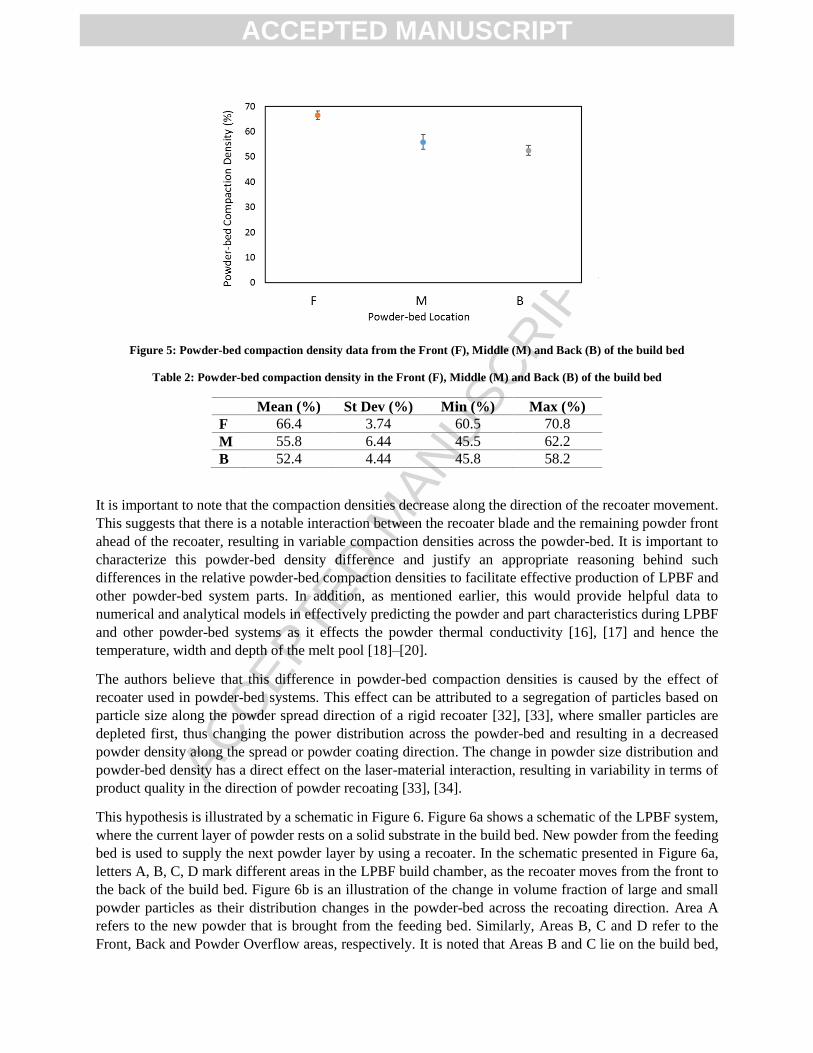
5. Results from Table 2 show the highest powder-bed compaction density (66.4%) near the front of the
powder-bed with decreasing densities of 55.8% and 52.4% in the middle and back of the powder-bed,
respectively. The respective standard deviation (St Dev) and minimum (Min) and maximum (Max) values
for F, M and B of the powder-bed are also shown in Table 2. Results from ANOVA analysis shows a p-
value of 0.0052 which proves that the location of the build bed effects the relative powder-bed compaction
density.
ACCEPTED MANUSCRIPT
ACCEP
TED M
ANUSC
RIPT
Figure 5: Powder-bed compaction density data from the Front (F), Middle (M) and Back (B) of the build bed
Table 2: Powder-bed compaction density in the Front (F), Middle (M) and Back (B) of the build bed
Mean (%) St Dev (%) Min (%) Max (%)
F 66.4 3.74 60.5 70.8
M 55.8 6.44 45.5 62.2
B 52.4 4.44 45.8 58.2
It is important to note that the compaction densities decrease along the direction of the recoater movement.
This suggests that there is a notable interaction between the recoater blade and the remaining powder front
ahead of the recoater, resulting in variable compaction densities across the powder-bed. It is important to
characterize this powder-bed density difference and justify an appropriate reasoning behind such
differences in the relative powder-bed compaction densities to facilitate effective production of LPBF and
other powder-bed system parts. In addition, as mentioned earlier, this would provide helpful data to
numerical and analytical models in effectively predicting the powder and part characteristics during LPBF
and other powder-bed systems as it effects the powder thermal conductivity [16], [17] and hence the
temperature, width and depth of the melt pool [18]–[20].
The authors believe that this difference in powder-bed compaction densities is caused by the effect of
recoater used in powder-bed systems. This effect can be attributed to a segregation of particles based on
particle size along the powder spread direction of a rigid recoater [32], [33], where smaller particles are
depleted first, thus changing the power distribution across the powder-bed and resulting in a decreased
powder density along the spread or powder coating direction. The change in powder size distribution and
powder-bed density has a direct effect on the laser-material interaction, resulting in variability in terms of
product quality in the direction of powder recoating [33], [34].
This hypothesis is illustrated by a schematic in Figure 6. Figure 6a shows a schematic of the LPBF system,
where the current layer of powder rests on a solid substrate in the build bed. New powder from the feeding
bed is used to supply the next powder layer by using a recoater. In the schematic presented in Figure 6a,
letters A, B, C, D mark different areas in the LPBF build chamber, as the recoater moves from the front to
the back of the build bed. Figure 6b is an illustration of the change in volume fraction of large and small
powder particles as their distribution changes in the powder-bed across the recoating direction. Area A
refers to the new powder that is brought from the feeding bed. Similarly, Areas B, C and D refer to the
Front, Back and Powder Overflow areas, respectively. It is noted that Areas B and C lie on the build bed,
ACCEPTED MANUSCRIPT

ACCEP
TED M
ANUSC
RIPT
whereas Area D is the extra powder spilled over after the recoater covers the whole build bed layer. In the
current hypothesis, due to powder size segregation along the spread direction, the powder-bed compaction
densities are expected to change across the powder-bed. As an illustration, in Figure 6b, new powder
contains 7 large and 9 small particles. As the recoater moves from the Front to the Back of the build bed,
areas near the Front of the build bed (Figure 6b – Area B) contain higher volume fraction of smaller particles
which decreases across the recoater direction (Figure 6b – Area C) while the volume fraction of larger
particles increases across the recoater moving direction. These effects are due to factors including the
change in the particle size distribution, powder cohesion, Coulomb and rolling friction, van der Waals
forces, as well as gravitational effects, as the recoater moves from the front to the back of the build bed.
(a)
(b)
Figure 6: (a) Schematic of LPBF powder-bed system with recoater (b) Schematic to explain the differences in powder-bed
compaction density due to powder size effect caused by the recoater
To experimentally validate powder segregation and depletion of small particles along the recoating
direction, the particle size near F, M, and B of the build bed should provide a clear indication on the reasons
for this difference. To characterize this difference, 3 powder samples from the F, M, and B (Figure 3) of
the build bed were measured. The results are summarized in Table 3.
Table 3 shows D10, D50 and D90 from the F, M and B of the build bed and shows the increase in D10,
D50 and D90 size from the Front to the Back of the build bed. This increase in specifically D10 and D90
shows that the volume fraction of the smaller particles decreases as from the Front to the Back of the build
bed due to the recoater effect. This is inline with the proposed hypothesis and simulated studies in the
literature [32]–[34] that the change in powder-bed compaction density across the build bed is due to the
effect of recoater and initial powder size distribution.
ACCEPTED MANUSCRIPT

ACCEP
TED M
ANUSC
RIPT
Table 3: Particle size results
D10 (µm) D50 (µm) D90 (µm)
F 15 28 45
M 18 32 46
B 19 34 49
3.2 Effect of relative powder-bed compaction density on AM-made parts
The results from the previous sections highlight the difference in the relative powder-bed compaction
densities across the powder-bed. It is necessary to measure and quantify the effects of such differences on
printed parts. If the printed parts do not show any differences from the Front to Back of the build bed, than
the effect of accounting for differences in the compaction densities can be assumed to be negligible.
Using the process parameters described in Section 2.0, 12 parts (35x15x6.5 cm) were manufactured in F,
M and B sections of the build bed in a configuration shown in Figure 7a. A representative sample part is
shown in Figure 7b. All parts were manufactured with the same process parameters, without any support
structures. The corresponding values for the density and roughness measurements are shown in Figure 9a
and 9b, respectively.
(a) (b)
Figure 7: (a) Schematic of LPBF-made parts used to measure the effect of powder-bed compaction density on the Front
(F), Middle (M) and Back (B) of build bed (b) Actual printed part
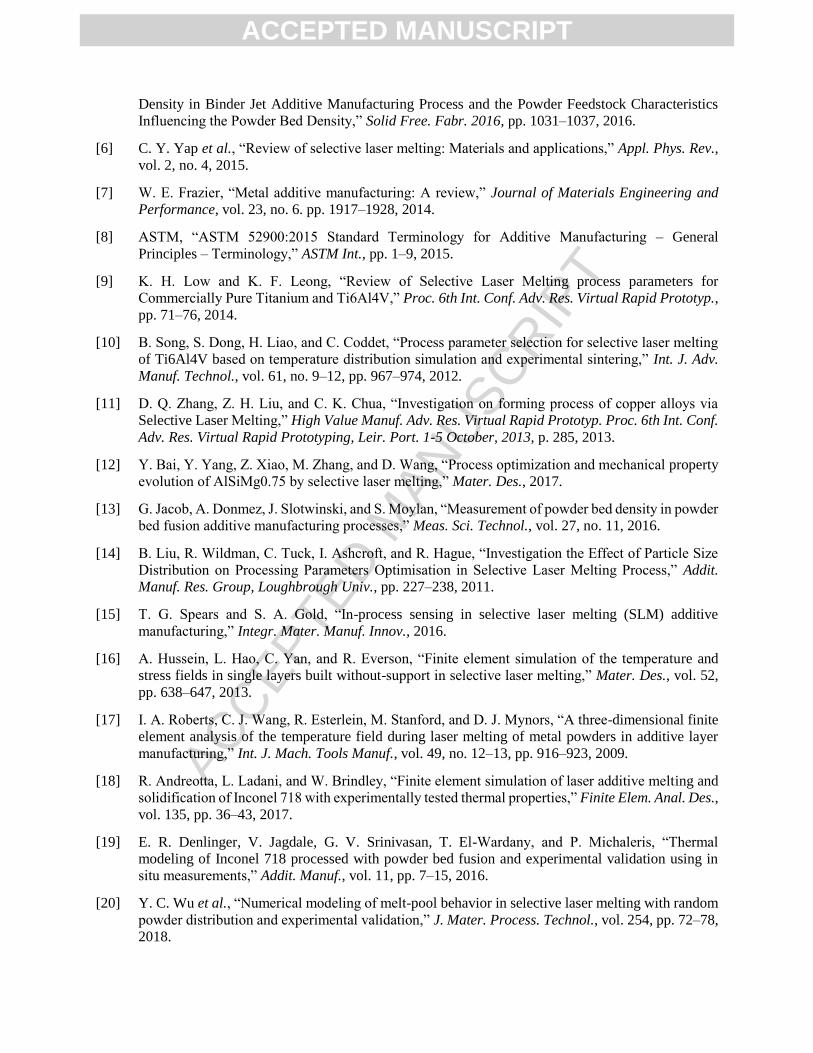
Figure 9a show the mean and error bars from F to B sections of the build bed. Results show that the density
decreases slightly from the Front (99.86%) to the Back (99.79%) of the build bed with the maximum
difference of ~0.25%. The difference in the part densities can be attributed to the difference in powder-bed
compaction densities and powder distribution across the powder-bed. It should be noted that density results
from the LPBF parts in the literature also show a density of around 99.5% for as-built parts [35], [36].
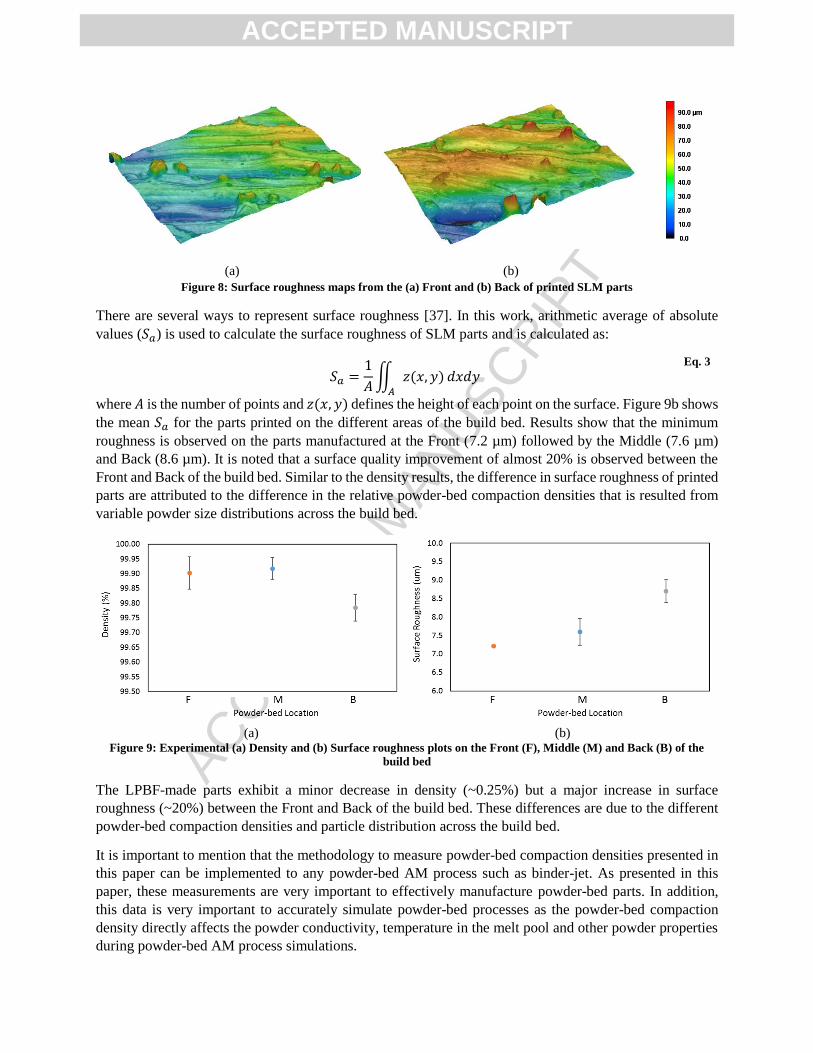
Surface height maps from parts printed on the Front and Back of the build bed are depicted in Figure 8a
and 8b, respectively. It should be noted that both maps have been normalized to have the same scale as
shown in Figure 8. Other than the physical values, it can be clearly seen that the Back of the build bed
exhibits relatively higher peaks (90 µm) compared to the Front (50 µm).
ACCEPTED MANUSCRIPT
ACCEP
TED M
ANUSC
RIPT
(a) (b) Figure 8: Surface roughness maps from the (a) Front and (b) Back of printed SLM parts
There are several ways to represent surface roughness [37]. In this work, arithmetic average of absolute
values (𝑆𝑎) is used to calculate the surface roughness of SLM parts and is calculated as:
𝑆𝑎 =
1
𝐴∬ 𝑧(𝑥, 𝑦)
𝐴
𝑑𝑥𝑑𝑦 Eq. 3
where 𝐴 is the number of points and 𝑧(𝑥, 𝑦) defines the height of each point on the surface. Figure 9b shows
the mean 𝑆𝑎 for the parts printed on the different areas of the build bed. Results show that the minimum
roughness is observed on the parts manufactured at the Front (7.2 µm) followed by the Middle (7.6 µm)
and Back (8.6 µm). It is noted that a surface quality improvement of almost 20% is observed between the
Front and Back of the build bed. Similar to the density results, the difference in surface roughness of printed
parts are attributed to the difference in the relative powder-bed compaction densities that is resulted from
variable powder size distributions across the build bed.
(a) (b)
Figure 9: Experimental (a) Density and (b) Surface roughness plots on the Front (F), Middle (M) and Back (B) of the
build bed
The LPBF-made parts exhibit a minor decrease in density (~0.25%) but a major increase in surface
roughness (~20%) between the Front and Back of the build bed. These differences are due to the different
powder-bed compaction densities and particle distribution across the build bed.
It is important to mention that the methodology to measure powder-bed compaction densities presented in
this paper can be implemented to any powder-bed AM process such as binder-jet. As presented in this
paper, these measurements are very important to effectively manufacture powder-bed parts. In addition,
this data is very important to accurately simulate powder-bed processes as the powder-bed compaction
density directly affects the powder conductivity, temperature in the melt pool and other powder properties
during powder-bed AM process simulations.
ACCEPTED MANUSCRIPT

ACCEP
TED M
ANUSC
RIPT
Conclusions In this work, a new methodology for the measurement of the relative powder-bed compaction density was
presented. The proposed method used a UV curable polymer delivered via a precision pneumatic dispensing
system to encapsulate particles and capture such samples from select locations across the powder-bed. The
cured samples were then CT scanned, and the 3D images processed to obtain the relative value of powder-
bed compaction densities across the build bed. The important conclusions from the conducted study are as
follows:
In line with the recoater moving direction, the powder-bed compaction density measurement results
show a decrease in the compaction densities from the Front (66%) to the Back (52 %) of the build
bed with a high statistical significance (p-value of 0.0052).
The decrease in the powder-bed compaction densities across the build bed are attributed to the
difference in the powder size distributions across the build compartment powder-bed from the Front
to the Back of build bed. D10 - D50 - D90 values change from 15 µm - 28 µm - 45 µm to 19 µm -
34 µm - 49 µm from the Front to the Back of the build bed respectively.
The effect of powder-bed compaction densities on the LPBF-made parts show a decrease in density
(0.25%) and surface quality (20%) of the 3D printed parts from the Front to the Back of the build
bed. However, compared to the density, there is a higher variation in surface roughness from the
Front to the Back of the build bed. In addition, parts printed in the Back of the build bed exhibit
higher surface roughness peaks (90 µm) compared to the parts printed in the Front (50 µm).
Acknowledgements This work was supported by funding from the Natural Sciences and Engineering Research Council of
Canada (NSERC) and the Federal Economic Development Agency for Sothern Ontario (FedDev Ontario)
and the help from Jerry Ratthapakdee and Karl Rautenberg for helping with design and print of the LPBF
parts.
Data Availability The raw data required to reproduce these findings are available to download from
https://MMESynologyMSAM.quickconnect.to/d/f/414193498286203731 . The processed data required to
reproduce these findings are available to download from the same website.
References
[1] E. Herderick, “Additive manufacturing of metals: A review,” Mater. Sci. Technol. Conf. Exhib.
2011, MS T’11, vol. 2, no. 176252, pp. 1413–1425, 2011.
[2] D. Herzog, V. Seyda, E. Wycisk, and C. Emmelmann, “Additive manufacturing of metals,” Acta
Mater., vol. 117, pp. 371–392, 2016.
[3] J. Schmelzle, E. V. Kline, C. J. Dickman, E. W. Reutzel, G. Jones, and T. W. Simpson,
“(Re)Designing for Part Consolidation: Understanding the Challenges of Metal Additive
Manufacturing,” J. Mech. Des., vol. 137, no. 11, p. 111404, 2015.
[4] Y. Hagedorn, Laser additive manufacturing of ceramic components: Materials, processes, and
mechanisms. Elsevier Ltd, 2016.
[5] A. M. Elliott, P. Nandwana, D. Siddel, and B. G. Compton, “A Method for Measuring Powder Bed
ACCEPTED MANUSCRIPT
ACCEP
TED M
ANUSC
RIPT
Density in Binder Jet Additive Manufacturing Process and the Powder Feedstock Characteristics
Influencing the Powder Bed Density,” Solid Free. Fabr. 2016, pp. 1031–1037, 2016.
[6] C. Y. Yap et al., “Review of selective laser melting: Materials and applications,” Appl. Phys. Rev.,
vol. 2, no. 4, 2015.
[7] W. E. Frazier, “Metal additive manufacturing: A review,” Journal of Materials Engineering and
Performance, vol. 23, no. 6. pp. 1917–1928, 2014.
[8] ASTM, “ASTM 52900:2015 Standard Terminology for Additive Manufacturing – General
Principles – Terminology,” ASTM Int., pp. 1–9, 2015.
[9] K. H. Low and K. F. Leong, “Review of Selective Laser Melting process parameters for
Commercially Pure Titanium and Ti6Al4V,” Proc. 6th Int. Conf. Adv. Res. Virtual Rapid Prototyp.,
pp. 71–76, 2014.
[10] B. Song, S. Dong, H. Liao, and C. Coddet, “Process parameter selection for selective laser melting
of Ti6Al4V based on temperature distribution simulation and experimental sintering,” Int. J. Adv.
Manuf. Technol., vol. 61, no. 9–12, pp. 967–974, 2012.
[11] D. Q. Zhang, Z. H. Liu, and C. K. Chua, “Investigation on forming process of copper alloys via
Selective Laser Melting,” High Value Manuf. Adv. Res. Virtual Rapid Prototyp. Proc. 6th Int. Conf.
Adv. Res. Virtual Rapid Prototyping, Leir. Port. 1-5 October, 2013, p. 285, 2013.
[12] Y. Bai, Y. Yang, Z. Xiao, M. Zhang, and D. Wang, “Process optimization and mechanical property
evolution of AlSiMg0.75 by selective laser melting,” Mater. Des., 2017.
[13] G. Jacob, A. Donmez, J. Slotwinski, and S. Moylan, “Measurement of powder bed density in powder
bed fusion additive manufacturing processes,” Meas. Sci. Technol., vol. 27, no. 11, 2016.
[14] B. Liu, R. Wildman, C. Tuck, I. Ashcroft, and R. Hague, “Investigation the Effect of Particle Size
Distribution on Processing Parameters Optimisation in Selective Laser Melting Process,” Addit.
Manuf. Res. Group, Loughbrough Univ., pp. 227–238, 2011.
[15] T. G. Spears and S. A. Gold, “In-process sensing in selective laser melting (SLM) additive
manufacturing,” Integr. Mater. Manuf. Innov., 2016.
[16] A. Hussein, L. Hao, C. Yan, and R. Everson, “Finite element simulation of the temperature and
stress fields in single layers built without-support in selective laser melting,” Mater. Des., vol. 52,
pp. 638–647, 2013.
[17] I. A. Roberts, C. J. Wang, R. Esterlein, M. Stanford, and D. J. Mynors, “A three-dimensional finite
element analysis of the temperature field during laser melting of metal powders in additive layer
manufacturing,” Int. J. Mach. Tools Manuf., vol. 49, no. 12–13, pp. 916–923, 2009.
[18] R. Andreotta, L. Ladani, and W. Brindley, “Finite element simulation of laser additive melting and
solidification of Inconel 718 with experimentally tested thermal properties,” Finite Elem. Anal. Des.,
vol. 135, pp. 36–43, 2017.
[19] E. R. Denlinger, V. Jagdale, G. V. Srinivasan, T. El-Wardany, and P. Michaleris, “Thermal
modeling of Inconel 718 processed with powder bed fusion and experimental validation using in
situ measurements,” Addit. Manuf., vol. 11, pp. 7–15, 2016.
[20] Y. C. Wu et al., “Numerical modeling of melt-pool behavior in selective laser melting with random
powder distribution and experimental validation,” J. Mater. Process. Technol., vol. 254, pp. 72–78,
2018.
ACCEPTED MANUSCRIPT
ACCEP
TED M
ANUSC
RIPT
[21] S. S. Sih and J. W. Barlow, “The prediction of the emissivity and thermal conductivity of powder
beds,” Part. Sci. Technol., vol. 22, no. 4, pp. 427–440, 2004.
[22] N. P. Karapatis, G. Egger, P. E. Gygax, and R. Glardon, “Optimization of powder layer density in
selective laser sintering,” 10th Solid Free. Fabr. Symp., pp. 255–263, 1999.
[23] R. K. McGEARY, “Mechanical Packing of Spherical Particles,” J. Am. Ceram. Soc., vol. 44, no.
10, pp. 513–522, 1961.
[24] A. B. Spierings, N. Herres, and G. Levy, “Influence of the particle size distribution on surface quality
and mechanical properties in AM steel parts,” Rapid Prototyp. J., vol. 17, no. 3, pp. 195–202, 2011.
[25] H. M. Lee, C. Y. Huang, and C. J. Wang, “Forming and sintering behaviors of commercial ??-Al2O3
powders with different particle size distribution and agglomeration,” J. Mater. Process. Technol.,
vol. 209, no. 2, pp. 714–722, 2009.
[26] K. Darcovich, F. Toll, P. Hontanx, V. Roux, and K. Shinagawa, “An experimental and numerical
study of particle size distribution effects on the sintering of porous ceramics,” Mater. Sci. Eng. A,
vol. 348, no. 1–2, pp. 76–83, 2003.
[27] ASTM B311 - 17, “Standard Test Method for Density of Powder Metallurgy ( PM ) Materials
Containing Less Than Two Percent Porosity,” ASTM Int. West Conshohocken, vol. 93, no.
Reapproved, pp. 1–5, 2008.
[28] E. Sheydaeian, K. Sarikhani, P. Chen, and E. Toyserkani, “Material process development for the
fabrication of heterogeneous titanium structures with selective pore morphology by a hybrid additive
manufacturing process,” Mater. Des., vol. 135, pp. 142–150, 2017.
[29] B. Markicevic, T. G. D’Onofrio, and H. K. Navaz, “On spread extent of sessile droplet into porous
medium: Numerical solution and comparisons with experiments,” Phys. Fluids, vol. 22, no. 1, pp.
1–12, 2010.
[30] R. K. Holman, M. J. Cima, S. A. Uhland, and E. Sachs, “Spreading and infiltration of inkjet-printed
polymer solution droplets on a porous substrate,” J. Colloid Interface Sci., vol. 249, no. 2, pp. 432–
440, 2002.
[31] A. Marmur, “Kinetics of penetration into uniform porous media: Testing the equivalent-capillary
concept,” Langmuir, 2003.
[32] H. W. Mindt, M. Megahed, N. P. Lavery, M. A. Holmes, and S. G. R. Brown, “Powder Bed Layer
Characteristics: The Overseen First-Order Process Input,” Metall. Mater. Trans. A Phys. Metall.
Mater. Sci., vol. 47, no. 8, pp. 3811–3822, 2016.
[33] H. W. Mindt, O. Desmaison, M. Megahed, A. Peralta, and J. Neumann, “Modeling of Powder Bed
Manufacturing Defects,” J. Mater. Eng. Perform., vol. 27, no. 1, pp. 32–43, 2018.
[34] J. Zielinski, S. Vervoort, H.-W. Mindt, and M. Megahed, “Influence of Powder Bed Characteristics
on Material Quality in Additive Manufacturing,” BHM Berg- und Hüttenmännische Monatshefte,
vol. 162, no. 5, pp. 192–198, 2017.
[35] F. Wang, X. H. Wu, and D. Clark, “On direct laser deposited Hastelloy X: dimension, surface finish,
microstructure and mechanical properties,” Mater. Sci. Technol., vol. 27, no. 1, pp. 344–356, 2011.
[36] D. Tomus, Y. Tian, P. A. Rometsch, M. Heilmaier, and X. Wu, “Influence of post heat treatments
on anisotropy of mechanical behaviour and microstructure of Hastelloy-X parts produced by
selective laser melting,” Mater. Sci. Eng. A, vol. 667, pp. 42–53, 2016.
ACCEPTED MANUSCRIPT

ACCEP
TED M
ANUSC
RIPT
[37] W. Muhammad, U. Ali, A. P. Brahme, J. Kang, R. K. Mishra, and K. Inal, “Experimental analyses
and numerical modeling of texture evolution and the development of surface roughness during
bending of an extruded aluminum alloy using a multiscale modeling framework,” Int. J. Plast., 2017.
ACCEPTED MANUSCRIPT

ACCEP
TED M
ANUSC
RIPT
Graphical abstract
ACCEPTED MANUSCRIPT
ACCEP
TED M
ANUSC
RIPT
Highlights
A process-independent relative powder-bed compaction density measurement technique is
presented and applied to laser powder-bed fusion.
Ultraviolet curable polymer is used to bind powder particles, followed by
nano-computing tomography scanning on the bonded particles.
Results show variation in the relative powder-bed compaction density across the build bed with
meaningful effects on additively manufactured parts.
ACCEPTED MANUSCRIPT