fluidized bed sputtering for particle and powder … · fluidized bed sputtering for particle and...
TRANSCRIPT

Fluidized Bed Sputtering for Particle and Powder
Metallization
by Daniel M. Baechle, J. Derek Demaree, James K. Hirvonen, and Eric D. Wetzel
ARL-TR-6435 April 2013 Approved for public release; distribution is unlimited.

NOTICES
Disclaimers The findings in this report are not to be construed as an official Department of the Army position unless so designated by other authorized documents. Citation of manufacturer’s or trade names does not constitute an official endorsement or approval of the use thereof. Destroy this report when it is no longer needed. Do not return it to the originator.

Army Research Laboratory Aberdeen Proving Ground, MD 21005-5069
ARL-TR-6435 April 2013
Fluidized Bed Sputtering for Particle and Powder Metallization
Daniel M. Baechle, J. Derek Demaree, James K. Hirvonen
and Eric D. Wetzel Weapons and Materials Research Directorate, ARL
Approved for public release; distribution is unlimited.
ii
REPORT DOCUMENTATION PAGE Form Approved OMB No. 0704-0188
Public reporting burden for this collection of information is estimated to average 1 hour per response, including the time for reviewing instructions, searching existing data sources, gathering and maintaining the data needed, and completing and reviewing the collection information. Send comments regarding this burden estimate or any other aspect of this collection of information, including suggestions for reducing the burden, to Department of Defense, Washington Headquarters Services, Directorate for Information Operations and Reports (0704-0188), 1215 Jefferson Davis Highway, Suite 1204, Arlington, VA 22202-4302. Respondents should be aware that notwithstanding any other provision of law, no person shall be subject to any penalty for failing to comply with a collection of information if it does not display a currently valid OMB control number. PLEASE DO NOT RETURN YOUR FORM TO THE ABOVE ADDRESS. 1. REPORT DATE (DD-MM-YYYY)
April 2013 2. REPORT TYPE
Final 3. DATES COVERED (From - To)
June 2008–June 2012 4. TITLE AND SUBTITLE
Fluidized Bed Sputtering for Particle and Powder Metallization 5a. CONTRACT NUMBER
5b. GRANT NUMBER
5c. PROGRAM ELEMENT NUMBER
6. AUTHOR(S)
Daniel M. Baechle, J. Derek Demaree, James K. Hirvonen, and Eric D. Wetzel 5d. PROJECT NUMBER
5e. TASK NUMBER
5f. WORK UNIT NUMBER
7. PERFORMING ORGANIZATION NAME(S) AND ADDRESS(ES)
U.S. Army Research Laboratory ATTN: RDRL-WMM-A Aberdeen Proving Ground, MD 21005-5069
8. PERFORMING ORGANIZATION REPORT NUMBER
ARL-TR-6435
9. SPONSORING/MONITORING AGENCY NAME(S) AND ADDRESS(ES)
10. SPONSOR/MONITOR’S ACRONYM(S) 11. SPONSOR/MONITOR'S REPORT NUMBER(S)
12. DISTRIBUTION/AVAILABILITY STATEMENT
Approved for public release; distribution is unlimited.
13. SUPPLEMENTARY NOTES
14. ABSTRACT
A system for sputter deposition of thin (10–1000 nm) metal and ceramic coatings onto vibro-fluidized beds of microparticles has been fabricated. Coatings are sputtered onto microparticles of various sizes, shapes, and materials. Experiments show that the coating deposition rate onto particles decreases with decreasing particle size for the case of a fixed total bed mass. Factors affecting particle coating thickness also include sputter power and fluidized bed container size. Coating surface morphology is evaluated using scanning electron microscopy. Lower sputter deposition powers create smoother, less porous coatings. Fluidizing parameters such as driving amplitude and frequency are also shown to affect coating morphology. Barrier coatings on salt microparticles are produced and shown to slow the dissolution of the coated salt particles in water. Dual-layer metal-ceramic coatings are also demonstrated using the sputter deposition technique. A dual-layer aluminum/tin-oxide coating is produced on glass microspheres, which are then shown to have distinct reflectance characteristics and colors. A model is developed to estimate coating thickness based on size, shape, and number of particles. 15. SUBJECT TERMS
fluidized bed, sputter, metallization, microparticles
16. SECURITY CLASSIFICATION OF: 17. LIMITATION OF ABSTRACT
UU
18. NUMBER OF PAGES
42
19a. NAME OF RESPONSIBLE PERSON Daniel M. Baechle
a. REPORT
Unclassified b. ABSTRACT
Unclassified c. THIS PAGE
Unclassified 19b. TELEPHONE NUMBER (Include area code) 410-306-0721
Standard Form 298 (Rev. 8/98) Prescribed by ANSI Std. Z39.18
iii
Contents
List of Figures iv
List of Tables v
Acknowledgments vi
1. Introduction 1
2. Experimental 3
2.1 Materials ..........................................................................................................................3
2.2 System .............................................................................................................................4
2.3 Coating Thickness Characterization ................................................................................6
2.4 Barrier Coatings ..............................................................................................................8
2.5 Optical Coatings ..............................................................................................................8
3. Theoretical Estimation of Coating Thickness 10
3.1 Smooth Coatings on Spherical Particles .......................................................................10
3.2 Smooth Coatings on Cubic Particles .............................................................................12
3.3 Rough Coatings .............................................................................................................12
4. Results 14
4.1 Barrier Coatings ............................................................................................................19
4.2 Optical Coatings ............................................................................................................22
5. Discussion 25
5.1 Coating Thickness .........................................................................................................25
5.2 Coating Morphology .....................................................................................................26
5.3 Barrier Coatings ............................................................................................................27
5.4 Optical Coatings ............................................................................................................27
6. Conclusions 28
7. References 29
List of Symbols, Abbreviations, and Acronyms 31
Distribution List 33

iv
List of Figures
Figure 1. Uncoated glass and salt samples: (a) 230-µm silicon dioxide (SiO2), (b) 35-µm SiO2, and (c) 328-µm NaCl. .......................................................................................................3
Figure 2. (a) Schematic and (b) photo of experimental setup inside the vacuum chamber. ...........5
Figure 3. Coated microspheres mounted on carbon tape. ...............................................................9
Figure 4. Packing structure and repeating unit of hemispherical surface “bumps” for modeling. .................................................................................................................................13
Figure 5. Micrographs (above) and images (below) for (a) uncoated 35-µm glass microspheres and samples coated with Al at (b) 60 W, (c) 90 W, and (d) 120 W. .................15
Figure 6. Micrographs (above) and images (below) for (a) uncoated 230-µm glass microspheres and samples coated with Al at (b) 30 W, (c) 60 W, (d) 90 W, and (e) 120 W. ......................................................................................................................................15
Figure 7. SEM micrographs of Al coatings on 230-µm glass microsphere samples 4–7. ............16
Figure 8. Model and measured coating thickness for (a) 35-µm samples 1–3 and (b) 230-µm samples 4–7 glass microspheres coated with Al. .....................................................................16
Figure 9. Revised model and measured coating thickness for (a) 35-µm samples 1–3 and (b) 230-µm samples 4–7 glass microspheres coated with Al. .......................................................17
Figure 10. SEM micrographs of Al coatings on samples 7–9. .....................................................18
Figure 11. Micrographs (above) and images (below) for (a) uncoated 328-µm salt particles and coated samples (b) 10, (c) 11, and (d) 12. .........................................................................19
Figure 12. The surface of a coated 328-µm salt particle from (a) sample 10 and (b) sample 11. ................................................................................................................................20
Figure 13. (a) Uncrushed and (b) crushed Ti/Al coated particles from sample 12. ......................20
Figure 14. Dissolution experiment results for NaCl from samples 10–12. ..................................21
Figure 15. Hollow metal shells after dissolution of coated salt from sample 12. .........................21
Figure 16. Micrographs (above) and images (below) of sample 13 (a) uncoated, (b) after Al coating, and (c) after SnO2 coating. .........................................................................................22
Figure 17. SEM micrograph of SnO2/Al coating on sample 13. ..................................................23
Figure 18. Optical image of SnO2 coated glass microspheres, sample 13. ...................................23
Figure 19. Particle sizes and corresponding apparent colors from figure 17................................24
Figure 20. Reflectance spectra of individual colored particles. ....................................................25

v
List of Tables
Table 1. Sample and deposition parameters. ..................................................................................6
Table 2. Measured (SEM, RBS) and modeled coating thicknesses. ...............................................7
Table 3. Values used in model calculations. .................................................................................17

vi
Acknowledgments
The spectroscopy data was collected by Dr. Lydia Mathger of the Marine Biological Laboratory. Larry Long assisted in the design and fabrication of the shaker mechanism.

1
1. Introduction
Small particles are often added to material systems to modify mechanical, dielectric, optical, or other properties. However, the particle often needs a coating to optimize its contribution to the material system. For example, a coating can improve the compatibility between a particle and its host matrix, such as for the case of carbon fiber-reinforced aluminum (Al). Typically, corrosion occurs at the carbon fiber-Al interface, reducing fiber-matrix adhesion and the gains in structural properties that might have been realized by incorporating the carbon fibers (1). However, a nickel or copper layer around the fibers could prevent this corrosion, thus improving fiber-matrix adhesion.
Similarly, barrier coatings could improve the compatibility of catalysts used in self-healing polymers (2). In these self-healing systems, damage to the host polymer induces the release of encapsulated liquid monomer, which polymerizes upon contact with embedded catalyst particles to adhesively mend the fracture surfaces. However, some catalyst systems will degrade in activity during exposure to the host matrix during initial processing. Currently, bulk encapsulants such as paraffin wax are used to protect the catalyst particles. However, very thick wax layers are required to fully protect the catalyst particles, and the poor mechanical properties of the wax degrade the bulk mechanical properties of the composite material. Thin metal coatings on the catalyst particles could provide a more protective barrier with little or no degradation in global mechanical properties.
Particle coatings could also be used to create precisely tailored optical properties. Alternating layers of ceramic and metal thin films can be designed to create optical filters that transmit or reflect only certain wavelengths of light (3). These same layered structures could also be deposited onto microspheres, with the coatings selectively tuned to produce specific optical properties. The coated particles could then be added to a parent material, such as a transparent polymer binder, to control the optical properties of the bulk composite system.
Uniform, conformal thin coatings can be deposited onto small particles by combining traditional film-deposition techniques with fluidized bed technology. A fluidized bed of solid particles is typically formed by passing a gas through the particles, or by applying a mechanical vibration to the bed (4–6). Under the right flow or vibration conditions, the particle bed reaches a dynamic state in which the particles move rapidly and randomly throughout the material volume, and the system appears to flow like a fluid. In a vibratory system, the frequency, amplitude, and waveform of the vibration can be used to tune the behavior of the fluidized bed. Different bed masses, particle sizes, shapes, and densities will require different driving frequencies and amplitudes to properly fluidize. The random, dynamic mixing achieved in a fluidized bed makes

2
it an ideal platform for creating full-coverage particle coatings from line-of-sight deposition techniques such as sputtering. Furthermore, the randomization of the mixture leads to uniform and consistent particle coatings even if the deposition source is spatially nonuniform.
Fluidized beds have been used for surface coating of particles using a wide range of deposition techniques. Chemical vapor deposition (CVD) and atomic layer deposition (ALD) have long been used to produce thin coatings, and in recent years fluidized bed technology has been integrated with these deposition techniques. The CVD technique has been used in conjunction with fluidized beds to produce metal and metal-oxide coatings on fine particles (7–9). ALD has been used to produce thin films of alumina on a variety of particles in fluidized beds and most notably nanoparticles and polymers (10–12). Plasma coating techniques have also recently incorporated fluidized beds to coat small particles. Sathiyamoorthy provides a review of plasma technology used with fluidized bed techniques (13). Borer and von Rohr integrated a microwave plasma source into a circulating fluidized bed reactor in order to generate SiOx coatings on salt and silica gel particles (14). Similarly, Morstein et al. (15) used microwave and radio frequency (RF) plasma coupled with a gas-fluidized bed to produce thin titania coatings on glass powders. Chen et al. (16) used an atmospheric plasma system coupled with a gas-fluidized bed to create super-hydrophobic polymer coatings on nickel oxide nanoparticles. Snyder et al. (17) conducted experiments with a RF plasma that was strongly coupled to gas-fluidized glass microspheres.
Researchers at the Lawrence Livermore National Laboratory combined magnetron sputter deposition with mechanically agitated beds to produce coatings on hollow glass microspheres for inertial confinement fusion (ICF) nuclear reactions (18). Magnetron sputtering is a line-of-sight deposition technique that uses a plasma to bombard a target material, ejecting atoms of the target material onto a substrate. Over time, the atoms build up to form a film on the substrate. The experiments at Livermore focused on producing metal coatings on tens to hundreds of particles at a time. Hollow glass spheres 500 µm to 2 mm in diameter were agitated using several methods. The hollow spheres were bounced in a pan driven by a high-frequency piezoelectric shaker or a low-frequency electromagnetic shaker (19, 20). The pan was also spun at low velocity to induce a rolling motion in the spheres, which was found to produce fewer broken spheres and smoother coatings via sputtering and plasma polymerization (21, 22).
In this report, magnetron sputtering is used to deposit thin layers of metal and metal oxides onto microparticles and powders in fluidized beds. Due to the high vacuum required for sputter deposition, high gas flow cannot be used to create fluidization. Instead, vibration alone is used to fluidize the particle system. Microparticles of different sizes, shapes, and materials are coated in batches consisting of millions of particles. Coating deposition rates are shown to obey simple scaling rules that relate coating thickness to bed mass, particle size, and sputter rate. The role of

3
process variables such as vibratory characteristics and sputter power on coating morphology are explored. Finally, the applicability of the technique is demonstrated by creating barrier and optical coatings via deposition of metal, ceramic, and multilayer, multi material coatings on particles and powders.
2. Experimental
2.1 Materials
Two size distributions of glass microspheres from Potters (Potters Industries Inc., Malvern, PA) were coated. Type P-0100 soda-lime glass microspheres had an as-received particle size distribution of 200–400 µm. These particles were sieved to a size distribution of 213–250 µm, and will be referred to as “230-µm” particles for simplicity. Type 3000E E-glass microspheres had an as-received particle size distribution of 1–75 µm, and will be referred to by their manufacturer-reported average diameter of approximately 35 µm. Additionally, sodium chloride (NaCl) (table salt) crystals from Morton (Morton Salt, Chicago, IL) having a sieved size distribution of 300–355 µm were coated and will be referred to as “328-µm” particles. Micrographs of each sample type are shown in figure 1.
Figure 1. Uncoated glass and salt samples: (a) 230-µm silicon dioxide (SiO2), (b) 35-µm SiO2, and (c) 328-µm NaCl.

4
Particle beds for fluidization are reported by weight. Typically, 30 g of salt or glass microspheres were used per sample, and each sample was placed in a separate small glass jar for coating. The sample jars for the baseline experiments had a 55-mm outer diameter, 48-mm inside diameter, and 43-mm mouth diameter (15900-058, VWR International, Bridgeport, NJ).
Several experiments required very thick coatings, so a larger, 90-mm outer diameter dish was used in order to maximize deposition rate (89000-288, VWR International, Bridgeport, NJ). This dish had an inner diameter of approximately 85 mm, and overall inside height of approximately 49 mm.
The sputter deposition targets were 75 mm in diameter, 6 mm thick, and consisted of 99.99% pure Al, 99.995% pure titanium (Ti), or 99.9% pure tin oxide (SnO2) (EJTALXX403A4, EJTTIXX453A4, EJTSNOX303A4, Kurt J. Lesker Company, Clairton, PA).
2.2 System
A picture and schematic of the experimental setup is shown in figure 2. The sputter deposition system consisted of a vacuum chamber (Sharon Vacuum, Brockton, MA), rough pump (DUO10M, Pfeiffer, Asslar, Germany), turbomolecular pump (TMU521P, Pfeiffer), magnetron sputter source (Onyx-3 ICSTD, Angstrom Sciences Inc., Duquesne, PA), recirculating water chiller (Neslab HX-150, Thermo Fisher Scientific, Waltham, MA), a direct current (DC) power supply (MDX500, Advanced Energy, Fort Collins, CO) and a RF power supply (RFX600A, Advanced Energy). The fluidized bed system consisted of a function generator (4003A, BK Precision, Yorba Linda, CA), an amplifier (Pro 500, Hafler, Tempe, AZ), an electromagnetic shaker (V411, Lind Dynamic Systems LTD, Royston, UK), a rotary feedthrough (FE103532, Kurt J. Lesker Company, Clairton, PA) to transfer motion from the shaker through the vacuum chamber wall, and a custom-fabricated sample jar holder. The signal from the function generator is amplified by the amplifier and drives the electromagnetic shaker. The shaker drives a lever arm, which transfers motion to the sample holder inside the chamber via the rotary feedthrough on the chamber. The sample holder and jar are positioned directly beneath the magnetron sputter head, with the surface of the particle bed typically 5 cm below the surface of the sputter deposition source. A flat copper witness strip was mounted across the mouth of each sample jar, in order to provide an approximate gauge of the amount of material deposited.

5
Figure 2. (a) Schematic and (b) photo of experimental setup inside the vacuum chamber.
To perform a coating run, the sample cup was first mounted in the fluidized bed apparatus. The particle bed was then fluidized under atmospheric conditions by turning on the shaker. Signal frequency, shape, and amplitude were manually “tuned” to properly fluidize the particle bed. Factors affecting the type of signal required for fluidization include particle size, shape, density, total mass of particle bed, and sample jar size. Generally, this tuning process was executed visually, adjusting parameters until the bed appeared sufficiently fluidized for good mixing (typically exhibiting a doubling of the apparent volume of the bed) while ensuring that particle energies were not sufficient to eject significant particles from the sample cup. This fluidization tuning was typically performed under atmospheric conditions in the open chamber, to aid visual assessment of the sample. Closing and evacuating the chamber had no visible effect on the fluidization of the bed.
Once fluidization was achieved, the chamber was closed and pumped down using the rough pump. The chamber was then further evacuated using the turbomolecular pump to a base chamber pressure of approximately 2 × 10⁻⁶ torr, measured with an ionization gauge (gauge; 274006 K, Granville-Phillips Co., Boulder, CO, controller; Terranova 935, Duniway Stockroom Corp, Mountain View, CA). The speed of the turbomolecular pump was then changed from 833 to 549 Hz, in order to avoid overheating the pump during deposition. Argon gas was then bled into the chamber until a constant 1-millitorr (mTorr) pressure was reached, as measured with a Pirani gauge (345 series sensor, 945 series controller, Kurt J. Lesker Company).
Once these vacuum conditions were achieved, the DC or RF supply was turned on to power the sputter head, initiate a plasma, and begin sputter deposition. A constant power level was selected and applied to the sputter head for the duration of the deposition, which lasted several hours. Some samples required deposition times totaling more than 8 h for a single sample. For these samples, the chamber was opened at the end of the first day of deposition to inspect the sample.
6
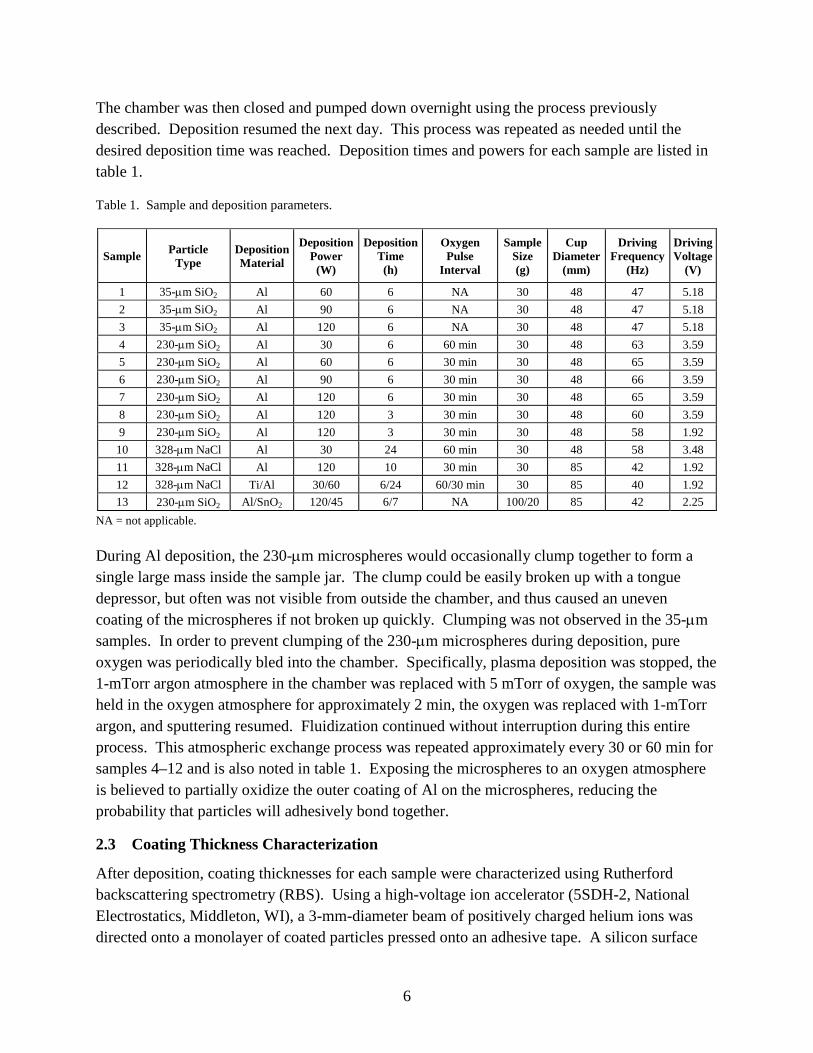
The chamber was then closed and pumped down overnight using the process previously described. Deposition resumed the next day. This process was repeated as needed until the desired deposition time was reached. Deposition times and powers for each sample are listed in table 1.
Table 1. Sample and deposition parameters.
Sample Particle Type
Deposition Material
Deposition Power
(W)
Deposition Time (h)
Oxygen Pulse
Interval
Sample Size (g)
Cup Diameter
(mm)
Driving Frequency
(Hz)
Driving Voltage
(V)
1 35-µm SiO2 Al 60 6 NA 30 48 47 5.18 2 35-µm SiO2 Al 90 6 NA 30 48 47 5.18 3 35-µm SiO2 Al 120 6 NA 30 48 47 5.18 4 230-µm SiO2 Al 30 6 60 min 30 48 63 3.59 5 230-µm SiO2 Al 60 6 30 min 30 48 65 3.59 6 230-µm SiO2 Al 90 6 30 min 30 48 66 3.59 7 230-µm SiO2 Al 120 6 30 min 30 48 65 3.59 8 230-µm SiO2 Al 120 3 30 min 30 48 60 3.59 9 230-µm SiO2 Al 120 3 30 min 30 48 58 1.92 10 328-µm NaCl Al 30 24 60 min 30 48 58 3.48 11 328-µm NaCl Al 120 10 30 min 30 85 42 1.92 12 328-µm NaCl Ti/Al 30/60 6/24 60/30 min 30 85 40 1.92 13 230-µm SiO2 Al/SnO2 120/45 6/7 NA 100/20 85 42 2.25
NA = not applicable.
During Al deposition, the 230-µm microspheres would occasionally clump together to form a single large mass inside the sample jar. The clump could be easily broken up with a tongue depressor, but often was not visible from outside the chamber, and thus caused an uneven coating of the microspheres if not broken up quickly. Clumping was not observed in the 35-µm samples. In order to prevent clumping of the 230-µm microspheres during deposition, pure oxygen was periodically bled into the chamber. Specifically, plasma deposition was stopped, the 1-mTorr argon atmosphere in the chamber was replaced with 5 mTorr of oxygen, the sample was held in the oxygen atmosphere for approximately 2 min, the oxygen was replaced with 1-mTorr argon, and sputtering resumed. Fluidization continued without interruption during this entire process. This atmospheric exchange process was repeated approximately every 30 or 60 min for samples 4–12 and is also noted in table 1. Exposing the microspheres to an oxygen atmosphere is believed to partially oxidize the outer coating of Al on the microspheres, reducing the probability that particles will adhesively bond together.
2.3 Coating Thickness Characterization
After deposition, coating thicknesses for each sample were characterized using Rutherford backscattering spectrometry (RBS). Using a high-voltage ion accelerator (5SDH-2, National Electrostatics, Middleton, WI), a 3-mm-diameter beam of positively charged helium ions was directed onto a monolayer of coated particles pressed onto an adhesive tape. A silicon surface
7
barrier detector subtending a solid angle of approximately 5 millisteradians was then used to measure the energy spectrum of the helium ions, which were elastically backscattered from the sample at a 170° angle. The manipulation and analysis of RBS spectra was accomplished using the RUMP simulation program (Computer Graphic Service, Cortland, OH) and its embedded tabulated values for elastic scattering cross section and ion stopping power. The RBS method measured the amount of coating material on a small population for each sample of particles, typically tens to hundreds of particles at a time. Therefore, the RBS method produced an average thickness for each sample. This method can also determine the composition of the coating, including the presence of oxides formed by oxidation of the Al and Ti coatings.
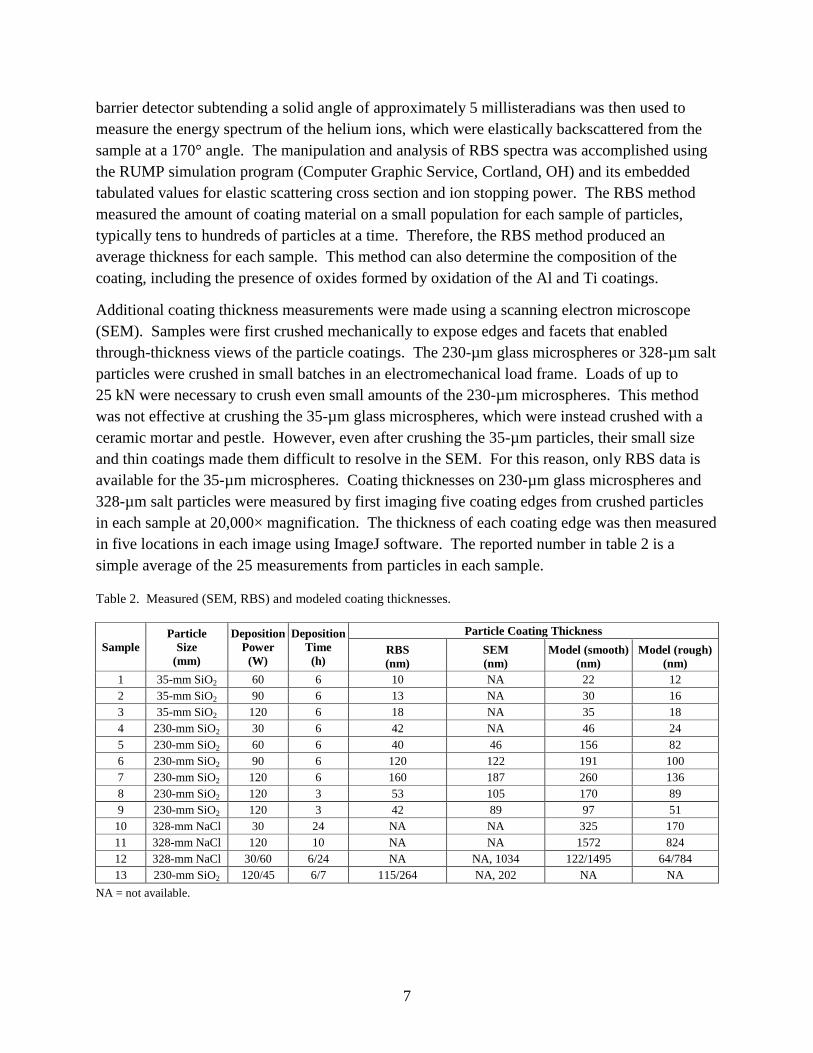
Additional coating thickness measurements were made using a scanning electron microscope (SEM). Samples were first crushed mechanically to expose edges and facets that enabled through-thickness views of the particle coatings. The 230-µm glass microspheres or 328-µm salt particles were crushed in small batches in an electromechanical load frame. Loads of up to 25 kN were necessary to crush even small amounts of the 230-µm microspheres. This method was not effective at crushing the 35-µm glass microspheres, which were instead crushed with a ceramic mortar and pestle. However, even after crushing the 35-µm particles, their small size and thin coatings made them difficult to resolve in the SEM. For this reason, only RBS data is available for the 35-µm microspheres. Coating thicknesses on 230-µm glass microspheres and 328-µm salt particles were measured by first imaging five coating edges from crushed particles in each sample at 20,000× magnification. The thickness of each coating edge was then measured in five locations in each image using ImageJ software. The reported number in table 2 is a simple average of the 25 measurements from particles in each sample.
Table 2. Measured (SEM, RBS) and modeled coating thicknesses.
Sample Particle
Size (mm)
Deposition Power
(W)
Deposition Time
(h)
Particle Coating Thickness RBS (nm)
SEM (nm)
Model (smooth) (nm)
Model (rough) (nm)
1 35-mm SiO2 60 6 10 NA 22 12 2 35-mm SiO2 90 6 13 NA 30 16 3 35-mm SiO2 120 6 18 NA 35 18 4 230-mm SiO2 30 6 42 NA 46 24 5 230-mm SiO2 60 6 40 46 156 82 6 230-mm SiO2 90 6 120 122 191 100 7 230-mm SiO2 120 6 160 187 260 136 8 230-mm SiO2 120 3 53 105 170 89 9 230-mm SiO2 120 3 42 89 97 51
10 328-mm NaCl 30 24 NA NA 325 170 11 328-mm NaCl 120 10 NA NA 1572 824 12 328-mm NaCl 30/60 6/24 NA NA, 1034 122/1495 64/784 13 230-mm SiO2 120/45 6/7 115/264 NA, 202 NA NA
NA = not available.

8
Additionally, after each experiment was complete, each coated copper witness strip was potted in epoxy and polished so a cross-section of the coating could be measured using a microscope and imaging software (LSM 5 microscope with Axiovision 4.7.2 software, Carl Zeiss MicroImaging GmbH, Jena, Germany). Four to six images were taken along the length of each witness cross section. Three to four measurements were taken in each image, and an overall average witness coating thickness was calculated using a simple average. Average coating thickness was then divided by overall deposition time to acquire ft , the average flat deposition rate for each experiment.
2.4 Barrier Coatings
Thicker metal coatings were produced on 328-µm NaCl crystals in an attempt to create protective barrier coatings. Three samples were coated with Al or Ti at different powers and for varying durations. Coating parameters for the three salt samples are shown in table 1. Sample 10 was coated with Al at 30 W for 24 h, and sample 11 was coated with Al at 120 W for 10 h. Sample 12 was coated with Ti at 30 W for 6 h, and then Al at 60 W for 24 h. The Ti layer was used as an adhesion-promoter between the salt and thicker Al layer. Both metals were deposited at lower powers in order to minimize surface features and porosity in the coatings. After coating, approximately 0.5 g of each sample was dissolved in approximately 200 mL of ultra-pure room-temperature water from a purification system (Barnstead Nanopure Infinity D8991, Thermo Fisher Scientific). A 25-mm long stir bar was used in conjunction with a stir plate (Thermolyne Cimarec 2, Thermo Fisher Scientific) on the lowest setting to agitate the water. Conductivity of the water was actively recorded during the dissolution experiments using a conductivity meter (Orion 4-Star Plus, Thermo Fisher Scientific).
2.5 Optical Coatings
Optically refractive coatings were produced using the RF power source to sputter deposit SnO2 onto 230-µm microspheres in sample 13. The microspheres were first coated with Al at 120 W for 6 h. A 20 g sample of the Al-coated microspheres was then coated with SnO2 in an 85-mm dish for 7 h at 45 W. Coating parameters for sample 13 are shown in table 1. After coating, particle size measurements on individual particles were made using Image J software (National Institutes of Health, Bethesda MD). Spectroscopy measurements were conducted by placing individual particles representative of the basic colors present (red, blue, yellow, and green) onto carbon tape, shown in figure 3. Five particles of each color were each measured individually using an Ocean Optics QE 65000 spectrometer (Dunedin, FL) attached to a Zeiss Discovery V20 microscope (Thornwood, NY). The particles were illuminated with a white Zeiss LED fiber-optic source and reflectance measurements were taken through the microscope at 150× magnification, in order to capture reflected light from the entire particle but not from the carbon tape. Reflectance values were standardized against an Ocean Optics WS-1 standard and reported as percent reflectance relative to the white standard.

9
Figure 3. Coated microspheres mounted on carbon tape.

10
3. Theoretical Estimation of Coating Thickness
3.1 Smooth Coatings on Spherical Particles
At constant power, the material flux from the sputter head can be approximated as a constant, uniform mass flux of M acting over a flux area As. This mass flux can be re-expressed as a linear coating rate ft in thickness per unit time according to
ρMt f = , (1)
where
ρ is the density of the deposited material. If the sputter source acts on a perfectly randomized fluidized bed, the average coating rate pt onto the particles can be expressed as
Tp
sfp S
Att = , (2)
where TpS , the total surface area of the particles in the fluidized bed, can be expressed in terms of the
number of particles Np as
ppTp SNS = . (3)
Equations 1–3 assume that the fluidized bed is confined within a container whose presented area Ac is greater than the flux area As of the sputter source. If instead the flux area is larger than the fluidized bed container area, then the particle coating rate would be expressed as
Tp
cfp S
Att = . (4)
The total number of particles can be found by dividing the mass of all particles in the fluidized bed, T
pm , by the mass of one particle mp, which can be written as
p
Tp
p mm
N = . (5)
The total mass of all particles in the bed can be measured, but the mass of one particle must be calculated to maintain accuracy. The mass of one particle can be expressed as a function of the particle’s density ρp, and volume Vp, giving
ppp Vm ρ= . (6)

11
A particle’s volume can then be expressed as a function of its radius rp, written as
( ) 334 pp rV π= . (7)
Equation 7 can then be substituted into equation 6, yielding
( ) 334 ppp rm πρ= . (8)
Now equation 8 can be substituted into equation 5 to produce
( ) 334 pp
Tp
p rm
Nπρ
= . (9)
The surface area of a particle, Sp from equation 3, can be written as a function of the particle’s radius, which gives
24 pp rS π= . (10)
Equations 9 and 10 can now be substituted into equation 3 and written as
( ) pp
Tp
pp
Tp
pTp r
mr
mrS
ρπρπ
334
4 32 == . (11)
The cross-sectional area of the fluidized bed container can be expressed in terms of cup radius rc, according to
2cc rA π= . (12)
Now, equation 12 and the reduced form of equation 11 can be substituted into equation 4 and further reduced to give
)()3(
2
ppTp
cfT
p
cfp rm
rt
SA
ttρ
π == , (13)
or
Tp
cppfp m
rrtt
3
2πρ = . (14)
Equation 14 shows that the deposition rate onto particles will increase with decreasing particle bed mass, increasing particle size, or increasing cup size (up to the size of the sputter head).

12
3.2 Smooth Coatings on Cubic Particles
We can also develop an expression for deposition rate onto particles with shapes other than spheres. Equations 1–6 remain the same for any particle shape. For the cube-shaped NaCl particles, we can modify equation 7 and write
3pp lV = , (15)
where
pl is the length of one side of the cubic salt particle. Equation 8 then becomes
3ppp lm ρ= . (16)
Equation 16 can now be substituted into equation 5, yielding
3pp
Tp
p lm
Nρ
= . (17)
The surface area of a particle, Sp from equation 3, can be written as a function of the particle’s side length, giving
26 pp lS = . (18)
Equations 17 and 18 can now be substituted into equation 3, and written as
pp
Tp
pp
Tp
pTp l
ml
mlS
ρρ6
6 32 == . (19)
Finally, equation 12 and the reduced form of equation 19 can be substituted into equation 2 and further reduced to give
)()6(
2
ppTp
cfT
p
cfp lm
rt
SA
ttρ
π == , (20)
or
Tp
cppfp m
rltt
6
2πρ = . (21)
3.3 Rough Coatings
The particle coating rate is dependent on the total surface area of the particles in the fluidized bed, and surface roughness can significantly increase the cumulative surface area of the particles. Therefore, it is possible that if the particles have surface roughness, the effective coating thickness will be reduced relative to that of smooth particles.

13
To explore the importance of surface roughness on total fluidized bed area, the previously described model is modified as follows. The surface of each particle is assumed to be covered with idealized, hemispherical “bumps.” An illustration of the assumed packing structure of the bumps and the rectangular repeating unit used in the model are shown in figure 4.
Figure 4. Packing structure and repeating unit of hemispherical surface “bumps” for modeling.
The area of the repeating unit Ar can be written as a function of the bump radius rb, giving
34 2br rA = . (22)
The surface area Sb of the bumps in the repeating unit is then
24 bb rS π= . (23)
The total surface area in the repeating unit can then be written as
)32(2234)2( 2222 πππ +=+=+−= bbbbbrr rrrSrAS . (24)
The number of repeating units on a sphere of diameter rp can be expressed as
34
42
2
b
p
r
pr r
rAS
Nπ
== . (25)
Equations 24 and 25 can be multiplied to find bpS , the total surface area of a sphere with bumps,
which is
( ) 22
22 4
321
3322 p
b
pbrr
bp r
rr
rNSS ππππ
+=+== . (26)

14
Substituting this relationship for the particle surface area in equation 10, the effective particle coating rate from equation 14 becomes
Tp
cppf
bp m
rrtt
33232 2πρ
π+= . (27)
This relationship shows that the presence of uniform, hemispherical bumps on the surface of a spherical particle will reduce the effective coating thickness by approximately a factor of 2. Note that the bump radius, rb, cancels out of this relationship, so that the reduction in effective coating thickness is independent of bump size.
In the case of a cubic particle, the number of repeating units on a particle with side length lp can be expressed as
34
62
2
b
p
r
pr r
lAS
N == . (28)
Similarly to equation 26, we can multiply equations 24 and 28 to find the total surface area of a cube with surface bumps,
( ) 22
22 6
631
32322 p
b
pbrr
bp l
rl
rNSS
+=+==ππ
π . (29)
Substituting this relationship for the cubic particle surface area in equation 19, then the effective particle coating rate from equation 21 becomes
Tp
cppf
bp m
rltt
63232 2πρ
π+= . (30)
Note that as in the case of the spherical particles, the presence of hemispherical bumps decreases the effective coating thickness by approximately a factor of 2.
4. Results
Micrographs and optical images of 35-µm glass microspheres from samples 1–3 are shown in figure 5. Micrographs and optical images of 230-µm glass microspheres from samples 4–7 are shown in figure 6. Figure 7 shows SEM images of the coatings on samples 4–7. The images show a cleaved edge of a crushed microsphere where the glass-coating interface is visible. Generally, coating thickness and roughness appears to increase with sputter power. In fact, the

15
coatings at 90 and 120 W appear to be so highly textured that they may not be continuous, instead exhibiting holes or pits in the coating that appear to extend down to the surface of the base microsphere.
Figure 5. Micrographs (above) and images (below) for (a) uncoated 35-µm glass microspheres and samples coated with Al at (b) 60 W, (c) 90 W, and (d) 120 W.
Figure 6. Micrographs (above) and images (below) for (a) uncoated 230-µm glass microspheres and samples coated with Al at (b) 30 W, (c) 60 W, (d) 90 W, and (e) 120 W.

16
Figure 7. SEM micrographs of Al coatings on 230-µm glass microsphere samples 4–7.
Coating thickness versus sputter power for 35- and 230-µm particles are shown in figure 8a and 8b, respectively. It is apparent that coating thickness increases approximately linearly with sputter power. The SEM and RBS thickness measurements for the 230-µm particles (figure 8b) show good agreement, providing high confidence in the accuracy of both characterization techniques. RBS and SEM data for coating thicknesses of samples 1–7 are shown in table 2.
Figure 8. Model and measured coating thickness for (a) 35-µm samples 1–3 and (b) 230-µm samples 4–7 glass microspheres coated with Al.

17
Figure 8 compares model data for smooth spheres (equation 14) to measured coating thicknesses, using the model parameters for each case shown in table 3. While the model correctly predicts a linear rise in coating thickness with sputter power, the model generally overpredicts coating thickness by approximately 2×. Figure 9 compares rough sphere model predictions (equation 27) to measured coating thicknesses. The rough surface model closely matches the experimental data. Although this overlap does not prove that the underlying premise of the rough surface model is fundamentally correct, it does show that the resulting rough-sphere thickness prediction model is capable of providing accurate predictions of coating thickness within a limited range of process and material conditions.
Table 3. Values used in model calculations.
Sample rp (m)
lp (m)
ρp (kg/m3)
(m/s)
1 1.75 × 10⁻⁵ NA 2500 1.16 × 10⁻⁹ 2 1.75 × 10⁻⁵ NA 2500 1.57 × 10⁻⁹ 3 1.75 × 10⁻⁵ NA 2500 1.85 × 10⁻⁹ 4 1.15 × 10⁻⁴ NA 2500 3.72 × 10⁻¹⁰ 5 1.15 × 10⁻⁴ NA 2500 1.25 × 10⁻⁹ 6 1.15 × 10⁻⁴ NA 2500 1.53 × 10⁻⁹ 7 1.15 × 10⁻⁴ NA 2500 2.08 × 10⁻⁹ 8 1.15 × 10⁻⁴ NA 2500 2.72 × 10⁻⁹ 9 1.15 × 10⁻⁴ NA 2500 1.55 × 10⁻⁹ 10 NA 3.28 × 10⁻⁴ 2170 5.25 × 10⁻¹⁰ 11 NA 3.28 × 10⁻⁴ 2170 1.95 × 10⁻⁹ 12 NA 3.28 × 10⁻⁴ 2170 2.52 × 10⁻¹⁰/7.71 × 10–10 13 1.15 × 10⁻⁴ NA 2500 NA
NA = not applicable.
Figure 9. Revised model and measured coating thickness for (a) 35-µm samples 1–3 and (b) 230-µm samples 4–7 glass microspheres coated with Al.
ft

18
Figure 10 compares the coating morphologies of samples 7–9, which were coated at identical powers but for different deposition times and driving voltages. Driving voltage is approximately proportional to shaking amplitude so that, although all samples appeared to be fully fluidized, sample 9 is agitated at approximately half the amplitude of samples 7 and 8. Particle velocities in sample 9 also appeared to be lower than those of samples 7 and 8. Coating thicknesses as measured via RBS and SEM are shown in table 2. Comparing samples 7 and 8, coating roughness appears to become more severe as deposition time increases. Comparing samples 8 and 9, the coating appears to be significantly smoother when the particles are fluidized at lower powers. Table 2 shows that the measured coating thickness for the low-amplitude case (sample 9) is significantly lower than the thickness for the high-amplitude case. Although samples 8 and 9 were both coated at the same sputter power, the average deposition rate from the sputter head (as measured by the witness strip, see ft data in table 3) was higher for sample 8 than it was for sample 9. The cause of the discrepancy in deposition rates between samples 8 and 9 is unknown.
Figure 10. SEM micrographs of Al coatings on samples 7–9.

19
4.1 Barrier Coatings
Micrographs and optical images of 328-µm NaCl microparticles from samples 10–12 are shown in figure 11. An interesting optical feature of the coated salt particles is that, because of their faceted geometry, the coated particle bed appears to “shimmer” due to specular reflection from the metalized facets.
SEM micrographs of the surface of a particle from samples 10 and 11 are shown in figure 12a and 12b, respectively. The coating on sample 10 appears to be very thin, cracked, and poorly adhered to the salt crystal. The coating on sample 11 appears to be very rough, and channels have formed in the coating during the deposition process. SEM micrographs of sample 12 are shown in figure 13. Figure 13b shows the coating thickness at a crushed edge of a particle from sample 12, which was first coated with Ti before coating with Al. The coating on sample 12 appears to have low porosity and good adhesion to the salt.
Figure 11. Micrographs (above) and images (below) for (a) uncoated 328-µm salt particles and coated samples (b) 10, (c) 11, and (d) 12.

20
Figure 12. The surface of a coated 328-µm salt particle from (a) sample 10 and (b) sample 11.
Figure 13. (a) Uncrushed and (b) crushed Ti/Al coated particles from sample 12.
Measured coating thicknesses for samples 10–12 are shown in table 2. Some data is not available due to difficulties acquiring RBS and SEM data for these samples. Samples 10 and 12 were both coated with Al for 24 h at 30 and 60 W, respectively. The models predict that the Al coating on sample 12 should be approximately 5 times higher than that of sample 10, due to the combined effects of higher power and a larger sample dish. The larger sample dish increases the number of particles exposed to the sputter flux at any given time, which in turn increases the average deposition rate onto sample 12 (equation 14).
Conductivity versus time results for water dissolution tests on uncoated and coated salt are shown in figure 14. The uncoated salt dissolved quickly and reached peak conductivity in approximately 100 s. Al-coated samples 10 and 11 dissolved slightly slower, reaching peak conductivity in approximately 150 s.

21
However, the Ti/Al coating on sample 12 slowed dissolution significantly. Coated salt from sample 12 took 720 s to reach peak conductivity: approximately 4.8 times longer than samples 10 and 11 in dissolution, demonstrating the creation of an effective material barrier. After dissolution experiments, it was common to find empty, cubic metal shells left from dissolution of the underlying salt particles (figure 15).
Figure 14. Dissolution experiment results for NaCl from samples 10–12.
Figure 15. Hollow metal shells after dissolution of coated salt from sample 12.

22
4.2 Optical Coatings
Micrographs and optical images of 230-µm glass microspheres from sample 13 are shown in figure 16. SEM and RBS measurements of coating thickness for sample 13 are shown in table 2. An SEM micrograph of sample 13 is shown in figure 17. Model data is not available as the coating on the witness strip fell off during deposition, giving no value for ft . After depositing the SnO2 coating, the particle bed appears to have a purple color. Closer examination shows that the individual particles appear to have individual colors (figure 18). Furthermore, the individual colors appear to correlate with particle size; larger particles appear more blue and green, while smaller particles appear more red or gold. To confirm these trends, the colors of individual particles from figure 18 are plotted against their particle size in figure 19. The plot shows a clear correlation between particle size and color. This correlation implies that the coatings are acting as simple dielectric mirrors, where white light is reflected most strongly over a distinct wavelength band that is proportional to the coating thickness.
Figure 16. Micrographs (above) and images (below) of sample 13 (a) uncoated, (b) after Al coating, and (c) after SnO2 coating.

23
Figure 17. SEM micrograph of SnO2/Al coating on sample 13.
Figure 18. Optical image of SnO2 coated glass microspheres, sample 13.

24
Figure 19. Particle sizes and corresponding apparent colors from figure 17.
Reflectance results for representative particles of each color are shown in figure 20. Noise in the signals below 425 nm is due to poor transmittance of the microscope in this range. Noise in the signals above 700 nm is due to poor output of the light source in this range. The spectrometer takes accurate data in these ranges, thus smoothed black lines have been added to emphasize the trends of the data. All of the curves show two primary peak locations, one below 550 nm and a second above 550 nm. As particle size increases (from yellow to red to blue to green) the peaks shift toward longer wavelengths. The blue and green particles exhibit first reflectance peaks approximately corresponding to their visually observed colors. The first peaks of the red and yellow particles appear near the near-ultraviolet (UV) range, which may not be visually apparent. The second peaks for these particles are closer to the red portion of the spectrum, and these peaks are likely responsible for the particles’ visual appearance. In contrast, the second peaks for the blue and green particles are in the near-infrared (IR) spectrum, which would not be visually observable.

25
Figure 20. Reflectance spectra of individual colored particles.
5. Discussion
5.1 Coating Thickness
SEM and RBS measurements confirm that particle coating thickness scales approximately linearly with deposition power. This trend is expected, as the mass flux emitted from the sputter target scales approximately linearly with deposition power (23). The measured coating thickness of sample 5 was significantly lower than predicted by the model. The cause of this deviation from the expected trend is unclear. Errors in coating thickness measurements may be due to the limited number of measurements using microscopy. The RBS technique may produce measurement errors due to several factors. As mentioned in the experimental section, the ion beam covers a specific area on the sample, and therefore includes scattering events from dozens or hundreds of microparticles. Furthermore, each particle was non-planar, so the apparent thickness of the coating—as estimated by the path length of ions traveling completely through the coating material—was not uniform even across a single particle. However, most of the apparent area of the monolayer of microparticles facing the ion beam contains only the “top” of each particle, where the coating thickness appears most even to the incident ion beam. Ions incident to the coating further away from the center of each microparticle will effectively travel through a

26
thicker coating due to the spherical geometry, causing the average overall coating thickness for the monolayer of microparticles to be slightly higher than it actually is. The RBS coating thicknesses cited in this study are therefore likely to contain a level of error slightly higher than the 5%–10% relative error commonly cited for the usual RBS technique on flat surfaces.
There is a significant decrease in coating thickness with decrease in average particle size. For a set 30-g sample size, there will be roughly 300 times more particles in the 35-µm microsphere sample bed than in the 230-µm microsphere sample bed. This difference in number of particles corresponds to approximately an order of magnitude higher surface area in the 35-µm microsphere bed. Therefore, we can expect the approximate order of magnitude difference in coating thickness between 35-µm samples (1–3) and 230-µm samples (5–7). We might also expect surface area effects to limit the deposition rate onto larger volumes of microparticles. The sputter deposition source currently in use has a practical limit of 250 W, so the basic rate onto particles also has an upper limit. Also note that 35- and 230-µm microspheres require different driving frequencies to fully fluidize, despite having the same material density and bed mass. There may be a limit to the bed mass and particle size that can be fully fluidized with our current system, although no such limit has been found.
5.2 Coating Morphology
Temperature effects may contribute to the observed correlation between sputter power and coating roughness. Higher sputter powers will impart more energy on the fluidized bed, raising the temperature of the particles. Meyer found that coating roughness on sputter-coated microspheres could be caused by the difference in temperature of the microparticles with respect to the melting temperature of the deposition material (18). Meyer also indicated that coating roughness on sputter-coated microspheres could be caused in part by oblique incidence of the deposition material onto the spherical particles, due to the geometry of the particles. Contaminants or dust particles on the surface of the particles at the beginning of metallization could also act as nucleation sites for growth of coating asperities. Microparticles in this report were not cleaned before deposition, and likely had surface dust and contaminants. Meyer also found dust to cause surface roughness during deposition onto microparticles.
Comparing samples 8 and 9, lower vibrational energy input into the system seems to create smaller surface features on the coating. Nikroo et al. (19, 20) also found that lower agitation of their particles resulted in smoother coatings. Vacuum welding may therefore be contributing to coating roughness on the particles. Meyer also observed a tendency of the fluidized particles to clump together during the sputter coating process, similar to that described in the experimental section of this report; he attributed this agglomeration to a vacuum welding mechanism (18). Observed trends in coating roughness for particles in samples 4–9 indicate that coating roughness can be decreased by coating at low powers and using lower vibrational input to

27
fluidize the particle bed. For some applications, however, higher surface area coatings may prove beneficial, for example by enhancing activity for catalytic coatings or by promoting mechanical bonding to a matrix phase.
5.3 Barrier Coatings
The Al barrier coatings on samples 10 and 11 offered little resistance to dissolution. The coatings may have been ineffective due in part to poor adhesion of the Al to the salt. The coating on sample 10 may also have been too thin to provide an effective barrier against water. The coating on sample 11 was much thicker, but also appears to have significant porosity, which likely allowed water to pass through. The thin Ti base coating on sample 12 likely improved overall adhesion between the salt and metal coating, as Ti generally adheres to inert surfaces better than does Al (24). Ti may form stronger bonds with the salt, as evidenced by the melting temperatures of Ti-Cl and Al-Cl compounds (e.g., 1035 °C for TiCl2 and 193 °C for AlCl3 [25]). However, Ti deposits at about half the rate of Al and therefore was only used as a base layer for subsequent coating with Al. The thick Al top coating on sample 12 was deposited at 60 W, which also likely created a low-porosity coating and thus increased barrier efficacy. It is likely that smoother, low-porosity coatings don’t need to be as thick as those of samples 11 and 12 to provide an effective barrier. Further experiments are under way to determine the effect of coating porosity on barrier properties, as well as the optimal coating thickness needed to create a more effective barrier.
5.4 Optical Coatings
The apparent colors of microspheres from sample 13, seen in figures 18 and 19, each correlate to a specific range of microsphere diameters. This correlation may indicate that different size microspheres have different thickness SnO2 coatings, which in turn produce different apparent colors. It is clear that smaller particles will have thinner coatings than larger particles when all other coating and bed parameters are kept the same. However, it is unclear if this relationship remains when various sized particles are mixed together and coated in one bed. Segregation or preferential motion of different size particles in the fluidized bed could also contribute to differences in coating thickness. Preferential motion of larger particle towards the top of a bed of shaken particles having different sizes has long been experimentally observed (26). Such segregation would likely lead to larger particles accumulating thicker coatings, due to longer exposure to the plasma flux.
The reflectance spectra of the individual microspheres in figure 20 likely exhibit multiple reflectance peaks in the UV, visible and IR regimes due to the inherent optical properties of the coating. Differences in thickness of ceramic coatings can cause reflectance peaks to shift dramatically, likely creating the different visually observed colors of the different sized microspheres. Geometric effects associated with the curvature of coatings on spherical particles likely create more subtle changes in reflectance characteristics, such as noise and widening of

28
reflection peaks. Further deposition experiments on beds of particles with distinct sizes and low-size distribution within the bed will be required in order to properly understand the relationship between particle size, coating thickness and apparent color/reflectance peaks. Additionally, the morphology of the SnO2 coating appears to be somewhat rough, porous, and uneven (figure 17). Refinement of the process to produce smoother, better controlled coatings may result in more striking optical features.
6. Conclusions
The experimental results show that it is possible to combine magnetron sputter deposition with fluidized particle beds to coat small particles with metallic, ceramic, and multilayer coatings. Coating thickness and morphology can be tailored by controlling parameters such as bed mass, container size, sputter power, and coating duration. The coated salt experiments demonstrate that sputtered particle coatings can serve as chemical barriers; although, more work is required to tune coating conditions to achieve more uniform and pore-free coatings for improved barrier performance. The multilayer coatings show that the quality of the coatings is sufficient to create optical effects, implying that coatings of relatively low roughness and uniform thickness (over a single particle) can be achieved. The analytical model for coating deposition rate provides reasonable predictions of coating thickness based on material and process parameters. Both sputter coating and fluidized bed processing are established and scalable manufacturing techniques, indicating that the particle coating methodology described here could be practically utilized for creating specialized materials for engineering and industrial applications.

29
7. References
1. Ciby, S.; Pai, B. C.; Satyanarayana, K. G.; Vaidyan, V. K.; Rohatgi, P. K. Structure Formation During Processing Short Carbon Fiber-Reinforced Aluminum Alloy Matrix Composites. Journal of Materials Engineering and Performance 1993, 2 (3), 353–357.
2. Wilson, G. O.; Moore, J. S.; White, S. R.; Sottos, N. R.; Andersson, H. M. Autonomic Healing of Epoxy Vinyl Esters via Ring Opening Metathesis Polymerization. Advanced Functional Materials 2008, 18 (1), 44–52.
3. Hu, M. H.; Guen, K. L.; André, J. M.; Jonnard, P.; Meltchakov, E.; Delmotte, F.; Galtayries, A. Structural Properties of Al/Mo/SiC Multilayers With High Reflectivity for Extreme Ultraviolet Light. Optics Express 2010, 18 (19), 20019–20028.
4. Gupta, C. K.; Sathiyamoorthy, D. Fluid Bed Technology in Materials Processing; CRC: Boca Raton, FL, 1999.
5. Chlenov, V. A.; Mikhailov, N. V. Some Properties of a Vibrating Fluidized Bed. Journal of Engineering Physics and Thermophysics 1965, 9 (2), 137–139.
6. Ryzhkov, A. F.; Putrik, B. A. Formation of a Vibrofluidized Fine-Grain Bed. Journal of Engineering Physics and Thermophysics 1993, 65 (3), 837–848.
7. Yen, Y.; Chen, S. Nickel and Copper Deposition on Fine Alumina Particles by Using the Chemical Vapor Deposition-Circulation Fluidized Bed Reactor Technique. Journal of Materials Science 2000, 35 (6), 1439–1444.
8. Park, J.; Bae, D. H.; Lee, S. Y.; Kwak, J.; Park, H. W.; Lim, J. Large-Scale Production of Titania Nano-Coated Silica-Gel Beads by Fluidized Bed Chemical Vapor Deposition. Korean Journal of Chemical Engineering 2007, 24 (2), 347–349.
9. Hua, B.; Li, C. Production and Characterization of Nanocrystalline SnO2 Films on Al2O3 Agglomerates by CVD in a Fluidized Bed. Materials Chemistry and Physics 1999, 59 (2), 130–135.
10. Hakim, L. F.; George, S. M.; Weimer, A. W. Conformal Nanocoating of Zirconia Nanoparticles by ALD in a Fluidized Bed Reactor. Nanotechnology 2005, (16), S375–385.
11. Hakim, L. F.; Vaughn, C. L.; Dunsheath, H. J.; Carney, C. S.; Liang, X.; Li, P.; Weimer, A. W. Synthesis of Oxidation-Resistant Metal Nanoparticles via Atomic Layer Deposition. Nanotechnology 2007, (18), 345603.
12. Ferguson, J. D.; Weimer, A. W.; George, S. M. Atomic Layer Deposition of Al2O3 Films on Polyethylene Particles. Chemistry of Materials 2004, 16 (26), 5602–5609.

30
13. Sathiyamoorthy, D. Plasma Spouted/Fluidized Bed for Materials Processing. Journal of Physics: Conference Series 2010, 208 (1), 012120.
14. Borer, B.; von Rohr, R. Growth Structure of SiOx Films Deposited on Various Substrate Particles by PECVD in a Circulating Fluidized Bed Reactor. Surface and Coatings Technology 2005, 200, 377–381.
15. Morstein, M.; Karches, M.; Bayer, C.; Casanova, D.; von Rohr, P. R. Plasma CVD of Ultrathin TiO2 Films on Powders in a Circulating Fluidized Bed. Chemical Vapor Deposition 2000, 6 (1), 16–20.
16. Chen, G.; Chen, S.; Feng, W.; Chen, W.; Yang, S. Surface Modification of the Nanoparticles by an Atmospheric Room-Temperature Plasma Fluidized Bed. Applied Surface Science 2008, 254 (13), 3915–3920.
17. Snyder, H. R.; Currier, R. P.; Murillo, M. S. Plasma Fluidized Bed Imaging and Possible Strong Coupling Effects. Applied Physics Letters 2000, 76, (18).
18. Meyer, S. F. Metallic Coating of Microspheres. Journal of Vacuum Science and Technology 1981, 18, I3.
19. Nikroo, A.; Baugh, W.; Steinman, D. A. Fabrication of Gas-Filled Tungsten-Coated Glass Shells. Proceedings of Target Fabrication Specialist’s Meeting No. 15; Gleneden Beach, OR, 2004; Vol. 45, No. 2, pp 202–205.
20. Czechowicz, D. G.; Dorman, J. A.; Geronimo, J. C.; Chen, C. J. Tungsten Sputter Coating Development to Produce High Z Shells. Proceedings of Target Fabrication Specialist’s Meeting No. 17, San Diego, CA, 2007; Vol. 51, No. 4, pp 631–637.
21. Nikroo, A.; Woodhouse, D. Bounce Coating Induced Domes on Glow Discharge Polymer Coated Shells. Proceedings of Target Fabrication Specialists’ Meeting No. 12, Jackson Hole, WY, 1999; Vol. 35, No. 2, pp 202–205.
22. Xu, H. W.; Alford, C. S.; Cooley, J. C.; Dixon, L. A.; Hackenberg, R. E.; Letts, S. A.; Moreno, K. A.; Nikroo, A.; Wall, J. R.; Youngblood, K. P. Beryllium Capsule Coating Development for NIF Targets. Fusion Science and Technology 2007, 51, (4), 547–552.
23. Wasa, K.; Hayakawa, S. Handbook of Sputter Deposition Technology: Principles, Technology and Applications; Noyes Publications: Westwood, 1992.
24. Maluf, N.; Williams, K. An Introduction to Microelectromechanical Systems Engineering; Artech House, Inc.: Norwood, MA, 2004.
25. Haynes, W. M. CRC Handbook of Chemistry and Physics, 91st Edition. CRC: Boca Raton, FL, 2010.
26. Rosato, A.; Strandburg, K.; Prinz, F.; Swendsen, R. Why the Brazil Nuts Are on Top: Size Segregation of Particulate Matter by Shaking. Physical Review Letters 1987, 58 (10), 1038.

31
List of Symbols, Abbreviations, and Acronyms
pt deposition rate onto particles (units, m/s)
ft deposition rate onto flat surface (units, m/s)
TpS total surface area of all particles in fluidized bed (units, m2)
Sp surface area of one particle (units, m2) bpS surface area of a particle with a rough surface (units, m2)
Sb surface area of bumps (units, m2)
Sr surface area of a repeating unit (units, m2) Tpm total mass of all particles in fluidized bed (units, kg)
mp mass of one particle (units, kg)
Vp volume of one particle (units, m3)
Np total number of particles in fluidized bed, NA
ρp density of a particle (units, kg/m3)
As cross-sectional area of sputter head (units, m2)
Ac cross-sectional area of fluidized bed container (units, m2)
Ar area of a repeating unit (units, m2)
rp radius of a particle (units, m)
rc radius of fluidized bed container (units, m)
rb radius of a bump on a particle (units, m)
lp side edge length of a cubic particle (units, m)
Al aluminum
ALD atomic layer deposition
CVD chemical vapor deposition
DC direct current
ICF inertial confinement fusion

32
IR infrared
mTorr millitorr
NaCl sodium chloride
RBS Rutherford backscattering spectrometry
RF radio frequency
SEM scanning electron microscope
SiO2 silicon dioxide
SnO2 tin oxide
Ti titanium
UV ultraviolet

NO. OF COPIES ORGANIZATION
33
1 DEFENSE TECHNICAL (PDF) INFORMATION CTR DTIC OCA 1 DIRECTOR (PDF) US ARMY RESEARCH LAB RDRL CIO LL 1 GOVT PRINTG OFC (PDF) A MALHOTRA 1 RDRL WMM A (PDF) D BAECHLE

34
INTENTIONALLY LEFT BLANK.