on the design of tilting-pad thrust bearings · a design of a tilting-pad bearing is suggested...
TRANSCRIPT

General rights Copyright and moral rights for the publications made accessible in the public portal are retained by the authors and/or other copyright owners and it is a condition of accessing publications that users recognise and abide by the legal requirements associated with these rights.
Users may download and print one copy of any publication from the public portal for the purpose of private study or research.
You may not further distribute the material or use it for any profit-making activity or commercial gain
You may freely distribute the URL identifying the publication in the public portal If you believe that this document breaches copyright please contact us providing details, and we will remove access to the work immediately and investigate your claim.
Downloaded from orbit.dtu.dk on: Mar 23, 2020
On the Design of Tilting-Pad Thrust Bearings
Heinrichson, Niels
Publication date:2007
Document VersionPublisher's PDF, also known as Version of record
Link back to DTU Orbit
Citation (APA):Heinrichson, N. (2007). On the Design of Tilting-Pad Thrust Bearings. Kgs. Lyngby: Technical University ofDenmark.

Niels Heinrichson
On the Design of Tilting-Pad Thrust Bearings
Department of Mechanical EngineeringTechnical University of Denmark

On the Design of Tilting-Pad Thrust Bearings
©Department of Mechanical EngineeringTechnical University of Denmarkby Niels Heinrichson
ISBN 87-90416-22-8

Preface
This thesis is submitted as partial fulfillment of the requirements for awarding the Danish Ph.D.degree. The work has been carried out from August 2003 to October 2006 at the Department of Me-chanical Engineering (MEK), Technical University of Denmark (DTU). The project was supervisedby associate professor Dr.-Ing. Ilmar Ferreira Santos.
The experimental part of the work was carried out during a four month stay at Alstom Power(Switzerland) Ltd., Hydrogenerator Technology Center, Birr, Aargau, Switzerland. I would like tothank Alstom for the opportunity to use their test facilities. And in particular I would like to thankDr.-Ing. Axel Fuerst and Dipl.-Ing. Kamil Matyscak for their help and for good discussions duringmy stay.
Technical University of DenmarkLyngby, October 2006
Niels Heinrichson
i

ii

Abstract
Pockets are often machined in the surfaces of tilting-pad thrust bearings to allow for hydrostaticjacking in the start-up phase. Pockets and other recesses inthe surfaces of bearing pads influencethe pressure distribution and thereby the position of the pivot resulting in the most advantageouspad convergence ratio. In this thesis, a theoretical approach is applied in the attempt to quantify theinfluence of recesses in the pad surfaces. The recesses may berelatively deep and enclosed as is thecase with pockets designed for hydrostatic jacking. Such recesses are characterized by low frictionand a small pressure build-up. As in parallel-step bearingsthe recesses may also have a depth ofthe same order of magnitude as the oil film thickness. Such recesses are characterized by a strongpressure build-up caused by the reduction of the flow area at the end of the recess.
Numerical models based on the Reynolds equation are used. They include the effects of vari-ations of viscosity with temperature and the deformation ofthe bearing pads due to pressure andthermal gradients. The models are validated using measurements.
Tilting-pad bearings of standard design are studied and theinfluences of the bearing length-to-width ratio, pad deformation and injection pocket size are quantified. Suggestions for the designof energy efficient bearings are given. The results show thatcorrectly dimensioned, bearings withoil injection pockets have smaller friction coefficients than bearings with plain pads. Placing thepockets in the high-pressure zones close to the trailing edges of the bearing pads causes a substantialreduction in the friction coefficient. The design of the recess sizes and positions leading to the largestimprovements is studied and design suggestions for variouspad geometries are given.
Parallel-step bearings theoretically have smaller friction coefficients than tilting-pad bearings.A design of a tilting-pad bearing is suggested which combines the benefits of the two types ofbearings in a tilting-pad bearing with inlet pockets. This design results in a substantial reductionof the friction loss. Both this bearing and the bearing design with enclosed recesses in the high-pressure regions of the pads suffer from a higher sensitivity to the position of the pivot. The designof such bearing is therefore no trivial task.
iii

iv

Resume (in Danish)
Der fræses ofte lommer i overfladerne af skoene i aksiale vippeskolejer for at muliggøre hydro-statisk bæring ved opstart af rotoren. Lommer og andre fordybninger i overfladerne af lejeskoenepavirker trykfordelingen og dermed den position af kippunktet, som giver den mest fordelagtigesmørefilmskile. I denne afhandling anvendes en teoretisk fremgangsmade i et forsøg pa at kvan-tificere indflydelsen af fordybninger i overfladerne af lejeskoene. Fordybningerne kan være relativtdybe og indesluttede i skoens overflade, saledes som det er tilfældet med lommer, der anvendes tilhydrostatisk bæring. Den slags fordybninger er karakteriseret ved lav friktion og en lille trykstig-ning. Som i Rayleigh-step lejer kan fordybningerne ogsa have dybde af samme størrelsesorden somoliefilmstykkelsen. Sadanne fordybninger er karakteriseret ved en kraftig trykopbygning som følgeaf reduktionen i strømningsareal ved enden af fordybningen.
Numeriske modeller baseret i Reynoldsligningen er anvendt. De inkluderer effekterne af varia-tioner af viskositeten med temperaturen og deformationer af lejeskoene som følge af tryk og tem-peraturgradienter. Modellerne valideres ved eksperimenter.
Vippeskolejer af standard design undersøges, og indflydelsen af lejernes længde-til-bredde for-hold, skodeformation og størrelsen af lommer til hydrostatisk bæring kvantificeres. Forslag til de-sign af energieffektive lejer gives. Resultater viser, at hvis sko med lommer dimensioneres korrekt,har de lavere friktionskoefficienter end sko uden lommer. Hvis lommerne placeres i højtryksomra-derne tæt pa skoenes bagkanter, kan der opnas en betydeligmindskelse af friktionskoefficienten.Positionen og størrelsen af lommen, som resulterer i de største forbedringer bestemmes og design-forslag for forskellige skogeometrier anføres.
Rayleigh-step lejer har en teoretisk lavere friktionskoefficient end vippeskolejer. Der foreslaset design af vippeskolejer, som kombinerer fordelene ved deto typer lejer i vippeskolejer medindløbslommer. Dette design resulterer i en betydelig reduktion af friktionstabet. Bade dette lejeog lejedesignet med indesluttede lommer i højtryksomraderne af skoene lider af højere følsomhedoverfor positioneringen af dens sfæriske understøtning. Designet af sadanne lejer er derfor ingentriviel opgave.
v

vi

Contents
Preface i
Abstract iii
Resume (in Danish) v
Nomenclature ix
1 Introduction 11.1 Motivation . . . . . . . . . . . . . . . . . . . . . . . . . . . . . . . . . . . . . .. 11.2 Historical Development . . . . . . . . . . . . . . . . . . . . . . . . . . .. . . . . 11.3 Objectives and Contributions . . . . . . . . . . . . . . . . . . . . . .. . . . . . . 31.4 Organisation of the Report . . . . . . . . . . . . . . . . . . . . . . . . .. . . . . 5
2 Mathematical Modelling 72.1 Levels of Modelling . . . . . . . . . . . . . . . . . . . . . . . . . . . . . . .. . . 92.2 Governing Equations (3-dimensional formulation) . . . .. . . . . . . . . . . . . . 10
2.2.1 Fluid film . . . . . . . . . . . . . . . . . . . . . . . . . . . . . . . . . . . 112.2.2 Heat transfer . . . . . . . . . . . . . . . . . . . . . . . . . . . . . . . . . 132.2.3 Deflection of bearing pad . . . . . . . . . . . . . . . . . . . . . . . . .. . 152.2.4 Bearing equilibrium . . . . . . . . . . . . . . . . . . . . . . . . . . . .. 162.2.5 Miscellaneous relations . . . . . . . . . . . . . . . . . . . . . . . .. . . . 16
2.3 Governing Equations (2-dimensional formulation) . . . .. . . . . . . . . . . . . . 162.3.1 Fluid film . . . . . . . . . . . . . . . . . . . . . . . . . . . . . . . . . . . 172.3.2 Heat transfer . . . . . . . . . . . . . . . . . . . . . . . . . . . . . . . . . 172.3.3 Deflection of bearing pad . . . . . . . . . . . . . . . . . . . . . . . . .. . 18
2.4 Numerical Description and Solution Method . . . . . . . . . . .. . . . . . . . . . 182.5 Conclusion . . . . . . . . . . . . . . . . . . . . . . . . . . . . . . . . . . . . . .21
3 Validation of Models 233.1 Comparison with Published Experimental Data . . . . . . . . .. . . . . . . . . . 233.2 Comparison to Measured Data for a Large Sized Bearing . . .. . . . . . . . . . . 273.3 Conclusion . . . . . . . . . . . . . . . . . . . . . . . . . . . . . . . . . . . . . .30
vii
4 Experimental Results 354.1 Test Facility . . . . . . . . . . . . . . . . . . . . . . . . . . . . . . . . . . . .. . 364.2 Measuring System . . . . . . . . . . . . . . . . . . . . . . . . . . . . . . . . .. 364.3 Simulations . . . . . . . . . . . . . . . . . . . . . . . . . . . . . . . . . . . . .. 404.4 Comparison between Experimental and Theoretical Results . . . . . . . . . . . . . 41
4.4.1 Pressure profiles . . . . . . . . . . . . . . . . . . . . . . . . . . . . . . .414.4.2 Oil film thickness . . . . . . . . . . . . . . . . . . . . . . . . . . . . . . .444.4.3 Lift-off oil film thickness . . . . . . . . . . . . . . . . . . . . . . .. . . . 484.4.4 Thermal bending . . . . . . . . . . . . . . . . . . . . . . . . . . . . . . . 50
4.5 Conclusion . . . . . . . . . . . . . . . . . . . . . . . . . . . . . . . . . . . . . .51
5 Analysis of Standard Tilting-Pad Thrust Bearings 535.1 Influences of Oil Injection Pockets and Thermal Bending .. . . . . . . . . . . . . 535.2 The Influence of the Length-to-Width Ratio . . . . . . . . . . . .. . . . . . . . . 575.3 Conclusion . . . . . . . . . . . . . . . . . . . . . . . . . . . . . . . . . . . . . .60
6 Analysis of Tilting-Pad Bearings with Shallow Recesses 636.1 1-Dimensional Double Incline Bearings . . . . . . . . . . . . . .. . . . . . . . . 636.2 Rectangular Parallel-Step Bearing Pads . . . . . . . . . . . . .. . . . . . . . . . 646.3 Rectangular Double Incline Bearing Pads . . . . . . . . . . . . .. . . . . . . . . 666.4 Double Incline Tilting-Pad Thrust Bearings . . . . . . . . . .. . . . . . . . . . . 696.5 Conclusion . . . . . . . . . . . . . . . . . . . . . . . . . . . . . . . . . . . . . .74
7 Analysis of Tilting-Pad Bearings with Deep Recesses 757.1 Comparison to CFD-Model Results . . . . . . . . . . . . . . . . . . . .. . . . . 767.2 Analysis of Tilting-Pad Thrust Bearing . . . . . . . . . . . . . .. . . . . . . . . . 77
7.2.1 1-dimensional isothermal analysis of a linear bearing . . . . . . . . . . . . 797.2.2 Analysis of a bearing with rectangular bearing pads . .. . . . . . . . . . . 797.2.3 3-dimensional analysis of tilting pad thrust bearing. . . . . . . . . . . . . 837.2.4 The influence of recess depth . . . . . . . . . . . . . . . . . . . . . .. . . 877.2.5 Recesses used for hydrostatic jacking . . . . . . . . . . . . .. . . . . . . 89
7.3 Conclusion . . . . . . . . . . . . . . . . . . . . . . . . . . . . . . . . . . . . . .90
8 Summary and Conclusion 93
Bibliography 95
viii

Nomenclature
Latin SymbolsB pad mean arc length [m]c oil specific heat [J/kg/K]dHertz diameter of Hertzian pressure distribution [m]E Young’s modulus of pad material [N/m2]Ffriction friction force [N]Fz axial load on bearing [N]H convection heat transfer coefficient [W/m2/K]h oil film thickness [m]h0 oil film thickness at pivot point [m]hp, hs pocket (recess) depth, step height [m]hle, hte oil film thickness at leading edge, trailing edge [m]K pad convergence ratio,hle/hte − 1 [-]k, kpad oil, pad thermal conductivity [W/m/K]k1, k2 oil specific constants defining viscosity [-]Lend minimum distance between recess and trailing edge [m]Lpad pad mean arc length [m]Lpiv pivot position in the dir. of motion (rectangular pad) [m]Lrecess length of elliptical recess (minor axis) [m]Mr, Mθ, Mrθ, MT pad bending, twisting and thermal bending moments [Nm]Mres resulting moment at pivot point [Nm]mi, me mass flow into pocket, mass flow out of pocket [kg/s]Nu Nusselt number [-]p pressure [N/m2]pinj oil injection pressure [N/m2]Qgen bearing friction loss [W]Qgr, Qout groove heat loss, heat flow out of the computational domain [W]Qoil,le, Qoil,te heat flow in oil at leading edge, trailing edge [W]Qcond,p, Qgen,p conduction into pocket from the pad, pocket friction loss [W]r radial coordinate [m]r1, r2 pad inner radius, pad outer radius [m]rmean, rp, rpiv pad mean radius, radius of circular pocket, pivot radius [m]Re recess Reynolds number,ρUhp/µ [-]ST Source term in the 2-dimensional energy equation [W]
ix

T temperature [K]T0, Ta, Tc, Tp, Tle inlet oil, oil bath, collar, pocket oil, leading edge temperature [K]Tbab, Tback pad babbitt, pad back temperature (used in 2D calculations) [K]tpad, tplate pad thickness, pad plus support thickness [m]U collar speed at mean radius [m/s]ui, ue internal energy in inlet and exit oil to and from the recess [N]Vr, Vθ Kirchhoff shear stresses [N]Vinj, Voil injected oil flow, cooling oil flow [m3/s]vr, vθ, vz velocity components inr, θ andz directions [m/s]Wfric, Winj friction work at collar surface, oil injection work [W]Wpad, Wrecess pad width, width of elliptical recess (major axis) [m]w deflection of pad in the direction ofzpad [m]xoffset offset of pivot from nominal position [m]z coordinate in the direction of film thickness [m]zpad coordinate in the direction of pad thickness [m]
Greek Symbolsαr, αp roll angle, pitch angle of pad [rad]αpad pad thermal expansion coefficient [K−1]η friction coefficient (Friction force / Load) [-]ρ oil density [kg/m3]θ angular coordinate [rad]θ0, θpiv pad angle, pivot angle [rad]θrecess angular position of the centre of the recess [rad]µ0, µp inlet oil, pocket oil viscosity [Ns/m2]ν Poisson’s ratio [-]ω angular velocity of collar [rad/s]
Nondimensionalised quantitiesh h/h0
p ph20/(r2
1ωµ0)
Q Q/(r31θ0ω
2µ0)r r/r1
T T/T0
V inj Vinj/(h0r21ωθ0)
vr vr/(r1ω)vθ vθ/(rω)vz vz/(h0ω)
W W/(r31θ0ω
2µ0)w w/h0
z z/hzpad zpad/tpad
x

αr αrr1/h0
αp αpr1/h0
θ θ/θ0
µ µ/µ0
AbbreviationsTEHD Thermo-Elasto-Hydrodynamic
Refers to a numerical model considering the combined effects of hydrodynamicpressure generation, viscosity variations due to temperature changes and padbending due to pressure and thermal gradients in the bearingpad.
THD Thermo-HydrodynamicRefers to a numerical model considering the combined effects of hydrodynamicpressure generation and viscosity variations due to temperature changes.
ISO IsothermalRefers to a numerical model considering the effects of hydrodynamic pressuregeneration.
xi

xii

Chapter 1
Introduction
1.1 Motivation
Tilting-pad bearings are frequently used in large energy converting machinery (electrical engines,power plants etc.). In hydro power plants tilting-pad thrust bearings are used for carrying the weightof the generators and turbines. The friction in the thrust bearings is responsible for a large amountof the energy losses in hydro power plants.
Operated correctly tilting-pad bearings have an almost infinite lifetime as wear can be com-pletely avoided. Correctly dimensioned the bearings operate in the hydrodynamic lubrication regimeand are only subjected to boundary and mixed lubrication if they are loaded at start-up of the rotor.Using hydrostatic jacking for lifting up the rotor at start-up ensures a full oil film at all operatingconditions.
Due to the rising energy prices the possibilities of reducing the friction in hydro power plants arereceiving increased attention. The energy savings due to reduced friction can often fully depreciatethe initial cost of new bearings in few years when retrofitting an existing power plant with newbearings. The long life expectancy of the tilting-pad bearings allow for more intricate bearinglow friction constructions at higher initial costs. The reduction of friction is therefore of specialinterest in the design of large tilting-pad thrust bearings. Research questions which are taken up inthe present work are related to the necessity of accurate mathematical modelling of the operatingconditions of thrust bearings and to the study of design options reducing the friction.
1.2 Historical Development
The pivot pad bearing was invented by Anthony G. M. Michell in1905 and independently by AlbertKingsbury in 1910 in a slightly different version. Tilting-pad bearings have the great advantage overfixed incline bearings that the pad convergence ratioK = hle
hte− 1 is a function of the position of the
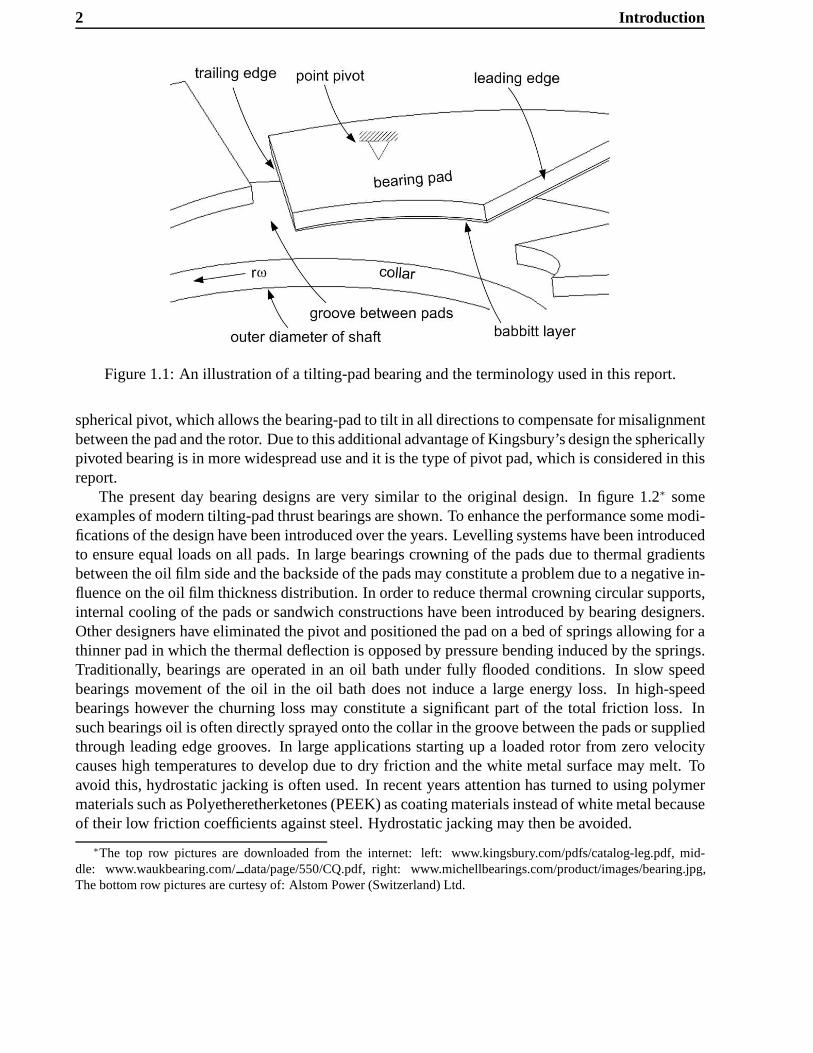
pivot only.K is independent of the operating conditions (when thermal effects and side leakage arenegligible). The load carrying capacity depends strongly on K and fixed incline bearings thereforedo not work well under varying operating conditions. This problem was solved by the introductionof the pivot-pad bearing. A schematic illustration of a tilting-pad thrust bearing is seen in figure 1.1.Michell’s construction was based on a line pivot not allowing for radial pivoting. Kingsbury used a
1
2 Introduction
Figure 1.1: An illustration of a tilting-pad bearing and theterminology used in this report.
spherical pivot, which allows the bearing-pad to tilt in alldirections to compensate for misalignmentbetween the pad and the rotor. Due to this additional advantage of Kingsbury’s design the sphericallypivoted bearing is in more widespread use and it is the type ofpivot pad, which is considered in thisreport.
The present day bearing designs are very similar to the original design. In figure 1.2∗ someexamples of modern tilting-pad thrust bearings are shown. To enhance the performance some modi-fications of the design have been introduced over the years. Levelling systems have been introducedto ensure equal loads on all pads. In large bearings crowningof the pads due to thermal gradientsbetween the oil film side and the backside of the pads may constitute a problem due to a negative in-fluence on the oil film thickness distribution. In order to reduce thermal crowning circular supports,internal cooling of the pads or sandwich constructions havebeen introduced by bearing designers.Other designers have eliminated the pivot and positioned the pad on a bed of springs allowing for athinner pad in which the thermal deflection is opposed by pressure bending induced by the springs.Traditionally, bearings are operated in an oil bath under fully flooded conditions. In slow speedbearings movement of the oil in the oil bath does not induce a large energy loss. In high-speedbearings however the churning loss may constitute a significant part of the total friction loss. Insuch bearings oil is often directly sprayed onto the collar in the groove between the pads or suppliedthrough leading edge grooves. In large applications starting up a loaded rotor from zero velocitycauses high temperatures to develop due to dry friction and the white metal surface may melt. Toavoid this, hydrostatic jacking is often used. In recent years attention has turned to using polymermaterials such as Polyetheretherketones (PEEK) as coatingmaterials instead of white metal becauseof their low friction coefficients against steel. Hydrostatic jacking may then be avoided.
∗The top row pictures are downloaded from the internet: left:www.kingsbury.com/pdfs/catalog-leg.pdf, mid-dle: www.waukbearing.com/data/page/550/CQ.pdf, right: www.michellbearings.com/product/images/bearing.jpg,The bottom row pictures are curtesy of: Alstom Power (Switzerland) Ltd.

1.3 Objectives and Contributions 3
Figure 1.2: Thrust bearings with different features: Leading edge grooves(top left), spray lubrica-tion(top middle), load equilization(top right), PEEK coated pad (bottom left), oil injection pockets(bottom right) .
The improvements in the design of tilting-pad thrust bearings have been aided by the develop-ments in the theoretical description. The analyses of hydrodynamic thrust bearings have predom-inantly been based in the Reynolds equation (Reynolds, 1886) for the pressure distribution. Withthe increasing capacity of computers numerical models havebeen developed including the influ-ences of viscosity variations along and across the lubricating film (Sternlicht et al., 1961; Huebner,1974b; Fust, 1981; Kim et al., 1983) and the inclusion of the deformation of the bearing pads dueto pressure and thermal gradients (Sternlicht et al., 1961;Ettles, 1976, 1980; Pistner, 1996). Heattransfer phenomena have been analysed (Ettles, 1976; Vohr,1981; Heshmat & Pinkus, 1986; Et-tles & Anderson, 1991) and the influence of turbulence in highspeed bearings (Huebner, 1974a;Capitao, 1974; Jeng et al., 1986; Hashimoto, 1990) has been studied.
1.3 Objectives and Contributions
The influence of certain design features on the operating conditions of tilting-pad thrust bearingshave only been treated peripherally in the scientific literature. Leading edge tapers are sometimesused to assist the build-up of the oil film during start-up. Oil injection pockets may be machined

4 Introduction
in the pad surfaces at the pivot points in order to facilitatehydrostatic jacking at start-up. Theseare features which influence the pressure distribution and thereby the oil film thickness. The workspresented in the scientific literature dealing with the combined effects of hydrodynamic pressurebuild up, temperature variations and deformations of the pads assume sector shaped pads withoutcutouts in the surfaces. The interest in accurately determining the operating conditions of tilting-padthrust bearings and the desire to reduce the friction lead tothe following research questions:
The first research question which is taken up, deals with the influence of oil injection pockets onthe operating conditions and dimensioning of tilting-pad thrust bearings.
The second research questionis concerned with, whether improvements in the performance, i.e.a lower friction coefficient and higher load carrying capacity can be achieved by applyingfeatures like deep or shallow cutouts in the surfaces of the bearing pads.
In order to answer these questions a numerical model is developed. It includes the componentsdeveloped in the past, i.e. hydrodynamic pressure build up,temperature variations along and acrossthe lubricant film and bearing pads and the deformation of thepads due to pressure and thermalgradients. It includes options to vary the geometry of the surfaces of the pads so that inlet pocketsand enclosed pockets of various geometry, size and depth canbe studied. The model also allows forinjection of oil in the surfaces of the pads, such as it is usedfor hydrostatic jacking.
The focus of the work is on reducing the friction. The friction force in a tilting-pad bearingcan be quantified as the shear stress in the lubricating oil atthe rotor surface integrated over therotor surface area. Many approaches can be taken in the search for ways to reduce the friction loss.Designing bearings capable of operating at lower lubricantfilm thicknesses and thereby reducingthe bearing area, choosing a lubricant with improved physical properties or changing the lubricantsupply method (New, 1974; Mikula & Gregory, 1983; Mikula, 1988) are approaches which can leadto lower friction coefficients. In the present report the focus is limited to the design of the bearingpads. Parameters such as the oil properties, oil film thickness and thermal conditions are consid-ered given by the design specifications. The attention is on correctly dimensioning pads of standarddesign for small friction coefficients and on suggesting modifications to the design, which result infurther reductions of the power loss.
The major contributions of this work relate to the following:
• The elaboration of a numerical model based on the Reynolds equation extends three dimen-sional thermo-elasto-hydrodynamic (TEHD) analysis of tilting-pad thrust bearings to includethe effects of high pressure injection and recesses in the bearing pads.
• The validation of the model through experiments. Apart from predicting the behaviour oftilting-pad thrust bearings to the same level of accuracy assimilar models published in thescientific literature it is shown that the model can predict the behaviour of bearings withenclosed recesses. The ability of the model to predict the start-up behaviour of bearingssubjected to hydrostatic jacking is similarly validated.

1.4 Organisation of the Report 5
• Combining the parallel-step bearing with the tilting-padbearing in a design with inlet pocketscoverings 60-80 % of the surface areas is suggested. Provided the pivot is positioned cor-rectly the modified bearing pads operate at lower friction coefficients than standard pivot-padbearings.
• Machining a deep recess (one or more orders of magnitude deeper than the oil film thickness)in the surface of a bearing pad creates a low friction zone inside the pad. It is shown that asubstantial reduction in friction compared to conventional bearing designs is possible whendesigning tilting-pad bearings with deep recesses in the high pressure regions. Design chartsare presented stating recess dimensions, recess positionsand the corresponding pivot locationsleading to small friction coefficients.
1.4 Organisation of the Report
The outline of the thesis is as follows:
Chapter 2: Describes and derives the mathematical models which are used to study tilting-padthrust bearings. The models are based in the Reynolds equation and employ 2- or 3-dimensionaltreatment of the temperature distribution in the oil film andin the pad. Whether 2- or 3-dimensional modelling is used depends on the geometry of thestudied lubricant flow.
Chapter 3: The models derived in chapter 2 are validated against measurements published in thescientific literature for a bearing with a plain pad surface.Furthermore, a case study of a largesized bearing with oil injection pockets at the pivot pointsis performed. Oil film thicknessmeasurements are available for comparison. A study of the sensitivity of the bearing operatingconditions to the pocket dimensions is performed.
Chapter 4: Measurements of oil film thickness and pressure profiles at four different radii areperformed on individual pads in a test-rig. A pad with a leading edge taper and a conicaloil injection pocket are measured at various operating conditions. A plain pad is measuredfor reference. The measurements are compared to theoretical results and serve to validate thenumerical model with respect to the description of the pressure changes in the pocket area.
Chapter 5: This chapter studies tilting-pad thrust bearings of standard design. The influence ofoil injection pockets placed at the pivot point as well as theinfluence of thermal bending onthe optimal positioning of the pivot point is studied. Furthermore, the influence of the padlength-to-width ratio on the bearing power loss is investigated.
Chapter 6: Correctly designed parallel-step bearings have smaller friction coefficients than tilting-pad bearings. The possibility of designing a bearing combining the good qualities of the twotypes of bearings is investigated. It is suggested to machine a shallow inlet pocket in thesurfaces of the bearing pads. It is shown that a substantial reduction in the power loss can beachieved.

6 Introduction
Chapter 7: Deep low friction recesses are introduced in the bearing pads. The recesses create lowfriction zones in the high pressure region of the pads. It is shown that a substantial reductionin the friction loss can be achieved if the pads and the recesses are correctly dimensioned.
Chapter 8: Summarises the research presented in the report and outlines the main conclusions.

Chapter 2
Mathematical Modelling
The analysis of lubrication problems is usually based on theReynolds equation which can be derivedthrough an order of dimension analysis from the Navier-Stokes equations. If only the lowest orderterms are retained, these can be introduced in the continuity equation which is then integrated acrossthe fluid film to give the Reynolds equation. This was first shown by Reynolds (1886) for a fluid withconstant properties. Various researchers have since extended the equation to include compressibilityand variations in fluid properties along or across the fluid film. Notably, Dowson (1962) introduceda general extension of the equation to include varying fluid properties both along and across the fluidfilm. The energy equation similarly reduced to contain only the lowest order terms may be solved forthe temperature distribution. It is common practice to use a2-dimensional flat plate approximationto calculate the bending of the bearing pads stemming from pressure and thermal gradients. Modelswhich include the combined effects of hydrodynamic pressure generation, viscosity variations dueto temperature changes and pad bending are termed thermo-elasto-hydrodynamic (TEHD) models.
Many authors have dealt with modelling of hydrodynamic thrust bearings. Sternlicht et al.(1961) presented the first 2-dimensional TEHD analysis of a pivoted thrust pad assuming adiabaticconditions and laminar flow. Design charts (Raimondi & Boyd,1955; Sternlicht & Arwas, 1962)based on 2-dimensional isothermal and TEHD calculations are still used in bearing analysis today.Models including 3-dimensional treatment of the oil temperature include (Huebner, 1974b; Kim etal., 1983; Ettles & Anderson, 1991). Vohr (1981) presented amodel for predicting the operatingtemperature and leading edge temperature.
The influence of turbulence in tilting-pad-thrust bearingshas been studied (Capitao, 1974; Jenget al., 1986; Hashimoto, 1990). Capitaos 2-dimensional work predicts twice the load carrying capac-ity and three times the power loss as would have been predicted through pure laminar modelling.It is generally accepted that the flow can be considered laminar for a modified Reynolds numberRx = ρ0u0h
20/(η0l0) < 1.
With the increasing focus on hybrid journal bearings, models of such bearings have been pre-sented in recent years (San Andres, 1995; Santos & Nicoletti, 1999). They treat temperature as abulk flow property. The flow pattern in bearing pockets and itsinfluence on the pressure distribu-tion has been investigated by the use of Navier-Stokes equation solvers (Ettles & Donoghue, 1971;Braun & Dzodzo, 1995; Helene et al., 2003; Brajdic-Mitidieri et al., 2005). Shinkle & Hornung(1965) showed experimentally and numerically that the pocket flow can be considered laminar forRe < 1000. The influence of pocket size in a centrally pivoted bearing was investigated by Hemmi
7

8 Mathematical Modelling
& Inoue (1999) using an isothermal model.Some flow phenomena which occur in bearings are not convincingly treated by the Reynolds
equation. Stagnation of oil at the leading edge of a pad creates an inertial pressure rise in front ofthe leading edge (Heckelman & Ettles, 1987; Rhim & Tichy, 1989; Kim & Kim, 2002). Similarly,the changes in flow velocity inside a recess in a bearing pad create inertial pressure changes whichare neglected using the classical simplifications employedin lubrication theory (Ettles & Donoghue,1971). Due to such limitations there is a trend towards employing Navier-Stokes equation solvers inthe analysis of bearing fluid flow. The majority of such studies have been isothermal and restrictedto the study of fixed geometry flows. The studies have served the purpose of studying isolatedphenomena such as inertial effects in hydrostatic injection flows. A number of these studies werementioned in the previous paragraph. No analysis using Navier-Stokes equation solvers has beenperformed for the purpose of determining the operating conditions of full tilting-pad bearings. Atpresent the computational effort necessary to analyse problems involving long thin oil films, temper-ature changes and the movement and bending of the solid surfaces renders the use of 3-dimensionalflow modelling very time consuming.
In recent years some focus in the theoretical description ofbearings has turned to the descriptionand inclusion of inertial effects. It has been proposed to include local effects of inertia at fluid filmthickness discontinuities, for instance at the step in a parallel-step bearing, in a Reynolds equationformulation of the flow problem. Arghir et al. (2002) appliedthe approach to an oil lubricateddouble incline step bearing. In a parallel-step bearing theconcentrated inertia effect results in apressure drop at the step because of the acceleration of the fluid at the step. Dobrica & Fillon(2006) applied the approach to a 3-dimensional THD-model ofsuch a bearing of 64 cm2 surfacearea operating using a VG32 oil at U=30 m/s and a minimum oil film thickness of 20µm. Theirresults showed a pressure drop at the step due to concentrated inertia of 1 % of the maximumpressure. This affects the characteristics of the bearing very little. At higher speeds the effectsare larger. No comparative study between experimentally and theoretically determined pressuredistributions validating the accuracy of including inertia by a concentrated inertia approximationhas been published.
Experimental work on micro texturing have shown a potentialfor improving the load carryingcapacity by the inclusion of shallow recesses in the surfaces of bearings, seals and cylinder liners(Etsion & Klingerman, 1999; Etsion et al., 2004). Recently,Glavatskikh et al. (2005) presentedmeasurements showing a reduction in friction and higher oilfilm thickness when equipping a tilting-pad thrust bearing with texturing. Arghir et al. (2003) showed that inertial effects are instrumentalin improving the load carrying capacity and in textured bearings can therefore not be analysed usingthe Reynolds equation.
In the work presented in this report a Reynolds equation formulation of the flow problem isapplied. All effects of inertia are neglected.

2.1 Levels of Modelling 9
U U
Figure 2.1: Illustration of the flow phenomena in the recess areas. Left: A bearing with a deeprecess (3-dimensional grid). Right: A bearing with a shallow recess (2-dimensional grid).
2.1 Levels of Modelling
Models of different levels of detail are used in this report.1-dimensional models∗ for pressure areused in places to examine the potential of a specific geometry. 2-dimensional models for pressure areused in isothermal versions (ISO) or including 2-dimensional temperature calculations (2D-THD)and with the calculation of 2-dimensional thermal bending of the pad (2D-TEHD). 2-dimensionalmodels for pressure are used including 3-dimensional temperature calculations (3D-THD) and withthe calculation of 2-dimensional thermal bending of the pad(3D-TEHD). The 3-dimensional modelsyield a more detailed picture of the temperature distribution than the 2-dimensional models. Heattransfer phenomena can thereby be determined more accurately. Furthermore, the thermal bendingof the pad is much more accurately determined.
In the remainder of this report recesses of different depth are studied. They can be dividedinto two categories which have different properties. A class of recesses termed “deep recesses” areconsidered. The depths of the deep recesses are generally two or more orders of magnitude largerthan the oil film thickness. Another class of recesses are termed “shallow recesses”. The depths ofthe shallow recesses are of the same order of magnitude as theoil film thickness. Flow wise the twoclasses of recesses differ in that there is recirculation flow in the deep recesses while no recirculationin the shallow recesses is predicted by the Reynolds equation. Figure 2.1 schematically shows thetwo different flow situations.
In the studies performed on deep recesses the recesses are enclosed in the bearing surfacesand they have a relatively small surface area (< 20 %) compared to the total bearing area. Therecirculation in a deep recess results in a large amount of mixing of the oil in the volume of therecess. Therefore, the temperature inside the volume of therecess is considered uniform. A 3-dimensional description of the temperature is used in the oil film outside of the recess area. Thisis schematically shown in figure 2.1(left). A 3-dimensionaltreatment of the temperature inside
∗The equation set used in the 1-dimensional models is not given in this report. The description and derivation of1-dimensional models can be found in for instance Hamrock etal. (2004).

10 Mathematical Modelling
Figure 2.2: The coordinate system used for the 3-dimensional calculations.
the recess area would involve a large effort in the construction of the computational grid, raise thecomputation time and make it difficult to study recesses of various geometries.
In the studies involving shallow recesses the fluid inside a recess does not mix as it does in adeep recess. The assumption of a uniform recess temperatureis therefore not valid. A 3-dimensionalformulation would require a grid which stretches into the volume of the recess. A grid as seen infigure 2.1(left) which is stretched with the oil film thickness does not deal well with oil film thicknessdiscontinuities. A more intricate grid is necessary. This would restrict the study of various recessgeometries. It is therefore chosen to use a 2-dimensional formulation in which the energy equationis integrated over the thickness of the oil film.
In section 2.2 the derivation of a 3-dimensional formulation is elaborated. Subsequently insection 2.3 the equation set is reduced to a 2-dimensional formulation.
2.2 Governing Equations (3-dimensional formulation)
The bearing is assumed to be operated using a Newtonian and incompressible fluid and under con-ditions where the flow is laminar and body forces and effects of inertia are negligible. Viscosity isconsidered to vary with temperature only. All other fluid properties are considered constant. The3-dimensional formulation is employed for deep recesses when there is recirculation in the volumeof the recess. The recirculation results in a large amount ofmixing of the oil in the volume of therecess. The temperature inside the volume of the injection recess is considered uniform. Figure2.2 shows the coordinate system used. The governing equations are nondimensionalised using the

2.2 Governing Equations (3-dimensional formulation) 11
following variable transformations:
θ =θ
θ0
, r =r
r1
, z =z
h, zpad =
zpad
tpad
, h =h
h0
, w =w
h0
, αr = αr
r1
h0
,
αp = αp
r1
h0
, vr =vr
r1ω, vθ =
vθ
rω, vz =
vz
h0ω, µ =
µ
µ0
, T =T
T0
,
p =ph2
0
r21ωµ0
, V inj =Vinj
h0r21ωθ0
, Q =Q
r31θ0ω2µ0
, W =W
r31θ0ω2µ0
(2.1)
2.2.1 Fluid film
Subject to the standard reductions and boundary conditionsapplied in fluid film lubrication, themomentum equations are integrated twice across the oil film to give the velocity components in theθ- andr-directions. Thez component is determined using the continuity equation.
vθ =h
2
θ0r2
∂p
∂θ
∫ z
0
zdz
µ−
(
1
F 0
+h
2
θ0r2
∂p
∂θ
F 1
F 0
)∫ z
0
dz
µ+ 1 (2.2)
vr = h2∂p
∂r
∫ z
0
zdz
µ− h
2∂p
∂r
F 1
F 0
∫ z
0
dz
µ(2.3)
vz = −1
r
∂
∂r
∫ z
0
rhvrdz −1
θ0
∂
∂θ
∫ z
0
hvθdz + z∂h
∂rvr +
z
θ0
∂h
∂θvθ (2.4)
F 0 =
∫ 1
0
dz
µ+
hp
µph, F 1 =
∫ 1
0
zdz
µ+
1
µp
(
hp
h+
h2
p
2h2
)
(2.5)
Introducing ther− andθ−velocity components in the continuity equation and integrating acrossthe oil film following the approach suggested by Dowson (1962) the Reynolds equation for 2-dimensional pressure in the oil film becomes:
1
r
∂
∂r
[
G1rh3∂p
∂r
]
+1
θ20r
2
∂
∂θ
[
G1h3 ∂p
∂θ
]
=1
θ0
∂
∂θ
[
h
(
G0
F 0
− 1
)]
− vz,inj (2.6)
G0 =
∫ 1
0
∫ z
0
dz
µdz +
hp
h
∫ 1
0
dz
µ+
h2
p
2h2µp
(2.7)
G1 =
∫ 1
0
∫ z
0
zdz
µdz +
hp
h
∫ 1
0
zdz
µ+
1
6µp
(
h3
p
h3 + 3
h2
p
h2
)
−F 1
F 0
G0 (2.8)
vz,inj is the nondimensionalised injection velocity atz = 1 + hp. At all edges, the pressure is setto zero. Subject to a known viscosity distribution, equation (2.6) can be solved to give the pressuredistribution in the oil film.
The assumption of zero pressure at the leading edge is not strictly valid. The oil entering the padis stagnated at the entrance to the pad resulting in a positive pressure at the leading edge. (Heckel-man & Ettles, 1987; Rhim & Tichy, 1989; Kim & Kim, 2002) have theoretically and experimentally

12 Mathematical Modelling
treated this phenomenon and have derived empirical expressions for the pressure. The pressures pre-dicted by the different expressions vary significantly and acomparison to the experimental resultsstated in chapter 4 have shown that none of the expressions approximate the inlet pressure conditionwell at a large interval of velocities. In large slow speed bearings the leading edge pressure is usu-ally insignificant and the approximation of zero pressure isadequate. The implications of neglectinginertia in a deep recess are discussed in chapter 7.
Keeping the diffusive term in thez−direction only and reducing the dissipative terms followingDowson (1962) the conservative energy equation for the oil film reduces to:
1
r
∂vrrT
∂r+
1
θ0
∂vθT
∂θ−
z
h
∂h
∂r
∂vrT
∂z−
z
θ0h
∂h
∂θ
∂vθT
∂z+
1
h
∂vzT
∂z=
k
ρcωh20
1
h2
∂2T
∂z2 +µ0r
21ω
ρcT0h20
[
µ
h2
(
∂vr
∂z
)2
+µr2
h2
(
∂vθ
∂z
)2] (2.9)
The temperature in the recess is calculated from a control volume formulation using the approx-imations that there is zero thermal diffusion on the oil film/recess boundary and that the temperatureon the solid wall is equal to the recess temperature.
0 =∑
miui −
∑
meue + Qgen,p + Qcond,p (2.10)
Qgen,p designates the heat generated in the recess, andQcond,p designates the heat conducted fromthe pad.ui andue designate the internal energy (du = c · dT ) in the inlet and exit flows into andout of the recess. Using that the mass flows out of and into the recess are equal(
∑
me =∑
mi)due to continuity and expanding the terms in equation (2.10), it can be rewritten to give the recesstemperature:
T p =
[
V inj +
∫
Ai
(
vr
∂h
∂r+
vθ
r
∂h
∂θ+ vz
)
dA
]
−1
·
[
V injT inj +
∫
Ai
(
vr
∂h
∂r+
vθ
r
∂h
∂θ+ vz
)
T idA +µ0r
21ω
ρcTinh20
∫
Ap
µph
∫ 1+hp
1
1
h2
(
∂vr
∂z
)2
dz +
∫ 1+hp
1
r2
h2
(
∂vθ
∂z
)2
dz
dAp −kpad
tpadρh0ωc
∫
Ap
∂T
∂zpad
∣
∣
∣
∣
zpad=0
dA
]
(2.11)
∫ 1+hp
1
1
h2
(
∂vr
∂z
)2
dz =
(
∂p
∂r
)21
µ2p
[
1
3
h3
p
h+ hhp + h
2
phhp
(
F 1
F 0
)2
+ (h2
p + 2hhp)F 1
F 0
]
(2.12)
∫ 1+hp
1
r2
h2
(
∂vθ
∂z
)2
dz =1
θ0
(
∂p
∂θ
)21
µ2pr
2
[
1
3
h3
p
h+ hhp + h
2
p +
hhp
(
F 1
F 0
)2
+ (h2
p + 2hhp)F 1
F 0
]
+1
θ0
∂p
∂θ
1
µ2p
[
2F 1hp
F2
0h−
1
F 0
(
h2
p
h2 + 2
hp
h
)]
(2.13)
Ap is the area of the recess andAi is the area in which there is inflow to the recess from the oil film.Ti is the oil film temperature atz = 1 which is determined by solution of equation (2.9). Equation

2.2 Governing Equations (3-dimensional formulation) 13
(2.12) and equation (2.13) are expansions of the terms in equation (2.11) for the generated heat inthe recess.
In equation (2.9) upwinding is used for the discretization of the convective terms. No boundaryconditions are therefore needed atθ = 1, r = 1 andr = r2 where the flow direction is out of thecomputational domain. Atθ = 0, T = T le. The leading edge temperatureT le is determined insection 2.2.2 of the report. Atz = 0, T = T c which is considered constant in bothr andθ. T c
must be stated as an input to the model. In thez-direction, diffusion is neglected at the boundaryto the recess volume. No boundary condition is therefore needed inside the recess area atz = 1whenvz > 0. T p provides the boundary condition whenvz < 0. The pad temperature gives theboundary condition outside the recess area. The collar temperature depends on the thermal boundaryconditions on the backside of the collar. These can vary depending on how the bearing is built in.To keep the model general and simple it is therefore chosen tostate the collar temperature as aninput.
2.2.2 Heat transfer
Equation (2.14) describes heat transfer in the pad. On the oil/pad-surface, equation (2.15) states theboundary condition on temperature. At the free sides of the pad, the boundary conditions are givenin the form of convection coefficients,H (equation 2.16), whereTa is the oil bath temperature andn represents the normal to the surface. At the inner and outerradial surfaces, a laminar boundarylayer solution is used assuming the free stream velocity to be equal to the collar velocity (equation2.17). Ettles & Anderson (1991) state the correlation givenin equation (2.18) for the convectioncoefficient at the back of the pad. They also state that experiments indicate the values ofH at theleading and trailing surfaces to be twice as high as the valueat the back of the pad. These valuesare used due to the absence of more detailed experimental results.
0 =1
r
∂
∂r
(
r∂T
∂r
)
+1
θ20r
2
∂2T
∂θ2 +
r21
t2pad
∂2T
∂z2pad
(2.14)
∂T
∂zpad
∣
∣
∣
zpad=0=
ktpad
kpadh0h
∂T
∂z
∣
∣
∣
z=1(2.15)
H(T − T a) = −kpad
∂T
∂n(2.16)
Hr =0.332k
r1rθ0θRe
12 Pr
13 , Re =
ρr21ωθpadθr
2
µ, Pr =
cµ
k(2.17)
Hback = 25.5(r1rω)0.7(µ0µ)−0.2L−0.4pad , Lpad =
r1(1 + r2)θpad
2(2.18)
Following the general procedure of Vohr (1981)T a andT le can be determined to fulfil equilib-rium of thermal energy for the entire bearing and for the groove between pads. Assuming that allthe generated heat flows into the oil bath and is mixed with thecold oil, the oil bath temperatureTa
is determined from the heat generated in the oil due to viscous shearQgen. The generated heat iscalculated as the work used to turn the collar plus the work used to inject the oil in the recess. Theoil injection work is calculated neglecting changes in kinetic energy and the influence of restrictors

14 Mathematical Modelling
in the flow. Winj can therefore be determined directly from the pressure change in the injectionflow.
T a = 1 +r31θ0ω
2µ0
cρVoilT0
Qgen , Qgen = W fric + W inj (2.19)
W fric =r1
h0
∫ r2
1
∫ 1
0
r3µ
h
∂vθ
∂z
∣
∣
∣
z=0dθdr , W inj =
r1
h0
V injpinj (2.20)
pinj is the pressure in the oil film at the oil injection pipe determined from the Reynolds equation.The heat balance in the groove is not readily determined. Heat is convected to the collar at the
trailing edge of the pad where the exit oil is hot. At the leading edge of the pad, however the collarmay conduct heat to the oil. Heat is convected from the hot exit oil to the colder oil bath. All thesephenomena are difficult to quantify and few experimental results are available in the literature. Vohr(1981) states an average experimental value of the groove convection coefficientHgr,V ohr = 2960W/m2/K for a bearing ofr1 = 0.43 m, r2 = 0.585 m andθgr,V ohr = 0.105 rad operating atωV ohr = 15.71 rad/s. Vohr’s result is extrapolated using laminar flow theory stating the convectioncoefficient to be proportional to the square root of velocitydivided by the distance between pads.The groove heat transferQgr can then be determined through equation (2.21). Equation (2.23) statesenergy conservation on a control volume. With the additional assumption that no thermal energy istransported in the radial direction in the groove,Tle can be found through equations (2.24), (2.25)and (2.26). Equation (2.26) defines the distribution of leading edge temperature in thez-direction.The equation is chosen for reasons of numerical stability and accuracy and has no physical basis.It ensures continuity of temperature at the collar surface.Continuity of temperature at the collarsurface is important for the global conservation of energy.When a leading edge taper is present inthe analysed bearing, a uniform temperature distribution is used. In this case, there is back flow atthe leading edge and most of the inflow to the bearing occurs close to the collar.
Qgr =T0
r1ω2µ0
∫ r2
1
Hgr(T c − T a)rθgrdr (2.21)
Hgr = Hgr,V ohr
√
θgr,V ohr · ω
θgr · ωV ohr
(2.22)
Qoil,le = Qoil,te − Qgr (2.23)
Qoil,le =T0cρ
ωµ0
∫ 1
0
∫ r2
1
(T − T a)vθhdrdz , at θ = 0 (2.24)
Qoil,te =T0cρ
ωµ0
∫ 1
0
∫ r2
1
(T − T a)vθhdrdz , atθ = 1 (2.25)
T le = T c + (T c − T le,pad)(z2− 2z) (2.26)
The treatment of heat transfer coefficients is coarse and does not take differences in supportdesign into account. equation (2.14) is stated for a pad of uniform thickness although a multilayereddesign is often used in large bearings to reduce thermal deflections. As described in section 2.2.3

2.2 Governing Equations (3-dimensional formulation) 15
the numerical model allows for the analysis of thermal bending of pads of variable thicknesses.The restriction given by the description of heat transfer isthat such a pad of variable thickness iscomposed of a main pad of uniform thickness and a supporting structure. The main pad is treatedin three dimensions while heat transfer through supportingstructures is considered one dimensionalin the zpad-direction only. Generally, only a small amount (5 − 25 %) of the generated heat istransported through the pad. Inexact treatment of heat transfer phenomena therefore only inducessmall errors on the pad and oil temperatures.
2.2.3 Deflection of bearing pad
The deflection of the pad is modelled following Gould (1988) using a flat plate approximation fora plate of variable thickness. A plate of variable thicknessis modelled in order to accommodatesupporting structures, which are tightly fixed to the main pad. An example of the implementationof the equation system on a pad with a firmly fixed circular support is given in chapter 3.2.
The equation system has not been nondimensionalised as it does not simplify the description.Force equilibrium in thezpad-direction yields:
0 =∂
∂r
[
∂(rMr)
∂r+
∂Mrθ
∂θ−Mθ
]
+1
r2
∂
∂θ
[
∂(rMrθ)
∂r+
∂Mθ
∂θ+ Mrθ
]
+ p (2.27)
IntroducingMr, Mθ andMrθ as given by equation (2.29)−(2.33), equation (2.27) transformsinto a fourth order differential equation in pad deflectionw. A pad with a point pivot is restrictedby w = ∂w/∂r = ∂w/∂θ = 0 at the pivot point. The boundary conditions at the free edgesof theplate are stated in equation (2.28). The Kirchhoff shear stresses and bending moments are zero, andat the four corners the twisting moments are zero.tplate denotes the thickness of the plate.
0 = Vθ(r, 0), 0 = Mθ(r, 0), 0 = Vθ(r, θpad), 0 = Mθ(r, θpad),0 = Vr(r1, θ), 0 = Mr(r1, θ), 0 = Vr(r2, θ), 0 = Mr(r2, θ),0 = Mrθ(r1, 0), 0 = Mrθ(r1, θpad), 0 = Mrθ(r2, 0), 0 = Mrθ(r2, θpad)
(2.28)
Mr = −D
[
∂2w
∂r2+ ν
(
1
r
∂w
∂r+
1
r2
∂2w
∂θ2
)]
−MT (2.29)
Mθ = −D
[
1
r
∂w
∂r+
1
r2
∂2w
∂θ2+ ν
∂2w
∂r2
]
−MT (2.30)
Mrθ = −D(1− ν)∂
∂r
(
1
r
∂w
∂θ
)
(2.31)
MT =E
1− ν
∫ tplate
0
(zpad −tplate
2)αTdzpad (2.32)
D =Et3plate
12(1− ν2)(2.33)
Vr = −D
[
∂
∂r(∇2w) + (1− ν)
1
r
∂
∂r
(
1
r
∂2w
∂θ2
)]
−∂MT
∂r(2.34)

16 Mathematical Modelling
Vθ = −D
[
1
r
∂
∂θ(∇2w) + (1− ν)
∂2
∂r2
(
1
r
∂w
∂θ
)]
−1
r
∂MT
∂θ(2.35)
For a pad of constant thickness equation (2.27) reduces to the well known plate equation:
∇2(∇2w) =
p
D−
1
D∇
2MT (2.36)
2.2.4 Bearing equilibrium
The film thickness is calculated as a geometrical relation between the roll and pitch angles and thefilm thickness at the pivot point. Linearizing to only contain first order terms yields equation (2.37).The pressure distribution is integrated over the pad area togive the resulting force (equation 2.38)and the moments in two perpendicular directions around the pivot point (equation 2.39 and 2.40).
h = 1− αr[rpiv − r cos(θpad(θ − θpiv))]− αpr sin(θpad(θ − θpiv)) + w (2.37)
0 = F res =
∫ r2
1
∫ 1
0
prdθdr − F z (2.38)
0 = Mx =
∫ r2
1
∫ 1
0
pr2 sin(θpad(θ − θpiv))dθdr (2.39)
0 = M y =
∫ r2
1
∫ 1
0
pr[r cos(θpad(θ − θpiv))− rpiv]dθdr (2.40)
Solving these equations for a given pressure distribution,pad deflection and load yields the distri-bution of oil film thickness.
2.2.5 Miscellaneous relations
Viscosity is calculated as a function of temperature using an expression by Roelands (Hamrock etal., 2004).
µ = 10[k1·(1+T−273.15
135)k2−4.200] (2.41)
in which the constantsk1 andk2 are determined from the measured viscosity of the oil.
2.3 Governing Equations (2-dimensional formulation)
The equation set stated in chapter 2.2 is reduced to a 2-dimensional form. As shown in figure 2.3the nondimensional oil film thicknessh in these equations includes the recess depth. The energyequation for the fluid film is integrated over the oil film thickness to give a bulk flow formulation.Heat transfer in the pad is considered a 1-dimensional problem in which heat transfer to the sur-roundings is assumed to take place at the back of the pad only.This simplifies the determination ofthe thermal moment causing the bending of the pad.

2.3 Governing Equations (2-dimensional formulation) 17
Figure 2.3: The coordinate system used for the 2-dimensional calculations.
2.3.1 Fluid film
Assuming viscosity to be a function ofr andθ only, the Reynolds equation reduces to the following:
1
12r
∂
∂r
[
rh3
µ
∂p
∂r
]
+1
12θ2padr
2
∂
∂θ
[
h3
µ
∂p
∂θ
]
=1
2θpad
∂h
∂θ+ vz,inj (2.42)
The energy equation integrated over the oil film thicknessh:
1
12r
∂
∂r
[
h3rT
µ
∂p
∂r
]
+1
12θ2padr
2
∂
∂θ
[
h3T
µ
∂p
∂θ
]
−1
2θpad
∂
∂θ
[
hT
]
=
−r21ωµ0
ρcTinh20
[
h3
12µ
(
∂p
∂r
)2
+h
3
12θ2padµr2
(
∂p
∂θ
)2
+r2µ
h
]
−ST
ρcωTinh0
(2.43)
whereST contains the energy added through heat transfer atz = 0 and atz = 1. ST is determinedin section 2.3.2. The boundary conditions on the equations (2.42) and (2.43) are as stated in section2.2.1.
2.3.2 Heat transfer
Heat transfer through the pad is treated in a simplified way byonly modelling heat transfer at theback of the pad and treating conduction in the pad as a 1-dimensional problem. This formulation

18 Mathematical Modelling
is used in combination with the 2-dimensional integrated energy equation for the oil film. The oiltemperature in this formulation is considered uniform in the z-direction and the Nusselt number,Nu = 7.55 (Kays & Crawford, 1993) for a fully developed velocity profile between parallel platesis used to calculate the convection heat transfer coefficients at pad and collar. TheST -term inequation (2.43) thereby becomes:
ST =
[
4h
kNu+
tpad
kpad
+1
Hback
]
−1
(T − Ta)−kNu
4h(T − Tc) (2.44)
Equation (2.20) for the bearing friction loss reduces to:
W fric =r1
h0
∫ r2
1
∫ 1
0
r3µ
h
( 1
2θ0
h2
r2µ
∂pθ
∂θ+ 1
)
dθdr , W inj =r1
h0V injpinj (2.45)
2.3.3 Deflection of bearing pad
Subject to a linear temperature distribution through the pad equation (2.32) reduces to the followingexpression:
MT =t2plateEα
12(1− ν)(Tbab − Tback) (2.46)
in which Tbab designates the temperature on the oil film / pad interface andTback designates thetemperature on the oil bath side of a pad.
2.4 Numerical Description and Solution Method
The equation system is solved on a finite volume grid which maybe uniform in all the transformedvariables. Alternatively it may be designed to follow the edges of a recess in the bearing pad surfaceand with increased control volume density close to the the recess edges. The 2-dimensional thermaldeflection of the bearing pad is always solved on a uniform grid. Variables are interpolated betweenthe grids. Second order discretizations are used for the derivatives except for the convective termsin equation (2.9) which are discretized using upwinding. A detailed description of the resultingequation system is not given here as standard finite volume formulations are used. 2-dimensionalgrids are used for pressure and pad deflection equations. 3-dimensional grids for the temperatureequations. Details of the computational grid are graphically shown in figure 2.4. To accommodateabrupt changes in oil film thickness,h is calculated on the cell faces as well as in the cell centres.Integrals are evaluated using the composite trapezoidal rule. For hydrostatic jacking oil is usuallyinjected at the centre of the injection pocket. In the numerical formulation the volume flow ofinjection oil is specified as a boundary condition. In the numerical implementation of equation(2.6) oil is injected only in the control volume which is closest to the injection pipe. Thusvz,inj =
V inj/(rdrdθ).

2.4 Numerical Description and Solution Method 19
Energy flows into the recess:
vz(i,j+1,nz+ 12)T(i,j+1,nz)∆A
vz(i,j,nz+ 12)T(i,j,nz)∆A
vz(i,j−1,nz+ 12)Tp∆A
vz(i,j−2,nz+ 12)Tp∆A
bc bc bc bc bc
bc bc bc bc bc
T(i,j+1,nz) T(i,j,nz) T(i,j−1,nz) T(i,j−2,nz)k=nz
k=nz-1
z
θ
Reynolds Equation:
bc bc bc
bc bc bc
bc bc
p(i,j)p(i,j+1)
p(i−1,j)p(i−1,j+1)
F 0,s(µ(i,j,1...nz), µ(i−1,j,1...nz), hs(i,j))
G0,s(µ(i,j,1...nz), µ(i−1,j,1...nz), hs(i,j))
G1,s(µ(i,j,1...nz), µ(i−1,j,1...nz), hs(i,j))
F 0,w(µ(i,j,1...nz), µ(i,j−1,1...nz), hw(i,j))
G0,w(µ(i,j,1...nz), µ(i,j−1,1...nz), hw(i,j))
G1,w(µ(i,j,1...nz), µ(i,j−1,1...nz), hw(i,j))
r
θ
Energy Equation (rθ-plane):
bcbcbc
bcbcbc
bcbcbc
T(i,j,k)
T(i+1,j−1,k)
T(i,j−1,k)
T(i+1,j,k)
vθ,e(p(i,j), p(i,j+1), zk)
vr,s(p(i,j), p(i−1,j), zk)
vz(vr,n, vr,s, vθ,e, vθ,v, zk)
Figure 2.4: Selected details of the computational grid. Top: The energy equation:r− andθ−velocities are evaluated at the cell faces.z−velocities are calculated at the cell centres and inter-polated to the lower and upper faces. Middle: The Reynolds equation:F 0, G0 andG1 are evaluatedat the cell faces. Bottom: The energy fluxes from the oil film into the recess control volume.
The problem is solved using an iterative procedure as depicted in the flowchart in figure 2.5.The Newton-Raphson method is used for adjustingαp, αr andh0 until the residuals of the equations(2.38), (2.39) and (2.40) are below some threshold.
The Reynolds equation may predict negative pressures in some control volumes, for instance asa result of a diverging oil film at the trailing edge corners due to thermal crowning. In such casescavitation is to be expected. Numerically the problem is treated by setting negative pressures equalto zero. This is a simple approximation, which does not satisfy the equation of continuity. However,

20 Mathematical Modelling
Figure 2.5: Flow chart for the programme.
cavitation does not usually occur in tilting-pad thrust bearings with pivots offset from the centres ofthe pads, and when it appears in the calculations it is in the study of bearings operating at unusualoperating conditions.
The discretized Reynolds equation and plate equation constitute linear systems of equations andare solved using direct methods. The discretized energy equations for oil and pad and their boundaryconditions constitute a nonlinear system of equations. Oilfilm temperature, viscosity and oil bathtemperature are calculated simultaneously using a point iterative Gauss-Seidel SOR solver.
The first sweep of the equations causes the temperature distribution to be overestimated. Thiscauses the pad deflection to be overestimated. As a result theoil film thickness distribution andviscosity distribution in the next sweep may cause the energy equation to diverge. To overcome thisproblem only a fraction of the calculated deflection is applied to the oil film distribution. A loopincreases the fraction to one. The grid size can be successively doubled to save computation time.The programme includes an option to adjust the pad surface area by the use of a Newton iterationso that the minimum oil film thickness has a prescribed value.A restriction on the minimum oil
2.5 Conclusion 21
film thickness is often used as a design criteria. Similarly,the radial position of the pivot point canbe adjusted by the use of a Newton iteration so that the minimum oil film thickness is located at thecentre of the trailing edge. Calculations have shown that designing for this criteria gives close to theoptimal performance when prescribing a minimum oil film thickness.
2.5 Conclusion
In this chapter two numerical models for tilting-pad thrustbearings have been derived. Both modelsare based on the Reynolds equation for pressure and involve the calculation of temperature in oiland pad and the influence of the bending of the pad due to pressure and thermally induced moments.The oil bath and leading edge temperatures are calculated through control volume expressions forconservation of energy. The collar temperature must be stated as an input parameter. This restrictionon the model is imposed to avoid modelling heat transfer phenomena through the collar, rotor andadjoining components.
A model involving a 3-dimensional description of the temperature field is elaborated. The modelallows for the inclusion of deep recesses with recirculation flows in the pad surfaces and for highpressure oil injection through the surfaces of the bearing pads. The assumptions of the Reynoldsequation are not valid for the flow in a deep recess, which is one or more orders of magnitude deeperthan the surrounding oil film. In addition, depending on the operating conditions, the recess flowmay be turbulent. However, the pressure variations inside the recess are small and assuming inertialeffects to be negligible the errors induced on the calculated pressure distribution are small. Thedescription of the thermal conditions inside the recess is simplified by treating the volume of therecess as one control volume of constant temperature. The generated heat inside the volume of therecess is much smaller than in the thinner oil film and the recirculation flow results in a large amountof mixing justifying this description.
The 3-dimensional formulation does not provide a good description of bearings in which thereare shallow recesses in the bearing pads. In such recesses there is no recirculation and the assump-tion of a uniform mixed temperature is not valid. Allowing the 3-dimensional grid to stretch into therecess is not feasible due to the discontinuity of the oil filmat the recess edges. For such problemsa 2-dimensional formulation is elaborated in which the energy equation is integrated over the thick-ness of the oil film. The 2-dimensional treatment of the temperature field does not deal well withregions of back flow and the study of recesses are therefore limited to those sufficiently shallow notto generate recirculation. The principal disadvantage of a2-dimensional over a 3-dimensional for-mulation of the flow in standard bearing pads without recesses, is in the less exact calculation of thetemperature gradients at the pad and collar surfaces. The calculation of the heat transfers throughthe solid components is therefore less accurate and more importantly, especially in large bearings,the calculation of the thermal crowning of the pads is less accurate due to the lack of knowledge ofthe temperatures on the pad / oil interface.
In chapter 3 and chapter 4 the models are validated using measurements.

22 Mathematical Modelling

Chapter 3
Validation of Models
To validate the numerical models theoretical results are compared to different sets of experimentaldata. Glavatskikh (2000, 2001) has published experimentaldata for a 228 mm outer diameter six-pad bearing. The data include extensive measurements of temperatures below the babbitt surfaceand oil film thickness measurements at the leading and trailing edges of the pad. Glavatskikhsmeasurements are used to validate the models for a bearing without recesses in the bearing surface.Calculations using isothermal, 2-dimensional and 3-dimensional adiabatic models and models inwhich heat transfer and pad bending is included are performed. The variations in the results betweenthe different models are discussed.
Furthermore, a comparison between theoretical results andmeasurements conducted on a 2.2 mouter diameter bearing in operation in the Bieudron hydro power plant in Switzerland is performed.The bearing has oil injection pockets at the pivot points covering 3.6 % of the total bearing area∗.
In chapter 4 experiments are presented to further validate the models. Comparisons betweentheoretical and experimental pressure profiles are performed with and without oil injection pocketsin the bearing surface and with and without constant volume flow high-pressure oil injection. Fur-thermore, a validation of the theoretically predicted pressure bending and thermal crowning of thebearing pads is performed.
3.1 Comparison with Published Experimental Data
Simulation results are compared to experimental data presented by (Glavatskikh, 2000, 2001) con-cerning a 228 mm outer diameter six-pad bearing. The pads aresupported by spherical pivots andcoated with a babbitt layer less than 1 mm thick. Data for the considered bearing, operating condi-tions and measurements are given in table 3.1 and figure 3.1. The measurements of temperature andoil film thickness are performed in separate bearing pads.
Calculations of the bearing are conducted using a grid of 30×30 control volumes in the radialand circumferential directions - and in the case of 3-dimensional models 10 control volumes inthe z-direction of the oil film and 10 in thezpad-direction of the bearing pad. A uniform collartemperature of 61°C is used. The results are stated in table 3.2. Illustrations of the numerical resultsare given in figure 3.2. In table 3.2 a measured value of power loss is stated. It represents the total
∗The measurements are supplied by Alstom Power (Switzerland) Ltd.
23

24 Validation of Models
number of pads 6inner radius 57.15 mmouter radius 114.3 mmpivot radius 85.725 mmpad angle 50.0 °pivot angle 30.0 °pad thickness 28.58 mmoil type VG46viscosity at 40°C 39.0 mPasviscosity at 100°C 5.4 mPasdensity 855.0 kg/m3
thermal capacity 2090 J/kg/Kthermal conduc. 0.13 W/m/Kaxial load 52265 Nshaft speed 1500 rpmInlet temperature 40°COil flow 15 L/min
Table 3.1: Data for the bearing.
(a) film thickness measurements (b) temperature measurements
Figure 3.1: Locations of measurements are shown. Tempera-tures are measured in the pad 3 mm below the babbitt layer.
power loss in the bearing and contains losses from the friction between the pads and the collar andlosses stemming from the churning of the oil in the oil bath. The calculated power loss does notinclude churning losses. It can therefore not be directly compared to the measured value.
The 3-dimensional TEHD model predicts a power loss 15 % lowerthan the measured value.The oil film thickness at the trailing edge is 10 % too high. At the leading edge it is 22 % too small.Calculated temperatures at the leading edge are close the measured ones. At the trailing edge theyare 2 to 4 K lower than the measured ones. The temperature risefrom the leading to the trailingedge is 15 % smaller than the one measured. The temperature rise from bearing inlet to the trailingedge of the pad is 23.3 K which is 9 % less than the measured value.
Considering the fairly simple treatment of the heat transfer phenomena in the oil bath the cal-culated temperatures are quite accurate. However, the small temperature rise from the leading tothe trailing edge of the pad suggests than one or more of the heat transfer coefficients used in thecalculations are too high.
The discrepancies in the oil film thickness show that the calculated pitch angle,αp is too small.This may partly be caused by a calculated pad deflection whichis too small. The pad is consideredto be a flat plate of uniform thickness while in reality it has cutouts (Glavatskikh, 2000) at theleading and trailing edges giving larger deflections. Also the pad is considered to be initially flatwhile it may be slightly crowned due to machining inaccuracies (Glavatskikh et al., 2002). Thepressure at the leading edge is set to zero. The velocity boundary layer at the collar surface ishowever much larger than the oil film thickness at the leadingedge. Therefore, the oil is stagnatedas it approaches the pad leading to an inlet pressure build-up before the leading edge. Assuming

3.1 Comparison with Published Experimental Data 25
experi- HD- 2D- 2D- 2D- 3D- 3D- 3D-mental ISO1 THD1 THD TEHD THD1 THD TEHDvalue adiab. adiab.
Tc [°C] 61 61.0 61.0 61.0 61.0Tmax [°C] 76.5 70.9 69.6 78.9 70.0 68.9Tmax,babbitt[°C] 69.9 68.5 69.1 67.8T1 [°C] 52 50.8 49.3 55.8 52.4T2 [°C] 53 49.5 48.1 56.9 52.4T3 [°C] 51 49.7 48.3 55.6 50.5T4 [°C] 62 62.2 61.0 62.1 61.0T5 [°C] 68 62.9 61.7 65.0 63.9T6 [°C] 67 64.9 63.6 66.5 65.1h1 [µm] 58 43.6 48.8 47.2 55.6 47.2 30.2 45.5h2 [µm] 20 27.2 25.0 24.7 25.5 24.5 19.8 22.1hmax [µm] 53.0 60.2 58.4 71.8 58.3 36.0 58.9hmin [µm] 23.8 19.6 19.9 21.4 19.5 17.9 19.7Power loss [kW] 3.2 2.71 2.66 3.19 2.73
Table 3.2: Comparison of experimental and numerical results. Tle = 12(Tc+Tin) in the models
marked with1. In the other modelsTle is determined by energy conservation.Tc =61°C is thecondition necessary to close the numerical problem.
20
25
30
35
40
45
50
55
Lines of constantfilm thickness [µm]
4.5 4
3.5 3
2.5 2
1.5 1
0.5 0.5
Lines of constantpressure [MPa]
454647484950
515253545556
57585960
616263646566
67
Lines of constanttemperature [oC]
Figure 3.2: Simulation results showing lines of constant oil film thickness (left), lines of constantpressure (middle) and lines of constant pad surface temperature(right).
an inlet pressure larger than zero results in a larger pitch angle reducing the error at the leadingedge. A parameter which strongly influences the leading edgefilm thickness is the leading edgetemperature profile. Choosing a uniform temperature inz raises the value ofh1 by 8 %. This is dueto a higher temperature on the pads surface at the leading edge. This generates a higher deflection

26 Validation of Models
3D-TEHD 2D-TEHD15 × 15× 30× 30× 60× 60× 120 × 120 15 × 15 30× 30 60× 60 120 × 120
(5 + 5) (10 + 10) (20 + 20) ×(40 + 40)
hmin [µm] 20.020 19.714 19.665 19.650 21.681 21.420 21.355 21.324hmax [µm] 60.881 58.870 59.082 59.149 70.689 71.807 72.185 72.235Tmax [°C] 68.835 68.897 68.950 68.985 69.505 69.578 69.622 69.662Tmax,bab [°C] 67.508 67.754 67.836 67.868 68.829 68.483 68.296 68.208Qgen [kW] 2.6975 2.7259 2.7262 2.7262 2.6499 2.6558 2.6565 2.6570Qout [kW] 2.7598 2.7475 2.7380 2.7335 - - - -
Table 3.3: Grid convergence study: Energy flows are stated per 6 pads, i.e. a full bearing.Qout represents the sum of all heat flows out of the computational domain.
of the pad due to higher thermal gradients. Simulations showthat the combined effects of inletpressure build-up and increased deflection due to the effects mentioned above cannot fully explainthe errors in oil film thickness. Some effects which are not included in the model may influencethe results. There is the possibility that the measuring probes themselves affect the measurements.The eddy-current sensors are embedded in the pad. This involves removal of the babbitt surfaceover and around the sensors. This area is covered with epoxy.A total of four sensors are locatedin the pad. The epoxy surfaces cover approx. 10 % of the bearing surface. Two of the sensors arelocated close to the trailing edge. If the areas in which theyare located have a reduced load carryingcapacity this would in effect correspond to a pivot point located closer to the trailing edge witha higher tilting-angle as a result. Discrepancies similar to those reported here between measuredand theoretical tilting-angles are reported by Glavatskikh et al. (2002) in a comparison between a3-dimensional TEHD model and measurements conducted usingthe same test bearing.
In comparison to the results of the 3-dimensional TEHD modelthe isothermal model overesti-mates the minimum oil film thickness by 23 %. Considering the simplicity of the model this result isquite good. The 2-dimensional models only slightly over predict the maximum babbitt temperatureand minimum oil film thickness compared to the the 3-dimensional models. They estimate pitchangles which are much higher than those calculated by the 3-dimensional models. The pitch anglesare close to the one which is experimentally determined. The2-dimensional and 3-dimensionaladiabatic models predict oil film and temperature distributions which only differ slightly. The dif-ference between the models as heat transfer is included is therefore a result of the different accuracyin the description of heat transfer phenomena. And the seemingly more accurate oil film thicknesscalculations in the 2-dimensional case must therefore be considered to be an accidental effect of lessaccurate boundary conditions on the energy equation in thez-direction.
Both 2- and 3-dimensional modelling provide good results for the minimum film thicknesshmin
although the predicted pitch angles are very different. Thereason is thathmin is insensitive tochanges in boundary conditions which strongly influence thepitch angle. A higher pitch angledemands a higher mean oil film thickness because of equilibrium with the applied load. Raisingthe pitch angle while keeping the minimum oil film thickness constant provides a higher mean filmthickness. This effect in combination with a higher side leakage causeshmin to be insensitive to

3.2 Comparison to Measured Data for a Large Sized Bearing 27
raisingαp for the bearing in question.To determine the minimum oil film thickness and the maximum babbitt temperature a 2-dimensional
model seems to be sufficient for the considered bearing. A 2-dimensional integrated description ismeaningful only if streamlines are nearly parallel. If the pitch angle is large reverse flow may oc-cur at the leading edge. In cases where reverse flow is significant a 2-dimensional model does notaccurately determine the temperature distribution.
Grid convergence studies showing the convergence of key variables for both the 3-dimensionaland 2-dimensional TEHD models are shown in table 3.3. For both models the variables are seento converge as the grid sizes are increased. In the 3-dimensional study the values of generatedfriction work at the collar surface and the heat transportedout of the computational domain convergetowards each other. The 30×30 grid which is used in the calculations is shown to be sufficient forthe study of the problem.
3.2 Comparison to Measured Data for a Large Sized Bearing
The 3-dimensional TEHD model is applied to a thrust bearing of the Bieudron hydro power plant inSwitzerland. Theoretical values of oil film thickness are compared to measurements. A comparisonis approximate as details of the thermal conditions of the bearing are scarce rendering it necessaryto estimate the collar temperature. An earlier theoreticaltreatment of this bearing was performedby Santos & Fuerst (2003). Only the steady-state behaviour of the bearing at nominal operatingconditions is analysed. I. e. the high-pressure oil injection is turned off.
Figure 3.3(left) shows a picture of the instrumented bearing pad. Measurements of the oil filmthickness are performed at the leading and trailing edges inthe positions marked withh1, h2, h3 and
bc
bc
bc
bc
h1
h4
h3
h2
Figure 3.3: Left: The instrumented pad. Right: The dimensions of the ring support (in mm). Thedotted line indicates the smoothing function used for the plate thickness. A 3 mm babbitt layer coatsthe pad.

28 Validation of Models
h4. The bearing operates using a VG32 mineral oil under fully flooded conditions in combinationwith a guide bearing. A conical pocket with radius,rp and maximum depth,hp,max centred at thepivot point allows for hydrostatic lift off. There is a 10 mm,3° taper at the leading edge. Datafor the bearing and oil are:nopads = 6, θ0 = 45.31°, θpiv = 27.24°, r1 = 0.527 m, r2 = 1.098m, rpiv = 0.8125 m, rp = 0.065 m, hp,max = 2.27 mm, µ40oC = 27.1 mPas,µ80oC = 6.8 mPas,ρ = 848 kg/m3, c = 2090 J/kg/K,k = 0.13 W/m/K, Fz = 4.94 MN, ω = 44.9 rad/s,Ta ≈ 40°C.The collar temperature is unknown. A value ofTc = 56°C is used. At this temperature, simulationsshow that approximately 7 % of the generated heat flows out through the collar. The sensitivity ofthe solution to changes in the value ofTc is examined later. The bearing pad is firmly mounted on aring support with a 2 mm gap between pad and support. The geometric data for the pad and supportare given in figure 3.3(right). Both pad and support are of steel. As described in chapter 2.2.2 heattransfer in the main pad is considered 3-dimensional while a1-dimensional description is used forthe circular support. As the oil of the gap has a much lower heat transfer coefficient than steel, littleheat is transferred across the gap justifying the simplifiedtreatment of heat transfer in the support.Equation (3.1) gives the boundary condition on equation (2.14) inside the area of the support. Thesolution of equation (2.27) requires continuous first derivatives ofD, and therefore a smoothingfunction is introduced to give the plate thickness shown in figure 3.3(right).
1
Hback,eff=
[
1
Hback
+0.15 mksupport
+0.002 m
koil
]
(3.1)
The Reynolds number in the pocketRe = ρωrhp/µ is approx. 4000 at the maximum depth.This indicates turbulence in the deep parts of the pocket enhancing the fluid mixing. Shinkle &Hornung (1965) showed that the transition to turbulence occurs atRe ≈1000.
A grid with a final size ofnr×nθ× (nz +nzpad) = 30× 30× (10+10) control volumes is used
in the simulations.In table 3.4 a grid convergence study is performed. For threedifferent grid sizes, the study
presents key operating parameters for the bearing. The parameters are: friction lossQgen, total heatflow out of the computational domainQout, the maximum oil temperatureTmax and the oil filmthicknessesh1 andh3. Furthermore, pocket specific variables are studied. Theseare: mass flow intoand out of the pocket
∑
mi and∑
me, the generated heat in the pocketQgen,p, the heat conductedfrom the pad to the pocketQcond,p and the pocket temperatureTp.
The study is performed both with and without a leading edge taper. The results without a leadingedge taper are presented to study the convergence of the heatflows. All other calculations presentedin this paper are conducted with a leading edge taper.
The generated friction loss and the total heat flow out of the computational domain convergeslowly towards each other. This is due to the leading edge taper, which causes the grid to be verydistorted at the leading edge and causes back flow. Consequently, the inflow to the computationaldomain occurs in only a few control volumes close to the collar. These inaccuracies on the heatflows do not however influence the other bearing parameters significantly and a 30×30×(10+10)grid is considered adequate for the calculations. The heat flows converge more rapidly towardsthe values of generated work when no leading edge taper is present in the bearing. There is littledifference betweenQgen andQout with a grid of 60×60×(20+20) control volumes indicating thatthe energy equation is implemented correctly. The generated (Qgen,p) and conducted (Qcond,p) heat

3.2 Comparison to Measured Data for a Large Sized Bearing 29
Uniform grid - with 10 mm taper Uniform grid - without taper15× 15× 30× 30× 60× 60× 15× 15× 30× 30× 60× 60×(5 + 5) (10 + 10) (20 + 20) (5 + 5) (10 + 10) (20 + 20)
General parametersQgen [kW] 49.37 49.24 49.38 48.78 49.86 50.15Qout [kW] 63.79 59.54 54.26 49.95 50.10 50.20Tmax [°C] 84.97 83.58 83.00 84.64 82.92 82.81h1 [µm] 421.7 425.2 427.4 417.5 414.0 418.0h3 [µm] 77.65 76.30 76.80 78.18 76.91 77.01Pocket parameters∑
mi [kg/s] 2.569·10−4 2.547·10−4 2.774·10−4 2.650·10−4 2.602·10−4 2.797·10−4
∑
me [kg/s] 2.447·10−4 2.528·10−4 2.770·10−4 2.526·10−4 2.583·10−4 2.793·10−4
Qgen,p [W] 254.8 280.4 305.4 251.2 282.6 305.6Qcond,p [W] -75.98 -43.46 -57.90 -83.17 -49.42 -64.95Tp [°C] 63.12 62.52 61.77 62.42 61.31 61.15
Table 3.4: Grid convergence study: Energy flows are stated per pad.Qout represents the sum of allheat flows out of the computational domain.mi andme refer to the mass flow terms of equation2.10.
Tc h1 h2 h3 h4 Tmax Tmax,babbitt Qgen
[°C] [µm] [µm] [µm] [µm] [°C] [°C] [kW]measurement:n/a 430 173 66 202 n/a n/a n/asimulation with pocket included:56 425.2 111.6 76.3 122.1 83.6 81.5 295.546 428.9 116.4 88.2 128.2 79.6 78.1 327.566 421.1 108.4 66.4 117.9 88.6 87.7 272.0
simulation without pocket included:56 423.5 114.4 77.7 123.6 83.7 82.7 298.8
Table 3.5: Comparison of experimental and numerical results. Tc is a boundary condition.
in and into the pocket are seen to converge slowly. This is dueto the relatively few control volumescovering the pocket.Qgen,p andQcond,p are however small compared to the generated heat for thewhole padQgen. Therefore, the errors are inconsequential. The pocket temperature converges withincreasing grid size. The mass flows into and out of the pocketconverge towards each other. Thisindicates a correct implementation of the pocket equations.
In table 3.5 the simulation results are compared to measurements. For comparison, a pad withoutan oil injection pocket is also calculated. Additional simulations at varying rotor temperatures areshown as well. A comparison to the measurements shows that the maximum film thicknessh1 isestimated well by the model.h3 is slightly overestimated andh2 andh4 are heavily underestimated.

30 Validation of Models
The discrepancies on the values ofh2 andh4 may be due to thermal bending of the collar, which isnot included in the model.
The theoretical results for pads with and without a pocket differ little. The effect of the pocketon the oil film thickness is small as it covers only 3.6 % of the bearing surface area. When intro-ducing a pocket in the surface the position of the centre of pressure moves towards the centre of thepad causing a higher tilting angle to compensate. The recirculation flow in the pocket causes thetemperature downstream of the pocket to be reduced. The maximum babbitt temperature is reducedonly slightly by the mixing as it is positioned at a radius outside of the downstream flow of thepocket.
The calculations at collar temperatures ofTc = 46°C andTc = 66°C are performed to study thesensitivity of the solution to this unknown parameter. Changes inTc strongly influence the minimumoil film thickness while the influence on the maximum film thickness is small.
In figure 3.4 the theoretical distributions of oil film thickness, pressure and pad surface temper-ature are shown. The results are compared to those for a bearing with a plain bearing surface.
In the following a theoretical study of the influence of the pocket dimensions is performed. Infigure 3.5 the influence of changing the pocket depth and radius is analysed. Figures 3.5(a)→(d)show pressure profiles, minimum and maximum oil film thickness and friction loss for differentpocket radii. The curves are intended to allow designers of bearings with injection pockets to assesthe influence of pockets on these key parameters.
In figure 3.5(e)→(h) the influence of the pocket depth on the same parameters isanalysed.For the given bearing configuration an increase in pocket depth results in improved performance(reduced friction loss and increased minimum oil film thickness) up tohp,max ≈ 0.15 mm≈ 1.1·h0.At this value ofhp,max the pressure at the trailing edge of the pocket reaches a maximum - a pressurebuild-up similar to that of a Rayleigh-step bearing and a flowsituation where no recirculation flowin the pocket is predicted by the formulation used. At higherpocket depths recirculation occurs,the pocket does not contribute to the pressure build-up and the loss of bearing area results in a lossof oil film thickness. A similar behaviour is seen when treating a cylindrical pocket of constantdepth having the best performance athp ≈ 0.08 mm ≈ 0.6 · h0. For decreasing pocket depth, thesimulation results converge towards values different fromthe values obtained when no pocket ispresent. This is partly due to the different thermal conditions on the pad, as the pad surface in thepocket area is set equal to the pocket temperature. However,mainly it is due to numerical errors,which decrease with decreasing control volume sizes.
The results indicate that machining shallow recesses in thebearing surface could enhance theperformance of tilting-pad thrust bearings. Simulations show this to be true also for a bearing inwhich the pivot position has been optimized for minimal power consumption.
3.3 Conclusion
Comparisons between measurements made in two different bearings and the models presented inchapter 2 have been performed.
Calculations have been carried out to compare with experimental data available in the literature.These are data for steady-state operation of a bearing of 228mm outer diameter. Simulations showthat an isothermal model predicts the minimum oil film thickness within 30 % of the actual value.

3.3 Conclusion 31
400375350
325300
275
250225
200
175
150
125
100
Lines of constant oil filmthickness [µm]h
min=77.8µm
hmax
=431.0µm
400375350
325
300275
250225
200175
150
12510
0
Lines of constant oil filmthickness [µm]h
min=78.9µm
hmax
=429.1µm
5.5
6
54.5
4 3.53 2.52
1.51
0.5
Lines of constant pressure [MPa]P
max=6.10MPa
65.5
5 4.54 3.5
3 2.52 1.51
0.5
Lines of constant pressure [MPa]P
max=6.41MPa
82 80
78 76
74 7270 68
66 6462
6058
5654
52
50
4850
Lines of constant pad surfacetemperature [oC]T
max,surf=82.4oC
82
80 78
76 74
72 70
68 66
64 62
60 58
5654
5250
4850
Lines of constant pad surfacetemperature [oC]T
max,surf=82.7oC
Figure 3.4: Predicted contours of film thickness (top graph), pressure (middle graph) and pad surfacetemperature (bottom graph) for the studied thrust bearing pads. Left graphs concern the bearingwith injection pockets. Right graphs show results for the plain bearing pad. Operating conditions:ω = 44.9 rad/s,Fz = 4.94 MN.
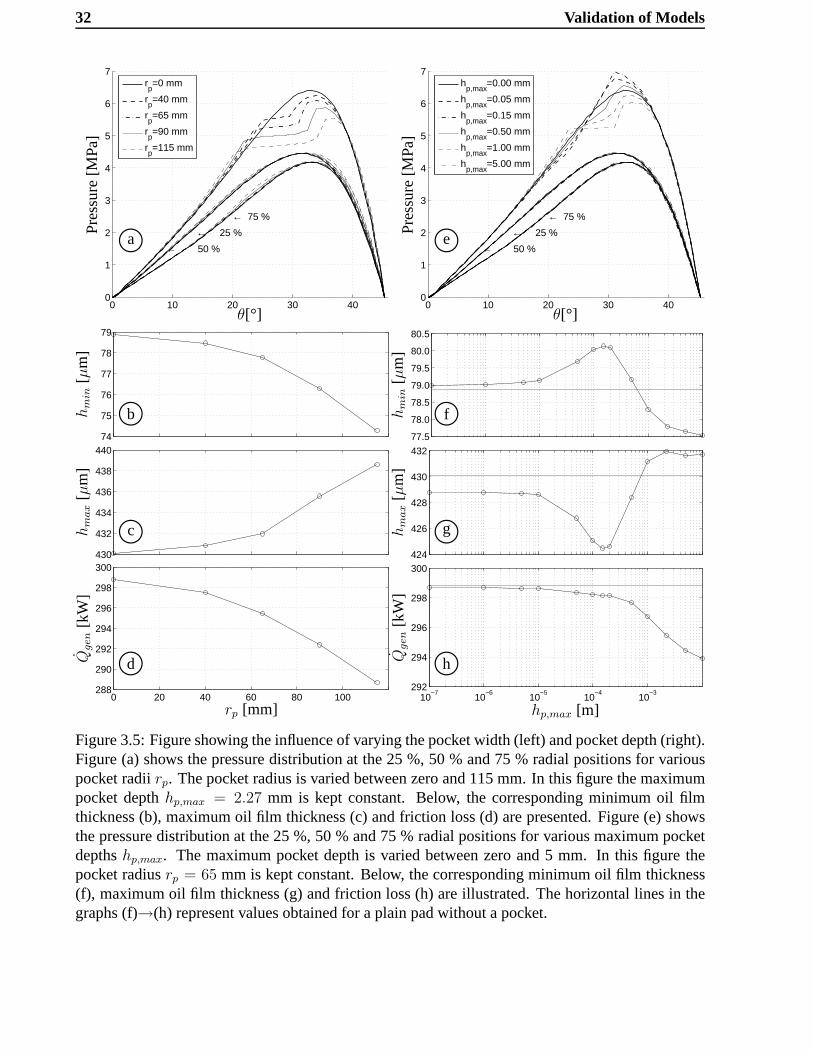
32 Validation of Models
0 10 20 30 400
1
2
3
4
5
6
7
← 75 %
← 25 %
← 50 %
rp=0 mm
rp=40 mm
rp=65 mm
rp=90 mm
rp=115 mm
θ[°]
Pre
ssu
re[M
Pa]
0 10 20 30 400
1
2
3
4
5
6
7
← 75 %
← 25 %
← 50 %
hp,max
=0.00 mm
hp,max
=0.05 mm
hp,max
=0.15 mm
hp,max
=0.50 mm
hp,max
=1.00 mm
hp,max
=5.00 mm
θ[°]
Pre
ssu
re[M
Pa]
74
75
76
77
78
79
hm
in[µ
m]
77.5
78.0
78.5
79.0
79.5
80.0
80.5
hm
in[µ
m]
430
432
434
436
438
440
hm
ax
[µm
]
424
426
428
430
432
hm
ax
[µm
]
0 20 40 60 80 100288
290
292
294
296
298
300
Qgen
[kW
]
rp [mm]10
−710
−610
−510
−410
−3292
294
296
298
300
hp,max [m]
Qgen
[kW
]bc bc
bc bc
bc bc
bc bca
b
c
d
e
f
g
h
Figure 3.5: Figure showing the influence of varying the pocket width (left) and pocket depth (right).Figure (a) shows the pressure distribution at the 25 %, 50 % and 75 % radial positions for variouspocket radiirp. The pocket radius is varied between zero and 115 mm. In this figure the maximumpocket depthhp,max = 2.27 mm is kept constant. Below, the corresponding minimum oil filmthickness (b), maximum oil film thickness (c) and friction loss (d) are presented. Figure (e) showsthe pressure distribution at the 25 %, 50 % and 75 % radial positions for various maximum pocketdepthshp,max. The maximum pocket depth is varied between zero and 5 mm. In this figure thepocket radiusrp = 65 mm is kept constant. Below, the corresponding minimum oil film thickness(f), maximum oil film thickness (g) and friction loss (h) are illustrated. The horizontal lines in thegraphs (f)→(h) represent values obtained for a plain pad without a pocket.

3.3 Conclusion 33
2-dimensional and 3-dimensional models both determine theminimum oil film thickness within15 % and the temperature rise from inlet to trailing edge within 7 % of the measured values. Thetemperature distribution is most accurately determined bythe 3-dimensional TEHD model. The 3-dimensional models do not improve the accuracy of the theoretical predictions of oil film thicknessfor this bearing.
Furthermore, the 3-dimensional TEHD model has been appliedto the analysis of an existingbearing of large dimensions. The bearing has oil injection pockets at the pivot points. The calcula-tions have been performed at nominal operating conditions with the high pressure injection turnedoff. The pocket has a surface area of 3.6 % of the total pad areaand results in a 1.2 % decreaseof the minimum oil film and a 2.2 % increase in the pitch angle compared to a plain bearing pad.Mixing of the oil in the pocket results in cooling of the pad surface downstream of the pocket. Themaximum babbitt temperature is only slightly affected by this cooling effect as the hot spot is notlocated directly downstream of the pocket.
The sensitivity of the results to variations of the diameterof the conical pocket has been studiedand the influence on key operating parameters are stated. Similarly, the effect of varying the pocketdepth has been analysed. A shallow pocket is shown to improvethe performance of the bearing. Itcontributes positively to the pressure build-up as it has characteristics similar to those of parallel-step bearings. A deep pocket has a negative effect on the performance due to the loss of bearingarea.
Further validation of the models with regard to the influenceof oil injection pockets and high-pressure oil injection is presented in chapter 4, in which a comparison of theoretically and experi-mentally determined pressure profiles is performed.
Further validation of the numerical behaviour of the modelswhen using variable grid sizesare performed through grid convergency studies presented in chapters 5, 6 and 7 for different padgeometries.

34 Validation of Models

Chapter 4
Experimental Results
Few papers documenting the influence of injection pockets onthe behaviour of tilting-pad bearingshave been published. Hemmi & Inoue (1999) presented data documenting the tilting angle as afunction of speed for a tilting-pad thrust bearing subject to hybrid lubrication. The pad has twocylindrical injection pockets at the circumferential centre. Yuan et al. (2001) presented a comparisonof experimental data and numerical predictions for a large spring-supported thrust bearing withcentrally placed ring-shaped injection pockets. The numerical predictions were based on a modeldeveloped by Ettles (1991). (Yuan et al., 2001; Ettles, 1991) do not, however, present details of thetheoretical implementation of the injection pockets.
This chapter presents a comparison between theoretical results and experimental data obtainedin a test-rig for two different bearing pads of approximately 100 cm2 surface area. One pad hasa leading edge taper and an injection pocket. The other is a plain pad without taper or injectionpocket. The oil film thickness is measured at the four cornersof the pads and pressure is measuredin the collar at four different radii. Measurements are carried out at various loads and velocities,with and without constant volume flow, high-pressure oil injection. The test-rig is capable of test-ing individual pads, not full bearings. Therefore, the thermal boundary conditions such as rotortemperature and leading edge temperature are different from those of full bearings. The test-rig islocated at Alstom Power (Switzerland) Ltd., Birr, Switzerland. Earlier Mahieux (2005) published acomparison of data for babbitt, PTFE and PFA coated pads obtained in the test-rig.
Results are given in the form of graphs showing the oil film thickness at the four corner pointsas functions of load and velocity. Curves of the distribution of pressure are presented for selectedmeasurements showing the change in the pressure profiles as load and velocity is changed. Allpresented experimental data are compared to the corresponding theoretical values calculated usingthe 3-dimensional numerical model. Some boundary conditions to the model are adjusted to complywith experimentally determined values. This approach is chosen in order to isolate the comparisonbetween the experiments and the model results to those phenomena which are of interest. Forinstance, the inlet pressure to a pad is set as a boundary condition in order to compare the pressureprofiles along the pad circumference as the primary objective of the comparison is to study the effectof the oil injection pocket.
35

36 Experimental Results
Figure 4.1: Operational principle. The collar diameter is 0.72 m.
4.1 Test Facility
The operational principle of the test rig is shown in figure 4.1. Two pivot pads are hydraulicallypressed against opposite sides of a collar. The load is supplied through spherical supports allowingthe pads to tilt freely. Movement of the pads in the plane parallel to the babbitt surface is restricted.The oil used is a VG46 mineral oil:µ40oC = 40.1 mPas,µ100oC = 6.0 mPas,ρ20oC = 872 kg/m3,c = 2090 J/kg/K, k = 0.13 W/m/K. A piston compressor provides a constant volume flow oilinjection, which can be varied from 0 to 400 cm3/min per pad. Measurements are conducted on thelower pad.
4.2 Measuring System
Oil film thicknesses are measured by eddy current sensors mounted at the four corners of the pad,h1, h2, h3 andh4 as illustrated in figure 4.2. Four transducers placed in the collar at four differentradii,p1, p2, p3 andp4 measure the hydrodynamic pressure distribution. Thermocouples are build in3 mm below the collar surface at the radii: 283.0 mm, 298.5 mm,314.0 mm, 329.5 mm and 345.0mm. The pad dimensions and the positions and sizes of the film thickness and pressure probes areshown in figure 4.2. Two different babbitt (85% Pb, 14% Sb) coated steel (DIN CK45, ASTM 1045)pads are measured. One pad has a leading edge taper and an oil injection pocket at the pivot point.The babbitt coating is 4 mm thick and all edges have a 1 mm chamfer. The other pad is measuredfor reference. It has no taper, no injection pocket and the edges are not chamfered. The babbittcoating has a thickness of 2.5 mm. The spherical pivot has a radius of curvature of 300 mm. Figure4.3 shows pictures with details of the test-rig, sensors andbearing pads. The load is determined bymeasurement of the pressure in the hydraulic load system. 2048 samples of pressure and oil filmthickness are made during one turn of the rotor, approximately 114 pressure samples during onepass of the pad. The eddy-current sensors are mounted in holders, which are fixed to the pad byeach two bolts as seen in figure 4.3(middle-right). The leading edge holder is of 5 mm mouldedplastic. The trailing edge holder is of 2.5 mm aluminium. Thepad holder is movable in the radial

4.2 Measuring System 37
Figure 4.2: Left: The position of sensors and the dimensionsof the pad with an injection pocket areshown. all edges have a 1 mm chamfer. Top right: Positions of the pressure sensors in the collar.They are positioned approximately 0.1 mm below the surface.Bottom Right: Cross section of theinjection pocket. A brass insert provides the injection piping.
direction in order to ease the changing of bearing pads. The radial positioning is done by eye. Thedistance of the outer edge of the pad from the shaft centre cantherefore vary±0.5 mm from thenominal value of 360 mm.
Prior to the measurements the eddy-current sensors are calibrated outside the test-rig using a mi-crometer screw and subsequently in the test-rig by measuring the output voltages with and withouta disk of known thickness between the pad and the collar. Based on these measurements the maxi-mum uncertainty of the distance measurements is estimated to be±2 %. The pressure sensors werecalibrated when installed, not prior to this set of experiments. A discrepancy between the measuredvalues of the applied load and the pressure distribution is recorded as can be seen in the results sec-tion of the paper. The measured value of applied load is4−10 % higher than the integrated value ofmeasured pressure over the pad. This discrepancy leads to a2− 5 % uncertainty on the calculatedvalues of oil film thickness compared to the experimental values. An example of oil film measure-ments at the trailing edge of the pad is seen in figure 4.4(top). The 2048 measurements cover thecircumference of the collar. The change in oil film thicknessis a measure for the unevenness of thecollar. The measurements with the four sensors vary approx.40−65 µm with standard deviations ofσ ≈ [12, 17, 11, 16] µm for the sensors[h1, h2, h3, h4]. The distance measurements represent the

38 Experimental Results
Figure 4.3: Top left: The test-rig. Top middle: The user interface. Top right: Pad shown in adismounted pad holder. Middle left: A view into the test-rigwith a dismounted pad. Middle right:A view of the trailing edge. The distance sensors and the oil injection pipe is seen. Bottom: Picturesof the tested pads taken after the measurements. The plain pad has a ground down surface finish.

4.2 Measuring System 39
500 1000 1500 20000
20
40
60
80 ← pressure measurements
← calibration point
Sampling pointh[
µm
]
h3
h4
020406080100120140
330340350360370
← offset measurement used for calibration
↑↓
2 µm
↑↓
value of the offset measurement used
mean value of offset
Offset measuring point
Offs
etva
lue[µ
m] h4
Figure 4.4: Top: An example of trailing edge film thickness measurements (sensorsh3 andh4).There are 2048 sampling points for one turn of the rotor. The position for the pressure measurementsand the position for calibration of the distance sensors arestated. Bottom: Distance from collar tosensorh4 at 143 evenly spaced points on the collar circumference. Thepad is pressed against thecollar. Offset measurement 123 is used for calibration of the distance sensors.
distances from the sensors to the collar surface subtractedcalibration values measured with the padpressed against the collar. Figure 4.4(bottom) shows the distance from an eddy-current sensor to thecollar at 143 evenly spaced positions around the collar circumference. The pad is pressed againstthe collar. The graph shows variations similar to those of the 2048 film thickness measurements.To accurately determine average values of oil film thicknessthe offset values used for calibrationof the sensors are always determined in the same position of the collar (measuring point no. 123).The measured offset in this position does not represent the mean offset distance from the collar. Thecalibration-offset value is therefore corrected to represent the mean distance. E.g., 2µm is added tothe calibration-offset value for sensor 4 as described in figure 4.4(bottom). With these corrections,the mean value of the 2048 sampling points represents the average film thickness. The calibrationis done at the operating temperature as the axial position ofthe sensors move up to 0.5µm/K whenchanging the oil bath temperature due to thermal expansion of the sensor holders and bolts.
Data are presented for pads operating at 40°C oil bath temperature, loads of 15 and 40 kNand velocities varying from the minimum possible for each load to a maximum of 1000 rpm. Thepad with an injection pocket is measured without and with 400cm3/min constant volume flowoil injection. At each operating condition, the measurements are carried out when the thermalconditions have stabilized. Thermal equilibrium is achieved within a couple of minutes.

40 Experimental Results
U
Ffriction
Ffriction
Fz
Fz
Mres
approx. 0.1 mmxoffset
dHertz
t pad
t pad
/2
Figure 4.5: Illustration of the forces acting on the pad. Thepressure distribution in the oil filmand the Hertzian pressure distribution between the spherical support and the pad are indicated. Thecentres of the pressure distributions are shown asFz. The centres are offset byxoffset. A resultingmomentMres in the pivot point is therefore necessary.
4.3 Simulations
Simulations are carried out for comparison. The pad with a pocket is simulated as a pad ofθ0 =19.64°, θpiv = 11.82°, r1 = 269 mm, r2 = 359 mm and a 9 mm taper at the leading edge. Thus,the dimensions of the test pad are reduced by the 1 mm chamfer on all edges. The pad is modelledas a solid steel plate of 40 mm thickness. The influence of the babbitt layer is neglected. All otherdimensions are as stated in figure 4.2. The boundary conditions are as follows: The collar tem-perature is set equal to the mean value of the five experimental collar temperature measurements.The scatter between the five measurements is generally less than 1 K. The leading edge temperatureprofile is set uniformly equal to the collar temperature. As both the laminar velocity- and temper-ature boundary layers grow to thicknesses much larger than the leading edge oil film thickness itis reasonable to assume the temperature variations in the axial direction to be small justifying thechoice of boundary condition. A grid of 30×30×(10+10) control volumes is used.
The force and the moment acting at the centre of the sphericalpivot can be calculated from theexperimentally determined pressure curves. The curves areextrapolated to a grid covering the padand numerically integrated. As will be shown in the results section of this paper the moment is notzero as it is assumed in the theoretical description of the problem. Figure 4.5 shows a schematicillustration of the forces acting on the pad. The measured pressure profiles indicate centres of pres-sure located to the trailing edge side of the pivot point. Assuming the Hertzian pressure distributionon the interface between the spherical pivot and the pad to besymmetrical around the centre of thepivot there must be a resulting momentMres acting at the pivot point. As an example, the forces andmoments are stated for the operating conditions:Fz = 40 kN, ω = 1000 rpm. The force determinedfrom the numerical integration of the pressure curves isFz = 37.3 kN and the resulting moment isMres = 108 Nm. From the theoretical solution the friction force is calculated to beFfriction = 133 N

4.4 Comparison between Experimental and Theoretical Results 41
generating a moment of 2.7 Nm in the same direction as that of the pressure distribution. It is 2.5 %of Mres and its influence is negligible. The diameter of the Hertzianpressure distribution betweenthe pad and the spherical support is calculated to bedHertz = 8.5 mm. The resulting moment may begenerated by external forces acting on the pad but not included in the analysis or it could be a resultof an offset of the centre of pressure of the Hertzian pressure distribution. The origin ofMres is notknown. In this report however, it is treated as an offset of the pivot point, which for the presentedexample isxoffset = 2.9 mm representing 2.6 % of the pad length. The rolling motion ofthe padon the spherical pivot will move the pivot position in the direction of the leading edge and give anegative value in the figure. This effect is negligible as it moves the pivot point only a few tenthsof a millimetre. Five sets of measurements with the plain padat the same nominal operating con-ditions (16 kN, 400 rpm) have been made. In between the measurements, the pad was built out ofthe test-rig. The calculated offsets: [3.9, 2.4, 2.9, 2.7, 3.8] mm vary by 1.5 mm. The reason for theoffsets could be construction tolerances in the moving parts of the supporting structure. Possibly thehydraulic piston positions itself at an angle in the cylinder causing the spherical pivot to be angledas well. A chain of tolerances of the necessary magnitude is however not found.
The values ofFz andθpiv used as input parameters for the calculations are determined to complywith the experimental results. The values are calculated using numerical integration as described inthe previous paragraph. Similarly, the inlet pressure is adjusted to comply with the experimentallydetermined value. This approach is chosen because the main aim of comparing measurements withcalculations is to validate the numerical model with regardto its ability to determine the pressuredistribution when a pocket is present in the pad surface. Theadjusted input parameters are externalto the oil film and using the nominal values makes it difficult to evaluate the effect of the pocketbecause the shapes of the theoretically and experimentallydetermined pressure profiles are different.For comparison however, data are also presented using the nominal values ofFz andθpiv.
4.4 Comparison between Experimental and Theoretical Results
4.4.1 Pressure profiles
Pressure profiles for selected measurements are compared totheoretical values in the figures 4.6to 4.8. Figure 4.6 shows curves for the plain pad operating at15 kN, 600 rpm. In figure 4.6(a)the nominal values of load and pivot position are used in the calculations. In the calculations offigure 4.6(b) the pivot is moved 2.1 mm towards the trailing edge to achieve moment equilibriumwith the measurements and the load is reduced to the experimentally determined value. The dis-crepancies between the measured and theoretical pressure profiles are much smaller when the pivotpoint is moved and the applied load adjusted. Similar good agreement between the theoreticallyand experimentally determined pressure curves is found forthe plain pad at all other operating con-ditions treated in this report. The figures 4.7 and 4.8 show theoretical pressure profiles obtainedusing input parameters adjusted to give zero moment and force differences between calculationsand measurements. The input data for these corrected simulations are stated later.
In figure 4.7 curves are shown for the pad with a pocket with thehigh-pressure injection turnedoff. The influence of the pocket is larger at small oil film thicknesses, i.e. at high loads and lowspeeds. The pocket stretches from approx.θpiv = 10°→ θpiv = 14°. There is a significant pressure

42 Experimental Results
Fz,sim
=15.00 kNspeed=600 rpmT
c=43.8 oC
θpiv
=12.00 o
θ[°]
p1-simulationp2-simulationp3-simulationp4-simulationp1-measuredp2-measuredp3-measuredp4-measured
0.0
0.5
1.0
1.5
2.0
2.5
3.0
3.5
0 2 4 6 8 10 12 14 1618 20
Pre
ssu
re[M
Pa]
Fz,sim
=14.22 kNspeed=600 rpmT
c=43.8 oC
θpiv
=12.38 o
θ[°]
0.0
0.5
1.0
1.5
2.0
2.5
3.0
3.5
0 2 4 6 8 10 12 14 16 1820
bc bca b
Figure 4.6: Comparison of measured (red lines) and simulated (blue lines) pressure profiles for theplain pad. Calculations in (a) are performed with nominal operating conditions. In (b) the pivotpoint is moved and the load reduced to give force and moment equilibrium with the measurements.The line legend shown in the left figure also applies to the figures 4.6(b), 4.7 and 4.8.
build-up in this area at a load of 15 kN. At 40 kN where the depthof the pocket is larger relativeto the oil film thickness the build-up is smaller. The theoretical and the experimental curves do notcorrespond as well to each other as in the case of the plain pad. The general shapes of the pressureprofiles are described well atFz = 15 kN. The measurements with sensors 3 and 4 are higher thanthe ones with sensors 1 and 2. This indicates that the pad is pivoted so that the oil film thickness atthe outer radius is smaller than at the inner radius. At high loads, the simulated pressure profiles areless accurate. The predicted maximum pressure is smaller than the experimental value by 10 % asthe model under predicts the pressure rise after the pocket.
In figure 4.8 oil is injected at a volume flow of 400 cm3/min. At the load of 15 kN shown and atall presented velocities the pressure curves are well described by the theoretical model. Again, themeasured pressure profiles indicate that the pad is tilted togive a smaller oil film thickness at theouter radius. In figure 4.8(a) the constant pressure indicating the position of the pocket is seen tohave a larger circumferential extend for sensor 3 compared to sensor 2. This indicates that the padis positioned slightly inaccurately in the radial direction.
The simulated pressure profiles shown in figures 4.7 and 4.8 under predict the influence of thepocket. This is especially clear at high loads whereas the discrepancies are small at low loads. Insidethe pocket, the measured pressure rises little followed by asteep rise after the pocket. The theoreticalmodel predicts a steeper pressure rise inside the pocket andsubsequently a lower pressure rise afterthe pocket.
As the pressure profiles for the plain pad show good agreementwith the theoretical results it isnatural to assume that the discrepancies seen in figure 4.7(c) and (d) are results of a poor descriptionof the pocket influence by the model used. In figure 4.9, however, a comparison of measuredpressure profiles is made for three different pads. Results for a pad without a pocket but with ataper are included. The pad is seen in figure 4.10. It has a surface finish similar to that of the pad

4.4 Comparison between Experimental and Theoretical Results 43
Fz,sim
= 13.92 kNspeed= 400 rpmT
c=43.5 oC
θpiv
=12.05 o
0.0
0.5
1.0
1.5
2.0
2.5
3.0
3.5
4.0
6.0
0 2 4 6 8 10 12 14 1618 20
Pre
ssu
re[M
Pa]
Fz,sim
= 14.33 kNspeed=1000 rpmT
c=44.1 oC
θpiv
=11.93 o
0.0
0.5
1.0
1.5
2.0
2.5
3.0
3.5
4.0
0 2 4 6 8 10 12 14 16 1820
Fz,sim
= 36.30 kNspeed= 400 rpmT
c=44.6 oC
θpiv
=12.37 o
0.0
2.0
4.0
6.0
8.0
10.0
12.0
0 2 4 6 8 10 12 14 16 18 20
Pre
ssu
re[M
Pa]
θ [°]
Fz,sim
= 37.33 kNspeed=1000 rpmT
c=46.2 oC
θpiv
=12.26 o
0.0
2.0
4.0
6.0
8.0
10.0
12.0
0 2 4 6 8 10 12 14 16 18 20θ [°]
bc bc
bc bc
a b
c d
Figure 4.7: Comparison of measured and simulated pressure profiles for selected operating condi-tions for the pad with an injection pocket.
with an injection pocket. The pressure profiles for the plainpad with an inlet taper behave in a waysimilar to those for the pad with a pocket. In both cases a dropand subsequently a rise in pressureis seen atθ = 14 − 16° for the sensors 1 and 4. This may be a result of the unevennessof thecollar as it is described in figure 4.4. The plain pad without taper has a higherhmax/hmin−ratioand it is therefore less likely that the unevenness of the collar will result in a diverging oil filmfor this pad. The unevenness of the collar has an increasing influence as the oil film thicknessbecomes smaller and it may therefore contribute to the discrepancies between the theoretical andexperimental results, which are seen in figures 4.7(c) and 4.7(d). Furthermore, the surface finishmay influence the results. The plain pad without a taper has grinding tracks in the direction ofmotion. These tracks inhibit the flow perpendicular to the tracks and thereby reduce the pressurefluctuations seen in the measurements of the other two pads.
The simplified flow description, which follows from using theReynolds equation, neglects termsthat may significantly influence the flow in the pocket. Changes in inertia at the edges of the pocket

44 Experimental Results
Fz,sim
=14.26 kNspeed=20 rpmT
c=41.8 oC
θpiv
=12.25 o
0.00.5
1.01.52.02.53.0
3.54.04.5
5.0
0 2 4 6 8 10 12 14 1618 20
Pre
ssu
re[M
Pa]
Fz,sim
=14.06 kNspeed=100 rpmT
c=41.6 oC
θpiv
=12.22 o0.00.51.0
1.52.02.53.03.5
4.04.55.0
0 2 4 6 8 10 12 14 16 1820
Fz,sim
= 13.91 kNspeed= 200 rpmT
c=41.8 oC
θpiv
=12.19 o
0.00.5
1.01.5
2.02.53.0
3.54.04.55.0
0 2 4 6 8 10 12 14 16 18 20
Pre
ssu
re[M
Pa]
θ [°]
Fz,sim
= 13.87 kNspeed= 400 rpmT
c=42.8 oC
θpiv
=12.21 o
0.00.51.0
1.52.0
2.53.03.5
4.04.55.0
0 2 4 6 8 10 12 14 16 18 20θ [°]
bc bc
bc bc
a b
c d
Figure 4.8: Comparison of measured and simulated pressure profiles for selected operating condi-tions when oil is injected at a flow rate of 400 cm3/min.
result in reduced pressure at the leading edge of the pocket and a rise in pressure at the trailing edge.This is a result of the recirculation flow in the pocket accelerating the oil entering the pocket. Ettles& Donoghue (1971) discussed this. Simulations for 15 kN, 1000 rpm show an acceleration of theoil at the mean radius from an average speed of0.45U before the pocket leading edge to more than0.95U . The influences of inertial changes are likely to increase inimportance as loads are loweredand speeds are raised. The discrepancies between the theoretical and experimental pressure curvesdo not, however, increase with the velocity and it is concluded that the large discrepancies seen infigures 4.7(c) and 4.7(d) are results of other factors than inertial effects.
4.4.2 Oil film thickness
Film thickness measurements and simulations are compared in figure 4.11. The gradientsdh/dθat the leading and trailing edges of the pad are used to linearly extrapolate the simulated oil film

4.4 Comparison between Experimental and Theoretical Results 45
0.0
2.0
4.0
6.0
8.0
10.0
0 2 4 6 8 10 12 1416 18 20θ[°]
Pre
ssu
re[M
Pa]
←− p1-measured
p2-measured−→
0.0
2.0
4.0
6.0
8.0
10.0
0 2 4 6 8 10 12 14 1618 20θ[°]
p3-measured−→
←− p4-measured
Figure 4.9: Comparison of measured pressure profiles for padwithout taper or injection pocket(dashed lines), pad with taper but no injection pocket (fulllines) and pad with taper and injec-tion pocket (dotted lines) operating without oil injectionat 39 kN, 400 rpm. Left:p1- and p2-measurements. Right:p3- andp4-measurements.
thicknesses to the measuring points. Simulation values areshown using nominal values (e.g.Fz =15 kN,θpiv = 12°) and also using values corrected to give zero force and moment deficits betweencalculations and measurements (e.g.Fz = 14.2 kN, θpiv = 12.38°).
Figure 4.10: Plain pad with taper.
For the plain pad, the experimental values ofleading edge oil film thickness correspond wellwith the simulations. The model less accuratelydetermines the trailing edge values. As the load isincreased, the discrepancies become larger. Thus,for the plain pad, the simulated values ofh3 andh4 are 9µm or 25% lower than the experimentalvalues at 40 kN, 1000 rpm. Similar discrepanciesare seen both with and without oil injection forthe second pad. The reason for this discrepancy isprobably a measuring error. As earlier stated thedistance sensor holders move due to thermal elon-gation of the pad, sensor holders and bolts. Thetemperature in the pad increases with load and ve-locity and therefore the possible inaccuracy dueto this phenomenon also increases. Simulationspredict the mean pad temperature at the trailing edge to be 63°C at 40 kN, 1000 rpm. As the sensorsmove up to 0.5µm/K this corresponds to a 12µm inaccuracy on the measurements of the oil filmthickness. At these operating conditions, the measured oilfilm thickness is approx. 30µm at the

46 Experimental Results
velocity [rpm] 200 400 600 800 1000Fload = 15 kN error estimate [µm]leading edge 1 2 2 2 2trailing edge 3 5 6 7 7Fload = 40 kNleading edge 2 2 3 3 3trailing edge 3 7 9 11 12
Table 4.1: Error estimates on the measured oil film thickness
trailing edge. The calculations are approx. 9µm smaller. The results deviate with 75 % of the esti-mated accuracy. Estimates of the error at all the operating conditions stated in the figure are givenin table 4.1. The thermal conditions are similar for the two pads so the estimates apply to both. Theerrors seen in figure 4.11 on the trailing edge oil film thickness are within the range given in table4.1. The leading edge errors are larger than those predicted.
For the pad with a pocket, the theoretical thicknesses of theoil film do not correspond as well tomeasurements as those for the plain pad. At the trailing edge, the experimental values are higher atthe inner radius than at the outer radius indicating that thepad is tilted radially. This was also seenin the pressure measurements in the figures 4.7 and 4.8. The theoretical values indicate a slight tiltin the other direction.
The results with high-pressure injection in figure 4.11(c) and (f) show a reasonable agreementbetween the measured and calculated values of trailing edgeoil film thickness as the velocity goestowards zero. This good agreement is achieved with the inputdata corrected for force and momentdeficits. With the nominal values of load and pivot position,the trailing edge oil film thicknessis much higher. This shows that the behaviour of the pad during start-up with high-pressure oilinjection is sensitive to the position of the pivot. Calculations predict oil film thicknesses at zerovelocity of [h3, h4]15kN = [25, 24], [h3, h4]40kN = [18, 18] at the nominal conditions while the valuesare[h3, h4]15kN = [9, 7], [h3, h4]40kN = [9, 8] at the corrected pivot locations.
In figure 4.12 the inputs data for the numerical model are stated. Figure 4.12(a)−(b) present theloads applied in order to achieve zero force deficits betweenthe measurements and the theoreticalresults. At 15 kN nominal load, the loads determined from theoil film pressure measurements are1 − 11 % smaller. The mean value in figure 4.12(a) is 6 % lower than thenominal value. At 40kN nominal load, the loads determined from the pressure measurements are4 − 9 % smaller. Themean value in figure 4.12(b) is 6 % lower than the nominal value. In figure 4.12(c) the offsets inthe angular direction of the pivot point which are used in thesimulations are stated. The offsetsvary between 0.6 and 3.4 mm in the direction of the trailing edge. This corresponds to0.5 − 3.1% of the pad length. The resulting moment acting at the nominal position of the pivot point can becalculated from figure 4.12(a)−(c). Figure 4.12(d) and (e) show the leading edge pressure and therotor temperature used in the calculations. These input parameters are set equal to measured values.At high velocities, the leading edge pressure is smaller by approx. 25 % when the pad has a taper.
In figure 4.13 simulation results are shown for a pad operating at 14 kN, 400 rpm. The vol-ume of the pocket significantly affects the temperature distribution. The effect is probably largerthan it would be in most bearings because the collar temperature in the test-rig is relatively low in

4.4 Comparison between Experimental and Theoretical Results 47
50
100
150
200
250
Fload
= 15 kN
Fload
= 40 kN
h1h2
Oil
film
thic
knes
s[µm
]
Fload
= 15 kN
Fload
= 40 kN
h1h2
Fload
= 15 kN
Fload
= 40 kN
h1h2
200 400 600 800 10
15
20
25
30
35
40
45
50
Fload
= 15 kN
Fload
= 40 kN
h3h4
Oil
film
thic
knes
s[µm
]
Velocity [rpm]400 600 800
Fload
= 15 kN
Fload
= 40 kN
h3h4
Velocity [rpm]0 100 200 300 400 500
Fload
= 15 kN
Fload
= 40 kN
h3h4
Velocity [rpm]
bc bc bc
bc bc bc
a b c
d e f
Pad without pocket Pad with injection pocket High pressure oil injection
Figure 4.11: Comparison of measured and calculated oil film thicknesses. (Full lines: Measure-ments. Dashed lines: Calculations using nominal values ofFz andθpiv. Dotted lines: the pivot pointis moved and the load reduced for force and moment equilibrium with the measurements.) Topfigures show leading edge film thicknesses. Bottom figures present trailing edge values. Figures (a)and (d): Results for the plain pad. Figures (b) and (e): Results for the pad with a pocket. The oilinjection is turned off. Figures (c) and (f): Results with 400 cm3/min oil injection. Symbols:×, O,+ and⋄ represent measured values. Additionally, measurements are performed with intervals of 10rpm from the minimum possible of 20 rpm to 120 rpm for the pad operated with oil injection.

48 Experimental Results
13.5
14
14.5
15F
load, nominal = 15 kN
Flo
ad
[kN
]
37
38
39F
load, nominal = 40 kN
Flo
ad
[kN
]
0 200 400 600 800 0
1
2
3
4
Piv
oto
ffset
[mm
]
Velocity [rpm]0 200 400 600 800
0.0
0.05
0.1
0.15
0.2
0.25
0.3 15 kN40 kNwithout pocketwith pocketinjection
Ple
adin
gedge
[MP
a]
Velocity [rpm]0 200 400 600 800
41
42
43
44
45
46
47
Tc
[°C
]
Velocity [rpm]
bc bc bc
bc bca b
c d e
Figure 4.12: Input data for the calculations in which the pivot point and the load are adjustedfor moment and force equilibrium with the measurements. Thenomenclature for all figures isdefined in (d). Figure (a) illustrates the loads used when thenominal condition is a load of 15 kN.Data for various collar speeds and three bearing configurations are given: pad without pocket ‘×’,pad with pocket but without high-pressure injection ‘2’ and pad with pocket and 400 cm3/min oilinjection ‘O’. Figure (b) illustrates the same data for a nominal load of 40 kN. Figure (c) presents thepivot offsets resulting in moment equilibrium with the measurements. Figure (d) shows the leadingedge pressures determined form measurements and used in thecalculations. Figure (e) shows themeasured collar temperatures used as a boundary condition in the calculations.
comparison with the maximum temperature in the babbitt layer.An experimental study of the influence of oil injection is presented in figure 4.14. The oil film
thicknesses measured with oil injection turned on are compared to those measured with no high-pressure injection. At a load of 15 kN the oil injection raises the mean film thickness by 14µmat 600 rpm and by 18µm at 400 rpm. At a load of 40 kN it raises the mean film thickness by 3µm at 600 rpm and by 7µm at 400 rpm. The change in the tilting angle depends on the operatingconditions. At both 400 rpm and 600 rpm, it results in a higherkip angle at a load of 15 kN. Thekip angle is reduced atFz = 40 kN when the high-pressure oil injection is turned on.
4.4.3 Lift-off oil film thickness
In figure 4.15 a comparison between measured and theoreticallift-off height is shown. The measure-ments are performed by hydraulically pressing the pad against the collar and measuring the offset of

4.4 Comparison between Experimental and Theoretical Results 49
4045
5055
6065
707580
8590
95100105
110
Lines of constantfilm thickness [µm]
0
0.511.5
22.5
3
Lines of constantpad deflection [µm]
3.253
2.752.5 2.252 1.75
1.5 1.251 0.75
0.5 0.25
Lines of constantpressure [MPa] 53
525150494847
46
45
4443
44
Lines of constanttemperature [oC]
Figure 4.13: Theoretical values of oil film thickness, pad deflection, pressure and babbitt tempera-ture for a pad operating at:Fz = 13.92 kN, velocity= 400 rpm,θpiv = 12.05°
the distance sensors. Subsequently the offset is measured with the high-pressure injection turned on.The differences between the offset values are shown in the figure. Eight measurements at randompositions on the collar are performed at each load. The corresponding simulations are performedwith a speed of 0.01 rpm, a collar temperature of 40 °C and withthe nominal values of load andposition of the pivot. The results are higher than the experimental values. This is as expected as theunevenness of the collar causes a remaining layer of oil between the pad and collar when the initialoffset measurement is performed. The errors between the theoretical values of oil film thickness andthe measured values are within the values of the standard deviations on the variation on the collarsurfaceσ ≈ [12, 17, 11, 16] µm for the sensors[h1, h2, h3, h4] as they were calculated in section4.2. Assuming the pivot located further towards the trailing edge could explain the differences inthe measured and calculated trailing edge oil film thickness. As was previously shown, the trailingedge lift-off film thickness is very sensitive to small variations in the pivot location.

50 Experimental Results
Velocity [rpm]
h1
h2
50
75
100
125
150
175
0 200 400 600
Oil
film
thic
knes
s[µm
]Fload = 15 kN
Fload = 40 kN
Velocity [rpm]
h3
h4
10
15
20
25
30
35
40
0 200 400 600
Fload = 15 kN
Fload = 40 kN
Figure 4.14: Comparison of measured oil film thicknesses with (full lines) and without (dashedlines) 400 cm3/min oil injection. Left: Leading edge film thicknesses. Right: Trailing edge values.
4.4.4 Thermal bending
The bending of the pad due to thermal gradients is measured using a strain gauge arrangement asseen in figure 4.16(top). 350Ω, 6 mm gauges with gauge factork = 2.06 are used. They arecompensated for the smallest available linear thermal expansion coefficient which has a value ofα = 0.5 · 10−6 K−1, approximately 4.5 % of the value for steel. The influence of temperature onthe measured strain is thereby minimized. The strain-gauges are arranged in two half bridges forrespectively the inner radius and the trailing edge. The theoretical values of strain in the positionsof the strain-gauges are calculated using Taylor expansions of the deflections as described in figure4.16(bottom).
In figure 4.17 experimentally and theoretically determinedvalues of strain in the positions ofthe strain-gauges are shown for two different speeds and loads varying from 15 kN to 65 kN. It isseen that the calculated strains obtained with a corrected pivot point are within a 20 % differencefrom the experimental values. The average deviation from the experimental values is 7 % . Theseresults indicate that the flat plate approximation used for the calculation of the bending of the padyields results which are within a reasonable accuracy of theactual behaviour.

4.5 Conclusion 51
5 10 15 20 25 30 35 40 0
20
40
60
80
100
120
140 h1−simulationh2−simulationh3−simulationh4−simulationh1−measuredh2−measuredh3−measuredh4−measured
Lift
off
oil
film
thic
knes
s[µ
m]
Load [kN]
Figure 4.15: Lift off oil film thick-ness.
30m
m5m
m
46 mm
34mmǫA
d
∆R = ∂2w∂x2
∣
∣
∣
A·∆x2
2
∆x
β
A
B
∂w∂x
∣
∣
∣
A
β = Arccos[
1 + 2∆x2
∆R2+∆x2
]
ǫA = β
∆xd2
bc
bc
x
w
Figure 4.16: Top: Picture showing the position of the straingauges mounted at the inner radius and trailing edge. Bot-tom: Drawing showing the calculation of the strain in theposition of the strain-gauges from the second derivative ofthe simulated values of pad deflectionw.
The influence of thermal bending on the oil film thickness as well as the pressure and tem-perature distributions for a pad operating at 15 kN, 400 rpm can be seen in figure 4.13 showingsimulation values. The figure shows results for a pad with an injection pocket in order to show theinfluence of the pocket on the pressure and temperature distributions. The values of deflection forpads with and without injection pockets deviate little.
4.5 Conclusion
Oil film thickness and pressure profiles have been measured for two different thrust bearing padsof approximately 100 cm2 surface area. One is a plain bearing which is measured for reference.The other is a pad with a leading edge taper and a high pressureinjection pocket which is measuredwith and without constant volume flow high pressure oil injection. The pads operate at loads ofapproximately 1.5 and 4.0 MPa and velocities of up to 33 m/s. The measurements have been per-formed in order to study the influence of injection pockets onkey bearing parameters and to validatea numerical model.
Simulations and measurements of oil film thickness agree well at low loads. As the load isincreased discrepancies become larger at the trailing edge. This is due to a measuring error which isproportional to the difference between the oil bath and pad temperatures. For the plain pad operatingat 15 kN, 400 rpm the calculated values are 2µm or 6 % lower than the measurements. At 40 kN,

52 Experimental Results
15 20 25 30 35 40 45 50 55 60
2
3
4
5U=400 rpm, T
a=40oC
experimentsimulationsim. with corrected θ
pinner radiustrailing edge
ǫ·10
5[-
]
Load [kN]15 20 25 30 35 40 45 50 55 602
3
4
5
6
7
8
9U=600 rpm, T
a=40oC
ǫ·10
5[-
]
Load [kN]
Figure 4.17: Comparison between measured and theoretically determined values of strain.
1000 rpm the calculated values are 9µm or 25 % lower than the measurements. The results whenoil is injected at high pressure show that the start-up oil film thickness depends strongly on the pivotlocation. The start-up behaviour is predicted well by the model.
The pressure measurements indicate that there is a moment inthe circumferential direction atthe nominal position of the pivot point. As no external forces are found it seems that the pivot pointis shifted towards the trailing edge compared to the nominalposition. This is likely to be due toconstruction tolerances. When the pivot point used in the numerical model is shifted0.6− 3.4 mm(0.5− 3.1 % of the pad length) in the direction of the trailing edge the theoretical pressure profilesfor both pads correspond well to those experimentally obtained for low loads. The influence of thepocket is slightly under predicted at low loads, i.e. the calculations predict a slightly higher pressurerise over the pocket than documented by the experiments. At high loads the theoretical pressureprofiles correspond less accurately as the experiments document a strong pressure rise after thepocket, which is not predicted by the model. It is assessed that these discrepancies are due mainlyto geometric inaccuracies of the collar surface although they may to some extend be due to thesimplifications employed in a Reynolds equation description of the pocket flow.
Using a strain-gauge arrangement the deflection of the bearing pad due to pressure bending andthermal gradients has been measured at various operating conditions. An average deviation of 7 %between the measured values of strain at the inner radius andat the trailing edge and the valuestheoretically determined from the model is recorded. It is concluded that the model determines thebending of the pads to a reasonable level of accuracy.

Chapter 5
Analysis of Standard Tilting-Pad ThrustBearings
In this chapter bearings of conventional design with and without oil injection pockets at the pivotpoint are studied. An investigation of the influence of various parameters on the friction loss, theload carrying capacity and the optimal position of the pivotpoint is performed. The influences ofpockets, of pad bending and of the pad length-to-width ratiois analysed. The 3-dimensional TEHDmodel is used.
Calculations have shown that a good performance, i.e. closeto the minimum friction loss fora given minimum oil film thickness is achieved when the bearing pads tilt so that the minimumoil film thickness is located at the centre of the trailing edge. This is generally not the case ina tilting-pad thrust bearing with the pivot located at the mean radius. In a bearing in which thethermal crowning of the pads is insignificant the minimum oilfilm thickness may be located atthe inner or outer trailing edge corner depending on the geometry of the pads. A Michell typebearing with a line pivot can be constructed with the pivot aligned with the trailing edge to fulfillthe criterion of minimum film thickness at the mean radius. This corresponds to moving the pivotin the radial direction in bearings with spherical pivots. In order to generalize the results and studythe improvement on the friction loss, calculations in whichthe pivot position is radially adjustedto achieve a minimum oil film thickness at the centre of the trailing edge are performed as wellas calculations with the pivot positioned at the mean radius. Although some boundary conditionsdo not in this case correspond to those employed in the analysis of a Michell type bearing thedifferences are small and the predicted performance in effect corresponds to the performance of aMichell type bearing with the pivot aligned with the trailing edge.
5.1 Influences of Oil Injection Pockets and Thermal Bending
Bearing pads both with and without cylindrical oil injection pockets are investigated. Pads with twodifferent pocket sizes are studied. The diameters of the pockets are chosen to span the sizes normallyused for hydrostatic jacking. The influence of the pivot position on the load carrying capacity andfriction loss is investigated. Furthermore, the influence of pad bending is analysed.
Calculations are performed on an 8-pad example bearing witha pad length-to-width ratio of
53

54 Analysis of Standard Tilting-Pad Thrust Bearings
0.5 0.55 0.6 0.65 0.70.8
0.85
0.9
0.95
1
No pocketØ10 cm pocketØ20 cm pocket
Flo
ad/F
load,m
ax
[-]
Dimensionless pivot locationθpiv/θpad
0.5 0.55 0.6 0.65 0.71
1.02
1.04
1.06
1.08
1.1No pocketØ10 cm pocketØ20 cm pocket
Qgen/Q
gen,m
in[-
]
Dimensionless pivot locationθpiv/θpad
Figure 5.1: The influence of oil injection pockets. Left: Load carrying capacity at different pivotlocations. Right: Power loss at different pivot locations.The results are nondimensionalized to givevalues of 1 in the optimum points.
0.9. The bearing operates using a VG32 mineral oil under fully flooded conditions. A cylindricalpocket with diameterdp and depthhp centred at the pivot point allows for hydrostatic lift-off.Datafor the bearing and oil are:θ0 = 37.5°, r1 = 0.509 m, r2 = 1.091 m, rpiv = 0.800 m, hp =2.0 mm, µ40oC = 27.1 mPas,µ80oC = 6.8 mPas,ρ = 848 kg/m3, c = 2090 J/kg/K, k = 0.13W/m/K, Fz = 5.00 MN, ω = 400 rpm, Ta = 40°C, Tc = 55°C. A variable sized grid withnr × nθ × (nz + nzpad
)=24×24×(10+10) control volumes is used in the calculations. The averagedensity of the volumes in the area of the pocket is 1.5 times higher than in the oil film. Bearingpads with pockets ofdp = 100 mm anddp = 200 mm and plain bearing pads (without pockets) arestudied. Two different grids designated grid1 and grid2 are used for respectively the bearing withthe small pocket and the bearing with the large pocket.
Using the procedures explained in chapter 2.4 the effect of varying the dimensionless pivotlocationθpiv = θpiv/θpad on the load carrying capacity and on the power loss is studied. A minimumoil film thickness of 75µm is the criteria used in the calculations. Thus, for the study of loadcarrying capacity the load is adjusted to comply with this criterion. For the study of power loss theload is kept at 5 MN while the pad surface area is adjusted to comply with the criterion. A fixedlength-to-width ratio is maintained.
Curves showing the nondimensional load carrying capacity and friction loss as functions of thepivot position are given in figure 5.1. The optimal pivot locations with respect to both maximumload carrying capacity and minimum power loss move towards the leading edge with increasingpocket size. Introducing a pocket in a bearing pad increasesthe pitch angle due to the change inpressure pattern. To compensate for this effect the pivot location should be moved towards thecentre of the pad. In figure 5.1(left) the optimal load carrying capacity is seen to be achieved atθpiv,opt = 0.57 when a plain pad is analysed.θpiv,opt = 0.54 with a pocket diameter of 200 mm. Infigure 5.1(right) the effect of pockets on the optimal position of the pivot point is seen to be larger

5.1 Influences of Oil Injection Pockets and Thermal Bending 55
as it moves fromθpiv,opt = 0.62 for a pad without a pocket toθpiv,opt = 0.58 when a pocket ofdp =200 mm is machined at the pivot point. However, the optimum isrelatively flat. If designing abearing without taking the pocket into account and positioning the pivot atθpiv = 0.62 the bearingwith the Ø100 mm pocket will have a friction coefficient 0.2 % higher than the optimal while thecoefficient for the pad with the Ø200 mm pocket will be approx.2 % higher than the optimal value.This indicates that standard design charts for bearings without oil injection pockets can be used inthe design process while still maintaining a near optimal design.
Figure 5.2 shows the oil film thickness, pad deflection, pressure and pad surface temperaturefor the three different pads with the pivot location optimized for minimizing the power loss. Thetilting angle decreases with the pocket size. The effect is however relatively small. The pressuredistributions in the pocket areas are almost constant. The mixing in the pockets of the hot oil at thepad surfaces with the colder oil at the collar surface results in cooling of the pads downstream ofthe pockets. The effect only influences the pads directly downstream of the pockets and as the hotspot is usually located at a larger radius close to the trailing edge it is not significantly lowered bythe mixing in the pocket.
The effect of thermal deflection of the pads is studied. The crowning of a pad can be controlledin different ways: changing the pad thickness, multi layer constructions, changing the backingmaterial etc. Here, it is chosen to study the effect of varying the pad deflection without consideringthe method of achieving such a variation. The deflection fraction described in chapter 2.4 and figure2.5 is used to control the amount of crowning. A deflection fraction of 1 corresponds to the nominalconditions with the deflection distribution shown in figure 5.2(bottom row).
Figure 5.3 shows the nondimensional load carrying capacityand friction loss for the plain pad atfour different deflection fractions: 0, 0.2, 0.5 and 1, indicating ratios from no deflection to the nom-inal crowning with a pad thickness of 0.3 m. The optima are much more clearly defined when thepads are considered rigid than when thermal crowning is included. This indicates that positioningthe pivot correctly in the circumferential direction is more important in bearings with insignifi-cant thermal bending than in the typically larger bearings where the oil film distribution is stronglyinfluenced by thermal bending. The optimal position of the pivot point with respect to the loadcarrying capacity is strongly influenced by the bending. Without bendingθpiv,opt = 0.62 while itis θpiv,opt = 0.57 at the nominal conditions. The values ofθpiv minimizing the friction loss is lessinfluenced by the crowning.θpiv,opt = 0.63 without deflection, while it is approx.θpiv,opt = 0.62at the other conditions. Designing the pivot location of a bearing without considering thermal de-flection therefore only results in a minor increase in the friction loss for this bearing geometry. Atθpiv = 0.63 the friction loss with the nominal deflection is 0.25 % higherthan the minimum value.It should be noted that the influence of the deflection fraction on the optimal pivot location dependson the bearing geometry. Calculations with a 6-pad bearing with length-to-width ratios of 1.2 showa stronger variation with the deflection. With respect to minimizing the friction lossθpiv,opt = 0.65without thermal crowning while it isθpiv,opt = 0.615 when pad bending is included.
In the following the deflection fraction is varied between zero and one so that only a fractionof the deflections shown in figure 5.2 are used in the calculations. The optimal pivot location andthe corresponding minimum power consumption are seen in figure 5.4(a). In figure 5.4(b) the radialpivot location is adjusted so that the minimum oil film thickness is located at the mean radius atthe trailing edge. As is also seen in figure 5.3(right), figure5.4(a-right) shows that with increasedbending of the pad the optimal position of the pivot moves towards the leading edge of the pad. The

56 Analysis of Standard Tilting-Pad Thrust Bearings
75
375350
325
300275
250
225
200175
150125
100
Lines of constant oil filmthickness [µm]h
min=75.0µm
hmax
=383.3µm
350325
300275
250225
200175
150125
100
Lines of constant oil filmthickness [µm]h
min=75.0µm
hmax
=379.2µm
75
350325
300
275
250
225
200
175
150
125
100
Lines of constant oil filmthickness [µm]h
min=75.0µm
hmax
=359.2µm
5.5 54.5 43.5 32.5 21.5 10.5
Lines of constant pressure [MPa]P
max=5.99MPa
54.5
43.5
32.5
21.5
10.5
Lines of constant pressure [MPa]P
max=5.41MPa
4
3.532.5
21.5
10.5
Lines of constant pressure [MPa]P
max=4.40MPa
78
76 7472 70
68 66
64 62
6058
56 54
52 50
48 46
44
Lines of constant pad surfacetemperature [oC]T
max,surf=78.8oC
78 76
74 72
70 68
66 64
62 60
5856
5452
50 48
46 4452
Lines of constant pad surfacetemperature [oC]T
max,surf=78.8oC 76 74
72 70
68 66
6462
6058
5654
52 50
4846
Lines of constant pad surfacetemperature [oC]T
max,surf=77.6oC
10
2030
40
50
Lines of constantpad deflection [µm]w
max=56.6µm
10
20
30
4050
60
Lines of constantpad deflection [µm]w
max=61.4µm
10
20
3040
50
Lines of constantpad deflection [µm]w
max=65.1µm
Figure 5.2: From left to right: Simulation results without apocket, with a Ø100 mm pocket and witha Ø200 mm pocket. The simulations are performed with the pivot location minimizing the powerloss. From top to bottom the figures show: oil film thickness, pressure, pad surface temperature andpad deflection.

5.2 The Influence of the Length-to-Width Ratio 57
0.5 0.55 0.6 0.65 0.70.8
0.85
0.9
0.95
1
Deflection fraction=0.0Deflection fraction=0.2Deflection fraction=0.5Deflection fraction=1.0
Flo
ad/F
load,m
ax
[-]
Dimensionless pivot locationθpiv/θpad
0.5 0.55 0.6 0.65 0.71
1.02
1.04
1.06
1.08
1.1Deflection fraction=0.0Deflection fraction=0.2Deflection fraction=0.5Deflection fraction=1.0
Qgen/Q
gen,m
in[-
]
Dimensionless pivot locationθpiv/θpad
Figure 5.3: The influence of thermal bending (Pad without injection pocket). Left: Load carryingcapacity at different pivot locations. Right: Power loss atdifferent pivot locations. The results arenondimensionalized to give values of 1 in the optimum points.
optimal value of deflection is seen to be approximately 40 % ofthe nominal value. With this amountof bending the friction loss is 5 % lower than the loss when thepad is flat. The example bearingis of a large size. In such bearings the deflection has a large influence on the oil film thickness. Insmaller mass-produced bearings the influence of deflection is smaller and sometimes negligible. Itis however seen that an amount of bearing deflection or pad curvature is preferable to a flat surface.The reason is that curvature in the radial direction resultsin a better oil film thickness distributionin which the minimum value is located somewhere around the centre of the trailing edge and notin either of the two trailing edge corners as is the case of a flat pad. The bearing with Ø200 mmpockets produces a larger friction loss than the plain pad. The bearing with Ø100 mm pocketsproduces a smaller friction loss than the plain pad - at leastfor a range of deflection fractions. Theresults indicates that introducing pockets in a bearing padcould lower the friction loss. The resultsof figure 5.4(b-left) show that when the radial tilt of the bearing is controlled a flat pad not subjectedto any curvature is preferable as it produces the smallest friction loss. The figure also shows thatboth pads with oil injection pockets have smaller friction coefficients than the pad without a pocket.With an Ø200 mm pocket the reduction in friction is up to 2.5 % relative to the plain pad. Figure5.4(b-right) presents the corresponding pivot locations in the circumferential direction. These wouldbe the optimal positions of the pivots if designing with line-pivots.
5.2 The Influence of the Length-to-Width Ratio
The length-to-width ratio of the individual pads influencesthe performance of the bearing due to thedifferences in the convergence of the oil film. In the following the influence of the length-to-widthratio is examined. Tilting-pad thrust bearings with 4, 5, 6,8 and 12 pads are studied. The mean

58 Analysis of Standard Tilting-Pad Thrust Bearings
0 0.2 0.4 0.6 0.8 1260
265
270
275
280
285
290No pocket, grid
1
Ø10 cm pocket, grid1
No pocket, grid2
Ø20 cm pocket, grid2
Deflection Fraction [-]
Qgen
[kW
]
0 0.2 0.4 0.6 0.8 10.57
0.58
0.59
0.6
0.61
0.62
0.63
Deflection Fraction [-]
op
timal
piv
otl
oca
tionθ
piv/θ
pad
[-]
(a) Calculations with rpiv=0.80 m
0 0.2 0.4 0.6 0.8 1245
250
255
260
265
270
275No pocket, grid
1
Ø10 cm pocket, grid1
Ø20 cm pocket, grid2
Deflection Fraction [-]
Qgen
[kW
]
0 0.2 0.4 0.6 0.8 10.57
0.58
0.59
0.6
0.61
0.62
0.63
0.64
Deflection Fraction [-]
op
timal
piv
otl
oca
tionθ
piv/θ
pad
[-]
(b) rpiv is adjusted so thathmin is positioned at the centre of the trailing edge.
Figure 5.4: Left: Minimum obtainable power consumption with different pocket sizes and differentvalues of pad deflection. Right: The corresponding optimal pivot locations.
radius is 0.8 m. The width of the bearings vary from 0.55 m to 0.65 depending on the number ofpads and the angular extend of all the pads. All pads have a thickness of 0.3 m.
In figure 5.5 power losses, optimal angular pivot positions and optimal radial pivot positions areshown. For rigid pads with the pivot positioned at the mean radius the optimal length-to width ratiois 1.2. This corresponds to a 6-pad bearing. The reason for this can be seen in 5.5(right) showingthe radial position of the pivot point which leads to a minimum oil film thickness at the centre ofthe trailing edge. The usual praxis of positioning the pivotat the mean radius fulfills the criteria ofa minimum oil film thickness at the centre of the trailing edgeat a length-to-width ratio of approx.1.2. At lower length-to-width ratios positioning the pivotat the mean radius leads to a minimum

5.2 The Influence of the Length-to-Width Ratio 59
0.6 0.8 1.0 1.2 1.4 1.6 1.8240
260
280
300
320
340
360
380
400rpiv
adjusted, no pad deflection
rpiv
adjusted, pad deflection
rpiv
=0.80 m, no pad deflection
rpiv
=0.80 m, pad deflection
length-to-width ratiormeanθ0
(r2−r1)[-]
Qgen
[kW
]
0.6 0.8 1.0 1.2 1.4 1.6 1.80.60
0.62
0.64
0.66
0.68
0.70
12 pads
8 pads
6 pads
5 pads
4 pads
length-to-width ratiormeanθ0
(r2−r1)[-]
op
timal
piv
otl
oca
tionθ
piv
t/θ
pad
[-]
0.6 1.0 1.4 1.80.46
0.47
0.48
0.49
0.50
0.51
0.52
0.53
0.54
(rpiv−
r 1)/
(r2−
r 1)
[-]
rmeanθ0
(r2−r1)[-]
Figure 5.5: The influence of length-to-width ratio. Left: Minimum power loss. centre: The corre-sponding angular pivot locations. Right: Radial position of pivot point, when the oil film thicknessis aligned with the trailing edge.
oil film thickness at the inner trailing edge corner while at high length-to-width ratios the minimumoil film thickness is located at the outer trailing edge corner. Pads, which experience strong thermalcrowning have higher optimal length-to-width ratios (approx. 1.4−1.8). This is also the case forbearings in which there is no radial tilting at the trailing edge. Figure 5.5(middle) shows the optimalcircumferential pivot location. The optimal pivot location first rises with the length-to-width ratiofrom a ratio of 0.6 to 0.8 then falls from a ratio of 0.8 to 1.4. From a ratio of 1.4 to 1.8 it rises sharply.The thermal bending of the pad increases with the pad length-to-thickness ratio and to achieve anadvantageous pressure distribution the nondimensional pivot location moves towards the centre ofthe pad for higher length-to-width ratios. At a ratio of 1.8 this leads to cavitation at the trailing edge.That is disadvantageous for the power loss because the friction loss in the regions with cavitationis large while there is no contribution to the pressure build-up. The optimal position of the pivot istherefore closer to the trailing edge leading to a higher tilting angle and no cavitation.
The optimal length-to-width ratio depends on the curvatureof the pads. In the results discussedin the previous paragraph the bearing outer radius is approximately twice the inner radius. This isa typical value for mass-produced bearings. The ratio of outer to inner radius is rarely much largerthan 2. It is however not unusual to use bearings in which thisratio is much smaller than 2. A ratioof 1 corresponds to a rectangular pad. Such bearings commonly use 16 or more pads of much lowercircumferential curvature. In order to illustrate the variation in the optimal length-to-width ratiodepending on the pad curvature a rectangular pad is studied.The rotor temperature is 55 °C, theoil bath temperature is 40 °C and the leading edge temperature is set equal to the rotor temperature.The speed is 30 m/s and one pad carries a load of 1.0 MN. The padsare 0.3 m thick. Pads withlength-to-width ratios of 0.2 to 2.0 are studied.
Figure 5.6(left) shows that length-to-width ratios of 0.8−1.0 result in small friction losses. Fig-

60 Analysis of Standard Tilting-Pad Thrust Bearings
0.2 0.4 0.6 0.8 1.0 1.2 1.4 1.6 1.8 2.0 34
36
38
40
42
44
46
48
50
52No pad deflectionPad deflection
length-to-width ratio [-]
Qgen
[kW
]
0.2 0.4 0.6 0.8 1.0 1.2 1.4 1.6 1.8 2.00.60
0.62
0.64
0.66
0.68
0.70
0.72
0.74
0.76No pad deflectionPad deflection
length-to-width ratio [-]
op
timal
piv
otl
oca
tionθ
piv/θ
pad
[-]
Figure 5.6: Left: Minimum power loss at different length-to-width ratios of a square bearing pad.Right: The corresponding pivot locations.
ure 5.6(right) shows optimal nondimensional pivot locations which for flat pads are between 0.01smaller and 0.035 higher than those presented for sector shaped pads in figure 5.5(middle).
Based on the results of figure 5.5 and figure 5.6 it is concludedthat the length-to-width ratiosof the pads of tilting-pad thrust bearings should be kept within the interval [0.8; 1.8] to minimizefriction. The choice of ratio within this interval depends on the curvature of the pads.
5.3 Conclusion
Tilting-pad thrust bearings of standard design with and without oil injection pockets have been stud-ied. The influence of thermal bending, pad length-to-width ratio and pad curvature on the frictionloss and the optimal circumferential position of the pivot point has been investigated. Furthermore,the influence of thermal bending on the load carrying capacity has been studied. In addition to study-ing bearings in which the pivots are radially positioned at the mean radius as is the usual praxis, acomparative study has been made with bearings in which the pivot is located so as to result in zeroradial tilting at the trailing edge. This corresponds to thebehaviour of a Michell type bearing withthe line pivot aligned with the trailing edge.
Oil injection pockets at the pivot point - with the oil injection turned off - cause higher pitch an-gles than in bearings without pockets due to the changes in the pressure distribution. To compensatefor this the pivot point should be moved towards the centre ofthe pad. Within the range of pocketsizes usually used for high pressure injection this resultsin optimal pivot locations up to0.04 · θpad
smaller than the optimal positions in plain bearing pads.The thermal crowning of the bearing pads influences the optimal position of the pivot point. The
larger the thermal crowning, the lower the optimal nondimensional pivot location. The influenceis however small for the example bearing and designing without considering the crowning induces

5.3 Conclusion 61
only slightly higher (0.25 %) friction losses. The optimum is flatter when the pads are crowned.Thus, it is more important to correctly position the pivot inbearings where the pad curvature due tothermal bending is small.
Bearings with various length-to-width ratios have been studied. The optimal length-to-widthratio has been shown to be between 0.8 and 1.8. The choice of ratio within this interval depends onthe curvature of the pads. The higher the curvature the higher is the optimal length-to-width ratio.

62 Analysis of Standard Tilting-Pad Thrust Bearings

Chapter 6
Analysis of Tilting-Pad Bearings withShallow Recesses
Parallel-step bearings have smaller friction coefficientsthan tilting-pad bearings. Several reasonshowever, disqualify this bearing type for use in many application. The performance of parallel-stepbearings strongly depends on the operating conditions, i.e. the bearing must be operated at an oilfilm thickness close to the design value. This also implies that wear reducing the height of the stepreduces the performance significantly.
This chapter analyses the theoretically obtainable performance improvement of parallel-stepbearings compared to tilting-pad bearings. The possibility of applying features of the parallel-stepbearing to tilting-pad bearings in order to create a double incline tilting-pad bearing with improvedperformance is investigated. The results of chapter 3.2 indicate that the performance of tilting-padbearings can also be improved by the use of enclosed shallow recesses. Calculations show this tobe a special case of bearings with inlet pockets - but with poorer performance. Enclosed shallowrecesses are not investigated further. The results of this chapter are obtained using 1-dimensionaland 2-dimensional bulk flow analysis.
6.1 1-Dimensional Double Incline Bearings
In the following a 1-dimensional isothermal analysis of a double incline tilting-pad bearing is per-formed. A bearing pad with a length of 0.5 m operating at a speed of 30 m/s, a load of 1.0 MNand a temperature of 55 °C is analysed. The width of the bearing is adjusted to achieve a minimumoil film thickness at the trailing edge of 75µm. The geometry of the bearing is shown in figure6.1(left). The height and position of the step are:hs/hte = 0.98 andLs/Lpad = 0.79. These are thedimensions giving the minimum friction loss at a tilting-angle of zero. At this tilting-angle the bear-ing behaves as a parallel-step bearing. The values of step height and step position available in theliterature (Hamrock et al., 2004) giving the maximum load carrying capacity:hs/hte = 0.897 andLs/Lpad = 0.718 result in a friction loss 2.25 % higher than the minimum value. Figure 6.2(left)shows the friction loss of the double incline bearing at different tilting-angles. The results are com-pared to those for a single incline bearing. The best performance is achieved at a tilting-angle ofzero where the power loss is 13.4 % lower than the minimum obtainable loss with the single incline
63

64 Analysis of Tilting-Pad Bearings with Shallow Recesses
Ls
Lpad
Lpiv
hle
hte
hs
U
Lpad
Ls
Lpiv
Wpad
WslWpad/2
+
U
Figure 6.1: Left: The bearing used in the 1-dimensional analysis (side view). Right: The bearingused in the 2-dimensional analysis of rectangular pads (topview).
0.0 0.5 1.0 1.5 2.0 2.518
19
20
21
22
23
single incline bearingdouble incline bearing
convergence ratio,(hle − hs)/hte − 1 [-]
Qgen
[kW
]
0.56 0.57 0.58 0.59 0.60 0.61 0.6218
19
20
21
22
23
single incline bearingdouble incline bearing
pivot position, Lpiv/Lpad [-]
Qgen
[kW
]
Figure 6.2: 1-dimensional analysis of a bearing withhs = 0.98 · hte andLs = 0.79 · Lpad. Left:Friction loss as a function of the pad convergence ratio. Right: Friction loss as a function of thecorresponding nondimensional pivot positionLpiv/Lpad.
bearing. Figure 6.2(right) shows the power loss as a function of the pivot position. The optimal pivotpositions for the two bearings are both located at values ofLpiv/Lpad between 0.59 and 0.60. Thefriction loss of the single incline bearing is relatively insensitive to the pivot position compared tothe double incline bearing, in which the power loss rises steeply with the offset from the optimum.
6.2 Rectangular Parallel-Step Bearing Pads
Figure 6.1(right) shows a parallel-step bearing with side lands. The recess is rectangular and hasa uniform depth,hs. Figure 6.3 presents a THD-analysis of the bearing pad for various side land

6.2 Rectangular Parallel-Step Bearing Pads 65
0.3 0.4 0.5 0.6 0.7 0.8 0.925
30
35
40
45
50
55
Minimum friction lossin a tilting−pad bearing
step position, Ls/Lpad [-]
Qgen
[kW
]
0.3 0.4 0.5 0.6 0.7 0.8 0.90.6
0.8
1.0
1.2
1.4
1.6
1.8
2.0
2.2W
sl=0.00 ⋅ W
pad
Wsl=0.04 ⋅ W
pad
Wsl=0.10 ⋅ W
pad
Wsl=0.16 ⋅ W
pad
Wsl=0.22 ⋅ W
pad
step position, Ls/Lpad [-]
op
timal
step
hei
gh
t,h s/h t
e[-
]
Figure 6.3: 2-dimensional THD-analysis of the design of a parallel-step bearing with side lands.Left: The minimal obtainable friction loss as a function of the step position. Results are stated forvarious side land widths. Right: The corresponding optimalstep height.
widths, Wsl and step positions,Ls. The operating conditions are:U = 30 m/s, Fz = 1.0 MN,Ta = 40 °C andTc = 55 °C. The pad area is adjusted to give a minimum oil film thickness of75 µm. For each combination ofWsl andLs the step height,hs is optimized to give the minimumfriction loss. A grid of 50×50 control volumes is used in the calculations .
In figure 6.3(left) the friction loss is shown. For comparison the minimum obtainable fric-tion loss of a tilting-pad bearing is also presented. Figure6.3(right) shows the corresponding stepheights. ForWsl = 0, indicating a bearing without side lands, the friction lossis more than 20 %higher than the minimum obtainable friction loss of a tilting-pad bearing. The side leakage in thisbearing is high and it does not perform well. When introducing side lands figure 6.3(left) showsthat narrow side lands and a step position close to the trailing edge gives a good performance. Themaximum step position shown in the figure is 0.9 but calculations show that the theoretically bestperformance is obtained forWsl → 0 andLs → Lpad. The good performance of a bearing with verynarrow side lands and the step positioned very close to the trailing edge is purely theoretical. Inpractice the side leakage would be large due to the unevenness of the rotor and if mixed lubricationoccurs during operation the wear of the bearing surface would be large. More realistic values areWsl/Wpad = 0.1 andLs/Lpad = 0.9. With this geometry and the optimal step height of1.96 · hte
a parallel-step bearing has a friction coefficient 17 % lowerthan that of a tilting-pad bearing. Thecurves of figure 6.3(right) show that the optimal step heightdepends strongly on the step positionwhile the variation with the width of the side lands is less significant.
Figure 6.4 presents a study of the sensitivity of a parallel-step bearing to the height of the step.The bearing is of a length-to-width ratio of one, withWsl/Wpad = 0.1 andLs/Lpad = 0.9. Theoptimal step height for minimizing the friction loss is1.96 · hte = 147µm. The area is fixed at the

66 Analysis of Tilting-Pad Bearings with Shallow Recesses
0 50 100 150 20025
30
35
40
45
50
Design value,h
s=147 µm
Qgen
[kW
]
hs [µm]0 50 100 150 200
40
50
60
70
Design value,h
s=147 µm
h min
[µm
]
hs [µm]
Figure 6.4: THD-analysis if a parallel step bearing withWsl/Wpad = 0.1 andLs/Lpad = 0.9. Left:Friction loss as a function of the step height. Right: Minimum oil film thickness as a function of thestep height.
value giving an oil film thickness of 75µm at this step height. The maximum load carrying capacityis achieved at a step height of 135µm, 8 % smaller than the design value. The oil film thickness is75.3µm. As the maximum load carrying capacity is achieved at a lower step height than the designvalue, the bearing is relatively insensitive to moderate wear of the step. At a step height of 73.5µm,50 % lower than the optimal step height, the oil film thicknessis 68.1µm, 9 % less than the designvalue. The friction loss is 10 % higher than the value aths = 1.96 · hte. Further reducing the stepheight reduces the performance more rapidly.
6.3 Rectangular Double Incline Bearing Pads
This section investigates the possibility of designing a tilting-pad bearing with an inlet pocket. Theparallel-step bearing withWsl/Wpad = 0.1 andLs/Lpad = 0.9 is now considered to be equippedwith a spherical pivot at theLpiv−position. To evaluate the influence of thermal effects both isother-mal, THD and TEHD models are used in the analysis.
Figure 6.5 shows the generated friction loss at various pivot locations for inlet pocket depths of20, 60, 100, 140 and 180µm. In all calculations the area of the pad is adjusted to give aminimumoil film thickness of 75µm. Figure 6.5(a) presents isothermal results obtained withat a temperatureof 55 °C. With the chosen pocket geometry the friction loss curves all have minima in the regionLpiv/Lpad = 0.64 to Lpiv/Lpad = 0.66. Choosing a value ofLpiv/Lpad = 0.66 for the design givesgood values of the friction loss at all recess depths. Depending on the pocket depth the friction lossis reduced by up to 12 % in comparison to a bearing with plain pads. This indicates that a tilting-padbearing can be equipped with inlet pockets to improve the performance while still maintaining thequalities which make the tilting-pad bearing superior to the parallel-step bearing: low sensitivityto variations in the operating conditions and to reduction of the pocket depth due to wear. Thereduction in friction is however achieved at the cost of a higher sensitivity to the position of thepivot point. The deeper the pocket the higher the sensitivity as can be seen in the steep rise infriction loss as the pivot point is raised from the value ofLpiv/Lpad = 0.66. Reducing the values

6.3 Rectangular Double Incline Bearing Pads 67
0.60 0.64 0.68 0.7228
30
32
34
36
38
40
42h
s=0 µmh
s=20 µmh
s=60 µm
hs=100 µm
hs=140 µm
hs=180 µm
Lpiv/Lpad [-]
Qgen
[kW
]
(a) Isothermal analysis
0.60 0.64 0.68 0.7228
30
32
34
36
38
40
42h
s=0 µm
hs=20 µm
hs=60 µm
hs=100 µm
hs=140 µm
hs=180 µm
Lpiv/Lpad [-]
(b) THD-analysis
0.60 0.64 0.68 0.7228
30
32
34
36
38
40
42h
s=0 µm
hs=20 µm
hs=60 µm
hs=100 µm
hs=140 µm
hs=180 µm
Lpiv/Lpad [-]
(c) TEHD-analysis
Figure 6.5: Friction loss as a function of the pivot locationLpiv/Lpad for inlet pockets of variousdepth. Figures stating result obtained using isothermal, THD and TEHD models are presented inthe three figures.
of Lpiv to approx.0.645 · Lpad the friction curves forhs = 60 µm andhs = 100 µm rise sharply.Below this value ofLpiv no equilibrium position exists and the bearing does not work. The endof the friction curves indicate the operating conditions for zero tilting angle, i.e. for a parallel-stepbearing. E.g. for a pocket depth of 60µm this operating condition is located atLpiv/Lpad = 0.656and a friction loss of 39.2 kW. At pivot locationsLpiv/Lpad > 0.656 there are two solutions to theequilibrium position of the bearing pad, one at a positive tilting angle as shown in the figure and oneat a negative tilting angle. This phenomenon is studied later in this chapter. Positioning the pivotclose to the smallest possible value ofLpiv/Lpad = 0.646 may result in pad flutter.
Figure 6.5(b) shows the friction losses as calculated usingthe 2-dimensional THD-model. Com-pared to the isothermal analysis the curves move to the left,i.e. the minimum friction loss isachieved at pivot locations closer to the centre of the pad. As shown in chapter 3.1 this is dueto an increased tilting-angle as a function of the viscosityvariation in the sliding direction. For aplain pad the optimum is located atLpiv/Lpad = 0.645 whereas the isothermal analysis predicted anoptimum atLpiv/Lpad = 0.66. Although not very well illustrated by this figure the optimal pocketdepth predicted by the THD-analysis is larger than in the isothermal analysis. For a parallel-stepbearing the optimal pocket depth predicted by the THD-analysis is1.96 · hte = 147 µm as shown infigure 6.4. A similar isothermal analysis indicateshs,optimal = 1.76 · hte.
Figure 6.5(c) shows the results when pressure bending and thermal crowning of the pad are in-

68 Analysis of Tilting-Pad Bearings with Shallow Recesses
0.64 0.66 0.68 0.70 0.7233
34
35
36
37
38
39
40
41h
s=0 µm
hs=140 µm
hs=60 µm
Lpiv/Lpad [-]
Qgen
[kW
]
0.64 0.66 0.68 0.70 0.7240
50
60
70
80
90
100
hs=0 µm
hs=140 µm
hs=60 µm
Lpiv/Lpad [-]
h min
[µm
]
0.64 0.66 0.68 0.70 0.72−1
0
1
2
3
4
5
6
7
8h
s=0 µm
hs=140 µm
hs=60 µm
Lpiv/Lpad [-]
h le/h
te-1
[-]
Figure 6.6: Isothermal analysis of a bearing of fixed area without inlet pocket and with pocket withdepths ofhs = 60 µm andhs = 140 µm. Results are given as functions of the pivot locationLpiv/Lpad. Left: Friction loss. Middle: Minimum oil film thickness. Right: Oil film convergenceratio. Full lines indicate solutions with a positive tilting angle. Dotted lines indicate solutions witha negative tilting angle.
cluded in the analysis. The optimal pivot locations move toward the centre of the pad in comparisonto the results for a rigid pad. The optima of the curves are located betweenLpiv/Lpad = 0.62 andLpiv/Lpad = 0.64. As was also noted in chapter 5 the bearing is less sensitive to the position of thepivot due to the curvature of the pad.
Figure 6.6 shows an isothermal study in which the pad areas ofthree different pads is keptconstant at the value resulting in a minimum oil film thickness of 75µm atLpiv/Lpad = 0.66 for abearing without a pocket. As earlier stated for pads with inlet pockets there are two solutions to thepressure distribution which for a given pivot location results in force and moment equilibrium at thepivot point. In the figures both solutions with positive tilting angles(full lines) as well as solutionswith negative tilting angles(dotted lines) are presented.
Figure 6.6(left) shows the reduction in friction when modifying the plain bearing with an inletpocket ofWsl/Wpad = 0.1 andLs/Lpad = 0.9 and pocket depths of 60µm and 140µm. Introducingan inlet pocket reduces the friction as well as increasing the oil film thickness as shown in figure6.6(middle). A shallow inlet pocket results in reduced friction and higher minimum film thicknessfor large ranges of pivot positions. Deeper pockets gives larger improvements in the performancein small intervals of pivot locations. The bearing with the deeper pocket does however not performwell at for instance a pivot location ofLpiv/Lpad = 0.70 where the friction loss is higher and theoil film thickness is smaller than those of the plain pad. Figure 6.6(right) shows the convergence

6.4 Double Incline Tilting-Pad Thrust Bearings 69
U
+
rmean
r piv
r 1
θpiv
θs
θ0
Wsl Wsl
Wpad
Figure 6.7: The sector shaped bearing pad considered.
ratio of the pads. When introducing inlet pockets of the chosen dimensions the convergence ratio isreduced. AtLpiv/Lpad = 0.66 the ratio is 3 for a plain bearing pad while it is approx. 1.5 for thebearing pads with pockets.
The solutions for the pressure distribution obtained with negative tilting angles show muchhigher friction losses than with positive tilting angles. Only the friction loss forhs = 140 µmcan be seen in the figure. It rises sharply with increasingly negative tilting angle. This is due to arapidly declining minimum oil film thickness.
6.4 Double Incline Tilting-Pad Thrust Bearings
In this section of the report the analysis previously performed on rectangular pads is extended to thestudy of multi-pad bearings with sector shaped pads.
A tilting-pad thrust bearing with 8 pads of a length-to-width ratio of 0.9 is studied. The meanradius is 0.8 m. The pads have a thickness of 0.3 m. The rotor temperature is 55 °C, the oil bathtemperature is 40 °C and the leading edge temperature to eachpad is determined from a controlvolume analysis of heat transfer in the groove between the pads. The speed is 400 rpm and thebearing carries a load of 5.0 MN. The numerical model adjuststhe bearing surface area to achievea minimum oil film thickness of 75µm. Figure 6.7 illustrates the bearing. In all calculationsWsl/Wpad = 0.1.
In table 6.1 a grid convergence study is shown. A plain bearing and a bearing with a 60µminlet pocket withθs/θ0 = 0.8 are studied. For the plain pad values of friction loss, maximum oilfilm thickness, maximum oil temperature and pad surface areaconverge monotonously. For the pad

70 Analysis of Tilting-Pad Bearings with Shallow Recesses
No. control volumes 25× 25 50× 50 100× 100 200× 200Plain bearing pad (no pocket)
Qgen [kW] 272.89 274.31 274.72 274.83hmax [µm] 317.13 320.51 321.34 321.51Tmax [°C] 61.73 61.54 61.48 61.45Pad Area [m2] 1.6283 1.6362 1.6377 1.6378
Bearing pad with 60µm recessQgen [kW] 254.61 251.89 252.97 253.54hmax [µm] 252.96 250.34 244.98 242.02Tmax [°C] 65.07 63.90 64.21 64.41Pad Area [m2] 1.4585 1.4307 1.4309 1.4313
Table 6.1: Grid convergence study:Qgen is the shear work at the collar surface.hmax is the max-imum oil film thickness andTmax is the maximum temperature in the oil film. In all calculations :hmin = 75.00 µm.
with an inlet pocket the stated parameters converge monotonously only from a grid size of 50×50control volumes. With 25×25 control volumes the boundaries of the pocket are not located at thecontrol volume interfaces and this induces differences in the results compared to the larger grids.The results of the plain bearing converge faster for increasing grid size than when a pocket is presentin the surfaces of the pads. The friction loss at 50×50 control volumes is in both cases within 1 %and the value of pad area within 0.1 % of the values at 200×200 control volumes. A grid of 50×50control volumes is used in the calculations which follow.
Figure 6.8 shows the power loss as a function of the pivot position for various pocket depths andstep positions. The pivot point is placed at the mean radius.The end of the power loss curves fordeclining nondimensional pivot locations indicate pad convergence ratios close to zero. Lower pivotlocations result in cavitation and a steep rise in the friction loss. The numerical calculations of thesecases are generally numerically instable and the solutionsare therefore not stated in the figures.The end of the curves (e.g. figure 6.8(b), 100µm and 140µm ) indicate close to the minimumfriction loss with the respective pocket depths. The deviation from the minimum obtainable valuesof friction loss is estimated to be within 0.5 % in all the calculations.
Figure 6.8(a) shows the friction loss forθs/θ0 = 0.9, i.e. dimensions of the pocket whichare similar to those of the rectangular pad studied in the previous section. The minima of thepower loss curves are positioned at higherθpiv/θ0-values for higher pocket depths. Positioning thepivot at θpiv/θ0 = 0.61, which is the optimum location for a pad without a recess willcause anon functioning bearing if inlet pockets are machined in thepad surfaces. Smaller friction lossesand lower optimalθpiv/θ0-values are achieved withθs/θ0 = 0.85 as shown in figure 6.8(b). Theminima of the friction loss curves are located at almost the same nondimensional pivot location(0.61−0.62). Figure 6.8(c) presents results withθs/θ0 = 0.8. The minima of the power loss curvesare positioned at lowerθpiv/θ0-values for higher pocket depths. Small values of friction and stableoperating conditions at all values of the pocket depth can beachieved by positioning the pivot atθpiv/θ0 = 0.61. At this pivot location the reduction in the friction loss isup to 8 % for the chosen

6.4 Double Incline Tilting-Pad Thrust Bearings 71
0.56 0.60 0.64 0.68240
250
260
270
280
290
300h
s=0 µmh
s=20 µm
hs=140 µmh
s=60 µmh
s=100 µm
θpiv/θ0 [-]
Qgen
[kW
]
(a) θs = 0.90 · θ0
0.56 0.60 0.64 0.68240
250
260
270
280
290
300h
s=0 µmh
s=20 µm
hs=140 µmh
s=60 µm
hs=100 µm
θpiv/θ0 [-]
(b) θs = 0.85 · θ0
0.56 0.60 0.64 0.68240
250
260
270
280
290
300h
s=0 µmh
s=20 µm
hs=100 µmh
s=60 µmh
s=140 µm
θpiv/θ0 [-]
(c) θs = 0.80 · θ0
Figure 6.8: Friction loss as a function of the pivot locationθpiv/θ0 for inlet pockets of variousdepth. The figures state result obtained using TEHD modelling with θs/θ0 = 0.90, 0.85 and0.80.rpiv = 0.8 m
pocket depths, compared to using plain bearing pads.As discussed in chapter 5 a tilting-pad thrust bearing showssuperior performance if the radial
positions of the pivot points are adjusted so that the bearing shows no radial tilt at the trailingedges of the pads. Figure 6.9 presents friction loss curves in which this condition is imposed.The achievable friction reduction by the use of inlet pockets is in the region of 16−17 % for allinvestigated values ofθs. The closer the step is to the trailing edge the higher is the pocket depthgiving a minimal friction coefficient. This was also the casefor the rectangular parallel-step bearingsstudied in figure 6.3. Withθs/θ0 = 0.8 and a pivot position ofθpiv/θ0 = 0.61 the bearing operatesin the stable region at all pocket depths and the reduction inthe friction loss is up to 12 % for thechosen pocket depths, compared to using a plain bearing pad.
Figure 6.10 show the distributions of oil film thickness, pressure and temperature for bearingswith θs/θ0 = 0.8, θpiv/θ0 = 0.61 and pocket depths of 60µm and 140µm. The minimum oil filmthickness in both cases is 75µm. The bearing with a 140µm pocket is 17 % larger (1.68 m2) thanthe bearing with a 60µm pocket (1.43 m2). However, due to the higher mean oil film thicknessthe friction loss is only 0.7 % higher. The bearing with the deep pocket has a higher convergenceratio and due to the larger area the maximum pressure is lower. The maximum temperatures arenot significantly affected by the pockets. In a bearing without pockets it is calculated to be 61.6 °C.With a 140µm pocket it is 60.4 °C while it is 63.9 °C with a 60µm pocket.

72 Analysis of Tilting-Pad Bearings with Shallow Recesses
0.56 0.60 0.64 0.68220
230
240
250
260
270
280
290
300
hs=0 µmh
s=20 µm
hs=140 µm
hs=100 µm
hs=60 µm
θpiv/θ0 [-]
Qgen
[kW
]
(a) θs = 0.90 · θ0
0.56 0.60 0.64 0.68220
230
240
250
260
270
280
290
300
hs=0 µmh
s=20 µm
hs=140 µm
hs=100 µm
hs=60 µm
θpiv/θ0 [-]
(b) θs = 0.85 · θ0
0.56 0.60 0.64 0.68220
230
240
250
260
270
280
290
300
hs=0 µmh
s=20 µm
hs=140 µm
hs=100 µmh
s=60 µm
θpiv/θ0 [-]
(c) θs = 0.80 · θ0
Figure 6.9: Friction loss as a function of the pivot locationθpiv/θ0 for inlet pockets of various depth.The figures state result obtained using TEHD modelling withθs/θ0 = 0.90, 0.85 and0.80. rpiv isadjusted to achieve zero radial pivoting at the trailing edge.
The friction reductions of figure 6.8 are smaller than those of figure 6.9 because the optimalradial position of the pivot is located at higher offsets from the mean radius when inlet pockets arepresent in the bearing than when no inlet pockets are present. This is seen in figure 6.11 whichpresents a study of the behaviour of bearings with pocket depths of hs = 0 µm, hs = 60 µmandhs = 140 µm when the radial position of the pivot is adjusted. The bearing surface area isdimensioned to give a minimum oil film thickness of 75µm for a plain pad with the pivot locatedat the mean radius and atθpiv/θ0 = 0.61. The radial position of the pivot giving the highest oilfilm thickness is located further towards the outer radius for higher pocket depths. In the plain padit is located at the radial nondimensional position: 0.515.With the shallow pocket it is located at0.525 and with the deep pocket at 0.535. For all the radial pivot positions illustrated in the figurethe bearing with the 60µm-pocket performs better than the plain pad, i. e. the oil filmthicknessis higher and the friction loss is lower. The 140µm-pocket has a better performance than boththe other bearings in a small interval of radial pivot positions. The bearing however rapidly loosesthickness of the oil film as the pivot is moved away from the optimum value. The radial tiltingstability of this bearing is lower than in a standard tilting-pad thrust bearing. The radial tilting canbe controlled by using different values ofWsl at the inner and outer radius.

6.4 Double Incline Tilting-Pad Thrust Bearings 73
80
150 160
170180
190 200
210220
230240
Lines of constantfilm thickness [µm]
33032
0
310
300
290
280
270
260
250
240
230
80
Lines of constantfilm thickness [µm]
9 8
7 6
5 4
32
1
Lines of constantpressure [MPa]
7 6
5 4
3 2
1
Lines of constantpressure [MPa]
6260
58 56
5452
5048
46
44
Lines of constanttemperature [oC]
5856
54
52 50
4846
44
42
Lines of constanttemperature [oC]
Figure 6.10: Simulation results with a 60µm (left) and a 140µm (right) pocket. From top to bottom:oil film thickness, pressure and oil temperature.

74 Analysis of Tilting-Pad Bearings with Shallow Recesses
0.42 0.46 0.50 0.54 0.58 0.6230
40
50
60
70
80
90
100
Wpiv/Wpad [-]
h min
[µm
]
0.42 0.46 0.50 0.54 0.58 0.62260
265
270
275
280
285h
s=0 µm
hs=60 µm
hs=140 µm
Wpiv/Wpad [-]
Qgen
[kW
]
Figure 6.11: Radial stability analysis of bearings ofhs = 0 µm, hs = 60 µm andhs = 140 µm.Left: oil film thickness as a function of the radial pivot position. Right: Friction loss as a functionof the radial pivot position. Due to failing convergence of the numerical calculations the curves forhs = 140 µm do not cover the full interval of pivot locations.
6.5 Conclusion
Parallel-step bearings theoretically have smaller friction coefficients than tilting-pad bearings. 1-and 2-dimensional studies predict friction coefficients 13-17 % lower than those obtainable intilting-pad bearings. Parallel-step bearings however suffer from the disadvantage that they do notperform well at varying operating conditions. This also implies that the performance is reduced asthe step wears down. This chapter studies the feasibility ofcombining the two types of bearings inorder to benefit from the advantages of both.
Significant performance improvements are possible by designing bearings with inlet pockets orby modifying existing bearings. By combining the features of parallel-step bearings and tilting-padbearings it is possible to reduce the friction coefficient by10-15 %. The step can be positioned togive small friction losses and stable operating conditionsat all pocket depths from zero up to thedesign value. Thereby the bearing is tolerant to wear of the pad surfaces.
The reduction in friction is achieved at the cost of a higher sensitivity to correct circumferentialpositioning of the pivot. The correct position depends strongly on the thermal conditions of thebearing and the amount of thermal crowning of the pads. Positioning the pivot too close to thecentre of the pad causes the bearing to entirely loose its load carrying capacity while positioning thepivot too far towards the trailing edge results in a smaller oil film thickness than would be achievedwith plain bearing pads. An example thrust bearing has shownan interval ofθpiv/θ0ǫ[0.59; 0.66] inwhich the bearing performs superior to a standard bearing. Due to the relatively small interval inwhich a good performance is achieved and the danger of positioning the pivot in a position in whichthe bearing will not work the design of bearings based on thisprinciple is not trivial.

Chapter 7
Analysis of Tilting-Pad Bearings with DeepRecesses
The results of chapter 5 showed reductions in the generated friction when oil injection pockets aremachined in the surfaces of the pads. The reductions were however small and required relocationof the pivot point.
This chapter further investigates the influence of equipping the surfaces of tilting-pad thrustbearings pads with deep recesses . The 3-dimensional TEHD model is used. In deep recesses (oneor more orders of magnitude deeper than the oil film thickness) there is recirculation and no positiveeffect on the pressure build up. The pressure distribution is therefore scalable with the Sommerfeldnumber and the design suggestions stated in this chapter of the report are generally applicable atall operating conditions - with the reservation that the influence of thermal effects vary with theoperating conditions. Due to the large depth the shear stress at the collar surface is small inside therecess area. Thus, the purpose of the recess is to create a high-pressure and low friction zone.
In the volume of a deep recess, the reductions of the flow equations leading to the Reynoldsequation are not strictly valid. In particular, the assumption of inertialess flow seems unreasonable.The recirculation flow accelerates the oil entering the recess causing an inertial pressure drop at therecess leading edge. At the trailing edge of the recess, the oil is stagnated leading to an inertialpressure rise. In tilting-pad bearings with recesses, thismay cause a smaller tilting angle than theone predicted by using the Reynolds equation. In conventional bearings effects of inertia in thegroove between the pads lead to an inlet pressure build-up atthe leading edge. In large and slowspeed tilting-pad bearings the inlet pressure build-up is usually negligible indicating that, for suchbearings, the effect of inertia on the pressure in a recess isalso likely to be small. In sector shapedbearing pads the centrifugal term may cause a shift of the pressure maximum towards the outerradius resulting in a radial tilt of the pad. Shinkle & Hornung (1965) showed the recess flow to beturbulent atRe = ρUhp/µ > 1.0 · 103. For some of the recess geometries and velocities used inthis report, turbulence is to be expected. The function of a deep recess is to create a low frictionzone. When inertial end effects in the recess are negligible, the pressure inside it is close to constantregardless of whether the flow is laminar or turbulent. Although the use of the Reynolds equationinside the recess is not strictly valid, the inaccuracies arising from using this equation in a laminarformulation are therefore small. Determining the frictionloss in the recess poses a more delicateproblem. The friction loss in the bearing is calculated fromthe shear stress at the collar surface.
75

76 Analysis of Tilting-Pad Bearings with Deep Recesses
10 mm 5 mm 5 mm
2 µm
1 µm
hp
U
20
mm
10
mm
5 mm
L1 10 mm
20 mm
U
Figure 7.1: Left: The bearing pad used in Brajdic-Mitidieriet al. (2005) for the 1-dimensionalanalysis. Right: The bearing pad used for the 2-dimensionalanalysis. The recess is 20µm deep.
Due to the thick oil film in the recess, the friction is small inthis area when the flow is laminar andinaccuracies have a negligible influence on the calculationof the total friction loss. In turbulent flowrecesses, the friction is larger and may significantly influence the total friction loss. Based on thework by Shinkle & Hornung (1965) the inaccuracy on the recessand total friction loss is analysedlater in this chapter of the report.
The main contribution of this part of the report is related tothe study of the influence of equip-ping tilting-pad bearings with deep recesses in the high-pressure region. It is shown that a signifi-cant reduction of the friction loss is possible compared to conventional tilting-pad bearings and it isshown that recesses placed in the high-pressure region can be used for high-pressure jacking.
7.1 Comparison to CFD-Model Results
In an isothermal study, using a CFD-code Brajdic-Mitidieriet al. (2005) investigated the effect ofequipping fixed incline bearings with recesses. They found that the friction factorη = Friction/Loadwas significantly reduced when a recesses was placed in the high-pressure region. They presentedtheoretical results for the 1- and 2-dimensional bearings shown in figure 7.1. The bearings operateat a speed of 1 m/s, a viscosity of 10−5 m2/s and a density of 1000 kg/m3. In both cases the leadingedge oil film thickness ishle = 2 µm while the trailing edge thickness ishte = 1 µm. In tables 7.1and 7.2 their results are compared to results obtained with the Reynolds equation based model usedin this report. In the 1-dimensional modelnx × nz = 200 × 10 control volumes are used. In the2-dimensional modelnx×ny×nz = 100×100×10 uniformly distributed control volumes are used.Increasing the number of control volumes does not change thevalues ofηhp
/η0 stated in the tableson the three decimals given. In both the 1-dimensional and 2-dimensional cases, the calculations byBrajdic-Mitidieri et al. show higher friction reductions by the use of recesses than the calculationsusing the Reynolds equation. The results are however, within 10 % difference and the trends in thecalculations are the same suggesting that the analysis of problems of this nature can be performedusing the Reynolds equation. It should be noted that the chosen speed and fluid film thickness are

7.2 Analysis of Tilting-Pad Thrust Bearing 77
hp Load Friction Friction ηhp/η0
[µm] [kN/m] [kN/m] coef.η · 104
Bra Rey Bra Rey Bra Rey Bra Rey0 634 636 0.153 0.155 2.42 2.43 1 15 619 626 0.139 0.141 2.25 2.25 0.926 0.92410 613 622 0.126 0.133 2.06 2.13 0.845 0.87820 611 612 0.115 0.126 1.89 2.04 0.779 0.83830 611 620 0.113 0.124 1.85 2.00 0.762 0.82240 610 620 0.113 0.122 1.84 1.97 0.759 0.812
Table 7.1: Comparison of results for the 1-dimensional analysis presented by Brajdic-Mitidieri etal. (2005)(Bra) and results obtained using the Reynolds equation(Rey). Results are presented forvarious recess depths hp.
L1 Load Friction Friction ηhp/η0
[mm] [kN/m] [kN/m] coef.η · 104
Bra Rey Bra Rey Bra Rey Bra Reyn/p 276 277 0.150 0.145 5.44 5.24 1 15.0 220 227 0.119 0.119 5.40 5.26 0.992 1.0047.5 242 248 0.116 0.116 4.81 4.69 0.884 0.8968.0 241 247 0.113 0.116 4.79 4.69 0.881 0.8958.5 235 239 0.115 0.115 4.88 4.79 0.896 0.915
Table 7.2: Comparison of results for the 2-dimensional analysis presented by Brajdic-Mitidieri etal. (2005)(Bra) and results obtained using the Reynolds equation(Rey). Results are presented forvarious recess positions L1 (See figure 7.1). n/p indicates a pad without a recess.
small. Effects of inertia become more important with increasing Reynolds number. The Reynoldsequation based model may therefore be less accurate at operating conditions usual for thick filmbearings. The 1-dimensional analysis shows a reduction of the friction coefficient of approx. 20 %while the 2-dimensional analysis shows a reduction of approx. 10 %. These results are obtainedusing a fixed convergence ratiohle/hte = 2 which is not optimized for achieving a minimum frictioncoefficient. In the 2-dimensional casehle/hte = 3µm/1µm = 3 is a more optimal convergence ratioleading toη = 4.54 · 10−4 for a non-recessed bearing. This is 3 % less than the minimum valuestated in table 7.2.
7.2 Analysis of Tilting-Pad Thrust Bearing
In the following, the effect of equipping the surfaces of tilting-pad thrust bearings with recesses isanalysed and design suggestions minimizing the friction loss are stated.
In order to isolate the effects leading to improved performance the problem is investigated using

78 Analysis of Tilting-Pad Bearings with Deep Recesses
12× 12× 24× 24× 48× 48× 96× 96×(5 + 5) (10 + 10) (20 + 20) (40 + 40)Plain bearing pad (8-pad bearing) - (TEHD)
Qgen [kW] 266.39 276.32 279.26 280.02Qout [kW] 274.95 280.46 281.24 281.09hmin [µm] 75.00 75.00 75.00 75.00Tmax [°C] 81.80 80.52 78.53 77.69
Recessed bearing pad (8-pad bear.) - (TEHD)Qgen [kW] 215.69 231.56 236.42 237.17Qout [kW] 532.42 275.59 241.09 235.43hmin [µm] 75.00 75.00 75.00 75.00Tmax [°C] 91.16 76.85 74.76 74.32
Table 7.3: Grid convergence study:Qgen is the shear work at the collar surface .Qout represents thesum of all heat flows out of the computational domain.hmin is the minimum oil film thickness andTmax is the maximum temperature in the oil film.
increasingly complex modelling. 1-dimensional modellingshows the potential in reducing friction.Isothermal and 3-dimensional modelling of a rectangular bearing pad documents the influence offinite width, temperature and thermal bending. Finally, modelling of a thrust bearing with sectorshaped pads verifies that the method is applicable to real bearings and an analysis of start-up be-haviour including hydrostatic jacking shows that recessesplaced in the high-pressure region can beused as oil injection pockets as well as for reducing the power loss.
Calculations are carried out on example bearings of large dimensions typical for the use inhydro power plants. In all calculations, the bearings are assumed to operate using a VG32 mineraloil under fully flooded conditions. The data for the oil are:µ40oC = 27.1 mPas,µ80oC = 6.8 mPas,ρ = 848 kg/m3, c = 2090 J/kg/K, k = 0.13 W/m/K. The recess depth is 4 mm corresponding to53hmin.
Table 7.3 shows a grid convergence study performed on a sector shaped 8-pad bearing. Resultsare stated for bearings both with and without a recess covering approx. 18 % of the pad area. For afixed minimum oil film thickness and variable pad area, the topstudy shows the convergence of fric-tion loss, total heat loss, minimum oil film thickness and maximum temperature for a non-recessedpad. The heat loss converges towards the generated shear work, Qgen which is the parameter usedthroughout this chapter of the report for the friction loss.The bottom study shows the convergenceof the calculations of the recessed pad. They converge much more slowly with increasing grid size.At the grid size used throughout this chapter:nr × nθ × (nz + nzpad
) = 24 × 24 × (10 + 10) theheat loss is 19 % higher than the generated friction loss. At larger grid sizes, the values convergetowards each other.Qgen for the grid of24× 24× (10 + 10) control volumes is within 2.5 % of thevalue obtained using96× 96× (40 + 40) control volumes. For comparing friction losses betweenrecessed and non-recessed pads this is a reasonable accuracy on the generated friction.
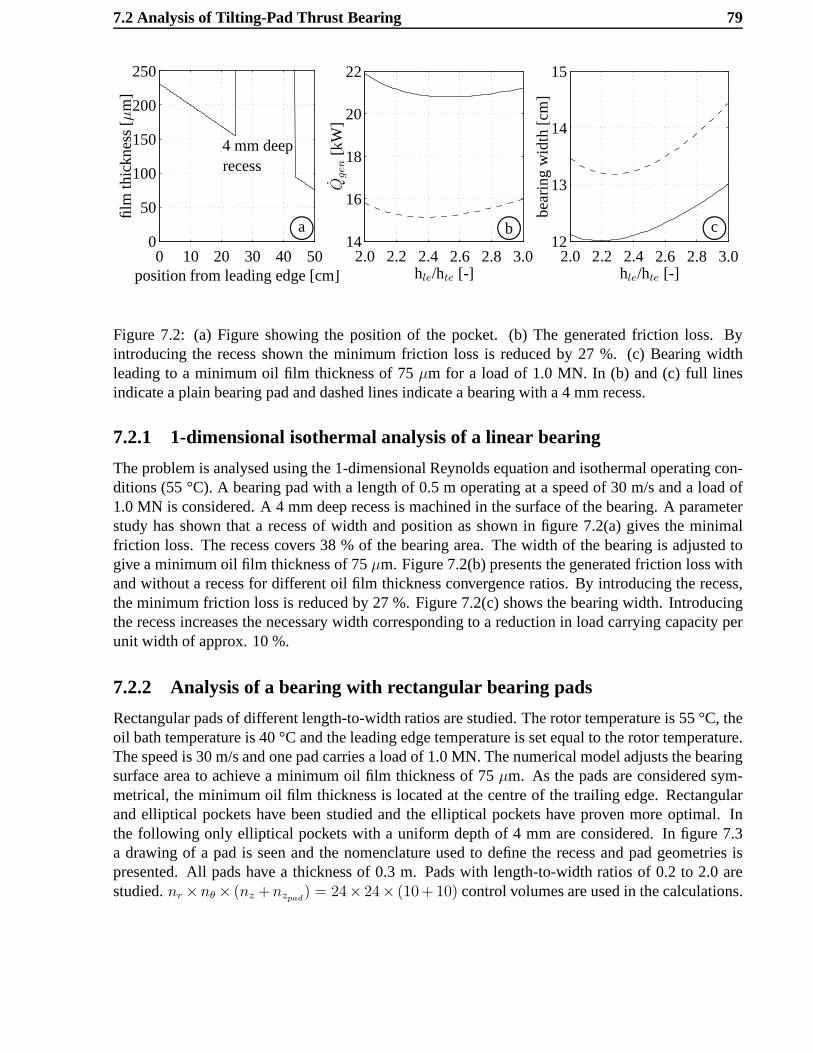
7.2 Analysis of Tilting-Pad Thrust Bearing 79
film
thic
knes
s[µm
]
position from leading edge [cm]
4 mm deeprecess
0 10 20 30 40 500
50
100
150
200
250
Qgen
[kW
]
hle/hte [-]2.0 2.2 2.4 2.6 2.8 3.0
14
16
18
20
22
hle/hte [-]
bea
ring
wid
th[c
m]
2.0 2.2 2.4 2.6 2.8 3.012
13
14
15
bc bc bca b c
Figure 7.2: (a) Figure showing the position of the pocket. (b) The generated friction loss. Byintroducing the recess shown the minimum friction loss is reduced by 27 %. (c) Bearing widthleading to a minimum oil film thickness of 75µm for a load of 1.0 MN. In (b) and (c) full linesindicate a plain bearing pad and dashed lines indicate a bearing with a 4 mm recess.
7.2.1 1-dimensional isothermal analysis of a linear bearing
The problem is analysed using the 1-dimensional Reynolds equation and isothermal operating con-ditions (55 °C). A bearing pad with a length of 0.5 m operatingat a speed of 30 m/s and a load of1.0 MN is considered. A 4 mm deep recess is machined in the surface of the bearing. A parameterstudy has shown that a recess of width and position as shown infigure 7.2(a) gives the minimalfriction loss. The recess covers 38 % of the bearing area. Thewidth of the bearing is adjusted togive a minimum oil film thickness of 75µm. Figure 7.2(b) presents the generated friction loss withand without a recess for different oil film thickness convergence ratios. By introducing the recess,the minimum friction loss is reduced by 27 %. Figure 7.2(c) shows the bearing width. Introducingthe recess increases the necessary width corresponding to areduction in load carrying capacity perunit width of approx. 10 %.
7.2.2 Analysis of a bearing with rectangular bearing pads
Rectangular pads of different length-to-width ratios are studied. The rotor temperature is 55 °C, theoil bath temperature is 40 °C and the leading edge temperature is set equal to the rotor temperature.The speed is 30 m/s and one pad carries a load of 1.0 MN. The numerical model adjusts the bearingsurface area to achieve a minimum oil film thickness of 75µm. As the pads are considered sym-metrical, the minimum oil film thickness is located at the centre of the trailing edge. Rectangularand elliptical pockets have been studied and the ellipticalpockets have proven more optimal. Inthe following only elliptical pockets with a uniform depth of 4 mm are considered. In figure 7.3a drawing of a pad is seen and the nomenclature used to define the recess and pad geometries ispresented. All pads have a thickness of 0.3 m. Pads with length-to-width ratios of 0.2 to 2.0 arestudied.nr×nθ× (nz +nzpad
) = 24× 24× (10+10) control volumes are used in the calculations.

80 Analysis of Tilting-Pad Bearings with Deep Recesses
Lpad
Lrecess
Lend Wpad
Wrecess
0.5·Wpad
+
Lpiv
U
Figure 7.3: Drawing of a rectangular pad with a recess.Lpad andWpad define the pad length andwidth. Lpiv denotes the distance of the spherical pivot from the leadingedge of the pad.Lrecess andWrecess denote the minor and major axis of the elliptical recess andLend defines the position of therecess relative to the trailing edge.
An isothermal parameter study has determined optimal values of Lrecess andLend as stated infigure 7.4(a), whileWrecess = 0.78 ·Wpad is a good value for the recess width at all length-to-widthratios. With these values, the optimal positions of the pivot point for pads with and without recessesare shown in figure 7.4(b). The positions are given for isothermal (ISO) calculations, thermo-hydrodynamic (THD) calculations not including the bendingof the bearing pad and for thermo-elasto-hydrodynamic (TEHD) calculations including bending. The pads, which are considered,are of large sizes where thermal bending has a significant influence on the oil film thickness. Insmaller bearings, thermal bending has a smaller influence. For most bearing dimensions the optimalposition of the pivot is therefore located between the positions suggested by the THD- and theTEHD-analysis. For recessed pads with small or no thermal deformation, the isothermal analysesdetermine optimal pivot positions close to those suggestedby THD-analyses. For conventionalbearing pads, isothermal analyses are less accurate. In figure 7.4(c) two sets of curves are shown.The curves marked with (I) represent the percentage increase in the pad surface area with a recess inthe pad surface relative to the area of a pad without a recess.The curves marked with (II) representthe area of the recess relative to the area of a pad without a recess. In the THD-analyses the increasein total pad areaLpad · Wpad when introducing recesses in the surfaces is much smaller than therecess areas. Following the design suggestions given in figure 7.4(a)−(b), the pad areas shouldbe increased by approximately 10−15 % relative to the areas of pads without recesses in order toachieve the same minimum oil film thickness. When pad bendingis included, this result is morecomplex. At small and large length-to-width ratios, the mean pad bending is large as can be seen infigure 7.4(d). Due to larger pad areas, the recessed pads experience larger thermal bending and thisreduces the load carrying capacity. In figure 7.4(e) the power consumption is shown. The THD-analysis indicates that a length-to-width ratio of approx.0.6 is optimal for a recessed bearing pad.

7.2 Analysis of Tilting-Pad Thrust Bearing 81
0.2
0.3
0.4
0.5
0.6
0.01
0.02
0.03
0.04
0.05
replacements
LendLpad
LrecessLpad
Lend/L
pad
[-]
Lrecess/L
pad
[-]
0.56
0.58
0.60
0.62
0.64
0.66
0.68
0.70
0.72
0.74
0.76 No recess − ISONo recess − THDNo recess − TEHDRecess − ISORecess − THDRecess − TEHD
piv
otl
oca
tion
,Lpiv
/Lpad
[-]
0
20
40
60
80
100
120
140
160 Without recessWith recess
Mea
np
add
eflec
tion
w[µm
]
0
5
10
15
20
25
30
35
40
45
(I)
(II)
Isothermal analysisTHD − analysisTEHD − analysis
Co
mp
aris
on
ofa
reas
[%]
0.2 0.4 0.6 0.8 1.0 1.2 1.4 1.6 1.8 26 28 30 32 34 36 38 40 42 44 46 48 50 No recess − ISO
No recess − THDNo recess − TEHDRecess − ISORecess − THDRecess − TEHD
length-to-width ratio, Lpad/Wpad [-]
Fric
tion
loss
[kW
]
0.2 0.4 0.6 0.8 1.0 1.2 1.4 1.6 1.8 8
10
12
14
16
18
20
22
24
Isothermal analysisTHD − analysisTEHD − analysis
length-to-width ratio, Lpad/Wpad [-]
Red
uct
ion
infr
ictio
nlo
ss[%
]
Figure 7.4: (a) and (b) state design parameters defining the recess geometry and the pivot positionfor rectangular pads. The values are chosen to minimize the friction loss. In (c) two sets of curvesare shown. The curves marked with (I) represent the percentage increase in the pad surface areawith a recess in the pad surface relative to the area of a pad without a recess. The curves markedwith (II) represent the area of the recess relative to the area of a pad without a recess. (d) showsvalues of thermal bending, (c) states the friction loss and (d) the reduction in friction for recessedbearing pads relative to non recessed pads.
bc bc
bc bc
bc bc
e f
c d
a b

82 Analysis of Tilting-Pad Bearings with Deep Recesses
0.50 0.55 0.60 0.65 0.70 0.75
30
35
40
45
50Without recess
With recess
ISOTHDTEHD
Fric
tion
loss
[kW
]
pivot location, Lpiv/Lpad[-]0.50 0.55 0.60 0.65 0.70 0.75
30
35
40
45
50Isothermal analysisW
recess=0.78⋅W
pad, L
end=0.026⋅L
pad
No pocket
Lrecess
=0.53⋅Lpad
Lrecess
=0.40⋅Lpad
Lrecess
=0.25⋅Lpad
Lrecess
=0.15⋅Lpad
pivot location, Lpiv/Lpad[-]
Figure 7.5: Left: Friction loss as a function of pivot position. Right: Isothermal analysis showingthe influence of the length of the recess on the friction loss.
The value is approx. 0.8 for a non-recessed pad. With pad bending included larger ratios give goodresults. At low length-to-width ratios, the bending of the pad in the direction perpendicular to thesliding direction is very large. In a non-recessed bearing,this leads to a higher pressure-maximumthan when there is no thermal bending. In the recessed bearing, the area of maximum pressurestretches radially into areas of large film thickness leading to a large amount of side leakage. Forlow length-to-width ratios, the recessed pads therefore donot perform well. Figure 7.4(f) statesthe percentage reduction in friction loss when using recessed pads - compared to bearings withplain pads. With small length-to-width ratios, the improvement in performance is close to the 27 %obtained in the 1-dimensional analysis for an infinitely wide slider bearing. As the length-to-widthratio increases, the improvement is less significant.
Figure 7.5 shows a study of the influence of the pivot locationon the friction loss of the bearingwith a length-to-width ratio of 1.0. In figure 7.5(left) it isseen that the optimum is more clearlydefined when a recess with the suggested dimensions is machined in the pad surface. It is thereforeimportant to place the pivot point correctly in order to achieve an energy saving. Figure 7.5(right)shows an isothermal analysis of the influence of the recess length. For decreasing recess size, theoptimum becomes more flat and the bearing is therefore less sensitive to incorrect positioning ofthe pivot point. This improvement in behaviour is a trade offagainst a larger friction loss. Inall the examples studied in figure 7.5(right) the position ofthe recess is chosen so thatLend =0.026 · Lpad. This has proven to be a good strategy when trying to make the bearing less sensitiveto pivot positioning while still obtaining a relatively small friction loss. However, as seen in figure7.5(right) the optimal position of the pivot point moves in the direction of the trailing edge as therecess size decreases. The suggestions for positioning of the pivot point given in figure 7.4(b) aretherefore only valid for the recess lengths given in figure 7.4(a). With the size suggested in figure7.4 (Lrecess = 0.53 · Lpad), the value is 0.615 while it is 0.68 for a pad withLrecess = 0.15 · Lpad.

7.2 Analysis of Tilting-Pad Thrust Bearing 83
U
++
rmean
r piv
r 1
θpiv
θrecess
θ0
Figure 7.6: The sector shaped bearing pad considered. The recess size and position are defined byequation 7.1.
7.2.3 3-dimensional analysis of tilting pad thrust bearing
Tilting-pad thrust bearings with 4, 5, 6, 8, 12 and 18 pads arestudied. The mean radius is 0.8 m.The widths of the bearings vary from 0.55 m to 0.65 m dependingon the number of pads. Theangular extend of all pads in a bearing is 280−320°. All pads have a thickness of 0.3 m. The rotortemperature is 55°C and the oil bath temperature is 40°C. Theleading edge temperature to eachpad is determined from a control volume analysis of heat transfer in the groove between the padsas described in Heinrichson et al. (2006). The speed is 400 rpm and the bearings carry loads of 5.0MN. The numerical model adjusts the bearing surface area andthe radial position of the pivot pointto achieve a minimum oil film thickness of 75µm at the centre of the trailing edge. As discussedlater in this chapter, positioning the pivot at the mean radius does not yield good results for padswith recesses as it may result in significant radial tilting of the pads. Therefore, this restriction isintroduced on the pivot position. The sizes and positions ofthe recesses are as stated in figure 7.4(a)for rectangular bearing pads. A drawing of a sector shaped pad is seen in figure 7.6. The ellipticalrecess is stretched with the circumferential length of the pad and the recess circumference is givenby the equation:
(r · cos[θ − θrecess]− rmean)2
(Wrecess/2)2+
(r · sin[θ − θrecess])2
(Lrecess/2)2 · r/rmean
= 1 (7.1)
whereθrecess is the angular centre of the recess determined so thatLend as given in figure 7.4(a) isthe distance between the recess and the trailing edge at the mean radius.Wrecess is the maximumextent of the recess in the radial direction.Lrecess denotes the extent of the recess perpendicular tothe radial direction in the point defined byθrecess andrmean.

84 Analysis of Tilting-Pad Bearings with Deep Recesses
0.47
0.48
0.49
0.50
0.51
0.52
0.53
0.54
0.55
0.56
18 pads
12 pads
8 pads
6 pads
5 pads
4 pads
piv
otl
oca
tion
,(r p
iv−
r 1)/
Wpad[-
]
0.58
0.60
0.62
0.64
0.66
0.68
0.70
0.72
0.74 No recess − ISONo recess − THDNo recess − TEHDRecess − ISORecess − THDRecess − TEHD
piv
otl
oca
tion
,θpiv
/θ0[-
]
0.4 0.6 0.8 1.0 1.2 1.4 1.6200
220
240
260
280
300
320
340
360
380 No recess − ISONo recess − THDNo recess − TEHDRecess − ISORecess − THDRecess − TEHD
Fric
tion
loss
[kW
]
length-to-width ratio [-]0.4 0.6 0.8 1.0 1.2 1.4 1.6
2
4
6
8
10
12
14
16
18
20
ISOTHDTEHD
Red
uct
ion
infr
ictio
nlo
ss[%
]
length-to-width ratio [-]
bc
bc
bc
bca b
c d
Figure 7.7: (a) and (b) state the radial and circumferentialpivot position for sector shaped pads withand without recesses. The values are chosen to minimize the friction loss and are stated for variouslength-to-width ratios. The pad length is defined asLpad = θpad · rmean. (c) states the friction lossand (d) the reduction in friction for recessed bearing pads relative to non recessed pads.
Figure 7.7(a) shows the radial position of the pivot point which leads to a minimum oil filmthickness at the centre of the trailing edge. The results of the different simulations are hard todistinguish from each other as they show the same trend. The usual praxis of positioning the pivotat the mean radius fulfils the criteria of a minimum oil film thickness at the centre of the trailingedge at a length-to-width ratio of approx. 1.2. Positioningthe pivot at the mean radius leads to aminimum oil film thickness at the inner trailing edge corner at low length-to-width ratios. At highratios, the minimum oil film thickness is located at the outertrailing edge corner. Figure 7.7(b)
7.2 Analysis of Tilting-Pad Thrust Bearing 85
shows the optimal position of the pivot point in the circumferential direction. The THD-analyses ofthe recessed bearing pads lead to positions almost identical to those obtained with a rectangular pad.The TEHD-results cannot be compared as the pad thickness relative to the pad area is different inthe analyses of rectangular and sector shaped pads. The non-recessed bearing behaves in a peculiarway under the influence of pad bending. The optimal pivot location first rises with the length-to-width ratio from a ratio of 0.4 to 0.8 then falls from a ratio of0.8 to 1.4. From a ratio of 1.4to 1.8 it sharply rises. The thermal bending of the pad increases with the pad length-to-thicknessratio and to achieve an advantageous pressure distributionthe nondimensional pivot location movestowards the centre of the pad for higher length-to-width ratios. At a ratio of 1.8, this leads tocavitation at the trailing edge. That is disadvantageous for the power loss because the friction lossin the regions with cavitation is large while there is no contribution to the pressure build-up. Theoptimal position of the pivot is therefore closer to the trailing edge leading to a higher tilting angleand no cavitation. The same phenomenon is responsible for the position of the pivot of the 4-padbearing equipped with a recess. Figure 7.7(c) shows the friction loss. THD-analysis indicates anoptimal length-to-width ratio of approx. 1.5 for a non-recessed bearing while it is approx. 1.0for a recessed bearing. Both with and without recesses the optimum length-to-width ratio is largerwhen thermal bending is considered. Figure 7.7(d) shows thereduction in friction loss when usingrecessed bearing pads - compared to bearings with plain pads. The reduction is smaller than whatwas obtained for rectangular pads. This is as expected as therecess sizes and positions have beenoptimized for rectangular pads and not for sector shaped pads. For the common 6 to 8-pad bearingswith length-to-width ratios of 0.8 to 1.2 the reduction in friction is around 10-15 %.
The recess creating a high-pressure zone inside the recess controls the pressure distribution. Thebearing pads therefore loose some of their tilting stability in the radial direction as seen in figure7.8(top-left) showing the minimum oil film thickness obtained when radially moving the pivot pointof the 8-pad bearing. The recessed bearing pad is much more sensitive to radial positioning of thepivot point than the non-recessed pad. The pad is therefore also sensitive to inertial effects in theradial direction in the recess. The centrifugal force acting on the recess oil may cause an oil flowtowards the outer trailing edge leading to a radial tilt of the pad. Figure 7.8(middle-left) shows theeffect of reducing the recess width on the radial tilting stability while 7.8(bottom-left) shows thecorresponding friction losses. A narrower recess improvesthe tilting stability but at the cost of amuch higher friction loss. The reduction in radial tilting stability compared to conventional tilting-pad bearings makes it difficult to obtain an improvement in performance by the use of enclosedrecesses when using point pivots. Spring bed bearings or Michell type bearings with line pivotsinstead of point pivots do not suffer from tilting stabilityproblems in the radial direction. Such acharacteristic suggests that designing with enclosed recesses may result in good design alternativesreducing the friction in these types of bearings.
Figure 7.8(top-right) shows the minimum oil film thickness as a function of the circumferen-tial position of the pivot point. The optimum is more clearlydefined when a recess is machinedin the surface. Figure 7.5(left) documented a similar characteristic for a rectangular pad. Figure7.8(middle-right) shows an isothermal analysis of the influence of the circumferential length of therecess on the behaviour of the optimum. Equivalent to the results presented in figure 7.5(right) fora rectangular pad, figure 7.8(middle-right) documents thata reduction of the recess length reducesthe circumferential sensitivity to the pivot location. Within the range of dimensionless pivot loca-tions shown a recess length ofLrecess = 0.20 · Lpad gives a flatter and therefore more desirable

86 Analysis of Tilting-Pad Bearings with Deep Recesses
0.44 0.46 0.48 0.50 0.52 0.54 0.56 0.58
20
30
40
50
60
70Without recess
With recess
ISOTHDTEHD
Pivot location Wpiv/Wpad [-]
h min
[µm
]
0.50 0.54 0.58 0.62 0.66 40
50
60
70
80
90Without recess
With recess
ISOTHDTEHD
Pivot location Lpiv/Lpad [-]
0.44 0.46 0.48 0.50 0.52 0.54 0.56 0.58
20
30
40
50
60
70Isothermal analysisL
recess=0.565⋅L
padL
end=0.028⋅L
pad
Wrecess=0.78⋅W
pad
Wrecess=0.60⋅W
pad
Wrecess=0.40⋅W
pad
No pocket
Pivot location Wpiv/Wpad [-]
h min
[µm
]
0.50 0.54 0.58 0.62 0.66 40
50
60
70
80
90Isothermal analysis,W
recess=0.78⋅W
padLend
=0.028⋅Lpad
No pocket
Lrecess=0.565⋅L
pad
Lrecess=0.400⋅L
pad
Lrecess=0.200⋅L
pad
Lrecess=0.700⋅L
pad
Pivot location Lpiv/Lpad [-]
0 0.4 0.6 0.78210
220
230
240
250
260
Fric
tion
loss
[kW
]
Wrecess/Wpad [-]0.0 0.2 0.4 0.565 0.7
210
220
230
240
250
260
Lrecess/Lpad [-]
Dependency of the radial positionof the pivot point and the radialsize of the recess.
Dependency of the circumferential positionof the pivot point and the circumferentialsize of the recess.
Figure 7.8: The influence of varying the pivot location radially (left) and circumferentially (right).Top: Minimum film thickness as a function of the pivot position for the 8 pad bearing. Middle:Isothermal analysis of the influence of recess size on the minimum film thickness. Bottom: Theminimum obtainable friction loss for the recess sizes shownin the middle figure.

7.2 Analysis of Tilting-Pad Thrust Bearing 87
75
325300275
250
225200
175150
125100
Lines of constant oil filmthickness [µm]
3 2.52 1.51 0.5
Lines of constantpressure [MPa]
70
65
6055
50
45
65
Lines of constant pad surfacetemperature [oC]
5040302010
Lines of constantpad deflection [µm]
Figure 7.9: Results from the TEHD-analysis of the 8 pad bearing.
behaviour than the non-recessed bearing pad while still reducing the friction by 9 % (see figure7.8(bottom-right) ).
Figure 7.9 illustrates simulation results for the 8-pad bearing. The figure shows graphic illus-trations of oil film thickness, pressure, pad surface temperature and pad bending. The analysis hasshown that the minimum friction loss is achieved when the pressure maximum covers the recessarea as it is seen in the figure. Positioning the recess closerto the pad centre causes a pressure peakdownstream of the recess.
7.2.4 The influence of recess depth
The depth of the recess influences the shear stress at the collar surface and thereby the frictionloss. Figure 7.10 presents a study of the influence of the recess depth on the friction loss in the8-pad bearing defined by the design values stated in figure 7.7. A recess depth ofhp = 4 mmcorresponding to a recess Reynolds number ofRe = 4.2 · 103 is used throughout this chapter of thereport. Using a laminar formulation the friction loss inside the pocket is 11.8 kW corresponding to

88 Analysis of Tilting-Pad Bearings with Deep Recesses
hp =
0.8 mm
hp =
1.0 mm hp =
2.0 mm
hp =
4.0 mm
hp =
10.0 mm
Re = ρUhp/µ [-]
Po
cket
fric
tion
loss
[kW
]
4
101
5 · 101
103 104
Laminar flowTurbulent flow
Re = ρUhp/µ [-]
Tota
lfric
tion
loss
[kW
]
103 104220
230
240
250
260
270
Re = ρUhp/µ [-]
Fric
tion
red
uct
ion
[%]
103 1042
4
6
8
10
12
14
16
18
Figure 7.10: The influence of recess depth on the friction loss. Full lines indicate results obtainedwith the laminar model. Dashed lines indicate estimates of the influence of turbulent recess flow. (a)The friction loss in the pocket area. (b) The friction loss inthe bearing. (c) The friction reductionrelative to an optimal non-recessed bearing.
bc bc bca b c
5 % of the total friction loss. However, atRe = 4.2 · 103 the flow is turbulent as determined byShinkle & Hornung (1965). They presented measurements of the friction factor for a hydrostaticjournal bearing with various pocket depths. ForRe < 1.0 · 103 the friction factor is proportional toRe−1 and the recess flow laminar. At the shift to turbulent flow the friction factor increases slightly(< 10 %). At increasing turbulent Reynolds numbers the factor decreases. The results of Shinkle& Hornung (1965) are used to estimate the influence of turbulence on the results presented in thischapter. AtRe = [2 · 103, 4 · 103, 1 · 104] the amounts of turbulent friction are [1.7, 2.3, 3.5] timesthe values for laminar flow. Estimates using these amounts are presented in figure 7.10(a). For the4 mm deep recess this raises the recess friction by a factor ofapprox. 2.3 and the total bearingfriction loss is increased by 6.6 %( figure 7.10(b) ). Figure 7.10(c) shows the reduction in frictionrelative to a non-recessed bearing of optimal design as defined by the design values of figure 7.7.The reduction in friction is significantly smaller when turbulence is taken into account. This doesnot generally change the results presented in figures 7.4 and7.7. The designs suggested in thesefigures are applicable irrespective of size and operating conditions. The influence of turbulent recessflow on the friction loss however depends on the Reynolds number and thereby the bearing design,operating velocity and oil.

7.2 Analysis of Tilting-Pad Thrust Bearing 89
0 20 40 60 800
50
100
150
200
250
oil
film
thic
knes
s[µ
m]
velocity [rpm]
(a) Cylindrical pocket at pivot point
0 20 40 60 80
0 2 4 6 820
40
60
80
velocity [rpm]
(b) Lpoc=0.400·Lpad
0 20 40 60 800
50
100
150
200
250 Leading edge, inner radiusLeading edge, outer radiusTrailing edge, inner radiusTrailing edge, outer radius
oil
film
thic
knes
s[µ
m]
velocity [rpm]
(c) Lpoc=0.565·Lpad
0 20 40 60 80velocity [rpm]
(d) Lpoc=0.700·Lpad
Figure 7.11: Behaviour of bearings with various recess sizes subject to hybrid lubrication at differentvelocities. The oil film thicknesses at the four corned points are presented. The line legend for allfour figures is stated in (c).
7.2.5 Recesses used for hydrostatic jacking
An isothermal analysis is performed in order to study the behaviour of the bearing pads when op-erated using hybrid lubrication. Pads similar to those studied in figure 7.8(middle-right) withouthigh pressure jacking are now operated with a 2·10−4 m3/s volume flow of oil injection at the cen-tres of the recesses. The conventional bearing pad without recess is equipped with a cylindrical oilinjection pocket covering 5 % of the bearing surface area andlocated at the pivot point.
In figure 7.11 the oil film thicknesses at the four corners of the pads are shown for velocitiesranging from 0 to 100 rpm. Figure 7.11(a) shows oil film thicknesses for the conventional pad withan oil injection pocket. The pad has a significant radial tiltat start-up with a minimum oil filmthickness of 10µm. When increasing the speed the circumferential tilting angle remains close toconstant. Figure 7.11(b) shows that there is a negative circumferential tilting angle at start-up forthe bearing with a recess of lengthLrecess = 0.400 · Lpad. As rotation is initiated the minimum

90 Analysis of Tilting-Pad Bearings with Deep Recesses
oil film thickness at the leading edge of the pad drops. For velocities of 8 to 68 rpm the numericalsolution of the problem has not been possible. In this regionof velocity the tilting angle changesfrom negative to positive. This behavior of the pad at start up is undesirable as the increasinglynegative tilting angle as the collar is accelerated from zero velocity could lead to mixed lubricationand wiping of the bearing pad. Flutter of the pad may occur at the transition from a negative toa positive tilting angle. In figure 7.11(c) the pad withLrecess = 0.565 · Lpad is seen to have aslight positive tilting angle at zero velocity while figure 7.11(d) shows a better start-up behaviorfor Lrecess = 0.700 · Lpad. Due to the smaller tilting angle the minimum oil film thickness at zerovelocity is larger for this bearing than it is in bearings with conventional oil injection pockets. Thefigure shows that recesses can be used as oil injection pockets provided that care is taken towardachieving positive tilting angles at the start-up conditions. This can be achieved by increasing thelength of the recess. Alternatively, the recess can be movedtowards the centre of the pad. The goodbehavior seen in figure 7.11(d) is achieved at the cost of a slightly higher friction loss as it wasshown in figure 7.8(b-right). However, as shown in figure 7.8(b-left) a bearing with a longer recessis more sensitive to the circumferential positioning of thepivot point.
7.3 Conclusion
A 3-dimensional thermo-elasto-hydrodynamic laminar flow model based on the Reynolds equationhas been used to study the effect of equipping tilting-pad thrust bearings with deep recesses withthe purpose of reducing the friction loss. A comparison to results obtained using a CFD-code toanalyse recesses in fixed incline bearing pads published by Brajdic-Mitidieri et al. (2005) has beenperformed. The two methods of analysis give similar resultsindicating that problems of this naturecan be analysed using the Reynolds equation.
A 1-dimensional isothermal analysis of an infinitely wide slider bearing has shown that by plac-ing a recess in the high pressure zone close to the trailing edge it is possible to reduce the minimumfriction loss by 27 %.
In a bearing pad of finite width the potential for reducing friction is smaller. A study of rectan-gular bearing pads shows a 10 % reduction with a length-to-width ratio of 2.0 while a larger energysaving is possible for low length-to-width ratios. At a ratio of 0.2, a saving of 24 % is possible. Opti-mal values of recess lengths and widths, and the corresponding optimal positions of the pivot pointsare stated for length-to-width ratios ranging from 0.2 to 2.0. An analysis shows that the sensitivityof the bearing pads to the circumferential positioning of the pivot is greater than in conventionalbearings. In order to achieve a performance superior to thatof a conventional bearing it is thereforeimperative that the pivot is placed close to the optimal position.
The design suggestions given for rectangular pads have subsequently been applied to sectorshaped thrust bearings. For the common 6 to 8-pad bearings anenergy saving of10 − 15 % isobtained. The bearing pads are very sensitive to the radial position of the pivot point. Spring bedbearings or Michell type bearings with line pivots are therefore preferable to bearings with sphericalpivots.
The design charts presented in figure 7.4(a)−(c) are intended to state the necessary geometricchanges when redesigning a tilting-pad thrust bearing froma conventional design with plain pads toa design with deep recesses in the high-pressure regions. However, it has been shown in figure 7.5

7.3 Conclusion 91
that the sensitivity of the bearing operating parameters tosmall changes in the design and to changesin the boundary conditions is larger than when using conventional bearing pads. For instance, theinfluence of the leading edge pressure build-up or geometricinaccuracies on the oil film distributionis larger than in conventional bearings.
At recess Reynolds numbers higher than1.0 · 103 the recess flow is turbulent. This does notchange the design suggestions but the energy saving is reduced.
Recesses with the suggested sizes and positions can be used as oil injection pockets for hydro-static jacking at start-up. Because they are positioned to the trailing edge side of the pivot point, thepads may however tilt backwards at start-up. This could leadto pad flutter and mixed lubricationwhen accelerating the rotor. Using recesses with larger circumferential dimensions can solve thisproblem by guaranteeing positive circumferential tilt at lift off.

92 Analysis of Tilting-Pad Bearings with Deep Recesses

Chapter 8
Summary and Conclusion
Historically the analyses of tilting-pad thrust bearings have generally not included cutouts in the padsurfaces. Pockets are however often machined in the surfaces to allow for hydrostatic jacking in thestart-up phase and inlet tapers are sometimes used to aid thebuild-up of the oil film. The questionis therefore raised, how such cut-outs influence the bearingoperation and whether the position ofthe pivot point leading to the smallest friction coefficientis significantly affected by such features.A more general question is whether cutouts of arbitrary shape and position, deep or shallow couldenhance the performance of tilting-pad thrust bearings by reducing the friction loss.
A theoretical approach is chosen in the attempt to answer these questions. Numerical modelsare constructed which include the phenomena treated in state of the art models of tilting-pad thrustbearings. These are the hydrodynamic pressure build-up as described by the Reynolds equation,temperature variations along and across the fluid film and through the pads, bending of the bearingpads due to pressure and thermal gradients and heat transferphenomena at the free sides of the padsand in the grooves between the pads. Furthermore, the modelsallow for the inclusion of recesses ofarbitrary shape in the bearing surfaces. Models are constructed for two separate classes of recesses.“Deep recesses” which are two or more orders of magnitude deeper than the oil film thickness arestudied using a model including 3-dimensional treatment ofthe temperatures in the oil film and inthe pads. In such recesses, there is a recirculating flow and alarge amount of mixing of the oil.This mixing may be helped by turbulence. While the temperatures in the oil film are calculated ona 3-dimensional grid the oil in the recess is considered isothermal. “Shallow recesses” constituteanother class of recesses. They have a depth of the same orderof magnitude as the oil film. In suchrecesses, there is no backflow and the oil does not mix as it does in deep recesses. A 2-dimensionalbulk flow treatment of the oil film temperatures is used for theanalysis of bearings with this feature.
Both models are validated against measurements available in the scientific literature performedon a bearing with plain bearing pads. Furthermore, the 3-dimensional model is validated againstmeasurements made on a bearing of large size, which has pockets for hydrostatic jacking at the pivotpoints. The results show reasonable agreement with the measurements although some discrepanciesexist concerning the tilting-angle. The measurements in the plain bearing pads indicate a highercircumferential tilting-angle than the angle predicted bythe models. An independent comparisonavailable in the literature shows the same discrepancy. Theability of the 3-dimensional model topredict the pressure distribution in an oil injection pocket is validated through an experimental study.Individual pads with conical oil injection pockets are tested in a test-rig. At moderate loads (0.5→
93

94 Summary and Conclusion
1.5 MPa mean pressure), measured pressure profiles show goodresemblance with the theoreticallypredicted pressures. At a mean pressure of 4 MPa the discrepancies between results are larger. It isargued that this may be due to the unevenness of the collar.
Tilting-pad thrust bearings of standard design are studied. The influences of varying the length-to-width ratio, varying the pocket sizes and varying the deformation of the pads are studied. Designsuggestions are stated based on the results. The oil injection pockets influence the pressure distri-bution and thereby the optimal position of the pivot point, which moves towards the centre of thepad with increasing pocket size. Length-to-width ratios of0.8→ 1.8 are shown to give the lowestfriction loss. The best choice in this interval depends on the curvature of the pads.
Parallel-step bearings theoretically have smaller friction coefficients than tilting-pad bearings.They however suffer from the disadvantage, that they do not perform well at varying operatingconditions. The advantages of tilting-pad bearings can be combined with those of parallel-stepbearings by machining shallow inlet pockets in the surfacesof the tilting-pads. The friction loss canthereby be reduced by 10 - 15 % in comparison to that of a standard tilting-pad bearing. Suggestionsfor the dimensions of the inlet pocket are stated in the report and it is shown that the modifiedbearings are tolerant to varying operating conditions and wear of the pad surfaces. Such bearingshowever suffer from a high sensitivity to the position of thepivot point, i.e. the oil film thicknessis reduced more rapidly with the offset of the pivot from the optimal position than is the case instandard tilting-pad bearings. Placing the pivot too far inthe direction of the leading edge maycause the bearing to entirely loose its load carrying capacity.
A deep recess in the surface of a bearing pad constitutes a lowfriction zone of nearly constantpressure. Placing such a recess in the high-pressure area ofa bearing pad can reduce the frictioncoefficient, as the reduction of friction due to the low friction zone is higher than the loss of loadcarrying capacity due to the reduced area of converging oil film. Depending on the length-to-widthratio of the bearing pads the reduction in the friction coefficient can be as much as 27 %. Justas is the case with the bearings with inlet pockets, this bearing design also suffers from a highersensitivity to the circumferential position of the pivot. This sensitivity can however be reduced,even to a lower level than in standard bearings by changing the pocket geometry. This raises thefriction coefficient but substantial savings are still possible when comparing to standard bearings.The recess creates a zone of constant high pressure. Therefore, the radial tilting-stability of suchbearings is very low. The pressure distribution is affectedlittle by radial tilting and the compensationwhich occurs within standard bearing pads by the shift of thepressure maximum is much smallerin recessed bearings. It is therefore not recommended to usethis approach of reducing friction inbearings with spherical pivots. Michell-type bearings with line pivots and spring bed bearings donot suffer from radial tilting-stability problems and are therefore good alternatives.

Bibliography
Arghir, M., Alsayed, A. & Nicolas, D., 2002, “The finite volume solution of the Reynolds equationof lubrication with film discontinuities”, International Journal of Mechanical Sciences, Vol. 44,pp. 2119-2132.
Arghir, M., Roucou, N., Helene, M. & Frene, J., 2003, “Theoretical Analysis of the incompressibleLaminar Flow in a Macro-Roughness Cell”, ASME Journal of Tribology, Vol. 125, pp. 309-318.
Brajdic-Mitidieri, P., Gosman, A. D., Ioannides, E. & Spikes, H. A., 2005, “CFD Analysis of a LowFriction Pocketed Pad Bearing”, ASME Journal of Tribology,Vol. 127, pp. 803-812.
Braun, M. J. & Dzodzo, M., 1995, “Effects of the Feedline and the Hydrostatic Pocket Depth onthe Flow Pattern and Pressure Distribution”, ASME Journal of Tribology, Vol.117, pp. 224-233.
Capitao, J.W., 1974, “Influence of Turbulence on Performance Characteristics of the Tilting PadThrust Bearing”, ASME Journal of Lubrication Technology, January, pp. 110-117.
Dobrica, M. B. & Fillon, M., 2006, “Thermohydrodynamic Behavior of a Slider Pocket bearing”,ASME Journal of Tribology, Vol. 128, pp. 312-318.
Dowson, D., 1962, “A Generalized Reynolds Equation for Fluid-film Lubrication”, Int. Journal ofMechanical Science, Vol. 4, pp. 159-170.
Etsion, I. & Klingerman, Y., 1999, “Analytical and Experimental Investigation of Laser-TexturedMechanical Seal Faces”, Tribology Transactions, Vol. 42, No. 3, pp. 511-516.
Etsion, I., Halperin, G., Brizmer, V. & Klingerman, Y., 2004, “Experimental investigation of lasertextured parallel thrust bearings”, Tribology Letters, Vol. 17, No. 2, pp. 295-300.
Ettles, C. M., 1976, “The Development of a Generalized Computer Analysis for Sector ShapedTilting Pad Thrust Bearings”, ASLE Transactions, Vol. 19, 2, pp. 153-163.
Ettles, C. M. & Donoghue, J. P., 1971, “Laminar Recess Flow inLiquid Hydrostatic Bearings”,Proc. Instn Mech Engers, Vol. C27/71, pp. 215-227.
Ettles, C. M., 1980, “Size Effects in Tilting Pad Thrust Bearings”, Wear, 59 , pp. 231-245.Ettles, C. M., 1991, “Some Factors Affecting the Design of Spring Supported Thrust Bearings in
Hydroelectric Generators”, ASME Journal of Tribology, Vol. 113, No. 3, pp. 626-632.Ettles, C. M. & Anderson, H. G., 1991, “Three-Dimensional Thermoelastic Solutions of Thrust
Bearings Using Code Marmac 1”, ASME Journal of Tribology, Vol. 113, No. 2, pp. 405-412.Fuerst, A. , 2003, “Simulation von Traglagern mit Weißmetal- und Polymerbeschichtung”, SIRM
2003, Schwingungen in rotierenden Maschinen, ISBN 3-528-03956-6, Seite 11-20Fust, A., 1981, “Dreidimensionale thermohydronamische Berechnung von Axialgleitlagern mit
punktormig abgestutzten Segmenten”, Dissertation, Eidgenossischen Technischen HochschuleZurich.
95

96 Bibliography
Glavatskikh, S. B., 2000, “On the Hydrodynamic Lubricationin Tilting Pad Thrust Bearings”,Doctoral thesis, Lulea University of Technology.
Glavatskikh, S. B., 2001, “Steady State Performance Characteristics of a Tilting Pad Thrust Bear-ing”, ASME Journal of Tribology, Vol. 123, pp. 608-615.
Glavatskikh, S. B., Fillon, M. & Larsson, R., 2002, “The Significance of Oil Thermal Propertieson the Performance of Tilting-Pad Thrust Bearings”, ASME Journal of Tribology, Vol. 124, pp.377-385.
Glavatskikh, S. B., McCarthy, D. M. C. & Sherrington, I., 2005, “Hydrodynamic Performance of aThrust bearing with Micropatterned Pads”, Tribology Transactions, Vol. 48, pp. 392-498.
Gould, P. L., 1988, “Analysis of Shells and Plates”, Springer-Verlag, pp. 272-289.Hamrock, B. J., Schmid, S. R. & Jacobson, B. O., 2004, “Fundamentals of Fluid Film Lubrication,
Second Edition”, Marcel Dekker, Inc., p. 97.Hashimoto, H., 1990, “Performance Characteristic Analysis of Sector-Shaped Pad Thrust Bearings
in Turbulent Inertial Flow Regime Under Three Types of Lubrication Conditions”, ASME Journalof Tribology, Vol.112, No.3, pp.477-485.
Heckelman, D. & Ettles, C. M., 1987, “Viscous and Inertial Pressure Effects at the Inlet to a BearingFilm”, STLE Transactions, Vol. 31, No. 1, pp. 1-5.
Heinrichson, N. & Santos, I. F., 2005, “Comparison of Modelsfor the Steady-State Analysis ofTilting-Pad Thrust Bearings”, Proc. 18th Int. Congr. of Mech. Engin. (COBEM 2005), OuroPreto, Brazil, Nov 6-11, 2005
Heinrichson, N. & Santos, I. F., 2005, “Optimal Design of Tilting-Pad Thrust Bearings with HighPressure Injection Pockets”, Proc. 12th Nordic Symposium in Tribology (Nordtrib 2006), Elsi-nore, Denmark, June 7-9, 2006 , NT2006-10-51.
Heinrichson, N., Santos, I. F. & Fuerst, A., 2006, “The Influence of Injection Pockets on the Perfor-mance of Tilting-Pad Thrust Bearings: Part I - Theory”, Proc. 8th Biennial ASME Conferenceon Engineering Systems Design and Analysis, Turin, Italy, July 4-6, 2006, ESDA2006-95285.(Accepted for publication in ASME Journal of Tribology.)
Heinrichson, N., Fuerst, A. & Santos, I.F., 2006, “The Influence of Injection Pockets on the Perfor-mance of Tilting-Pad Thrust Bearings: Part II - Comparison Between Theory and Experiment”,Proc. 8th Biennial ASME Conference on Engineering Systems Design and Analysis, Turin, Italy,July 4-6, 2006, ESDA2006-95287. (Accepted for publicationin ASME Journal of Tribology.)
Heinrichson, N. & Santos, I. F., 2006, “Reducing Friction inTilting-Pad Bearings by the use ofEnclosed Recesses”, (Accepted for publication in ASME Journal of Tribology.)
Helene, M., Arghir, M. & Frene, J., 2003, “Numerical Study ofthe Pressure Pattern in a Two-Dimensional Hybrid Journal bearing recess, Laminar, and Turbulent Flow results”, ASME Jour-nal of Tribology, Vol. 125, pp. 283-290.
Hemmi, M. & Inoue, T., 1999, “The Behavior of the Centrally Pivoted Thrust Bearing Pad WithHydrostatic Recesses Pressurized by a Constant-Rate Flow”, Tribology Transactions, Vol. 42,No. 4, pp. 907-911.
Heshmat, H. & Pinkus, O., 1986, “Mixing Inlet Temperatures in Hydrodynamic Bearings”, ASMEJournal of Tribology, Vol. 108, April, pp. 231-248.

Bibliography 97
Huebner, H. , 1974, “Solutions for Pressure and Temperaturein Thrust Bearings Operating in theThermohydrodynamic Turbulent Regime”, ASME Journal of Lubrication Technology, January,pp. 58-68.
Huebner, H. , 1974, “A Three-Dimensional Thermohydrodynamic analysis of Sector Thrust Bear-ings”, ASLE Transactions, Vol. 17, October, pp. 62-73.
Jeng, M., Zhou, G.R. and Szeri A.Z., 1986, “A Thermohydrodynamic Solution of Pivoted Thrustpads: Part I - Theory”, ASME Journal of Tribology, Vol.108, No.2, pp.195-207.
Kays, W. M. & Crawford, M. E., 1993, “Convective Heat and MassTransfer, Third Edition”,McGraw-Hill, Inc..
Kim, J. S. & Kim, J. S., 2002, “Effect of Distance Between Padson th Inlet Pressure Build-Up onPad Bearings”, ASME Journal of Tribology, Vol. 124, pp. 506-514.
Kim, K. W., Tanaka, M. & Hori, Y., 1983, “A Three-DimensionalAnalysis of ThermohydrodynamicPerformance of Sector-Shaped, Tilting-Pad Thrust Bearings”, ASME Journal of LubricationTechnology, Vol. 105, No. 3, pp. 406-413.
Mahieux, C. A. , 2005, “Experimental Characterization of the Influence of Coating Materials on theHydrodynamic Behavior of Thrust Bearings: A Comparison of Babbitt, PTFE, and PFA”, ASMEJournal of Tribology, Vol. 127, No. 3, pp. 568-574.
Mikula, A. M. & Gregory, R. S., 1983, “A comparison of Tilting-Pad Thrust Bearing LubricantSupply Methods”, ASME Journal of Lubrication Technology, Vol. 105, January, pp. 39-47.
Mikula, A. M., 1988, “Further Test Results of the Leading-Edge-Groove (LEG) Tilting Pad ThrustBearing”, ASME Journal of Tribology, Vol. 110, January, pp.174-1988.
New, N. H. , 1974, “Experimental Comparison of Flooded, Directed, and Inlet Orifice Type ofLubrication for a Tilting Pad Thrust Bearing”, ASME Journalof Lubrication Technology, January1974, pp. 22-27.
Pistner, C. A., 1996, “Some Effects of Start-Up Transient Loads on Shoe Bearings for Large Hy-draulic Pump/Turbines”, Tribology Transactions, Vol. 39,No. 1, pp. 93-98.
Raimondi, A. A. & Boyd, J., 1955, “Applying Bearing Theory tothe Analysis and Design ofPad-Type Bearings”, ASME Transactions, Vol. 77, No. 3, pp. 287-309.
Reynolds, D., 1886, “On the Theory of Lubrication and Its Application to Mr. Beauchamp Tower’sExperiments, Including an Experimental Determination of the Viscosity of Olive Oil”, Philo-sophical Transactions of the Royal Society of London, Vol. 177, pp. 157-234.
Rhim, J., & Tichy, J. A., 1989, “Entrance and Inertia Effectsin a Slider Bearing”, TribologyTransactions, Vol. 32, No. 4, pp. 469-379.
San Andres, L., 1995, “Bulk-Flow Analysis of Hybrid ThrustBearings for Process Fluid Applica-tions”, ASME Journal of Tribology, Vol. 122, pp. 170-180.
Santos, I. F. & Fuerst, A., 2003, “Große Axiallager mit Hybridschmierung - Theoretische undexperimentelle Betrachtungen”, Schwingungen in Rotierenden Maschinen, Vol. 6, pp. 51-60.
Santos, I. F. & Nicoletti, R., 1999, “THD Analysis in Tilting-Pad Journal Bearings Using MultipleOrifice Hybrid Lubrication”, ASME Journal of Tribology, Vol. 121, pp. 892-900.
Shinkle, J. N. & Hornung, K. G., 1965, “Frictional Characteristics of Liquid Hydrostatic JournalBearings”, ASME Journal of Basic Engineering, Vol. 87, Issue 1, pp. 163-169.
Sternlicht, B., Carter, G., and Arwas, E.B., 1961, “Adiabatic Analysis of Elastic, Centrally Pivoted,Sector, Thrust-Bearing Pads” ASME Journal of Applied Mechanics, Vol.28, June, pp.179-187.

98 Bibliography
Sternlicht, B. & Arwas, E.B., 1962, “New Charts Simplify Design of Pivoted Thrust Bearings”Product Engineering, Vol. 33, Issue 8, pp. 124-132.
Vohr, J. H., 1981, “Prediction of Operating Temperature of Thrust Bearings”, ASME Journal ofLubrication Technology, Vol. 103, No. 1, pp. 97-106.
Yuan, J. H., Medley, J. B. & Ferguson, J. H., 2001, “Spring-Supported Thrust Bearings Usedin Hydroelectric generators: Comparison of Experimental Data with Numerical Predictions”,Tribology Transactions, Vol. 44, No. 1, pp. 27-34.
-oOo-