on-road study of drivers’ use of rearview video systems
TRANSCRIPT

DOT HS 811 024 September 2008
On-Road Study of DriversrsquoUse of Rearview Video Systems (ORSDURVS)
This document is available to the public from the National Technical Information Service Springfield Virginia 22161
DISCLAIMER
This publication is distributed by the US Department of Transportation National
Highway Traffic Safety Administration in the interest of information exchange The
opinions findings and conclusions expressed in this publication are those of the
author(s) and not necessarily those of the Department of Transportation or the National
Highway Traffic Safety Administration The United States Government assumes no
liability for its contents or use thereof If trade or manufacturersrsquo names or products are
mentioned it is because they are considered essential to the object of the publication
and should not be construed as an endorsement The United States Government does
not endorse products or manufacturers
ii
Technical Report Documentation Page 1 Report No DOT HS 811 024
2 Government Accession No 3 Recipients Catalog No
4 Title and Subtitle
On-Road Study of Driversrsquo Use of Rearview Video Systems (ORSDURVS)
5 Report Date September 2008
6 Performing Organization Code NHTSANVS-312
7 Author(s) Elizabeth N Mazzae and Frank Barickman National Highway Traffic Safety Administration G H Scott Baldwin and Thomas Ranney Transportation Research Center Inc
8 Performing Organization Report No
9 Performing Organization Name and Address National Highway Traffic Safety Administration Vehicle Research and Test Center PO Box 37 East Liberty OH 43319
10 Work Unit No (TRAIS)
11 Contract or Grant No
12 Sponsoring Agency Name and AddressNational Highway Traffic Safety Administration1200 New Jersey Ave SE
Washington DC 20590
13 Type of Report and Period Covered
Final Report 14 Sponsoring Agency Code
15 Supplementary Notes The authors thank Heath Albrecht Adam Andrella Christopher Boday Jodi Clark Thomas Gerlach Ed Parmer and Scott Vasko of TRC Steve Wilson of SSI and John Martin of The Ohio State University for their technical support in performing this research
16 Abstract Driverrsquos use of rearview video (RV) systems was observed during staged and naturalistic backing maneuvers to determine
whether drivers look at the RV display during backing and whether use of the system affects backing behavior The 37 test participants aged 25 to 60 years were comprised of 12 drivers of RV equipped vehicles 13 drivers of vehicles equipped with an RV system and a rear parking sensor system (RPS) and 12 drivers of vehicles having no backing aid All participants had driven and owned a 2007 Honda Odyssey minivan as their primary vehicle for at least 6 months Participants were told that the purpose of the study was to assess how drivers learn to use the features and functions of a new vehicle
Participants visited the sponsorrsquos research lab to have unobtrusive video and other data recording equipment installed in their personal vehicles and take a brief test drive Participants then drove their vehicles for a period of 4 weeks in their normal daily activities while backing maneuvers were recorded At the end of the 4 weeks participants returned to the research lab to have the recording equipment removed Participants took a 2nd test drive identical to the first except that when backing out of the garage bay at the end of the drive an unexpected obstacle appeared behind the vehicle
Drivers with RV made 13 to 14 percent of glances to the RV video screen during initial phases of backing in the staged maneuvers independent of system presence drivers spent over 25 percent of backing time looking over their right shoulder in the staged backing maneuvers Only participants with an RV system who looked at the RV display more than once during the maneuver avoided a crash Results showed that RV system presence was associated with a statistically significant 28 percent reduction in crashes compared with the unexpected obstacle participants without a system All 12 participants in the ldquono systemrdquo condition crashed More participants in the lsquoRV amp RPSrsquo condition crashed (85 percent) than did in the RV condition (58 percent) Substantial benefits of the presence of an RPS system were not seen in the staged obstacle event Only 5 of 13 participants in the ldquoRV amp RPSrsquo condition received RPS warning indicating the presence of a rear obstacle Of those 5 participants 4 crashed
In naturalistic backing maneuvers the 37 participants made 6145 backing maneuvers None of the 6145 naturalistic backing events resulted in a significant collision There were several minor collisions during routine backing with for example trash cans and other vehicles Approximately 61 percent of backing events involved no concurrent driver activity In real-world backing situations drivers with RV systems spent 8 to 12 percent of the backing time looking at the RV display On average drivers made less than one glance to the console or RV display location when no video display was present versus 217 glances when only the RV system was present and 165 glances with RV plus RPS Overall drivers looked at least once at the RV display on approximately 65 percent of backing events and looked more than once at RV on approximately 40 percent of backing events
Overall results of this study revealed that drivers look at rearview video displays during backing maneuvers at least some of the time Approximately 14 percent of glances in baseline and obstacle events and 10 percent of glances in naturalistic backing maneuvers went to the RV display In addition there was no evidence to support the hypothesis that driverrsquos backing behavior (ie speed and acceleration) was influenced by the presence of absence of an RV system in either the staged obstacle event or the naturalistic backing maneuvers Driversrsquo average backing speed in naturalistic backing maneuvers was 226 miles per hour 17 Key Words 18 Distribution Statement
Document is available to the public from the National Technical Information Service Springfield VA 22161
19 Security Classif (of this report) Unclassified
20 Security Classif (of this page) Unclassified
21 No of Pages 139
22 Price
Form DOT F 17007 (8-72) Reproduction of completed page authorized
ii
TABLE OF CONTENTS
TABLE OF CONTENTS i
LIST OF FIGURES iii
LIST OF TABLES v
EXECUTIVE SUMMARY vii
10 INTRODUCTION 111 Background 112 Related Research 213 Current Study Objectives 3
20 VEHICLE SELECTION 521 Performance of 2007 Honda Odyssey Parking Sensor System 11
211 Odyssey RPS Performance in Detecting Stationary Objects 11212 Sensor Detection Zone Area Repeatability Tests with Stationary Objects 14213 Odyssey RPS Performance in Detecting Dynamic Objects 18
30 METHOD 2131 Experimental Design 2132 Participant Recruitment 2133 Participants 2234 Ruse 2235 Data Acquisition and Instrumentation 22
40 PROCEDURE 2541 Initial Meeting 2542 Naturalistic Driving Period 2643 Final Meeting and Surprise Obstacle Event 26
431 Details of the Obstacle Event Scenario 2744 Data Reduction Method 31
50 RESULTS NATURALISTIC DRIVING 3351 Characteristics of Naturalistic Driving 3352 Characteristics of Naturalistic Backing Maneuvers 3453 Naturalistic Backing Crashes 3754 Eye Glance Behavior During Naturalistic Backing Events 38
541 Eye Glance Behavior During Backing as a Function of Environmental Conditions 42
55 Driversrsquo Activities During Naturalistic Backing Events 5056 RPS Use 52
60 RESULTS INITIAL lsquoBASELINE EVENTrsquo AND FINAL lsquoOBSTACLE EVENTrsquo 5361 Backing Behavior During Baseline and Obstacle Events 5362 Obstacle Event Outcome Results 55
63 Eye Glance Behavior During Baseline and Obstacle Events 59
70 QUESTIONNAIRE RESULTS 65
80 DISCUSSION 7281 Rearview Video System Display Response Time 7282 Why Was RV (only) Associated with Fewer Crashes Than RV amp RPS 7383 Impact of Rearview Video Use on Likelihood of Backover Crash Avoidance 7484 Caveats 7485 What is ldquoGoodrdquo Driver Glance Behavior During Backing 75
90 SUMMARY and CONCLUSIONS 76
100 REFERENCES 79
110 APPENDICES 80111 Appendix A Results for Performance Testing of the 2007 Honda Odysseyrsquos
Parking Sensor System ndash Front Sensors 80112 Appendix B Participant Information Summary 81113 Appendix C Vehicle Condition Check Sheet 91114 Appendix D Participant Debrief Form 92115 Appendix E Participant Questionnaire With Results (No System) 93116 Appendix F Participant Questionnaire With Results (Rearview Video Only) 95117 Appendix G Participant Questionnaire With Results (Rearview Video and
Rear Parking Sensors) 104118 Appendix H Details of Mechanisms Used in Presenting the Obstacle Event
122
ii
LIST OF FIGURES
Figure 1 Percent Crashes by System Condition for the Staged Obstacle Event viiiFigure 2 Number of Glances Per Naturalistic Backing Maneuver Trial to the
Rearview Video Display or Center Console Area (For the lsquoNo Systemrsquo Condition) x
Figure 3 Rearview Video System Visual Display of the 2007 Honda Odyssey 6Figure 4 Field of View of the 2007 Honda Odyssey Rearview Video System for a 294
Inch-Tall Object 7Figure 5 Rear Field of View for the 2007 Honda Odyssey with 60-Inch-Tall Driver
Viewing a 294 Inch-Tall Object 8Figure 6 Rear Field of View for the 2007 Honda Odyssey with 70-Inch-Tall Driver
Viewing a 294 Inch-Tall Object 9Figure 7 Photo of Warning Message from Odyssey Parking Sensor System 10Figure 8 Image of the Locations of the Four Rear Parking System Sensors 11Figure 9 2007 Honda Odyssey RPS Detection Results for the 18-Inch-Tall Traffic
Cone 12Figure 10 2007 Honda Odyssey RPS Detection Results for the 36-Inch-Tall Traffic
Cone 13Figure 11 2007 Honda Odyssey RPS Detection Results for the 1-Year-Old ATD 13Figure 12 2007 Honda Odyssey RPS Detection Results for the 3-Year-Old ATD 14Figure 13 Repeatability Test Results for the 2007 Odyssey RPS Detecting a 28shy
Inch-Tall Traffic Cone 15Figure 14 Repeatability Test Results for the 2007 Odyssey RPS Detecting a 40shy
Inch-Tall PVC Pole 16Figure 15 Repeatability Test Results for the 2007 Honda Odyssey RPS Detecting an
Adult Male 17Figure 16 Illustration of How Test Objects Were Towed Behind the Test Vehicle 18Figure 17 Numbered Walking Paths for ldquoAdult Waking Diagonallyrdquo Trials 20Figure 18 Two-Dimensional Image of a Child Used in the Surprise Obstacle Event 28Figure 19 Photograph of the Obstacle at the Beginning of Surprise Obstacle Event29Figure 20 Photograph of the Obstacle at the End of Surprise Obstacle Event 30Figure 21 Locations of the Subject Vehicle Obstacle and Surrounding Objects
During the Staged Backing Maneuver 31Figure 22 Mean Percentage of Glances by Glance Location and System Condition39Figure 23 Mean Number of Glances Per Backing Maneuver by Glance Location and
System Condition 40Figure 24 Mean Total Glance time by Glance Location and System Condition 41Figure 25 Mean Glance Duration by Glance Location and System Condition 41Figure 26 Mean Percentage of Glance Time by Location and System Condition 42Figure 27 Percentage Glance Time by Eye Glance Location and Maneuver Length
43Figure 28 Percentage Glance Time by Location and Visibility 44Figure 29 Percentage Glance Time by Starting Location and Glance Location 44Figure 30 Percent Glance Time by Starting Location and System Condition 45Figure 31 Percent Glance Time by Visibility No System 47
iii
Figure 32 Percent Glance Time by Backing Maneuver Length and System Condition 49
Figure 33 Mean Time (plusmnSD) Between Shifting into Reverse Gear and the Beginning of Rearward Motion (Baseline and Obstacle Events) 53
Figure 34 Mean Backing Speed (plusmnSD) by System Condition (Baseline and Obstacle Events) 54
Figure 35 Mean Maximum Backing Speed (plusmnSD) by System Condition (Baseline and Obstacle Events) 54
Figure 36 Maximum Backing Acceleration (plusmnSD) by System (Baseline and Obstacle Events) 55
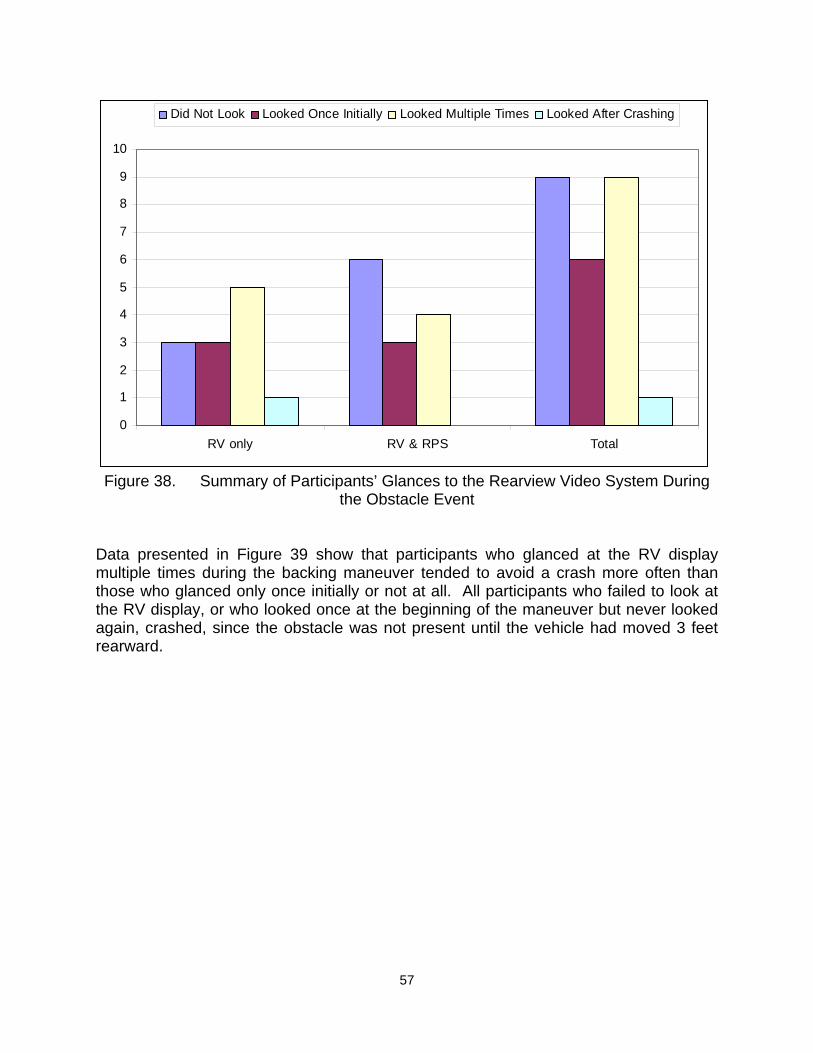
Figure 37 Percent Crashes by System Condition for the Staged Obstacle Event 56Figure 38 Summary of Participantsrsquo Glances to the Rearview Video System During
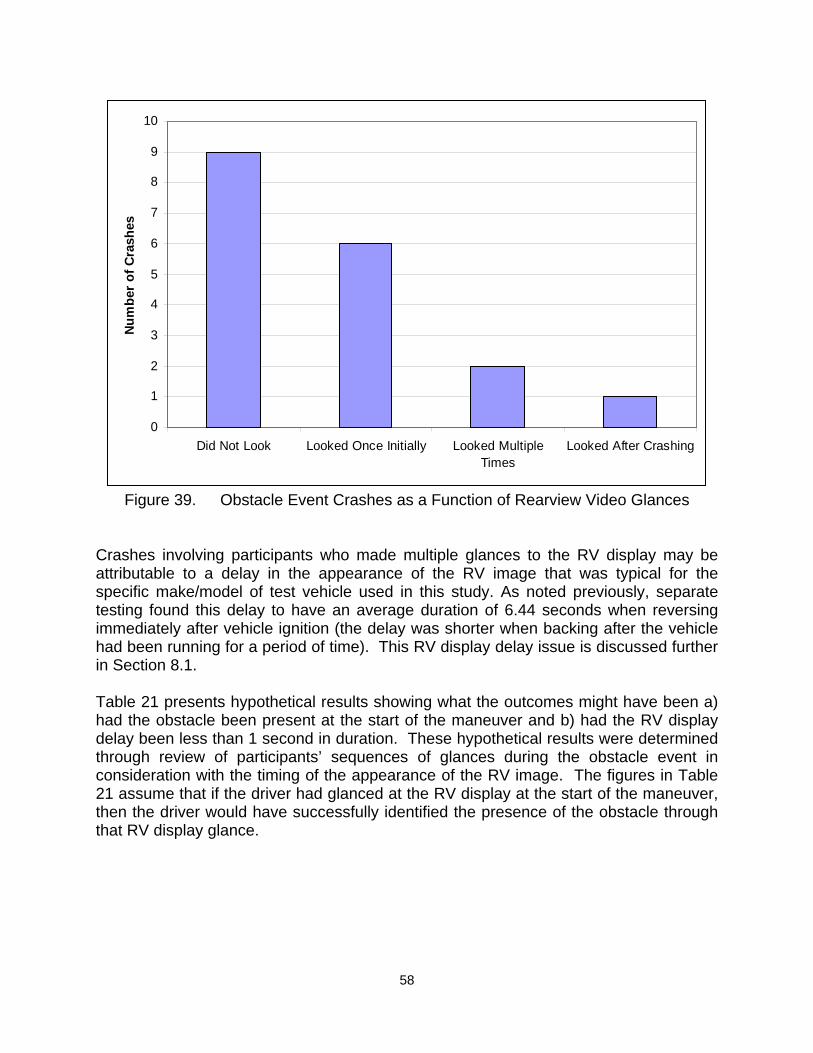
the Obstacle Event 57Figure 39 Obstacle Event Crashes as a Function of Rearview Video Glances 58Figure 40 Mean Number of Glances Per Trial by Glance Location and System
(Baseline and Obstacle Events) 62Figure 41 Mean Percentage of Glances by Glance Location and System Condition
(Baseline and Obstacle Events) 63Figure 42 Mean Glance Duration by Glance Location and System Condition
(Baseline and Obstacle Events) 63Figure 43 Mean Percentage of Total Glance Time by Glance Location and System
Condition (Baseline and Obstacle Events) 64Figure 44 Graphic Used to Assess in Which Areas Participants Thought a Small
Child Standing Behind Their Vehicle Could Be Seen in the RV Display 69Figure 45 Summary of Questionnaire Responses Indicating in Which Areas a Small
Standing Child Would Be Detected by the RPS 70Figure 46 PSS Front Sensorsrsquo Detection Results for the Various Traffic Cones a 40shy
iInch-Tall PVC Pole and an Adult Male 80Figure 47 Backing Plate for Cutout 122Figure 48 Complete Cutout Assembly 123Figure 49 Anchor Points 124Figure 50 Piston and Electric Air Valve Assembly 125
iv
LIST OF TABLES
Table 1 System Conditions and Numbers of Test Participants viiTable 2 Availability of Vehicles Equipped with Parking Aid Systems and Rearview
Video Systems in the US (20052006 Model Year) 5Table 3 Maximum Detection Range as a Function of Test Object Speed 19Table 4 Data Channels 23Table 5 Characteristics of the Participantsrsquo Naturalistic Driving 33Table 6 Characteristics of the Participants Naturalistic Driving By System
Condition 34Table 7 Characteristics of the 6145 Recorded Backing Maneuver Events 34Table 8 Distribution of Time Between Shift to Reverse and Beginning of Backing by
Backing System Condition (Naturalistic Backing Events) 35Table 9 Mean Maximum Backing Speed by System Condition (Naturalistic Backing
Events) 36Table 10 Quantiles of Overall Distribution of Maximum Backing Speed (from 6037
Naturalistic Backing Events) 36Table 11 Extreme Values of Maximum Backing Speed (from 6037 Naturalistic
Backing Events) 37Table 12 Descriptive Statistics for Backing Maneuver Characteristics by Maneuver
Starting Location 37Table 13 Naturalistic Crashes Observed 38Table 14 Number of Glances to the RV Display Per Backing Maneuver by System
Condition 39Table 15 Descriptive Characteristics of Naturalistic Backing Maneuvers by
Maneuver Length 43Table 16 Driversrsquo Activities During Backing Events 50Table 17 Summary of Observed Instances of Multiple Activities During Backing 51Table 18 Driversrsquo Primary Activity By System Condition 52Table 19 Mean Maximum Backing Speed by System Condition (Baseline and
Obstacle Events) 55Table 20 Staged Obstacle Event Outcomes 56Table 21 Hypothetical Staged Obstacle Event Outcomes 59Table 22 Obstacle Event Outcomes as a Function of RPS Detection 59Table 23 Summary of Participantsrsquo Glances to the Rearview Video System During
the Baseline and Obstacle Events 60Table 24 Number of Glances to the ConsoleRV Display by System and Baseline or
Event Trial 61Table 25 Number of Glances to the ConsoleRV Display by RV Presence and
Baseline or Event Trial 61Table 26 Questionnaire Responses Regarding Where Drivers Look to Determine
Whether the Area Behind Their Vehicle is Clear Prior to Backing 65Table 27 Percent Responses Regarding Why ldquoNo Systemrdquo Participants Did Not
Choose To Purchase a Backing Aid System 66Table 28 Participant Responses Regarding Whether They Would Like Their Next
New Vehicle to be Equipped With a Backing Aid System (by System Condition) 66
v
Table 29 How Did Participants Learn to Use Their RV or RPS 66Table 30 How Well Does Your Vehiclersquos RPS (N=13) and RV (N=12) Work in the
Following Weather Conditions 67Table 31 Summary of Participant Responses to the Question ldquoHow Easy is Your
(System) To Use When Backing Out of a Driveway 68Table 32 Summary of Questionnaire Responses Indicating in Which Areas (in
Figure 44) a Small Standing Child Could Be Seen in the RV Display 68Table 33 RV Display Measured Response Time (s) 72
vi
EXECUTIVE SUMMARY
A backover crash involves a vehicle moving in reverse striking a person frequently a young child Over the past 15 years NHTSA has studied rear object detection systems for heavy trucks medium straight trucks and passenger vehicles and evaluated their performance in detecting people As recently as 2007 NHTSA research found that sensor-based systems perform poorly and unreliably in detecting people particularly children
The advent of rearview video systems gave drivers a means to see the area directly behind the vehicle without reliability issues or object detection performance issues in most conditions However we are aware of no research to date that has examined driversrsquo use of rearview video systems in a naturalistic setting to assess driversrsquo ability to integrate this information source into their everyday backing behavior in real-world conditions
Research was conducted to examine driversrsquo use of rearview video systems during backing maneuvers The main purposes of the study were to 1) determine whether drivers look at the rearview video display during backing maneuvers and 2) determine whether use of the system affects backing performance (ie obstacle avoidance success)
An experiment was conducted to observe the driving behavior of drivers aged 25 to 60 years in both laboratory-staged and naturalistic backing maneuvers The 37 test participants were comprised of 12 drivers of a vehicle equipped with a rearview video (RV) system 13 drivers of vehicles equipped with an RV system and a rear parking sensor system (RPS) and 12 drivers of vehicles having no backing maneuver aid as summarized in Table 1 All participants drove a 2007 Honda Odyssey minivan as their primary vehicle and had owned the vehicle for at least 6 months prior to study participation Participants were told that the purpose of the study was to assess how drivers learn to use the features and functions of a new vehicle
Table 1 System Conditions and Numbers of Test Participants System Number of Test Participants No System 12 Rearview Video (RV) Only 12 Rearview Video and Rear Parking Sensors (RV amp RPS) 13
The Odysseyrsquos RV system had a center dashboard-mounted video display The Odysseyrsquos RPS had four rear bumper-mounted ultrasonic sensors and warned the driver of obstacles using a visual alert presented under the speedometer and an auditory alert
At the start of their participation drivers visited the sponsorrsquos research lab to consent to study participation and have an unobtrusive data recording system installed in their
vii
personal vehicles Installed equipment included five video cameras a video recorder and a data acquisition system which controlled the recording of driving events During this visit participants took a test drive in an instrumented vehicle that was essentially identical to their own At the end of the test drive participants backed out of a garage bay without incident Participants then drove their personal vehicles for a period of 4 weeks in their normal daily activities while backing maneuvers were recorded by the installed recording equipment At the end of the 4 weeks participants returned to the research lab to have the recording equipment removed from their vehicle Participants took a second test drive identical to that driven in their first visit except that when backing out of the garage bay at the end of the drive an unexpected obstacle appeared behind the vehicle The obstacle was a rigid photo image of a small child Participantsrsquo responses to this obstacle event were recorded
Staged Obstacle Event Results
The rearview video system examined in this study improved detection and avoidance of a crash with a simulated stationary object in the experimental trials Overall the RV system presence was associated with a 28 percent reduction in crashes with the unexpected obstacle presented at the end of the second test drive (ie 7 out of 25 participants with RV did not crash) Since it was essentially impossible to directly see the obstacle without an RV system 100 percent of participants in the lsquono systemrsquo condition crashed as shown below in Figure 1 Participants with an RV system experienced significantly fewer crashes than those without a system More participants in the lsquoRV amp RPSrsquo condition crashed (85 percent) than did participants in the RV condition (58 percent) however this difference was not statistically significant
100
90
80
70
60
50
40
30
20
10
0 None RV RV amp RPS RV and RV amp
RPS Combined
Perc
ent C
rash
es
Figure 1 Percent Crashes by System Condition for the Staged Obstacle Event
viii
Only participants with an RV system who looked at the RV display more than once during the backing maneuver avoided a crash Two participants with an RV system who looked at the display more than once and still crashed were likely unable to see the obstacle in the RV display due to a delay in the RV image appearance A brief examination of the timing of presentation of the RV image in that vehicle showed a 644 second delay between the time the driver shifted into reverse until the time the RV image appeared when reversing soon after starting the vehicle
Drivers varied in their use of the RV system during the staged baseline and event trials Specifically among drivers with an RV system 16 of 25 participants (64 percent) made at least one glance to the RV during the staged event trials When both baseline and event trials were considered the percentage of glance time directed at the RV display varied between 0 and 81 percent of the first 12 seconds of backing Drivers with RV made 13 to 14 percent of glances to the RV video display during initial phases of backing Without an RV system drivers could not see obstacle in the staged obstacle event Independent of system presence drivers spent over 25 percent of backing time looking over their right shoulder in the staged backing maneuvers
There are several possible reasons why the RV systems did not have a bigger benefit in the obstacle event trials These include the delay associated with the appearance of the image in the RV display the inappropriate timing of the driversrsquo looks to the RV system their failure to make multiple glances at the RV display and the possibility that drivers had strong expectations that no such event would occur in the research setting which may have led them to become less vigilant than in real-world backing
Substantial benefits associated with the presence of an RPS system on the vehicle were not seen in the staged obstacle event Only 5 of 13 participants in the lsquoRV amp RPSrsquo condition received RPS warnings indicating the presence of an obstacle behind the vehicle Of those 5 participants 4 crashed
Naturalistic Backing Results
In the naturalistic portion of this study among 37 participants each of whom participated for 28 days for a total of 42982 miles there were 6145 backing maneuvers A typical backing event took approximately 10 seconds and covered 34 feet Twenty-two percent of backing maneuvers involved multiple backing components in which backing motion was separated by a period of stopped time for example when a driver backed to the end of a driveway stopped to wait for traffic then continued backing into the street The results of naturalistic data collection reveal that on average drivers made approximately 114 backing maneuvers per trip average trip length was slightly less than 9 miles
None of the 6145 naturalistic backing events resulted in a significant collision There were several minor collisions during routine backing with for example trash cans and other vehicles
There is no evidence to support the hypothesis that driversrsquo backing behavior (ie speed and acceleration) was influenced by the presence or absence of an RV system
ix
ConsoleVideo
Driversrsquo average backing speed in naturalistic backing maneuvers was 226 miles per hour the average maximum speed was 364 miles per hour
Glance behavior during backing appears to be robust and relatively invariant over different environmental conditions In real-world backing situations drivers with RV systems spent 8 to 12 percent of the backing time looking at the location of the RV display Drivers with no system spent about 3 percent of their backing time looking at the center console area Ignoring the possible effects of differential exposure the differences between these values (5 to 9 percent) constitute one estimate of the percentage of backing time devoted to looking at the rearview video display Furthermore this result suggests that in addition to the routine preparatory tasks involving the console (radio HVAC) drivers regularly look at the RV system while backing Drivers with no RV system do not devote more glance time to the rear view mirror
Overall drivers looked at least once at the RV display on approximately 65 percent of backing events and looked more than once at the RV display on approximately 40 percent of backing events Figure 2 highlights that on average drivers made less than one (M=081) glance per trial to the consolevideo display location when no video display was present (eg to look at the vehicle clock) versus 217 (RV) and 189 glances (RV amp RPS) when the RV system was present Data suggest that participants in the RV amp RPS condition made no glances per trial to the RV display more often than those in the lsquoRV onlyrsquo condition The data also suggest that participants in the RV amp RPS condition made four or more glances per trial to the RV display less often than those in the lsquoRV onlyrsquo condition This trend of more participants with lsquoRV onlyrsquo looking at the RV display than those with RV amp RPS may indicate that participants in the RV amp RPS condition were relying on the sensors to alert them of an obstacle However differences in the particular backing situations between driver groups (ie differential exposure) or individual differences in backing habits between groups may have contributed to this difference
Num
ber o
f Gla
nces
None RV RV amp RPS
25
2
15
1
05
0
Figure 2 Number of Glances Per Naturalistic Backing Maneuver Trial to the Rearview Video Display or Center Console Area (For the lsquoNo Systemrsquo Condition)
x
Approximately 61 percent of backing events involved no concurrent driver activity Among the remaining 39 percent of backing events concurrent activities included activation of garage door remote (13 percent) talking with passenger (13 percent) using cell phone (3 percent) and securing seat belt (3 percent) among others In 508 backing events (approximately 10 percent of the subset for which driver activity was recorded) drivers were engaged in multiple concurrent activities while backing
The specific patterns of driver glance behavior and visual sampling of the center dashboard-mounted rearview video display may not be similar to those that would be observed in drivers using an RV display mounted in the center rearview mirror Additional research would be required to determine whether rates of driversrsquo glances to the RV display seen in this study would be similar with a display in the rearview mirror
Conclusions
Overall results of this study revealed that drivers look at rearview video displays during backing maneuvers at least some of the time Approximately 14 percent of glances in baseline and obstacle events and 10 percent of glances in naturalistic backing maneuvers were to the rearview video display While this evidence of driversrsquo use of the rearview video systems is encouraging it should be noted that due to the wide range of directions and speeds in which an obstacle might approach the area behind a vehicle and the timing in which a driver may choose to glance at the rearview video display a rearview video system cannot be expected to prevent all backing crashes
While rearview video systems offer the driver a useful tool for detecting rear obstacles some guidance may be necessary to educate drivers as to the most effective way to incorporate this new visual information source into their glance behavior during backing maneuvers Encouraging drivers to make more than one glance to the RV display during backing maneuvers and to glance at the display throughout the maneuver rather than just at the beginning may increase the benefits attainable with these systems
xi
10 INTRODUCTION
A backover crash is one in which a vehicle moving in reverse strikes a person Tragically the victims of these crashes are typically young children
The size of the backover safety problem can only be roughly estimated because many of the backover crashes that occur on private property are not recorded in State or Federal crash databases which focus on crashes occurring in traffic-ways Supplementing NHTSA crash records with death certificate reports backover crashes involving all vehicle types are estimated to cause at least 183 fatalities annually [1] In addition between 6700 and 7419 injuries per year result from pedestrian backovers [1] A substantial portion of these injuries are minor
11 Background
In 2006 in response to Section 10304 of the Safe Accountable Flexible Efficient Transportation Equity Act A Legacy for Users (SAFETEA-LU) the National Highway Traffic Safety Administration (NHTSA) published both a report to Congress about backover crashes [1] and an assessment of methods for reducing the incidence of injury death and property damage caused by collisions of backing passenger vehicles [2] This second report documented the results of an assessment of available backover avoidance technologies for their ability to detect a variety of objects including small children
Eight sensor-based parking aid systems were examined to measure a variety of aspects of their object detection performance Measurements included static field of view static field of view repeatability and dynamic detection range for a variety of test objects including small children An examination of three rear video and two auxiliary mirror systems was also conducted which involved measurement of field of view and displayed image quality
Test results revealed that sensor-based systems generally exhibited poor ability to detect pedestrians particularly children located behind the vehicle Sensor-based systemsrsquo performance in detecting children was inconsistent unreliable and in nearly all cases quite limited in range However the rearview video systems examined were found to accurately display images of pedestrians or obstacles behind the vehicle
While rearview video systems can display objects behind a vehicle unless coupled with electronic proximity sensors they cannot alert the driver to the presence of a rear obstacle Thus rearview video systems alone are passive and require the driver to take the initiative to look at the video display perceive any pedestrian or obstacle present and respond correctly Without knowing whether drivers will make effective use of rearview video systems it is not possible to estimate the benefits such a system may provide The true efficacy of rearview video systems cannot be known without assessing whether drivers effectively incorporate the information into their visual scanning patterns Thus the current research seeks to investigate whether drivers will actively use rearview video systems when making backing maneuvers
1
NHTSA also examined rear cross-view mirrors as part of a separate NHTSA study [3] that examined commercially-available rear object detection systems intended for use on medium straight trucks For this study NHTSA tested three sensor-based rear object detection systems one rear object detection system that combined sensors with rearview video one rearview video (only) rear object detection system and one rear cross-view mirror Overall the quality of the rear cross-view mirror image was found to be insufficient to allow drivers to resolve small objects behind the step van (or other vehicles of this length) It was found to be very hard to impossible to see small children over much of the blind zone behind the vehicle Larger children and adults were visible although there the combination of high distortion plus significant minification may reduce detection likelihood in certain portions of the blind zone Weather effects such as water droplets or ice on the mirror surface will obscure the view of images in the rear cross-view mirror People or objects behind a vehicle may not be sufficiently visible in the mirror in conditions of darkness Overall this study reported that rear cross-view mirrors are not a very effective means of allowing a driver to see behind a vehicle Additionally NHTSA has concerns that drivers may not use the mirrors effectively
12 Related Research
Two prior studies by General Motors (GM) examined driver performance while using rear parking aids that included an ultrasonic rear park assist system (URPA) and a rear video (RV) system [456]
The 2003 study [4] examined driver backing performance with an ultrasonic rear park assist (URPA) rear video (RV) URPA with RV or no aid The focus of the study was on parking behaviors therefore participants performed a number of parking trials Participants were asked to perform five parking tasks with each of the four levels of parking aid The four parking aid systems were presented using a 2002 Cadillac Escalade Seventy-two percent of participants drove an SUV truck or van as their primary vehicle while 19 percent reported their secondary vehicle was an SUV truck or van Prior to performing the trials the use of the parking aid systems was explained to the participant After all parking trials had been completed an unexpected obstacle scenario was presented to examine obstacle avoidance performance differences that could result from the presence or absence of the parking aid systems [4] Overall 23 of 29 (83 percent) participants crashed into the obstacle (pylon) Of 5 participants who did not strike the obstacle only 3 of them avoided it by viewing it in the video display The paper states that of the five participants who did not hit the obstacle ldquothree saw the obstacle using the RV (two in the RV condition one in the URPA with RV condition) one saw the obstacle in their mirror (in the URPA with RV condition) and one saw the obstacle out the back window (in the RV condition)rdquo However the authors report that glance behavior during the parking tasks indicated that drivers were using both the URPA and RV systems when available
The 2004 study [5] examined the effectiveness of backing warnings and showed low effectiveness for the warnings tested Driver performance during backing maneuvers was examined in an open parking lot using two instrumented vehicles both equipped
2
with prototype backing warning systems All participants were trained on the integrated parking assist capability of the warning system while a portion was provided specific training on the backing warning functionality A surprise obstacle event was presented with the assistance of a distraction task involving a small video screen adjacent to the rear window For drivers who received warnings from the system only 13 percent avoided hitting the obstacle Many drivers who experienced the warning (68 percent) demonstrated precautionary behaviors in response to the warning (eg covering the brake pedal) Participants reported that they did not expect there to be an obstacle present during the surprise obstacle maneuver Many participants reported searching for an obstacle after receiving the warning but since they ldquodidnrsquot see anythingrdquo they continued to back The authors noted that these observations suggest that expectancy is a powerful determinant guiding driver perception and behavior Many drivers appeared to want direct sensory confirmation of obstacle presence before initiating avoidance behaviors [6]
These studies used drivers who were unfamiliar with the use of the parking aid systems tested Furthermore participants drove ldquotest vehiclesrdquo which were not necessarily the same make model as a vehicle they drove on a regular basis Therefore it cannot be determined whether lack of familiarity with the systems or the test vehicle contributed to the poor parking aid system effectiveness in the unexpected obstacle scenario
13 Current Study Objectives
Research was conducted to examine driversrsquo use of rearview video systems during backing maneuvers The main purpose of the study was to 1) determine whether drivers look at the rearview video display prior to andor during backing and 2) determine whether use of the system affects backing performance (ie obstacle avoidance success) The following research questions were addressed
1 How do drivers ldquouserdquo the systemDo drivers of vehicles equipped with rearview video systems look at the video display during backing to gain information about the environment behind the vehicle
Do drivers of vehicles equipped with rearview video systems glance at the mirrors and over their shoulder less than drivers without such a system
Are glances made to the side and center rearview mirrors during a backing maneuver shorter in duration andor fewer in frequency when using a rearview video system than when not using such a system
Do drivers of vehicles equipped with rearview video systems look at the video before they initiate rearward motion of the vehicle
Do drivers of vehicles equipped with rearview video systems and backing sensors look at the video display less often during backing than do drivers with rearview video only
2 What effect do systems have on driversrsquo behavior and performance during backing maneuvers
3
Do drivers of vehicles equipped with rearview video systems experience fewer collisions with rear obstacles
Do drivers of vehicles equipped with a backing aid system perform backing maneuvers differently than drivers of vehicles without such equipment
4
20 VEHICLE SELECTION
A single vehicle makemodel was used in this study to prevent confounding of study results due to the differing physical characteristics of multiple vehicles To select a vehicle with features relevant to this research an early 2006 report [7] containing inventories of available in-vehicle technologies were reviewed to identify vehicles equipped with original equipment backing systems Table 2 taken from the Early Adopters Survey Results Report [8] shows the availability of rearview video and sensor-based backing systems on recent model year vehicles
Table 2 Availability of Vehicles Equipped with Parking Aid Systems and Rearview Video Systems in the US (20052006 Model Year)
System Vehicle Manufacturer
Model Lines with System as Optional
Equipment
Model Lines with Feature as Standard
Equipment Backing aid only 21 82 22 Rearview video system only 0 8 2 Backing aid and rearview video system 10 10 2
This study required a 2007 model year vehicle that could be obtained with a factory-installed rearview video system alone or augmented by a factory-installed backing aid system The vehicles that fit this description included models such as the Honda Odyssey Acura TL and MDX and Porsche Cayenne Based on this list of vehicles the model having the highest sales the Honda Odyssey was chosen for use in this study
The rearview video system of the 2007 Honda Odyssey operates whenever the vehicle is in reverse (R) gear and the ignition switch is in the ldquoonrdquo position The camera was located to the right side of the rear license plate The visual display for the system was located at the top center of the dashboard Figure 3 contains a photograph of the rearview camera systemrsquos visual display showing a grid of 1 foot squares Figure 4 contains a graphical representation of the field of view of the vehiclersquos rearview camera For comparison purposes Figures 5 and 6 present the rear field of view (from the side mirrors rearward) for the Odyssey using only direct glances and mirrors for a 60-inch-tall driver and a 70-inch-tall driver
5
Figure 3 Rearview Video System Visual Display of the 2007 Honda Odyssey
6
Figure 4 Field of View of the 2007 Honda Odyssey Rearview Video System for a 294 Inch-Tall Object
7
Figure 5 Rear Field of View for the 2007 Honda Odyssey with 60-Inch-Tall Driver Viewing a 294 Inch-Tall Object
8
Figure 6 Rear Field of View for the 2007 Honda Odyssey with 70-Inch-Tall Driver Viewing a 294 Inch-Tall Object
The Odysseyrsquos factory-equipped backing system was referred to as a ldquoParking Sensor Systemrdquo (PSS) Note that for the purposes of this report the rear sensor portion of the system is referred to as the ldquoRear Parking Systemrdquo or ldquoRPSrdquo The vehiclersquos ownerrsquos manual stated that the system ldquolets you know the approximate distance between your vehicle and most rear obstacles while you are parkingrdquo [9] The system alerts the driver to the presence of a rear obstacle using ldquoa beeperrdquo and ldquosystem messages on the multi-information displayrdquo [9] Figure 7 shows an image of a warning message from the Parking Sensor System The manual further states that ldquoAll obstacles may not always be sensed Even when the system is on you should look for obstacles near your vehicle to make sure it is safe to parkrdquo The Parking Sensor System could be activated and deactivated via a button on the dashboard
9
Figure 7 Photo of Warning Message from Odyssey Parking Sensor System
The vehiclersquos ownerrsquos manual [9] stated that the Parking Sensor System had two front corner sensors (20 in range) two rear corner sensors (20 in range) and a rear center sensor (70 in range) However the Odyssey ldquoTouringrdquo model vehicle acquired for use as a test drive vehicle for this study had two rear corner sensors and two rear center sensors as shown in Figure 8 According to the vehiclersquos ownerrsquos manual [9] the ldquorear center sensor works only when the shift level is in reverse (R) and the vehicle speed is less than 5 mph (8 kmh)rdquo The manual also stated that the ldquocorner sensors work only when the shift lever is in any position other than P and the vehicle speed is less than 5 mph (8 kmh) The system alerts the driver to the presence of a nearby obstacle using a visual indicator presented on the multi-information display The visual alert consists of an icon representing an overhead view of a car with a polygon adjacent to the location of the sensor that detected the obstacle The system uses three different beep frequencies to indicate the range of the obstacle detected (ldquoshort beepsrdquo for 16-20 in ldquovery short beepsrdquo for 12-16 in or ldquocontinuous beeprdquo for 12 in or less)
Two 2007 Honda Odyssey minivans were obtained for use as the test vehicles to be driven during the initial and final test drives These vehicles helped expedite the test procedure by allowing for the participantrsquos vehicle to have instrumentation installed or removed at the same time as the test drive was being conducted A Touring trim level Odyssey equipped with ldquoHonda Satellite-Linked Navigation System with voice recognition and rearview camerardquo was used as the test drive vehicle for participants owning vehicles equipped with rearview video (only) and rearview video plus parking sensors An Odyssey LX was used as the test drive vehicle for participants whose personal vehicle was not equipped with a rearview video system or rear parking sensors
10
Figure 8 Image of the Locations of the Four Rear Parking System Sensors
21 Performance of 2007 Honda Odyssey Parking Sensor System
Hardware testing was performed to characterize the performance of the 2007 Honda Odysseyrsquos s Rear Parking Sensors (RPS) portion of the Parking Sensor System (PSS) Tests measured the ability of the systemrsquos rear sensors to detect stationary and moving targets including an adult male various sizes of traffic cones two anthropomorphic test devices (ATD) representing a 1-year-old and 3-year-old child an ISO-specified PVC pole and a plastic traffic curb A detailed description of the methods used can be found in the NHTSA report ldquoExperimental Evaluation of the Performance of Available Backover Prevention Technologiesrdquo [2] Selected results of testing of the current vehicle are presented in this section Brief testing of the PSSrsquos front parking sensors was also performed and results are presented in Appendix A
211 Odyssey RPS Performance in Detecting Stationary Objects For stationary object testing trials were conducted to determine whether or not a particular test object was detected in a location on the test grid and what approximate level of warning was provided by the system A systemrsquos response was considered an ldquoinconsistent warningrdquo if the system produced a sporadic or occasional visual or auditory alert in response to the objectrsquos presence Each graph of detection results shows an overhead view of the test grid with the vehiclersquos rear bumper (not to scale) at the bottom of the graph positioned at the 0 longitudinal point on the grid
11
The RPS was found to be unable to detect short objects behind the vehicle including a 12-inch-tall traffic cone plastic parking curb and an adult male lying on the ground An 18-inch-tall traffic cone was detectable in the range of 1 to 4 feet from the vehiclersquos rear bumper however due to the height of the object and the shape of the sensor detection ldquobeamsrdquo it could not be detected within the first 12 inches as shown in Figure 9 The detection results for a 36-inch-tall traffic cone shown in Figure 10 indicate that this object twice as tall as the aforementioned one showed only slightly better detectability and still was generally invisible to the sensors within a 12-inch range The 1-year-old ATD with its 294-inch height was detectable within a 12-inch range in each outer one-third of the bumper span but was invisible in that range within 1 foot to either side of the vehiclersquos centerline Figure 11 also shows that the 1-year-old ATD was only detected consistently out to a distance of 4 feet The 3-year old ATD which was 372 inches in height was detected over a slightly broader area (up to 1 ft in either lateral direction) and 1 foot further in range than was the 1-year old ATD (see Figure 12)
Figure 9 2007 Honda Odyssey RPS Detection Results for the 18-Inch-Tall Traffic Cone
12
Figure 10 2007 Honda Odyssey RPS Detection Results for the 36-Inch-Tall Traffic Cone
Figure 11 2007 Honda Odyssey RPS Detection Results for the 1-Year-Old ATD
13
Figure 12 2007 Honda Odyssey RPS Detection Results for the 3-Year-Old ATD
212 Sensor Detection Zone Area Repeatability Tests with Stationary Objects Providing consistent accurate object detection performance is important to ensure the detection of critical objects and to ensure that the driver will trust and therefore use and respond to the system To assess repeatability additional trials of static sensor system detection zone measurements were conducted with a subset of test objects to capture day-to-day variability in the detection performance of sensor systems The degree of variability noted in these tests was whether or not an object was detected in a particular location (ie differences in level of warning provided were not noted) on a particular day Systemsrsquo performance in detecting objects was measured on each of 3 consecutive days The procedure used was the same as that used in the other static sensor system detection zone measurements Objects used in these tests included the 28-inch cone 40-inch-tall PVC pole and an adult male human
Figures 13 through 15 show the static detection zone repeatability test results Each figure contains three graphs one for each day in which the test was run Each graph shows an overhead view of the test grid with the vehiclersquos rear bumper positioned at the bottom of the graph at the 0 longitudinal point on the grid
Results for the 28-inch-tall traffic cone were fairly similar in each repetition with variability concentrated in the far extent of the systemrsquos range between 4 and 5 feet Detection results for the 40-inch-tall PVC pole were very consistent across the three repetitions with each test showing a detection range of 5 feet Results for detection of the adult male show consistent detection to a range of 5 feet and sporadic detection within the range of 5 to 6 feet The far left and right edges of the detection zone also showed variable detection of the adult male as shown in Figure 15 Overall the variability seen in these repeatability results is consistent with that of similar previously tested systems [2]
14
Figure 13 Repeatability Test Results for the 2007 Odyssey RPS Detecting a 28shyInch-Tall Traffic Cone
15
Figure 14 Repeatability Test Results for the 2007 Odyssey RPS Detecting a 40shyInch-Tall PVC Pole
16
Figure 15 Repeatability Test Results for the 2007 Honda Odyssey RPS Detecting an Adult Male
17
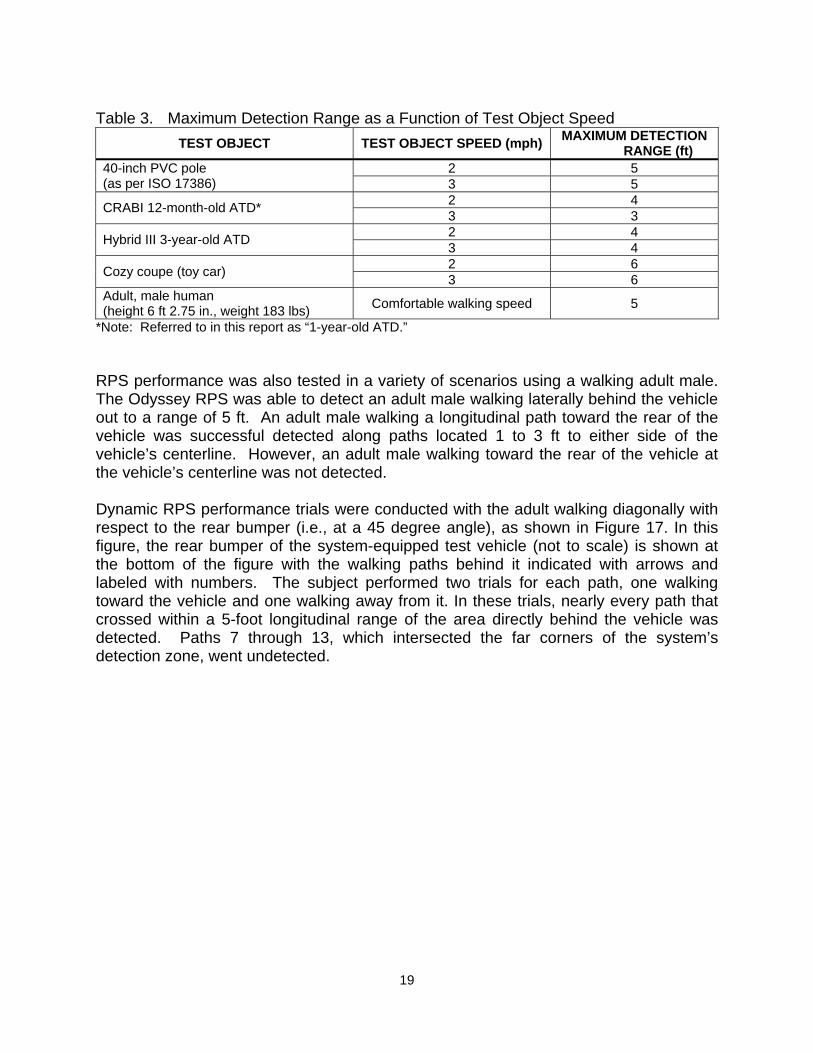
213 Odyssey RPS Performance in Detecting Dynamic Objects RPS performance in detecting objects moving behind the vehicle was measured using several test objects that were towed laterally (parallel to the vehiclersquos bumper) to determine the maximum range at which they were detected Figure 16 illustrates the way in which test objects were moved during this test The object was first moved behind the vehicle at a range of 1 foot from the rear bumper and if successfully detected the object was moved 1 foot further from the rear bumper Table 3 presents results for the maximum range at which the dynamic objects were detected by the RPS The maximum distance from the bumper at which any object was detected was 6 feet
Figure 16 Illustration of How Test Objects Were Towed Behind the Test Vehicle
18
Table 3 Maximum Detection Range as a Function of Test Object Speed TEST OBJECT TEST OBJECT SPEED (mph) MAXIMUM DETECTION
RANGE (ft) 40-inch PVC pole (as per ISO 17386)
2 5 3 5
CRABI 12-month-old ATD 2 4 3 3
Hybrid III 3-year-old ATD 2 4 3 4
Cozy coupe (toy car) 2 6 3 6
Adult male human (height 6 ft 275 in weight 183 lbs) Comfortable walking speed 5
Note Referred to in this report as ldquo1-year-old ATDrdquo
RPS performance was also tested in a variety of scenarios using a walking adult male The Odyssey RPS was able to detect an adult male walking laterally behind the vehicle out to a range of 5 ft An adult male walking a longitudinal path toward the rear of the vehicle was successful detected along paths located 1 to 3 ft to either side of the vehiclersquos centerline However an adult male walking toward the rear of the vehicle at the vehiclersquos centerline was not detected
Dynamic RPS performance trials were conducted with the adult walking diagonally with respect to the rear bumper (ie at a 45 degree angle) as shown in Figure 17 In this figure the rear bumper of the system-equipped test vehicle (not to scale) is shown at the bottom of the figure with the walking paths behind it indicated with arrows and labeled with numbers The subject performed two trials for each path one walking toward the vehicle and one walking away from it In these trials nearly every path that crossed within a 5-foot longitudinal range of the area directly behind the vehicle was detected Paths 7 through 13 which intersected the far corners of the systemrsquos detection zone went undetected
19
Figure 17 Numbered Walking Paths for ldquoAdult Waking Diagonallyrdquo Trials
Note Each square in the grid had the dimensions of 1 foot by 1 foot
20
30 METHOD
In order to answer the research questions the driving behavior of drivers of rearview video system equipped vehicles was compared to that of drivers without such a system To determine whether the addition of backing sensors might enhance any benefits achievable through the use of a rearview video system a third condition was tested that included rear object detection sensors in addition to rearview video A total of twelve participants participated in each system condition Participants were observed driving their own vehicles in a naturalistic setting for 4 weeks followed by presentation of a controlled backing crash avoidance scenario Additional details of the method follow
31 Experimental Design
The experiment used a between-subjects design with a single independent variable ldquosystemrdquo referring to the type of backing aid present on the vehicle The variable had three levels no system rearview video (RV) system and rearview video system plus backing sensors (RV amp RPS) To control variability all three treatment levels were presented using the same vehicle model
Dependent variables included measures such as the number and duration of glances to the rearview video display side and center rearview mirrors and glances over the shoulder during backing maneuvers Additional measures included vehicle backing speed and collision avoidance success The method by which these dependent measures were acquired is detailed in the following section
32 Participant Recruitment
Persons owning 2007 Honda Odyssey minivans were sought out for participation The State of Ohio Bureau of Motor Vehicles was contacted to obtain the names and addresses of persons who registered a vehicle having a Vehicle Identification Number (VIN) corresponding to that of a 2007 Honda Odyssey Mailings were sent to these owners asking about the equipment present on their minivans and inviting them to participate in the study The mailings included a response form with several questions about the personrsquos vehicle driving habits and availability to participate Persons who submitted a completed response form and met the study criteria listed were contacted by phone to explain additional details about the study and acquire additional information to use in evaluating their suitability for participation The following points constituted the main criteria for participation
Between 25 and 60 years of age No health problems that could negatively impact driving performance Make 2 or more trips per day in the subject vehicle Agree to be the only driver of the subject vehicle during the 4-week study
period Agree to drive to NHTSArsquos Vehicle Research and Test Center (VRTC) to
have instrumentation installed and later removed from the subject vehicle
21
Agree to accommodate data retrieval visits as frequently as once per week
Agree to perform two brief test drives Consent to release of video and engineering data for research scientific
and outreach purposes
33 Participants
Participants were 37 Ohioans who owned 2007 Honda Odyssey minivans and had driven them as their primary vehicle for at least 6 months Participantsrsquo ages ranged from 25 to 60 years (M=400 SD=83) On average participants had owned their Odysseys 2607 days (SD=630) at the time they began participation in the study The average odometer reading at the time study participation began was 116104 miles (SD=47340) Participants were paid $800 for completing participation in the study plus 50 cents per mile up to a total of $200 for mileage driven between their residence and VRTC for the initial and final meetings
Recruitment preference was given to persons who reported making a minimum of 2-5 trips per day in the subject vehicle and who stated that they drove with one or more children in the vehicle ldquosometimesrdquo or ldquoalwaysrdquo
34 Ruse
During recruitment prospective participants were told that the purpose of the study was to determine how people become familiar with and learn to take advantage of the features of new vehicles By observing people driving in real-world situations we would hope to better understand driver behavior and estimate the degree of safety that newer vehicles may provide Prospective participants were asked about the features of their vehicle (eg radio navigation rear seat DVD) and whether their vehicle was equipped with a rearview video system To minimize any possible influence on their backing behavior due to knowledge of the studyrsquos focus prospective participants were asked a number of other questions about their vehicle so they would not be alerted to the focus of the study
35 Data Acquisition and Instrumentation
A data acquisition system (DAS) capable of collecting data within less than 5 seconds after the vehicle was powered on was developed for this study The DAS was programmed to record data during all backing maneuvers To ensure that all backing maneuvers were recorded the DAS was primed to record data each time the vehiclersquos doors were unlocked using the key fob one of the vehiclersquos doors was opened or the key was placed in the ignition After one of these events the system began recording data automatically as soon as the power up sequence was complete Data would continue to be recorded until it was triggered to stop recording through timeout settings The DAS was triggered to stop recording data (but remain powered on) if the vehiclersquos transmission had not been placed into reverse gear within 3 minutes of the time when data recording began If the transmission was placed into reverse gear the DAS would
22
begin recording data Following any backing maneuver data recording was triggered to cease 10 seconds after the transmission had been placed into a gear other than reverse The DAS turned off when the vehiclersquos engine was turned off
Instrumentation included video cameras digital video recording equipment an embedded DAS wiring and a GPS antenna mounted on the roof of the vehicle Wiring was used to access CAN bus signals and transmit desired data to the DAS Video and sensor data were transmitted to an embedded DAS The DAS stored data files to a Secure Digital (SD) card Table 4 lists the data channels that were recorded to acquire the needed dependent measures
Table 4 Data Channels Data Acquisition Method Equipment Video image of driverrsquos face to determine glance location (to rearview video display mirrors over the shoulder)
Camera (full resolution)
Video images of areas surrounding vehicle (Environmental conditions in which backing occurs)
Cameras 1 rear 1 each side (quad multiplexed frac14 resolution)
Backing sensor warnings (record each backing maneuver) Parking System module Info that triggers data collection start (driverrsquos door open key insertion ignition)
B-CAN Bus
Transmission gear selection F-CAN Bus Brake applications F-CAN Bus Throttle percent displacement F-CAN Bus Vehicle speed F-CAN Bus GPS Headlights (on or off) B-CAN Bus Turn signal (left right) F-CAN Bus Vehicle location (latitude longitude heading use to determine path)
GPS or derive from video data
Time of day GPS or real-time computer clock Odometer (per trip if possible) Derive from CAN Bus Vehicle longitudinal acceleration Derive from speed Collisions Derive from video data
Video cameras were installed in unobtrusive locations A camera mounted to the rear license plate frame recorded the scene behind the vehicle Cameras mounted to the vehiclersquos undercarriage just aft of each front wheel recorded the scene on either side of the vehicle Lastly a video camera positioned above the center rearview mirror focused on the driverrsquos face to facilitate collection of eye glance data As part of the ruse a fifth camera was mounted above the center rearview mirror facing forward to prevent test participants from realizing the focus was on what was behind the vehicle Initially video data were recorded using small digital video recorders Due to a high malfunction rate in those devices they were replaced with mini-DV digital video tape recorders
Vehicles equipped with parking sensor systems were instrumented such that their parking sensor system status (eg which sensor is detecting something if any) was recorded during backing maneuvers To acquire data indicating the status of the parking system the parking system module located under the dashboard required wires soldered to it for transmission of bus data to the DAS To make installation of this
23
connection faster (and not modify a participantrsquos equipment long-term) the parking system module of the participantrsquos vehicle was replaced for the duration of the study with an identical module that had soldered connections on it to allow for access of the signal data
24
40 PROCEDURE
The 36 participants were divided into three groups of 12 drivers The three groups of participants were run sequentially Each set of 12 drivers contained a balanced number of each treatment condition Due to an incident where one driver lost use of her rear parking sensors during the course of the study a 37th participant was run in order to ensure the treatment conditions were balanced
The procedure had three main components an initial meeting 4 weeks of naturalistic driving and a final meeting Both the initial and final meetings were held at NHTSArsquos Vehicle Research and Test Center (VRTC) located on the Transportation Research Center Inc (TRC) proving ground These meetings and the procedural aspects of the 4 weeks of naturalistic driving are described in detail below
41 Initial Meeting
The first component involved the participants attending an ldquoinitial meetingrdquo at which they completed consent paperwork received instructions and allowed instrumentation to be installed in their vehicles The participants also made a short test drive in a vehicle with identical features as their own
Each participant attended an initial meeting which lasted between 2 and 3 hours Upon arrival at VRTC the participant was asked to read the Participant Information Summary which described the experiment and set forth the terms of participation (Appendix B) Participants also read a Confidential Information form (TRC PampP153) for visitors to the TRC proving ground which describes TRCrsquos policy for safeguarding proprietary information After all questions were answered the participant signed the documents thereby giving informed consent to participate in the study and have the instrumentation installed in his or her personal vehicle No individuals declined to participate
The participant was then escorted outside to the parking lot where a technician was inspecting the pre-existing condition of the participantrsquos vehicle by completing the Vehicle Condition Check Sheet (Appendix C) While the technician was inspecting the participantrsquos vehicle the experimenter documented the current vehicle mileage and the mileage it took to get from the participantrsquos residence to VRTC (used for payment purposes) The experimenter also showed the participant the location of the cameras and other equipment by using VRTCrsquos identical experimental vehicle as an example In addition the experimenter provided verbal tips for preventing damage to the equipment when washing the car
After the participant reviewed the condition of the vehicle with the technician and signed the Vehicle Condition Check Sheet to complete the vehicle inspection the technician drove the participantrsquos vehicle to the garage for the installation of instrumentation The experimenter and the participant went inside to discuss the test drive and guidelines for driving on the 75-mile oval test track During this time the participant was offered the opportunity to ask more questions and take a break if needed before going on the actual test drive
25
The test drive was used both to occupy the participants while waiting for their vehicle to be instrumented as well as to give the opportunity to present an obstacle avoidance event at the final meeting The test drive also helped support the primary experimental ruse of recording the participantrsquos driving behavior in the new vehicle under a variety of conditions The participant was asked to enter the test vehicle adjust the mirrors and controls to their comfort level and to wear the seatbelt at all times The test drive consisted of a tour of selected TRC facilities in which the experimenter gave directions In order to help establish the ruse for the surprise event the test drive consisted of a mix of rural road residential parking lot and test track (interstate speeds) driving At the completion of the test drive the participant was asked to drive the vehicle into a garage bay at VRTC so a technician could offload the data collected during the test drive In actuality this data offloading step was another ruse used to set up the conditions for an obstacle avoidance event that would occur at the end of the final meetingrsquos test drive The participant was instructed to drive the vehicle into the garage bay and park with the left front wheel on a yellow wheel stop mat The mat was used to obtain a consistent location of the test vehicle to ensure that the initial position of the vehicle prior to the obstacle event at the final meeting was the same for all participants Once the vehicle was stopped the technician closed the garage door and commenced with data offloading while the participant and experimenter waited in the car
After the technician offloaded the data and raised the garage door the participant drove the vehicle to the front parking lot and returned to the conference room with the experimenter to wait on the completion of the installation of instrumentation into their vehicle When the technician returned the vehicle the participant was escorted to the parking lot and given an opportunity to review the vehicle and instrumentation before departing for the 4 weeks of participation
42 Naturalistic Driving Period
During the four weeks of naturalistic driving a technician was dispatched weekly to retrieve data from each test vehicle at a place and time convenient for the participant The procedure of offloading data and checking instrumentation typically took up to 1 hour To retrieve the data the technician would obtain the vehicle keys from the participant and then get into the vehicle to offload the engineering data to a laptop computer and change the miniDV tape in the video recorder and SD card that held other data While offloading data the technician would inspect the system and check the cameras to ensure everything was still working properly If a problem was detected the technician would exchange the malfunctioning component with a properly functioning replacement and make any necessary repairs Once the data retrieval was complete the technician would return the vehicle keys to the participant and confirm a date and time for the next data retrieval or final meeting
43 Final Meeting and Surprise Obstacle Event
The final meeting followed a format similar to the initial meeting This time when the participant arrived however the first step was the vehicle inspection since the informed consent and confidential information paperwork were already covered during the initial
26
meeting The current vehicle mileage was documented during the inspection such that the total mileage driven for the 4 weeks could be calculated Once the Vehicle Condition Check Sheet was completed as in the initial meeting the technician took the vehicle to the garage again this time for instrumentation to be removed from the vehicle
The participant was given an opportunity for a break and then followed the same test drive procedures as in the initial meeting Once in the test vehicle participants were again encouraged to adjust the mirrors and controls to their comfort level and to wear the seatbelt at all times The test drive consisted of a tour in which the experimenter gave the same directions as in the initial meeting
At the end of the test drive the participant was instructed to drive the vehicle into the garage bay and park with the left front wheel on a yellow wheel stop mat Once the vehicle was parked inside the garage door was closed A technician opened the rear hatch of the vehicle and appeared to connect a laptop to the data acquisition system and copy data while the experimenter and participant sat inside the vehicle During the apparent data download process another member of the research staff was outside setting up the obstacle (see Appendix H for a description of the obstacle event mechanics) When the obstacle was ready for the event the technician copying the data from the vehicle was signaled that the obstacle setup was complete He then closed the rear door of the vehicle and raised the garage door
At that time the participant was told that it was time to return to the conference room for debriefing and to await the completion of the vehicle instrumentation removal from their vehicle The experimenter instructed the participant to back out of the garage and then drive the vehicle to the front parking lot so the vehicle could be parked However this time the obstacle event was triggered as the vehicle backed out of the garage After the event was complete the participant drove the vehicle to the front parking lot and returned to the conference room
Participants were then informed of the surprise event details using a Debrief form (Appendix D) and were given a questionnaire to complete The questionnaire was adapted from that used for another NHTSA study investigating early adoptersrsquo use of sensor-based backing aid systems and rearview video cameras [8] Three versions of the questionnaire were used to address the different system conditions (no system RV only or RV and rear parking sensors) (Appendices E F and G) Each participant completed the questionnaire version that corresponded to their vehiclersquos equipment Once the questionnaire was complete the participant was given payment for participation
431 Details of the Obstacle Event Scenario The obstacle event involved a two-dimensional life-size image of a small child popping up behind the test vehicle while the participant was backing out of a garage at the end of the final meeting test drive The image consisted of a full-color photo of a 36-inch-tall toddler The photo was printed on a corrugated plastic substrate (see Figure 18) The 36-inch height corresponded approximately to the height of a 25 year old child
27
Figure 18 Two-Dimensional Image of a Child Used in the Surprise Obstacle Event
The photo obstacle was located along the centerline of the vehicle to prevent it from being seen by a driver using the side rearview mirrors Originally a wheeled obstacle towed laterally into the area behind the vehicle was planned However an object that moved into the rear blind zone on a lateral path could be seen in the side mirror making it difficult to know whether the subject had seen the obstacle using the rearview video or the mirror While a backing scenario involving a centered stationary object may not be representative of all the different types of real world backover crash scenarios it allowed for the clear determination of whether visual detections of the obstacle were attributable to rearview video system use
The distance of 14 feet between the bumper of the vehicle and the obstacle at the start of the staged backing maneuver was selected for a few reasons At average backing speeds (based on baseline (initial meeting) event backing speed data from the first 12 participants) this distance would give the participant approximately 5 to 7 seconds to visually detect the obstacle before the rear bumper would contact it This distance also placed the obstacle within the blind spot area of average-height drivers The obstacle could not be seen with mirrors or over the shoulder glances by a properly belted driver
28
of average or below average height As a result participants had to use the rearview video system in order to detect the presence of the obstacle While this situation put the participants in the ldquono systemrdquo category at an obvious disadvantage it also allowed for clear determination of whether visual detections of the obstacle were attributable to rearview video system use
When the participant drove the vehicle into the garage the obstacle was not present After the participant had driven the van into the garage and the door was closed behind them the object was set up The back side of the obstacle was painted with textured paint to mimic the appearance of asphalt pavement (see Figure 19) With the rigid photograph laid flat in a face-down (child image side) orientation its presence was concealed Once the obstacle was in its face-down position and ready for the event the staff member conducting the data download was notified that all was clear for the event The garage door was then opened and the participant was told to back out so they could return the vehicle to its designated parking space in the parking lot outside The obstacle was not present at the beginning of the maneuver After the vehicle traveled 3 feet in reverse it contacted a switch in the pavement that triggered the obstacle to swiftly move into an upright position as shown in Figure 20 This delayed presentation was intended to mimic the scenario of child running into the blind zone after the vehicle has started backing It also facilitated observation of whether drivers would look at the RV screen multiple times during a backing maneuver rather than only once at the start of the maneuver
The method used to cause the obstacle to pop up into a vertical position in a controlled manner is described in detail in Appendix H
Figure 19 Photograph of the Obstacle at the Beginning of Surprise Obstacle Event 29
Figure 20 Photograph of the Obstacle at the End of Surprise Obstacle Event
Figure 21 shows the location of the vehicle at the beginning of the event features of the surrounding area and the location of the obstacle Two dark red colored vehicles were positioned outside the garage bay entrance on either side A white step van was also positioned outside the garage bay door in line with its opening to provide a consistent visual field behind the backing vehicle
30
Figure 21 Locations of the Subject Vehicle Obstacle and Surrounding Objects During the Staged Backing Maneuver
44 Data Reduction Method
Characteristics of eye glance behavior and details of the conditions of naturalistic backing maneuvers were determined through manual video data reduction Vehicle-based engineering data channels recorded by the DAS were validated and then processed using Matlab to extract metrics of interest Naturalistic video data files for
31
particular backing maneuvers were matched to their corresponding engineering data files using software
Data were reduced and analyzed to provide quantitative and qualitative measures of driversrsquo backing behavior (eg glance patterns) and performance (ie avoiding a crash) as well as their use of the rearview video system (when present) Information about the conditions in which drivers perform backing maneuvers and how the conditions may affect mirror or system use was obtained
32
50 RESULTS NATURALISTIC DRIVING
While more than 6000 naturalistic backing maneuvers were recorded in this study they were made by only 37 people This is a relatively small sample size Each maneuver an individual participant made was not an independent data point Due to the statistical problems associated with using multiple events from the same person the use of summary measures such as the mean number of glances to system per backing event was deemed the most appropriate method in which to compare conditions
51 Characteristics of Naturalistic Driving
The 37 participants in this study drove 42982 miles during 5219 trips On average each participant drove 12354 miles (SD=5342) Miles driven per day during study participation 441 miles on average was similar to that driven prior to the study 453 miles per day (based on mileage at the start of participation and time of ownership) A total of 6145 naturalistic backing events were recorded for the 37 drivers This equates to an average of 166 backing maneuvers per driver Table 5 summarizes additional characteristics of participantsrsquo naturalistic driving and Table 6 breaks down these same results by system condition
Table 5 Characteristics of the Participantsrsquo Naturalistic Driving Variable N Mean Standard Deviation Minimum Maximum
Trips 37 14105 5253 3100 27200 Mean Backing Maneuvers per Trip 37 114 020 061 160 Mean Distance per Trip (mi) 37 889 445 278 2404 Backing Maneuvers 37 16311 6816 1900 31800 Sum Miles 37 116169 57359 27075 341403 Mean Backing Maneuvers per Mile 37 016 008 006 038
33
Table 6 Characteristics of the Participants Naturalistic Driving By System Condition
System Variable N Mean Standard Deviation Minimum Maximum
Trips 12 11683 4856 3100 21000 Mean Backing Maneuvers per Trip 12 104 020 061 135
None Mean Distance per Trip (mi) 12 1014 397 430 1810 Backing Maneuvers 12 12400 5629 1900 22300 Sum Miles 12 112771 51986 27075 204278 Mean Backing Maneuvers per Mile 12 012 006 007 026 Trips 12 15017 6163 6400 27200 Mean Backing Maneuvers per Trip 12 112 007 103 128
RV Mean Distance per Trip (mi) 12 833 395 278 1562 Backing Maneuvers 12 16792 7216 7600 31800 Sum Miles 12 115371 51354 29419 191495 Mean Backing Maneuvers per Mile 12 017 009 007 038 Trips 13 15500 4187 11100 22800 Mean Backing Maneuvers per Trip 13 126 023 079 160
RV amp Mean Distance per Trip (mi) 13 825 531 417 2404 RPS Backing Maneuvers 13 19477 6017 8800 28600
Sum Miles 13 120042 70334 65304 341403 Mean Backing Maneuvers per Mile 13 019 008 006 030
52 Characteristics of Naturalistic Backing Maneuvers
Table 7 summarizes the characteristics of the naturalistic backing maneuver events Of the 6145 recorded backing maneuvers observed during this study 72 percent had durations of 5 to 20 seconds A large majority of backing maneuvers 78 percent involved only one reverse movement The other 22 percent of backing maneuvers involved multiple reverse movements eg the driver brought the vehicle to a stop during the backing maneuver or engaged in parallel parking
Average backing speed during the naturalistic maneuvers 226 mph was essentially identical to that observed in the staged baseline and obstacle events Maximum backing speed was correlated with backing time (r=77) and backing distance (r=73)
Table 7 Characteristics of the 6145 Recorded Backing Maneuver Events Variable Mean Standard Deviation
Distance (ft) 3397 2596 Time Backing (s) 1008 644 Average Backing Speed (mph) 226 089 Maximum Backing Speed (mph) 364 151 Maximum Lateral Acceleration (g) 008 004 Maximum Long Acceleration (g) 009 004 Number Reverse Movements 134 081
34
The time between when the drivers shifted into reverse and the vehicle began moving backwards was noted for naturalistic backing maneuvers that had an interpretable time value (38 percent of maneuvers) The data summarized in Table 8 indicate a trend that agrees with the baselineobstacle event finding The time between shifting and rearward movement was longer for drivers with RV and RV amp RPS than for drivers with no system The longer time intervals between shifting into reverse and rearward motion for drivers with a rearview video system may be attributable to a delay in the appearance of the RV image that was typical for the specific makemodel of test vehicle used in this study Separate testing found this delay to have an average duration of 644 seconds when reversing immediately after vehicle ignition (the delay was shorter when backing after the vehicle had been running for a period of time) This RV display delay issue is discussed further in Section 81
Table 8 Distribution of Time Between Shift to Reverse and Beginning of Backing by Backing System Condition (Naturalistic Backing Events)
Quantile None (576)
RV (862)
RV amp RPS (948)
100 Max 2577 2944 3156 99 1751 1707 2162 95 981 1007 1021 90 633 711 709
75 Q3 328 408 428 50 Median 209 239 258 25 Q1 158 169 173
10 121 136 135 5 103 115 116 1 094 082 100
0 Min 042 062 076
Table 9 presents mean maximum backing speeds for naturalistic backing events The overall mean value for maximum backing speed was 37 mph which was consistent with the baseline and event trials
With respect to the interpretation of this trend one hypothesis from the outset was that drivers with RV systems might choose to back faster than drivers without such systems The lack of consistency between the lsquoRVrsquo and lsquoRV amp RPSrsquo system conditions and the fact that the mean for the lsquoNonersquo system condition is between these two extremes suggests that such an overall effect does not exist However no statistical testing was performed Moreover the discrepancy between the lsquoRVrsquo and lsquoRV ampRPSrsquo means is likely to be an artifact of the fact that different subjects were involved and that they drove in different situations This variance added noise to all comparisons made across systems
35
Table 9 Mean Maximum Backing Speed by System Condition (Naturalistic Backing Events)
N Mean Maximum Backing Speed (mph)
Standard Deviation
None 1489 37069275 14144236 RV 2016 39878938 15622352 RV amp RPS 2532 34505742 13884731
Table 10 summarizes the quantiles for the overall distribution of maximum backing speed (from 6037 naturalistic backing events) Maximum and minimum values are shown along with some other percentile values Table 11 shows the extreme values of maximum backing speed for naturalistic backing maneuvers with the absolute fastest speed being of particular interest These values represent observed values of maximum backing speed from individual backing maneuvers These data show that only a few backing segments had maximum speeds greater than 10 mph While the distribution of maximum backing speed was not strictly normal (since zero is boundary they were positively skewed) they were not bimodal Thus they did not reveal an obvious split between parking spaces and garages or short versus long backs Table 12 provides descriptive statistics for backing maneuver duration average and maximum backing speed and backing distance for driveway garage and parking space backing maneuvers
Table 10 Quantiles of Overall Distribution of Maximum Backing Speed (from 6037 Naturalistic Backing Events)
Quantiles (Definition 5) Quantile Estimate 100 Max 14291 99 7542 95 6275 90 5633 75 Q3 4649 50 Median 3532 25 Q1 2581 10 1899 5 1572 1 1160 0 Min 1001
36
Table 11 Extreme Values of Maximum Backing Speed (from 6037 Naturalistic Backing Events)
Extreme Observations Lowest Highest
1001 10979 1010 12545 1013 13414 1013 13684 1015 14291
Table 12 Descriptive Statistics for Backing Maneuver Characteristics by Maneuver Starting Location
Starting Location N Variable N Mean Std Dev Minimum Maximum
Driveway 1303
Backing Duration (s) Average Backing Speed (mph) Maximum Backing Speed (mph) Distance Backed (ft)
1287 1287
1287
1287
108659 27450
43643
440675
56975 08609
13321
271696
032 071
1024
0344
4892 8359
10665
372473 Backing Duration (s) 1138 166410 64863 142 4286
Garage 1154 Average Backing Speed (mph) Maximum Backing Speed (mph)
1138
1138
24573
45140
07923
14804
0796
1015
5487
8934
Distance Backed (ft) 1138 586050 255014 1918 14477
Parking Space 2198
Backing Duration (s) Average Backing Speed (mph) Maximum Backing Speed (mph) Distance Backed (ft)
2170 2170
2170
2170
75454 20253
30935
213259
31119 06568
102858
90866
036 0756
101
0421
5281 5495
7181
255693
53 Naturalistic Backing Crashes
A small number of minor crashes were observed during the naturalistic portion of this study These incidents and their conditions are summarized in Table 13 Five drivers were involved in a total of 6 collisions Ironically 5 of the 6 incidents involved drivers whose vehicles were equipped with an RV system and 4 of those 5 also were equipped with a RPS The obstacles involved in these incidents were likely to be visible in an RV system display
37
Table 13 Naturalistic Crashes Observed Subject Number
System Condition Situation Description
1 RV amp RPS Backing out of driveway Struck trash can 8 RV amp RPS Parking Backed into a vehicle while parking 8 RV amp RPS Unknown Struck unknown object while backing in a gravel lot 15 None Backing out of driveway Struck trash can poodle on lap 24 RV amp RPS Parking Backed into a vehicle while parking
28 RV Parking Struck wheeled cooler while backing out of parking space
54 Eye Glance Behavior During Naturalistic Backing Events
This section presents data describing eye glance data during naturalistic backing maneuvers with a focus on reporting driversrsquo use of (ie glances to) rearview video systems Glance locations noted for these data were as follows
Over left shoulder (Left Shoulder) Out left window or at left mirror (Left) Instrument panel Forward (out windshield) Rearview mirror RV display or center console (consolevideo) Out right window or at right mirror Over right shoulder Other
The driver was considered to be looking at the noted location if their eyes were determined to be focused on that location regardless of their body orientation
In the figures presented in this section the lsquootherrsquo glance category represents a significant portion of the glances Typically these glances represent non-driving-related behavior for example when a driver looks down to the passenger seat to the floor or to his or her lap For the most part they do occur during the backing maneuver and thus give a rough estimation of the percentage of time devoted to potentially distracting activities during backing
During naturalistic driving an average of 10 percent of glances was to the RV display Individual driversrsquo percentages of glances to the RV display varied between 2 percent and 26 percent These data along with glance percentages for other glance locations are shown in Figure 22
38
Left S
hould
er Left
Forward
Inst P
anel
Rearvi
ew M
irror
Conso
leVide
o Righ
t
Right S
hould
er
Other
0
5
10
15
20
25
30 Pe
rcen
t None RV RV amp RPS
Figure 22 Mean Percentage of Glances by Glance Location and System Condition Note Based on 1 value per subject
Overall drivers looked at least once at the RV display on approximately 65 percent of backing events and looked more than once at RV on approximately 40 percent of backing events Table 14 summarizes the number of glances to the RV display per naturalistic backing maneuver by system condition These data show that participants in the RV amp RPS condition made no glances per trial to the RV display more often than those in the lsquoRV onlyrsquo condition The data also show that participants in the RV amp RPS condition made four or more glances per trial to the RV display less often than those in the lsquoRV onlyrsquo condition This trend of more participants with lsquoRV onlyrsquo looking at the RV display than those with RV amp RPS may indicate that participants in the RV amp RPS condition were relying on the sensors to alert them of an obstacle However differences in the particular backing situations between driver groups (ie differential exposure) or individual differences in backing habits between groups may have contributed to this difference
Table 14 Number of Glances to the RV Display Per Backing Maneuver by System Condition
0 1 2 3 4+ Total RV 274
(3285) 197
(2362) 125
(1499) 74
(887) 164
(1966) 834 100
RV amp RPS 389 (3898)
219 (2194)
152 (1523)
95 (952)
143 (1433)
999 100
Total 663 (3619)
416 (2271)
277 (1512)
169 (922)
307 (1676)
1832 100
The following figures illustrate glance behavior data from naturalistic backing events These figures include data for all glances except the very first segments of video data files before the subject begins to focus on the driving task In essence they all show
39
increased glance activity to the consolerear video area when a rear video system is available For example Figure 23 shows that on average drivers made less than one (M = 081) glance to the consolevideo location when no video (System = None) display is present versus 217 (RV) and 189 glances (RV amp RPS) when the RV systems are present In this and the following figures there also is a trend toward slightly more use of the rearview mirror when no backing system is present This difference is not nearly as large however as the differences in glance behavior to the consolevideo area suggesting that drivers do not simply trade consolevideo glances for rearview mirror glances
0 05
1 15
2 25
3 35
4 45
Left Sh
oulde
r Le
ft
Forward
Inst Pa
nel
Rearvi
ewMirro
r
Conso
leVide
o Righ
t
Right S
hould
er
Other
Num
ber o
f Gla
nces
None RV RV amp RPS
Figure 23 Mean Number of Glances Per Backing Maneuver by Glance Location and System Condition
A similar pattern is evident for Figure 24 that shows the total glance time by location and backing system While drivers with no system looked at the consolevideo area for less than one second (M = 090) drivers with other systems looked on average for 289 and 184 seconds respectively
With all of these comparisons it must be noted that because different drivers were included in each backing system group comparisons are based on differential exposure Despite these differences in exposure it appears that the tendency to look more often and for more time at the consolevideo area supports the conclusion that drivers make regular use of these systems
40
0
1
2
3
4
5
6
Left Sh
oulde
r Le
ft
Forward
Inst P
anel
Rearvi
ewMirro
r
Conso
leVide
o Righ
t
Right Sh
oulde
r
Other
Tota
l Gla
nce
Tim
e (s
)
None RV RV amp RPS
Figure 24 Mean Total Glance time by Glance Location and System Condition
Figure 25 shows that driversrsquo glances to the consolevideo area were on average considerably longer for participants in the RV and RV amp RPS conditions than for those in the ldquono systemrdquo condition Noteworthy also is the observation that the mean durations of driversrsquo glances to other locations do not appear to differ as much as the durations to the consolevideo area
0 02 04 06 08
1 12 14 16
Left Sh
oulde
r Le
ft
Forward
Inst Pan
el
Rearvi
ewMirro
r
Conso
leVide
o Righ
t
Right Sh
oulde
r
Other
Gla
nce
Dur
atio
n (s
)
None RV RV amp RPS
Figure 25 Mean Glance Duration by Glance Location and System Condition
Figure 26 illustrates the same data in terms of the percentage of glance time directed to each of the locations Drivers with no system devoted 33 percent of the recorded
41
glance time to looking at the consolevideo while those with RV and RV amp RPS systems devoted 116 and 75 percent respectively to this area Percentages of glances to other areas remain more consistent and this is remarkable given the wide variety of backing situations and possible differences between these situations by backing system group The results suggest that glance behavior during backing is relatively consistent across backing situations
0 002 004 006 008
01 012 014 016 018
02
Left Sho
ulder Le
ft
Forward
Inst P
anel
Rearvi
ewMirr
or
Conso
leVide
o Righ
t
Right S
hould
er
Other
Perc
ent1
00
None RV RV amp RPS
Figure 26 Mean Percentage of Glance Time by Location and System Condition
541 Eye Glance Behavior During Backing as a Function of Environmental Conditions
Starting location provides one classification of backing situations The first level of characterization of backing maneuvers was based on maneuver length The following table provides descriptive characteristics for the set of backing events separated into Long versus Short backing maneuver length categories No strict criterion was used for this categorization As is evident from the ranges of values there is overlap in the two categories Longer backs were indeed longer in duration and in distance on average They were associated with higher average and maximum backing speeds Figure 27 illustrates percent eye glance time by eye glance location and maneuver length
42
Table 15 Descriptive Characteristics of Naturalistic Backing Maneuvers by Maneuver Length
Backing Distance
N Obs Variable N Mean
Std Dev Minimum Maximum
Long 1417 Backing Duration (s) 1415 153465 61853 223 5281 Average Backing Speed (mph)
1415 27405 09289 0847 9868
Maximum Backing Speed (mph)
1415 46735 14237 1059 14291
Distance Backed (ft) 1415 591853 273475 4009 372473 Short 3941 Backing Duration (s) 3846 83300 48539 032 4286
Average Backing Speed (mph)
3846 21456 07677 071 7013
Maximum Backing Speed (mph)
3846 33773 13145 101 12545
Distance Backed (ft) 3846 260564 181645 0344 190239
0 002 004 006 008
01 012 014 016 018
Left Sho
ulder
Forward
Inst Pan
el Le
ft
Rearvi
ewMirro
r
Other
Right Sh
oulde
r
Right
Conso
leVide
o
Perc
ent1
00
Long Short
Figure 27 Percentage Glance Time by Eye Glance Location and Maneuver Length
Naturalistic backing maneuvers were also characterized by the degree of visibility surrounding the vehicle at the time of the maneuver If the area was clear of visual obstructions and it was possible to see vehicles and other objects coming from a variety of directions then the visibility was characterized as being ldquoopenrdquo If the area around the vehicle was surrounded by trees buildings or other objects that obstructed visibility then the visibility was characterized as ldquoclosedrdquo Figure 28 illustrates results for percent glance time by eye glance location and visibility
43
0 002 004 006 008 01
012 014 016 018 02
Left Sho
ulder
Forward
Inst Pan
el Le
ft
Rearvi
ewMirro
r
Other
Right Sho
ulder
Right
Conso
leVide
o
Perc
ent1
00
Closed Open
Figure 28 Percentage Glance Time by Location and Visibility
All naturalistic backing maneuvers were classified as starting from a garage driveway parking space or other Figure 29 presents results for percent glance time by eye glance location and backing maneuver starting location
0 002 004 006 008
01 012 014 016 018
02
Left Sho
ulder
Forward
Inst Pan
el Le
ft
Rearvi
ewMirr
or
Other
Right Sh
oulde
r
Right
Conso
leVide
o
Perc
ent1
00
Driveway Garage Parking Space
Figure 29 Percentage Glance Time by Starting Location and Glance Location
Figure 30 shows percentages of glance time to each location as a function of the starting location and system condition These figures represent within-subject comparisons
44
Figure 30 Percent Glance Time by Starting Location and System Condition
45
The second environmental variable considered was the visibility surrounding the vehicle at the time of the back which was coded either as Closed (eg narrow driveway) or Open (eg parking lot) Figure 31 presents comparisons by system condition The data show that drivers in the ldquono systemrdquo condition made greater adaptations to their glance behavior based on the quality of visibility surrounding their vehicle For example ldquono systemrdquo condition participants show bigger differences in the percent of time spent glancing to the right and right shoulder and less over the left shoulder in closed conditions versus open conditions Also for closed conditions drivers with no RV system also appear to glance over their right shoulders approximately 7 percent more than those with lsquoRV onlyrsquo and approximately 12 percent more than those with RV amp RPS Drivers in the RV amp RPS condition looked over their left shoulders in closed conditions approximately 9 percent more than those with RV or no system Overall differences between system conditions appeared smaller for open conditions The data show comparatively low usage of the center rearview mirror for all system conditions regardless of the surrounding visibility
46
Figure 31 Percent Glance Time by Visibility No System
47
The third environmental coding classification was the distance driven in the backing maneuver or backing maneuver length Maneuvers were coded as ldquolongrdquo or ldquoshortldquo Figure 32 examines whether there were any differences in percentage of time spent looking at different locations for long versus short backing maneuvers as a function of system condition Long maneuvers appear to correspond to more time spent glancing over the left shoulder and to the right particularly for the no system and RV amp RPS conditions As with the prior analyses these data show comparatively low usage of the center rearview mirror for all system conditions regardless of maneuver length
48
Figure 32 Percent Glance Time by Backing Maneuver Length and System Condition
49
55 Driversrsquo Activities During Naturalistic Backing Events
This section provides descriptive statistics on activities performed by drivers during naturalistic backing maneuvers Table 16 lists the activities observed during 5076 of the 6145 naturalistic backing maneuvers that were able to be coded (ie video data files were available for review) The frequency with which these activities were observed was noted If the driver performed multiple activities during a backing maneuver each activity was noted
Overall 61 percent of backing maneuvers involved the driver maneuvering the vehicle without performing any additional activities The two most frequent activities during backing were pushing a garage door remote (1336 percent) and talking to a passenger (1277 percent)
Table 16 Driversrsquo Activities During Backing Events
Activity Frequency Percent
None Just Backing 3115 6137 Pushing Garage Remote 673 1326 Talking With Passenger 648 1277 Other 239 471 Using Cell Phone 157 309 Securing Seat Belt 133 262 Touching Passenger Or Dog 69 136 Unknown 42 083
Total 5076 10000
Table 17 highlights observed instances of multiple activities during backing The most common combination of identified activities was pushing a garage door remote while talking with a passenger
50
Table 17 Summary of Observed Instances of Multiple Activities During Backing First Recorded Driver Activity Second Recorded Driver Activity Count Percent
Using Cell Phone Other 4 07874 Using Cell Phone Pushing Garage Remote 20 3937 Using Cell Phone Securing Seat Belt 3 05906 Other Pushing Garage Remote 24 47244 Other Securing Seat Belt 1 01969 Other Touching Passenger Or Dog 3 05906 Other Talking With Passenger 21 41339 Pushing Garage Remote Using Cell Phone 1 01969 Pushing Garage Remote Other 77 151575 Pushing Garage Remote Securing Seat Belt 15 29528 Pushing Garage Remote Touching Passenger Or Dog 14 27559 Pushing Garage Remote Talking With Passenger 74 145669 Securing Seat Belt Using Cell Phone 2 03937 Securing Seat Belt Other 16 31496 Securing Seat Belt Pushing Garage Remote 59 116142 Securing Seat Belt Touching Passenger Or Dog 2 03937 Securing Seat Belt Talking With Passenger 18 35433 Touching Passenger Or Dog Other 4 07874 Touching Passenger Or Dog Pushing Garage Remote 10 19685 Touching Passenger Or Dog Talking With Passenger 3 05906 Talking With Passenger Other 49 96457 Talking With Passenger Pushing Garage Remote 84 165354 Talking With Passenger Securing Seat Belt 2 03937 Talking With Passenger Touching Passenger Or Dog 2 03937
508 100
Table 18 summarizes driver activities during backing as a function of system condition The data show that drivers in the RV amp RPS condition were slightly less likely to engage in any other activity while backing Conducting statistical testing to demonstrate that participants in the RV amp RPS condition were less likely to engage in secondary activities while backing is inappropriate because of the multiple backing events included for each driver in the analyses Statistical testing would assume that all backing events were from different drivers This could overstate the findings because these data represent multiple instances of the tendencies of the small sample of drivers used in the study Nevertheless it is fair to say without statistical backing that the RV amp RPS drivers were more likely not to engage in secondary activities while backing than drivers with other systems and that the RV drivers were less likely than drivers with no system to engage in secondary activities while backing
51
Table 18 Driversrsquo Primary Activity By System Condition
Driver Activity System
TotalFrequency
Column Percent None RV RV amp
RPS
None Just Backing 656 5169
223 1757
905 6001
217 1439
1554 6759
233 1013
3115 6137
673 1326
Pushing Garage Remote
Talking With Passenger 185 1458
191 1267
272 1183
648 1277
Other 72 567
69 458
98 426
239 471
Using Cell Phone 29 229
38 252
90 391
157 309
Securing Seat Belt 28 221
60 398
45 196
133 262
Touching Passenger Or Dog 41 323
21 139
7 03
69 136
Unknown 35 276
7 046
0 0
42 083
Total 1269 1508 2299 5076 100
56 RPS Use
During the course of the experiment five participants made unsolicited comments to members of the research staff about turning off the RPS on their vehicle One person reported that he just did not use it Another person stated that she did not know that the button had to be pushed for the RPS to work (the vehicle was equipped with a button for turning off the RPS) Three participants stated that they frequently turned the RPS off when driving through a restaurant drive-through lane due to nuisance alarms (ie audible notifications of the presence of vehicles that the driver is already aware of) Lastly a sixth participant was observed having the RPS on their vehicle switched off during their initial meeting visit When this participant returned for their final meeting visit the RPS was observed to be switched on In summary half of the participants in the RV amp RPS system condition stated or were observed to have turned the RPS on their vehicle off at least some of the time
52
60 RESULTS INITIAL lsquoBASELINE EVENTrsquo AND FINAL lsquoOBSTACLE EVENTrsquo
This section presents results for the backing maneuvers occurring at the end of participantsrsquo initial and final test drives The backing maneuver occurring at the end of the final test drive involved presentation of an unexpected obstacle and therefore is at times referred to here as the ldquoobstacle eventrdquo The initial test drive backing maneuver is also referred to as the ldquobaseline eventrdquo
61 Backing Behavior During Baseline and Obstacle Events
In an effort to assess how quickly drivers initiate a backing maneuver the time between when the drivers shifted into reverse and the vehicle began moving backwards was noted for the baseline and obstacle events Figure 33 illustrates these times as a function of system condition Analysis results showed no significant difference due to system condition or trial (baseline versus obstacle event) However the somewhat longer times seen for the RV and RV amp RPS conditions may indicate that drivers were waiting for the RV display image to appear
Figure 33 Mean Time (plusmnSD) Between Shifting into Reverse Gear and the Beginning of Rearward Motion (Baseline and Obstacle Events)
Mean backing speed during the baseline and obstacle events was also determined Figure 34 illustrates mean backing speeds for baseline trials and all obstacle event trials in which the driver did not see the obstacle and stop Overall mean backing speed in these staged events was 225 mph No significant difference between system condition or trial (baseline versus obstacle event) was observed
53
Figure 34 Mean Backing Speed (plusmnSD) by System Condition (Baseline and Obstacle Events)
Figure 35 and Table 19 present mean maximum backing speeds for the baseline and event trials Trials in which the participant stopped the vehicle in the middle of the maneuver were removed from these data The mean maximum backing speed mean of 37 mph is fairly constant across systems
0
05
1
15
2
25
3
35
4
45
5
None RV RV amp RPS
Mea
n M
axim
um B
acki
ng S
peed
(mph
)
Figure 35 Mean Maximum Backing Speed (plusmnSD) by System Condition (Baseline and Obstacle Events)
54
Acc
eler
atio
n (g
)
012
011
01
009
008
007
006
005 None RV RV amp RPS
Figure 36 Maximum Backing Acceleration (plusmnSD) by System (Baseline and Obstacle Events)
Table 19 Mean Maximum Backing Speed by System Condition (Baseline and Obstacle Events)
System Mean Maximum Backing Speed (mph) Std Dev
None 37683478 06027962 RV 37020556 07232739 RV amp RPS 37695238 05924636
Figure 362 presents means for the maximum acceleration during the baseline and obstacle event backing maneuvers Maximum acceleration did not differ significantly as a function of system condition
62 Obstacle Event Outcome Results
Results for the outcomes of the staged obstacle scenario are presented in Table 20 Overall 81 percent of participants crashed in this staged scenario Combining the results for participants with lsquoRV onlyrsquo with results of those with RV amp RPS shows that a total of 72 percent of participants with RV crashed as seen in Figure 37 Participants with RV crashed significantly less than those without RV (χ2(2)=695 p=03) The difference between the percent of crashes for participants with lsquoRV onlyrsquo and RV amp RPS while seemingly large was not significant (χ2(1)=213 p=14) However it was found that if hypothetically the sample size was doubled with the same outcomes then the difference between those two conditions would become statistically significant
55
100
90
80
70
60
50
40
30
20
10
0 None RV RV amp RPS RV and RV amp
RPS Combined
Perc
ent C
rash
es
Figure 37 Percent Crashes by System Condition for the Staged Obstacle Event
Table 20 Staged Obstacle Event Outcomes System N Number that Crashed Percent Crashed
No system 12 12 100 RV only 12 7 58 RV amp RPS 13 11 85
Total 37 30 81
Data illustrated in Figure 38 indicate whether participants driving a vehicle equipped with RV actually looked at the RV display during the obstacle event scenario Overall 16 of 25 participants (64 percent) glanced at the RV display during the obstacle event backing maneuver Trends in these data suggest that participants with lsquoRV onlyrsquo glanced at the RV display slightly more than those in the lsquoRV amp RPSrsquo condition
56
0
1
2
3
4
5
6
7
8
9
10
RV only RV amp RPS Total
Did Not Look Looked Once Initially Looked Multiple Times Looked After Crashing
Figure 38 Summary of Participantsrsquo Glances to the Rearview Video System During the Obstacle Event
Data presented in Figure 39 show that participants who glanced at the RV display multiple times during the backing maneuver tended to avoid a crash more often than those who glanced only once initially or not at all All participants who failed to look at the RV display or who looked once at the beginning of the maneuver but never looked again crashed since the obstacle was not present until the vehicle had moved 3 feet rearward
57
0
1
2
3
4
5
6
7
8
9
10
Did Not Look Looked Once Initially Looked Multiple Times
Looked After Crashing
Num
ber o
f Cra
shes
Figure 39 Obstacle Event Crashes as a Function of Rearview Video Glances
Crashes involving participants who made multiple glances to the RV display may be attributable to a delay in the appearance of the RV image that was typical for the specific makemodel of test vehicle used in this study As noted previously separate testing found this delay to have an average duration of 644 seconds when reversing immediately after vehicle ignition (the delay was shorter when backing after the vehicle had been running for a period of time) This RV display delay issue is discussed further in Section 81
Table 21 presents hypothetical results showing what the outcomes might have been a) had the obstacle been present at the start of the maneuver and b) had the RV display delay been less than 1 second in duration These hypothetical results were determined through review of participantsrsquo sequences of glances during the obstacle event in consideration with the timing of the appearance of the RV image The figures in Table 21 assume that if the driver had glanced at the RV display at the start of the maneuver then the driver would have successfully identified the presence of the obstacle through that RV display glance
58
Table 21 Hypothetical Staged Obstacle Event Outcomes Hypothetical NumberPercent That May Have Crashed Hadhellip
System N Number
that Crashed
The Obstacle Been Present at the Start of
the Maneuver
The RV Display Delay Been lt 1
Second in Duration Both
Occurred
No system 12 12 12 (100) 12 (100) 12 (100) RV only 12 7 5 (417) 7 (583) 5 (417) RV amp RPS 13 11 8 (615) 9 (692) 6 (461) Total 37 30 25 (676) 28 (757) 23 (622)
Table 22 highlights obstacle event outcome (ie crash) results as a function of whether or not the RPS detected the obstacle Four out of five or 80 percent of the cases in which the RPS detected the obstacle and provided a visual and audible warning alert the participant still crashed Of the four who received RPS warnings and crashed one driver did not look at the RV display one driver looked once initially (before the obstacle was present) and two looked more than once but the RV image had not displayed yet (due to RV display delay) It should be noted that while the RV display exhibited a delay in appearance of the video image the RPS worked independently and did not exhibit a similar delay
Table 22 Obstacle Event Outcomes as a Function of RPS Detection System N Detected Object Did Not Detect Object
RV amp RPS 13 5 (385) 8 (615) Number That Crashed 11 4 7
The one person who did not receive a RPS warning alert in the obstacle event and did not crash had observed the obstacle in the RV display and was able to stop without striking it The RPS appeared to be unable to detect the obstacle if it was located at the centerline of the vehicle Thus those participants who backed out of the garage on an off-center path were the ones who tended to receive RPS warning alerts This observation agrees with RPS detection performance results presented in Section 21
63 Eye Glance Behavior During Baseline and Obstacle Events
This section presents results for eye glance behavior observed during baseline and obstacle events Glance locations noted for these data were as follows
Over left shoulder (Left Shoulder) Out left window or at left mirror (Left) Instrument panel Forward (out windshield) Rearview mirror RV display or center console (consolevideo) Out right window or at right mirror
59
Over right shoulder Other
The driver was considered to be looking at the noted location if their eyes were determined to be focused on that location regardless of their body orientation
Data presented in Table 23 summarize glances to the RV display for baseline and obstacle events Note that data are from the first 12 seconds of backing (after car began to move as judged visually) Note further that these data may include more than 12 seconds of glance behavior This would occur when the driver began backing while in the middle of a glance In these situations the entire glance duration was included These data have an N of 46 because they represent two trials for each of the 25 participants with a rearview video system in their vehicle (12 who had lsquoRV onlyrsquo and 13 who had lsquoRV amp RPSrsquo) minus two participants for which eye glance data was not available due to problems with data recording equipment
Table 23 Summary of Participantsrsquo Glances to the Rearview Video System During the Baseline and Obstacle Events
Dependent Variable N Mean Std Dev Min Max Number of Glances to RV 46 141 145 000 600 Total Number of Glances 46 1050 328 400 1800 Percentage of Glances to RV 46 1400 1300 000 5000 Percentage of Time Viewing RV 46 1500 1900 000 8100 Total Glance Time (s) 46 1174 153 577 1444
On average drivers made 1050 distinct glances during a backing event that lasted 1174 seconds Of these glances 141 were to the RV display This value ranged between 0 and 60 The percentage of time spent looking at the RV display was 15 percent (SD=19 range 0 to 81) Drivers with RV made 13 to 14 percent of glances to the RV display during initial phases of backing
With respect to individual drivers one subject (S2) viewed the RV display for 63 percent and 81 percent of the two experimental backing trials although the latter number is undoubtedly inflated by the fact that the object was seen in the rear video Thus the baseline trials may be better representations of uneventful backing Following the highest value for proportion of time spent viewing the RV display the next highest values were 40 percent (S37) 37 percent (S7) and 27 percent (S34)
The following table presents the number of subjects for each combination of Trial (baseline or event) System (None RV RV amp RPS) and Glance category (0 1 or 2+)
60
Table 24 Number of Glances to the ConsoleRV Display by System and Baseline or Event Trial Glances to ConsoleVideo System 0 1 2+ Total subjects Baseline None 10 1 0 11
RV 5 3 4 12 RVamp RPS 2 5 4 11
Event None 11 1 0 12 RV 3 4 4 11 RV amp RPS 4 4 4 12
If the two systems with RV are combined the results shown in Table 25 are obtained
Table 25 Number of Glances to the ConsoleRV Display by RV Presence and Baseline or Event Trial
Glances to ConsoleVideo System 0 1 2+ Total subjects
Baseline None 10 1 0 11 RV combined 7 8 8 23
Event None 11 1 0 12 RV combined 7 8 8 23
Thus for both baseline and event trials 16 of 23 (70 percent) of the subjects looked at least once at the consolevideo area The corresponding values for baseline trials were 1 out of 11 (9 percent) and 1 out of 12 (8 percent)
These data are remarkably consistent in the aggregate however when the glance behavior of each subject was considered it became apparent that there was some inconsistency in individual subjectsrsquo glance behavior between baseline and event conditions Specifically
bull 6 subjects were consistent between baseline and event trials in the specific number (1 or 2+) of recorded glances to the consolevideo
bull 3 subjects were consistent in not glancing at consolevideo across trials bull 4 subjects were consistent in devoting some glances to the consolevideo but
the number differed between baseline and event trials bull 8 subjects were not consistent each of these had one or more glances on one
condition but none in the other condition bull (4 subjects had eye glance data from only one of the two conditions)
These data can be summarized in several ways
1 For the event trials 70 percent (16 of 23) of drivers looked at least once at the video display The corresponding percentage for the baseline trials was also 70 percent
61
2 When we consider driversrsquo behavior on both trials together we find that 18 (86 percent of the 21 drivers for which both sets of glance data were available) drivers looked at the consolevideo area on at least one of the two trials (10 on both 8 on one or the other) while 3 drivers looked on neither trial
3 When we consider only consistency of behavior across the two trials we find that 13 drivers were consistent in their behavior (10 in looking 3 in not looking) while 8 were inconsistent in their behavior (looked on one trial but not the other)
Figure 40 shows the mean number of glances per backing trial (baseline and obstacle events) for the first 12 seconds of backing by glance location and system condition The start of backing was determined visually (ie manual review of video-recorded data) for baseline and obstacle event trials Overall drivers with no system made slightly more glances per maneuver (M=119 SD=34) compared to those drivers with RV (M=99 SD=34) and RV amp RPS (M=95 SD=50) systems Relative to those with RV systems drivers with no RV system made more glances over the left shoulder forward left and right Drivers with no RV system did not look more frequently at the rear view mirror Drivers with RV made 13-14 percent of glances to the RV display during the initial phases of backing (see Figure 39)
0
05
1
15
2
25
3
Left S
hould
er Left
Forward
Inst Pa
nel
Rearvi
ewMirro
r
Conso
leVide
o Righ
t
Right Sh
oulde
r
Other
Mea
n N
umbe
r of G
lanc
es
None RV RV amp RPS
Figure 40 Mean Number of Glances Per Trial by Glance Location and System (Baseline and Obstacle Events)
Summary data for glance frequency and mean percentage of glances by location (see Figure 41) reveal similar patterns Drivers glanced predominantly forward left or right during backing Drivers with no RV system glanced more often over their left shoulders Drivers with RV systems directed almost 15 percent of glances during the first 12 seconds of backing to the RV system display These data show an extremely low percentage of glances to consolevideo among drivers in the ldquono systemrdquo condition which differs from naturalistic findings (presented in Section 50) and probably reflects
62
Left S
hould
er Left
Forward
Inst P
anel
earvi
ew M
irror
Conso
leVide
o Righ
t
Right S
hould
er
Other
0
5
10
15
20
25
Per
cent None
RV RV amp RPS
R
the fact that the drivers had no need to look at the console (eg for radio or HVAC) while backing out of the garage in the staged obstacle event scenario
Figure 41 Mean Percentage of Glances by Glance Location and System Condition (Baseline and Obstacle Events)
Figure 42 presents eye glance durations by glance location and system condition for baseline and obstacle events Mean durations were computed first by subject For drivers with no RV system results indicate slightly shorter glances to the consolevideo and slightly longer glances to the rearview mirror Glances over the right shoulder were slightly shorter for those in the no system condition
0
05
1
15
2
25
Left Sh
oulde
r Le
ft
Forward
Inst P
anel
Rearvi
ewMirr
or
Conso
leVide
o Righ
t
Right S
hould
er
Other
Gla
nce
Dur
atio
n (s
)
None RV RV amp RPS
Figure 42 Mean Glance Duration by Glance Location and System Condition (Baseline and Obstacle Events)
63
Figure 43 illustrates the mean percentage of total glance time by glance location and system condition for the baseline and obstacle events Independent of system presence drivers spent over 25 percent of backing time looking over their right shoulder and 15 percent of time looking toward the right mirror or window
0
005
01
015
02
025
03
035
Left S
hould
er Left
Forward
Inst Pan
el
Rearvi
ewMirro
r
Conso
leVide
o Righ
t
Right S
hould
er
Other
Perc
ent1
00
None RV RV amp RPS
Figure 43 Mean Percentage of Total Glance Time by Glance Location and System Condition (Baseline and Obstacle Events)
64
Glance Location No System (12) RV (12) RV amp RPS (13) At the side mirrors 75 6667 615 At the center rearview mirror 75 8333 769Over my shoulder 9167 9167 923 At the rearview video display 8333 615At the backing aid display 231
Note Multiple responses to this question were allowed
70 QUESTIONNAIRE RESULTS
This section presents summaries of selected questionnaire items A full set of questionnaire responses is provided in Appendices E through G
Immediately after experiencing the obstacle event participants were asked to complete a questionnaire tailored to their system condition The first question asked whether the participants had anticipated the obstacle event ie were they genuinely surprised All participants in all system conditions reported that they did not anticipate the obstacle event
Participantsrsquo responses regarding where they look primarily to determine whether the area behind the vehicle is clear when backing showed a fairly equal distribution of reported glances to the side mirrors center rearview mirror over their shoulders and at the rearview video display (when present) However as shown in Table 26 only 3 of 13 (23 percent) drivers of vehicles with a RPS system stated that they used RPS information
Table 26 Questionnaire Responses Regarding Where Drivers Look to Determine Whether the Area Behind Their Vehicle is Clear Prior to Backing
One participant in the lsquoRV onlyrdquo condition and three participants in the lsquoRV amp RPSrsquo condition stated that they rarely or never look at the rearview video display when backing Five of thirteen participants with RV amp RPS stated that they rarely or never look at the backing aid display when backing
When asked why their vehicle did not have an RV or RPS system a majority of participants in the ldquono systemrdquo condition gave three responses Thirty-three percent said that it never occurred to them to look for an RV system and 58 percent responded similarly in regard to a RPS A third of participants reported that the RV or RPS was packaged with options that they were not interested in purchasing Nearly 42 percent of participants in the ldquono systemrdquo condition reported that an RV system was not an option on their vehicle while 25 percent reported that a RPS was not an option (Note that since RV amp RPS were available for their vehicle this indicates a lack of awareness of these systems) Table 27 presents a complete summary of responses
65
Table 27 Percent Responses Regarding Why ldquoNo Systemrdquo Participants Did Not Choose To Purchase a Backing Aid System
Response Choices RV RPS It never occurred to me to look for one when I was buying the vehicle 333 583 It was not an option on my vehicle 417 250 I thought the (system) would be a nuisance or distraction 83 0 I wouldnrsquot trust the (system) 83 0 I donrsquot need a (system) because I have good backing skills 83 83 The (system) was not worth the extra cost 83 167 The (system) was only available with other options that I didnrsquot want 333 333 I was not the person who purchased or made the decision to purchase this vehicle 0 0 No response 0 83
As noted in Table 28 all 12 participants in the RV system condition reported that they would want RV on their next vehicle Twelve of 13 RV amp RPS participants reported that they would be repeat customers of a RPS Two-thirds of participants in the ldquono systemrdquo group reported that they did not know if they would like an RV or RPS system on their next vehicle
Table 28 Participant Responses Regarding Whether They Would Like Their Next New Vehicle to be Equipped With a Backing Aid System (by System Condition)
Response
System Condition No System RV RV amp RPS
Would you Want RV RPS RV RV RPS
Yes 333 333 100 769 923 No 0 0 0 77 0 Donrsquot Know 667 667 0 154 77
Table 29 summarizes the responses of participants in the RV and RV amp RPS groups regarding how they learned to use their RV and RPS systems as appropriate
Table 29 How Did Participants Learn to Use Their RV or RPS System Condition RV RV amp RPS
How Did the Participant Learn To Usehellip RV RV RPS
Instructions from the dealership such as a video brochure or demonstration 500 385 308
Vehicle ownerrsquos manual 83 308 231 Help from a friend or relative 167 77 154 Information on the Internet 0 0 77 On-road experience and practice (trial and error) 833 846 769 I have not yet learned how to use the system 0 0 0
66
When asked whether there was anything difficult about learning to use an RV system 4 participants in the RV system condition reported that it was difficult to judge the distance between the vehicle and an object behind it and 7 reported that it was easy to judge distances Five participants in the RV amp RPS condition reported varied difficulties in learning to use their systems including ignoring the audible warning tones difficulty incorporating use of the aid into their normal backing behavior and difficulty in judging distances
Two of 12 participants in the RV condition and 2 of 13 participants in the RV amp RPS condition reported that at some point in the prior 2 weeks they had made a backing maneuver using only the RV system Conversely one participant in the RV condition and five in the RV amp RPS condition reported via questionnaire response that she ldquorarely or never look(ed) at (her) systemrdquo It is interesting to note that this participant who reported not looking at her system crashed in the staged obstacle event scenario but had no crashes during her recorded period of naturalistic driving
When asked about how well their vehiclersquos RV or RV amp RPS work in certain weather conditions 23 percent of participants in the RV condition reported that their system does not work well in darkness One commented that it doesnrsquot work well when the camera is dirty Table 30 provides a complete summary of responses regarding participantsrsquo perceptions of RV and RPS performance in difference environmental conditions
Table 30 How Well Does Your Vehiclersquos RPS (N=13) and RV (N=12) Work in the Following Weather Conditions
Darkness Fog Cold Temperatures Rain Snow Bright Sun
Response RV RV amp RPS
RV RV amp RPS
RV RV amp RPS
RV RV amp RPS
RV RV amp RPS
RV RV amp RPS
Not at All 0 0 0 0 0 0 0 0 0 0 83 0
Poorly 0 231 25 77 83 0 167 154 83 154 25 154 Fairly Well
667 385 167 308 83 308 50 769 25 308 333 385
Perfectly 25 231 0 77 50 385 25 0 83 77 417 308
Donrsquot Know
83 154 583 539 333 308 83 769 583 462 0 77
Question 16 of the lsquoRV amp RPSrsquo questionnaire sought to determine whether participants had any misconceptions about the utility of the rearview video and rear parking sensor systems One misconception identified was the belief of ten of thirteen participants that the RPS would be operational when backing at a speed of 10 mph (ultrasonic systems are typically not operational above 3 mph) Six participants did not realize that an RPS cannot detect a child located under the rear bumper and four participants thought that the system would detect a child in that location poorly Nine participants optimistically thought that their RPS would detect a narrow sign post behind their vehicle at least fairly well
67
Given that backover crashes frequently happen in driveways participants were asked how easy their RV or RV amp RPS are to use when backing out of a driveway Table 31 summarizes these responses Three participants in the RV amp RPS system condition felt that their vehiclersquos equipment was difficult to use in this situation Specifics regarding what these participants found difficult about using the system were not obtained
Table 31 Summary of Participant Responses to the Question ldquoHow Easy is Your (System) To Use When Backing Out of a Driveway
Response RV RV amp RPS Very easy to use 583 385 Somewhat easy to use 250 385 Somewhat difficult to use 167 0 Very difficult to use 0 231 Donrsquot Know 0 0
Participants in the RV and RV amp RPS conditions were presented with a schematic (see Figure 44) of a vehicle with defined areas behind it labeled ldquoArdquo through ldquoQrdquo and asked in which of these areas a small standing child could be seen in the RV display Table 32 summarizes the percentages of participants who chose each area as a place where such a child would be visible Using data presented earlier in Section 2 the difference between which areas participants believe they would be able to see in the RV display and what they actually would be able to see are compared In Table 29 areas in which a small standing child would not be visible in the RV display are presented with dark shading Lightly shaded areas indicate locations in which a small standing child may not be visible in the RV display As was shown in Figure 4 the 2007 Honda Odyssey RV systemrsquos camera appears to have a range of approximately 100 degrees This visible range leaves approximately 40 degrees on each side of the vehicle that are not visible in the RV display These invisible areas coincide with areas A B J K and most of C I L and N in Figure 44
Table 32 Summary of Questionnaire Responses Indicating in Which Areas (in Figure 44) a Small Standing Child Could Be Seen in the RV Display
Response RV RV amp RPS A 0 769 B 833 3846 C 5000 6923 D 6667 9231 E 7500 8462 F 9167 9231 G 7500 8462 H 6667 9231 I 5000 6923 J 2500 3846 K 0 769
68
Rear Bumper
Front Bumper
Distance in feet
2
3
4
5
6
7
8
9
10
11
0
1
12
13
14
15
16
17
20
18
19
A
B
C
D
E F G
H
I
K
J
L M N
O P Q
L 1667 3846 M 5000 6923 N 1667 3846 O 5833 7692 P 9167 8462 Q 5833 7692
Figure 44 Graphic Used to Assess in Which Areas Participants Thought a Small Child Standing Behind Their Vehicle Could Be Seen in the RV Display
Participants in the RV amp RPS condition were presented with another schematic (see Figure 45) of a vehicle with defined rectangular areas behind it and asked in which of these areas a small standing child would be detected by the RPS Figure 45 contains the illustration provided in the questionnaire with summarized data overlaid on it to highlight the percentages of participants who chose each area as a place where such a
69
child would be detectable by the RPS Shaded areas indicate locations in which RPS detection performance testing (summarized previously in Section 20) showed the system to be unable to detect objects Based on these responses it seems that participants in this study overestimated the detection range capabilities of the RPS on their vehicles There was not one location where all 13 participants unanimously agreed a standing child would be detected with the most detectable area being in the one to three foot range of the area straight back from the vehiclersquos bumper
Figure 45 Summary of Questionnaire Responses Indicating in Which Areas a Small Standing Child Would Be Detected by the RPS
When asked whether having an RV system made them safer drivers 8 of 12 participants in the RV condition responded lsquoyesrsquo while the other 4 reported that it made
70
no difference Seven of 13 participants in the RV amp RPS system condition reported that having the system made them a safer driver while 6 reported that it made no difference
When asked whether or not they think there is anything about their vehiclersquos system that could be improved 8 of the 12 participants in the RV condition responded lsquoYesrsquo Some of their recommendations included provision of a distance indication quicker appearance of the RV image after shifting into reverse a wider angle of view elimination of sun glare and improved image quality in rain One RV participant also stated that the RV system needs a way to make it easier to determine if the vehicle is going straight or not
Participants in the RV amp RPS condition were asked whether they thought improvements were warranted for their vehiclesrsquo RV and RPS features Eight of 13 participants in the RV amp RPS condition thought improvements were warranted including use of a different sound for backing versus parking use of different sounds for side versus rear provision of a distance indication elimination of the RV image appearance delay after shifting into reverse and relocation the RPS visual warning display so the driver can see it when looking backwards over their shoulder One participant in the RV amp RPS condition suggested that the system have more sensors and no camera Lastly one participant in the RV amp RPS condition suggested that the manufacturer provide a way to temporarily turn off the sensors apparently not realizing that such a switch is provided
71
80 DISCUSSION
81 Rearview Video System Display Response Time
The time it takes for the rearview video image to appear on the systemrsquos visual display once the transmission has been shifted into reverse gear may affect driversrsquo use of a rearview video system The rearview video image response time was measured for the study vehicle (2007 Honda Odyssey) and two additional vehicles equipped with rearview video systems a 2007 Cadillac Escalade and a 2005 Infiniti FX35
Rearview video system display timing was recording using a tripod-mounted digital video camera pointed at the video screen and the gear shift control Timing information was extracted by watching the recorded video files using a software program allowing frame-by-frame video analysis with accuracy to 130 of a second Video frames in which the gear shift control was placed into park and in which the rearview video image appeared were marked The marked times were written to a text file which was opened in a spreadsheet program The response time was calculated by subtracting the time the car was shifted into reverse gear from the time that the rearview image appeared This calculation was made for two cases one in which the car was just started and a second in which the car had been running for some time before the transmission was shifted into reverse Table 33 summarizes these data
Table 33 RV Display Measured Response Time (s) Time from shifting into reverse gear until the RV image appears
2007 Honda Odyssey Touring
2007 Cadillac Escalade
2005 Infiniti FX35
Car just started 644 181 045 Car already running 081 199 045
The case that corresponds to that which participants experienced in the staged unexpected obstacle event is that of the Honda Odyssey in which the car has just been started before shifting into reverse gear As shown in Table 31 this response time was the longest of the test conditions Shorter RV image response time would make the view behind the vehicle available to the driver for a larger portion of the maneuver duration
For the Odyssey the authors believe that the RV image delay after vehicle ignition is due to the manufacturerrsquos priority scheme for the display namely giving initialization priority to the navigation system over the RV system Two of the three vehicles examined exhibited RV image response times of less than 2 seconds demonstrating that quick presentation of the RV image is technologically possible Given the busy nature of peoplesrsquo lives in this day and age and the emphasis on safety giving priority to the RV image would be a more sensible option
72
82 Why Was RV (only) Associated with Fewer Crashes Than RV amp RPS
Results of the staged obstacle event in this study found that 58 percent of participants with RV crashed and 85 percent of participants in the RV amp RPS condition crashed This result is counterintuitive if you assume that having two driver assistance systems for backing is better than one However not all drivers in the RV amp RPS condition received warnings from the RPS during the obstacle event As stated in Section 62 the RPS appeared to be unable to detect the obstacle if it was located at the centerline of the vehicle Thus those participants who backed out of the garage on an off-center path were the ones who tended to receive RPS warning alerts This observation agrees with RPS detection performance results presented in Section 21
Participants in the lsquoRV amp RPSrsquo system condition seemed to glance at the RV display less often On average drivers made less than one (M=081) glance to the center console area (eg to look at the vehiclersquos clock) when no video display was present versus 217 (RV) and 165 glances (RV amp RPS) when the RV system was present Data suggest that participants in the RV amp RPS condition made no glances at all per trial to the RV display more often than those in the lsquoRV onlyrsquo condition The data also suggest that participants in the RV amp RPS condition made four or more glances per trial to the RV display less often than those in the lsquoRV onlyrsquo condition This trend of more participants with lsquoRV onlyrsquo looking at the RV display than those with RV amp RPS may indicate that participants in the RV amp RPS condition were relying on the sensors to alert them of an obstacle However differences in the particular backing situations between driver groups (ie differential exposure) or individual differences in backing habits between groups may have contributed to this difference
Even if an RPS provides a visual or audible warning of a rear obstacle drivers may not look at the visual alert or heed an audible one The RPS visual alert in the specific vehicle used in this study was located under the speedometer This location is not one that drivers tend to check while backing Drivers of vehicle equipped with RV amp RPS in this make model had two new visual sources of information to check during backing the center dashboard-mounted RV display and the RPS alert under the speedometer An RV display with integrated warnings would avoid the situation of divided attention between multiple displays (RV and visual alert) Alternatively presenting a warning alert in another location that a driver typically checks when backing (eg right C-pillar) should be more beneficial
In a 2005 study by Llaneras et al nearly three quarters of drivers hit a toy coupe obstacle that was presented despite being given warnings by a RPS system In the current study 80 percent of drivers that received RPS warnings still collided with the obstacle Therefore the obstacle event crash results of the current study also support Llanerasrsquo statement that ldquonone of the interface warning conditions reliably induced avoidance braking under the surprise event conditionrdquo The combined results of these studies may suggest that intervention by a collision avoidance system may be necessary in order to achieve a significant reduction in backing crashes
73
83 Impact of Rearview Video Use on Likelihood of Backover Crash Avoidance
The likelihood that a backover crash scenario could be mitigated by use of a rearview video system depends on several conditions most notably the location and movement (or path) of the obstacle A review of NHTSA Special Crash Investigation (SCI) not-inshytraffic crashes shows that for the 66 percent of cases in which the location of the child was determinable 24 percent (10 of 42 cases 9 stationary 1 running toward a car from the rear) of them involved a child behind the car and 43 percent (18 of 42 cases) involved a child approaching the area behind the car from the left or right Considering that drivers in the backing maneuver obstacle event reported on here made only 141 glances on average to the RV display during a backing maneuver the case in which the victim is stationary behind the vehicle would seem to provide the best opportunity for mitigation via rearview video system A child moving into the area behind the vehicle may not be present in the RV systemrsquos field of view at the time that the driver looks at the RV display
In this study 15 of 25 (60 percent) participants with an RV (including RV amp RPS condition participants) glanced at the RV display at least once during the obstacle event If it is assumed that a driver would successfully identify the presence of a stationary or longitudinally moving child behind the vehicle then it can be asserted that 60 percent of the 10 relevant SCI crashes or 214 percent (6 of 28) may have been avoidable through the use of an RV system
In naturalistic backing maneuvers observed in this study drivers with RV looked more than once at the RV display in approximately 40 percent of maneuvers and looked at least once in approximately 65 percent of maneuvers If based on the above mentioned SCI data 357 percent (10 of 28) of crash scenarios involve a stationary victim behind the vehicle effectiveness can be estimated to be 143 percent (357 x 40 x 100) if more than one RV glance is required to detect object or 232 percent (357 x 65 x 100) if just one RV glance will result in object detection Based on SCI data and both obstacle event and naturalistic data from the current study overall effectiveness of RV (only) is anticipated to be around 20 percent
A vehicle equipped with an RPS could have the ability to detect a rear obstacle and alert the driver to the presence of the object eliciting a look by the driver to the RV display However RPSrsquos tested to date by NHTSA have exhibited poor performance in detecting children and general unreliability in a variety of test conditions
84 Caveats
This study examined a set of people driving a single vehicle model a minivan Participants may not have exhibited same glance behavior as they would in a vehicle of a different type or size
The particular rearview video system in the vehicle chosen for use in this study had a center dashboard-mounted display Some model year 2008 vehicles come equipped with a rearview video display located in the center rearview mirror It is unknown whether the glance behavior observed with a center dashboard-mounted display would
74
be similar to that of drivers in a vehicle equipped with the RV display in the center rearview mirror
85 What is ldquoGoodrdquo Driver Glance Behavior During Backing
Examining the extent to which drivers look at a rearview video system during backing maneuvers to assess whether drivers are using the systems sufficiently invites the question ldquowhat should driversrsquo glance behavior be like during backingrdquo Driversrsquo glance behavior should vary according to the backing situation Different driving environments traffic conditions degrees of pedestrian presence and vehicle configurations all can warrant different eye glance behavior The following statements highlight was some aspects of ldquogoodrdquo glance behavior during backing maneuvers might be like
1 When a rearview video system is present on the vehicle drivers should not begin backing until the RV display image becomes visible and they have looked at the image
2 Drivers should also look at the RV display periodically during backing One glance immediately before or at the beginning of backing is not enough
3 Drivers should look more frequently at the RV display if they are in a busy area or if they hear noise that might suggest movement behind the vehicle
4 Drivers should look more frequently at the video screen if they think they see a moving object in one of the mirrors
5 Drivers should not use the RV display to avoid looking in other locations They should look to both sides and in all mirrors in addition to their use of the RV system
6 Drivers should be aware of the approximate size of blind zone behind their vehicle as well as limitations in lateral visibility for their specific vehicle(s)
7 Drivers of vehicles equipped with rear parking sensor systems should not rely on alerts from that system to indicate the presence of people particularly children behind the vehicle The driver must actively look out the vehiclersquos windows and in the mirrors to aid in the detection of pedestrians
75
90 SUMMARY AND CONCLUSIONS
Results of this study revealed that drivers look at rearview video displays during backing maneuvers at least some of the time This study found that approximately 14 percent of glances in baseline and obstacle events and 10 percent of glances in naturalistic backing maneuvers were to the rearview video display The timing and frequency of their glances to the RV display has a noticeable impact on the likelihood of rear obstacle detection Making single or multiple glances to the RV display at the start of the maneuver do not ensure that the path behind the vehicle will remain clear for the entire backing maneuver
Drivers varied in their use of the RV system during the staged baseline and event trials Specifically among drivers with an RV system 16 of 25 participants (64 percent) made at least one glance to the RV during the staged event trials When both baseline and event trials were considered the percentage of glance time directed at the RV display varied between 0 and 81 percent of the first 12 seconds of backing The staged obstacle event scenario was designed such that without an RV system drivers could not see obstacle
The rearview video system examined in this study improved detection and avoidance of a crash with a simulated stationary object in the experimental trials Overall the RV system presence was associated with a 28 percent reduction in crashes The addition of RPS had no additional benefit in fact although statistically not significant participants in the RV amp RPS system condition crashed more often than those in the lsquoRV onlyrsquo system condition For reasons that are not completely understood the RPS on the specific vehicle used in the study only detected the obstacle in 38 percent of obstacle event trials involving participants in the RV amp RPS system condition
There are several possible reasons why the RV systems did not have a bigger benefit in the obstacle event trials These include the delay associated with the appearance of the image in the RV display the inappropriate timing of the driversrsquo looks to the RV display their failure to make multiple glances and the possibility that drivers had strong expectations that no such event would occur in the research setting which may have led them to become less vigilant than in real-world backing
The presence of an RV system has no apparent effect on driversrsquo backing behavior (eg speed acceleration) in the baseline and obstacle event trials There was a statistically non-significant tendency for drivers of vehicles with RV systems to wait longer after shifting into reverse before starting to back This may be related to driversrsquo waiting for the rearview video image to appear however there is no direct evidence to support this conclusion
In the naturalistic portion of this study among 37 participants each of whom participated for 28 days for a total of 42982 miles there were 6145 backing maneuvers A typical backing event took approximately 10 seconds and covered 34 feet Driversrsquo average backing speed was 226 miles per hour the average maximum speed was 364 miles per hour Twenty-two percent of backing maneuvers involved multiple backing
76
components in which backing motion was separated by a period of stopped time for example when a driver backed to the end of a driveway stopped to wait for traffic then continued backing into the street The results of naturalistic data collection reveal that on average drivers made approximately 114 backing maneuvers per trip average trip length was slightly less than 9 miles
None of the 6145 naturalistic backing events resulted in a significant collision There were several minor collisions during routine backing with for example trash cans and other vehicles
There is no evidence to support the hypothesis that driversrsquo backing behavior (ie speed and acceleration) was influenced by the presence or absence of an RV system Mean backing speeds across all system conditions was approximately 225 mph in both staged and naturalistic backing maneuvers in this study
Glance behavior during backing appears to be robust and relatively invariant over different environmental conditions In real-world backing situations drivers with RV systems spent 8 to 12 percent of the backing time looking at the location of the RV display Drivers with no system spent about 3 percent of their backing time looking at the consolevideo Ignoring the possible effects of differential exposure the differences between these values (5 to 9 percent) constitute one estimate of the percentage of backing time devoted to looking at the rearview video display Furthermore this result suggests that in addition to the routine preparatory tasks involving the console (radio HVAC) drivers regularly look at the RV system while backing Drivers with no RV system do not devote more glance time to the rear view mirror
While the evidence of driversrsquo use of the rearview video systems obtained in this study is encouraging it should be noted that due to the wide range of directions and speeds in which an obstacle might approach the area behind a vehicle and the timing in which a driver may choose to glance at the rearview video display a rearview video system cannot be expected to prevent all backing crashes
Approximately 61 percent of backing events involved no concurrent driver activity Among the remaining 39 percent of backing events concurrent activities included activation of garage door remote (13 percent) talking with passenger (13 percent) using cell phone (3 percent) and securing seat belt (3 percent) among others In 508 backing events (approximately 10 percent of the subset for which driver activity was recorded) drivers were engaged in multiple concurrent activities while backing
The specific patterns of driversrsquo eye glance behavior and visual sampling of the center dashboard-mounted rearview video display may not be similar to those that would be observed in drivers using an RV display mounted in the center rearview mirror Additional research would be required to determine whether rates of driversrsquo glances to the RV display seen in this study would be similar with a display in the rearview mirror
While rearview video systems offer the driver a useful tool for detecting rear obstacles some guidance may be necessary to educate drivers as to the most effective way to
77
incorporate this new visual information source into their glance behavior during backing maneuvers Encouraging drivers to make more than once glance to the RV display during backing maneuvers and to glance at the display throughout the maneuver rather than just at the beginning may increase the benefits attainable with these systems
78
100 REFERENCES
[1] National Highway Traffic Safety Administration (2006) Vehicle Backover Avoidance Technology Study (Report to Congress)
[2] Mazzae E N and Garrott W R (2006) Experimental Evaluation of the Performance of Available Backover Prevention Technologiesrdquo National Highway Traffic Safety Administration DOT HS 810 634 September 2006
[3] Mazzae E N and Garrott W R Experimental Evaluation of the Performance of Available Backover Prevention Technologies for Medium Straight Trucks DOT HS 810 865 November 2007
[4] McLaughlin SB Hankey J M Green C A and Kiefer R J (2003) Driver Performance Evaluation of Two Rear Parking Aids 2003 Enhanced Safety of Vehicles Conference Paper 522
[5] Llaneras RE Green CA Chundrik W Altan OD and Singer JP (2005) Design and Evaluation of a Prototype Rear Obstacle Detection and Driver Warning System Human Factors Vol 47 No 1 Spring 2005 Human Factors and Ergonomics Society
[6] Green C A and Deering R K (2006) Driver Performance Research Regarding Systems for Use While Backing SAE International Paper No 2006-01-1982
[7] Llaneras E amp Neurauter L (2005) Early Adopters Safety-Related Driving With Advanced Technologies 2005 Inventory of In-vehicle Devices amp Interface Characteristics (Task Order 10 under Project DTNH22-99-D-07005)
[8] Jenness J W Lerner N D Mazor S Osberg J S and Tefft B C (2007) Use of Advanced In-Vehicle Technology by Young and Older Early Adopters Survey Results on Sensor-Based Backing Aid Systems and Rear-View Video Cameras National Highway Traffic Safety Administration DOT HS 810 828
[9] Honda (2006) 2007 Odyssey Ownerrsquos Manual
79
110 APPENDICES
111 Appendix A Results for Performance Testing of the 2007 Honda Odysseyrsquos Parking Sensor System ndash Front Sensors
Figure 46 PSS Front Sensorsrsquo Detection Results for the Various Traffic Cones a 40shyiInch-Tall PVC Pole and an Adult Male
80
112 Appendix B Participant Information Summary
81
You are being asked to participate in this research study because you
bull Are 25-60 years of age bull Have a valid unrestricted US driverrsquos license (except for restrictions concerning corrective
Page 1 of 9
Version Date 13 June 2007 Participants Initials
STUDY Driving Behavior in New Vehicles STERLING IRB ID 2495 DATE OF IRB REVIEW 061307
PARTICIPANT INFORMED CONSENT AND CONFIDENTIAL INFORMATION FORM
STUDY TITLE Driving Behavior in New Vehicles
STUDY DOCTOR Elizabeth N Mazzae MSE
STUDY SITE NHTSA Vehicle Research and Test Center (VRTC) 10820 SR 347 East Liberty OH 43319
TELEPHONE 800-262-8309 937-666-4511
SPONSOR National Highway Traffic Safety Administration
You are being asked to participate in a research study Your participation in this research is strictly voluntary meaning that you may or may not choose to take part To decide whether or not you want to be part of this research you should understand the study risks and benefits in order to make an informed decision This process is known as informed consent This consent form describes the purpose procedures possible benefits and risks of the study This form also explains how your information will be used and who may see it You are being asked to take part in this study because the study investigator feels that you meet the qualifications of the study
The study investigator or staff will answer any questions you may have about this form or about the study Please read this document carefully and do not hesitate to ask anything about this information This form may contain words that you do not understand Please ask the investigator or staff to explain the words or information that you do not understand After reading the consent form if you would like to participate you will be asked to sign and date this consent form You may have a copy of this form to review at your leisure and keep for your records
This study is being conducted by the U S Department of Transportationrsquos National Highway Traffic Safety Administration (NHTSA)
STUDY PURPOSE
This research study is being conducted to assess how drivers learn to use the features and functions of a new vehicle By learning more about how people become familiar with and learn to take advantage of their vehiclersquos features we hope to better understand driver behavior and estimate the degree of safety that newer vehicles may provide
STUDY REQUIREMENTS
eyewear) bull Have a minimum of 2 years driving experience bull Drive at least 7000 miles per year bull Are in general good health bull Are the primary driver of a 2007 Honda Odyssey and drive it as your primary source of
transportation bull Agree to be the sole driver of the 2007 Honda Odyssey for the duration of your participation
NUMBER OF STUDY SITES AND STUDY PARTICIPANTS
This study will take place at one research site (NHTSArsquos Vehicle Research and Test Center VRTC) and will include up to 39 participants
STUDY PROCEDURES
Before participating in this research study you will be asked to read this Participant Informed Consent Form After all of your questions have been answered you will be asked to sign this form to show that you voluntarily consent to participate in this research study
Summary of Study Procedures
Your participation in this study will last for about 4 weeks There are three phases involved in this study
bull an initial meeting with test drive bull a 4-week period of monitored driving bull a final meeting with test drive
Details regarding these three phases follow
Initial Meeting
bull You will be asked to review and sign this consent form bull Your vehicle will be inspected for any pre-existing damage by a member of the research
staff You will be asked to sign a form acknowledging the current condition of your vehicle bull Technicians will install electronic recording equipment in your vehicle It will take
approximately 2 hours to install the equipment in your vehicle bull While the recording equipment is being installed you and a member of the research study
staff will go for a brief test drive A member of the research staff will be with you in the vehicle at all times and will give you detailed instructions during the test drive During the test drive you will be asked to perform various basic driving maneuvers such as changing lanes turning and backing The test drive will take place on specific driving courses and on two-lane private access roads on the grounds of the Transportation Research Center
bull Your vehicle will be returned to you and the locations of any visible instrumentation or wiring will be pointed out for your information
Page 2 of 9
Version Date 13 June 2007 Participants Initials
STUDY Driving Behavior in New Vehicles STERLING IRB ID 2495 DATE OF IRB REVIEW 061307
4 Weeks of Monitored Driving
bull You will drive your own vehicle as you normally would for a period of approximately 4 weeks During this time your driving behavior will be recorded using special sensors and a video recorder (Please see the following section regarding ldquo4 Weeks of Monitored Drivingrdquo below for additional details)
bull A technician will check your vehicle approximately once per week during the 4-week period to determine the remaining available data storage capacity and add additional storage media as needed
Final meeting
bull A member of the study staff will give you detailed instructions and accompany you on a brief test drive You will be asked to perform various basic driving maneuvers during the test drive
bull Electronic recording equipment will be removed from your vehicle bull You will be presented with additional information regarding this study bull You will complete a brief questionnaire regarding your driving experiences bull Your vehicle will be returned to you in the same condition as in the first meeting
Test Drives
During your participation you will be asked to complete two ldquotest drivesrdquo that involve driving a vehicle equipped with special recording instruments You will drive on private access roads a 75shymile oval test track and parking lots located on the grounds of the Transportation Research Center (TRC) in East Liberty Ohio The instrumented vehicle will be of the same make and model as your vehicle but may have a different trim level The instrumented vehicle is equipped with sensors to record information on your steering braking and gas pedal use A video camera pointed at the driverrsquos face will record eye glance locations The camera and sensors are located so that they will not affect your driving The information collected by these sensors is recorded so that it can be analyzed at a later time
You will be given instructions on the rules and procedures before driving on the TRC test track and other driving areas at TRC You will be required to wear a seat belt at all times while driving Although a member of the study staff will be with you at all times he or she is not able to ensure complete safety Therefore it is important to remember that you as the driver are in control of the vehicle and you must be the final judge as to when to complete the tasks during this study
4 Weeks of Monitored Driving
The monitored driving will involve 4 weeks of driving your own vehicle as you normally would while allowing your driving behavior to be recorded The study investigator may request that you permit a technician to access your vehicle approximately once a week during the 4 week period to check the condition of installed instrumentation and data recording capacity Arrangements for these meetings will be made at your convenience
Your vehicle will be equipped with video and electronic monitoring equipment that we will install for the 4 week period This equipment should not be in your way A data collection system including
Page 3 of 9
Version Date 13 June 2007 Participants Initials
STUDY Driving Behavior in New Vehicles STERLING IRB ID 2495 DATE OF IRB REVIEW 061307
up to 5 small digital video cameras video and data recording equipment and associated wiring will be installed in your vehicle to record data that will document your driving A camera that will record your eye glances will be placed securely inside the vehicle above your center rearview mirror Up to four video cameras will be placed securely on the exterior of the vehicle one under the vehicle just behind each front tire and one or two attached to the rear license plate mounting bracket All cameras will be attached to your vehicle using existing bolt holes or temporary non-damaging adhesive A GPS antenna will be magnetically attached to the roof of your vehicle A rugged box containing data recording equipment will be placed securely in the rear cargo area of the vehicle Interior vehicle trim panels may be removed temporarily to allow wires to be run beneath them Your vehiclersquos electrical system will be used to power data collection equipment while the vehicle is running but should not noticeably impact your vehiclersquos performance or battery voltage All installed equipment will be temporarily yet securely attached to your vehicle to prevent the equipment from moving in the event of a crash No permanent changes will be made to your vehicle In the unlikely event that your vehicle is damaged during equipment installation or removal you will be compensated for the reasonable cost of vehicle repair
NEW INFORMATION
No changes to procedures are anticipated to occur during this study However any new information developed during testing that may affect your willingness to participate will be provided to you
RISKS
During the test drives participants will be subject to all risks and uncertainties normally associated with driving on the TRC test track TRC access roads (two-lane rural roads) and in parking lots A number of controls have been put in place to reduce the risk of crashing Specifically test track traffic is generally light and travels in one direction only The test track access is controlled Data collection will be conducted only in daylight conditions In the event of bad weather your test drive may be delayed until conditions for driving improve The experimental vehicle is equipped with a kill switch which can be activated by the study staff to initiate full braking in an emergency situation For these reasons the risks are considered to be less than might be expected when performing comparable driving tasks while traveling on a controlled access freeway under light to moderate traffic conditions
While driving your vehicle on public roads you will be subject to all risks and uncertainties normally associated with your daily driving routine
You will not be asked to perform any unsafe acts There are no known physical or psychological risks associated with participation in this study beyond those described above
BENEFITS
There is no personal benefit to you from participating in this study You are not expected to receive direct benefit from your participation in this research study
The research study will provide data on driver behavior and performance that may be used by researchers to develop recommendations or standards for increasing vehicle and driving safety
Page 4 of 9
Version Date 13 June 2007 Participants Initials
STUDY Driving Behavior in New Vehicles STERLING IRB ID 2495 DATE OF IRB REVIEW 061307
STUDY Driving Behavior in New Vehicles STERLING IRB ID 2495 DATE OF IRB REVIEW 061307
ALTERNATIVES
This study is for research purposes only Your alternative is to not participate
CONDITIONS OF PARTICIPATION WITHDRAWAL AND TERMINATION
Participation in this research is voluntary By consenting to your participation you agree to allow instrumentation to be installed in and later removed from your vehicle You agree that you will drive the vehicle on a regular basis and that you will not let another person drive the vehicle during the 4-week monitored driving period You agree to permit a member of the research staff to access your vehicle approximately once per week to ensure that the in-vehicle data collection system has sufficient data storage capacity to record the entire 4 week period of monitored driving
During test drives on TRC property you agree to operate the research vehicle in accordance with all instructions provided by the study staff If you fail to follow instructions or behave in a dangerous manner you may be terminated from the study
You may withdraw your consent and discontinue your participation without penalty at any time If you decide to withdraw from the research study you should notify the study investigator In addition you agree to make your vehicle available for the removal of government-owned data recording equipment should you withdraw from the study early
COSTS TO YOU
Other than the time you contribute there will be no costs to you
COMPENSATION
You will receive $80000 if you complete the study If you do not complete the entire study you will be paid a pro-rated portion of this amount In addition you will be compensated 50 cents per mile (up to a maximum of $20000) for driving from your residence to our facility to attend the required initial and final meetings In the event that severe weather causes a delay in your initial or final test drive completion you will receive $2500 per hour for up to 2 hours spent at the research facility in excess of 3 hours Therefore you may receive up to a total of $110000 for participating in this study
COMPENSATION FOR RESEARCH RELATED INJURY
The contractor assisting with the conduct of this study TRC will maintain insurance to cover you in the event of a crash occurring in a government-owned research vehicle on TRC facilities This insurance covers injuries to yourself up to a limit of $1000000 You may contact your insurance company to check on additional coverage Coverage is also provided for injuries to others including the driver and any passengers of other vehicles involved in the crash as well as damages resulting from any crashes occurring during your participation in this study up to a $1000000 limit Except to the extent covered by such insurance policy neither the TRC nor NHTSA will be responsible for your actions during this study nor will they indemnify you or otherwise compensate you for any problems arising out of your actions or the normal risks associated with driving However you will not be liable for loss or damage to the vehicle instrumentation the government-owned research vehicle or other equipment during your Page 5 of 9
Version Date 13 June 2007 Participants Initials
participation unless there is gross negligence on your part
If you are injured in a crash while on TRC facilities emergency personnel will be dispatched to treat you The nearest hospital is about 15 miles away
If you are injured while driving your vehicle off-site during your participation in the study either you or your insurance company will be responsible for the costs associated with your medical treatment and your vehicle repairs
USE OF INFORMATION COLLECTED
In the course of this study the following data will be collected
bull Engineering data (such as the information recorded by the study vehicle sensors) bull Video data (such as the information recorded by the video cameras)
Information NHTSA may release
bull The engineering data collected and recorded in this study will include measures of driving behavior and performance These data will be analyzed along with data gathered from other participants to characterize driver behavior and performance NHTSA may publicly release the data in reports or other publications or media for scientific educational research or outreach purposes
bull The video data recorded in this study includes your video-recorded likeness Video data will be used to assess your driving performance NHTSA may publicly release video image data (in continuous video or still formats) either separately or in association with the appropriate engineering data for scientific educational research or outreach purposes
bull Information NHTSA may not release
bull Any release of engineering data or video data will not include release of your name However in the event of court action NHTSA may not be able to prevent release of your name or other personal identifying information NHTSA will not release any information collected regarding your health and driving record
QUESTIONS
Any questions you have about the study can be answered by Elizabeth N Mazzae MSE or the study staff by calling 1-800-262-8309 or 937-666-4511
If you have any questions regarding your rights as a research subject you may contact Sally P Green MD Chairman of Sterling Institutional Review Board 6300 Powers Ferry Road Suite 600shy351 Atlanta Georgia 30339 (mailing address) at telephone number 1-888-636-1062 (toll free)
Page 6 of 9
Version Date 13 June 2007 Participants Initials
STUDY Driving Behavior in New Vehicles STERLING IRB ID 2495 DATE OF IRB REVIEW 061307
INFORMED CONSENT
By signing the informed consent statement contained in this document you agree that participation is voluntary and you accept all terms of this agreement Also by signing the informed consent statement you agree to operate the study vehicle in accordance with all instructions provided by the study staff You may withdraw your consent and discontinue your participation in the study at any time without penalty
NHTSA will retain a signed copy of this Informed Consent form A copy of this form will also be provided to you
I do not give up any of my legal rights by signing this form
Informed Consent Statement
I certify that
bull I have a valid US driverrsquos license
bull I am the primary driver of the following vehicle 2007 Honda Odyssey
bull All personal and vehicle information as well as information regarding my normal daily driving habits provided by me to NHTSA andor the Transportation Research Center (TRC) employees associated with this study during the pre-participation phone interview and the introductory briefing was true and accurate to the best of my knowledge
bull I have been informed about the study in which I am about to participate
bull I have been told how much time and compensation is involved
bull I have been told that the purpose of this study is to examine how drivers learn about the features and functions of a new vehicle
bull I agree to operate the research vehicle in accordance with all instructions provided to me by the study staff
I have been told that
bull The study involves a period of electronically recorded observation of my driving my own vehicle over public and other roads and locations and that the risk of injury is identical to that which I would normally experience in my typical daily driving
bull The study involves a period of observation of my driving a government-owned vehicle on the TRC test courses and private roads and that the risk of injury due to a motor vehicle collision is less than in real world driving due to the closed environment and safety precautions which include an on-board experimenter ready to intervene if necessary
Page 7 of 9
Version Date 13 June 2007 Participants Initials
STUDY Driving Behavior in New Vehicles STERLING IRB ID 2495 DATE OF IRB REVIEW 061307
bull For scientific educational research or outreach purposes video images of my driving which will contain views of my face may be used or disclosed by NHTSA but my name and any health data or driving record information will not be used or disclosed by NHTSA
bull My participation is voluntary and I may refuse to participate or withdraw my consent and stop taking part at any time without penalty or loss of benefits to which I may be entitled
bull I have the right to ask questions at any time and I may contact the study investigator Elizabeth Mazzae or the study staff at 937-666-4511 or 800-262-8309 for information about the study and my rights
I have been given adequate time to read this informed consent form I hereby consent to take part in this research study
I voluntarily consent to participate (Printed Name of Participant)
Signature of Participant Date
Signature of Person Obtaining Consent Date
STUDY Driving Behavior in New Vehicles STERLING IRB ID 2495 DATE OF IRB REVIEW 061307
Page 8 of 9 Version Date 13 June 2007
INFORMATION DISCLOSURE
By signing the information disclosure statement below you agree that NHTSA and its authorized contractors and agents will have the right to use the engineering data and the video data collected during your participation for scientific educational research or outreach purposes This includes wide distribution or publication of your likeness in video or still photo format Neither NHTSA nor its authorized contractors or agents shall release your name You have been told that in the event of court action NHTSA may not be able to prevent release of names or other personal identifying information NHTSA will not release any information collected regarding your health and driving record either by questionnaire or medical examination Your permission to disclose this information will not expire on a specific date
Information Disclosure Statement
I grant permission to the National Highway Traffic Safety Administration (NHTSA) to use publish or otherwise distribute NHTSA engineering data and NHTSA video image data of my likeness (including continuous video and still photo formats) collected in this study either separately or in association with the appropriate engineering data for scientific educational research or outreach purposes I have been informed that such use may involve widespread distribution to the public and may involve distribution of my likeness in video or still photo formats but will not result in release of my name or other identifying personal information by NHTSA or its authorized contractors or agents I have been told that my permission to disclose this information will not expire on a specific date
Signature of Participant Date
STUDY Driving Behavior in New Vehicles STERLING IRB ID 2495 DATE OF IRB REVIEW 061307
Page 9 of 9 Version Date 13 June 2007
I acknowledge that the description of my vehiclersquos condition as noted on this form is accurate
Print Name Signature Date
113 Appendix C Vehicle Condition Check Sheet
Driving Study Vehicle Condition Check Sheet
This form is used to document the condition of your vehicle before and after data recording equipment is installed or removed from your vehicle by the research staff A member of the research staff will look over your vehicle and indicate on this form any damage observed Your signature at the bottom of this form will document your acknowledgement that the damage was pre-existing and not caused during the process of installation or removal of data recording equipment by the research staff In the unlikely event that scratches or other damage to your vehicle occur during the installation or removal of data recording equipment VRTC will pay for the cost of repairs performed at a manufacturerrsquos dealership service facility
Research Staff Using the drawing below indicate the locations of any damage using an ldquoSrdquo for scratches and ldquoDrdquo for dents) Fill in the VIN below
VIN _ _ _ _ _ _ _ _ _ _ _ _ _ _ _ _ _
91
114 Appendix D Participant Debrief Form
Debrief
ldquoWe are very sorry but we staged this event and deliberately caused an object to be behind you There were no real people in the way We did this because part of our research is to observe where people look while they are driving including when backing
Did you have any idea that this would happen ___ Yes ___ No
The reason we didnt tell you that this would happen ahead of time is that we wanted to observe your natural reaction I hope you will understand why we deliberately misled you Also I hope you can appreciate that the kind of event you just experienced is similar to real situations that occasionally occur in everyday driving
This type of surprise wont happen again And since we are testing at least through the end of the year we would be grateful if you did not discuss this surprise event experience with anyone until after our research is completed
We can now walk back to the conference room where we have some questionnaires for you to complete Then we can take care of payment information while we wait for your vehicle to get de-instrumentedrdquo
92
115 Appendix E Participant Questionnaire With Results (No System)
The tabulated questionnaire results for the 12 participants in the no video or sensor condition are incorporated below Counts show the number of participants who selected a particular response to a question Some questions required participants to choose one best response while other questions allowed the participants to choose multiple responses In order to better understand the results the response percentages for both types of questions are based upon the total number of participants (12) not the total count of responses If a participant didnrsquot respond to a question it is accounted for in the table
Q1 During your final test drive did you anticipate the obstacle behind the vehicle during the backing maneuver (circle one)
Response Count Percentage Yes 0 0 No 12 100 Donrsquot Know 0 0
Q2 Where do you usually look to determine whether the area behind the vehicle is clear when backing (Check all that apply)
Response Count Percentage At the side mirrors 9 75 At the center rearview mirror 9 75 Over my shoulder 11 9167
Q3 A backing aid system helps the driver back up by providing sounds lights or symbols when the vehicle is near an obstacle Your vehicle does not have a system like this Why not
(check boxes for all that apply) Response Count Percentage It never occurred to me to look for one when I was buying the vehicle 4 3333 It was not an option on my vehicle 5 4167 I thought it would be a nuisance or distraction 1 833 I wouldnrsquot trust the backing aid system to give me warnings when I need them 1 833 I donrsquot need a backing aid system because I have good backing skills 1 833 The backing aid was not worth the extra cost 1 833 The backing aid was only available with other options that I didnrsquot want 4 3333 I was not the person who purchased or made the decision to purchase this 0 0
Q4 If you purchased this same model vehicle again would you want a backing aid system (circle one)
Response Count Percentage Yes 4 3333 No 0 0 Donrsquot Know 8 6667
93
Q5 A rearview video camera system shows the driver the area behind the vehicle when you are backing on a screen inside the vehicle Your vehicle does not have a rearview video camera
system like this Why not (check boxes for all that apply) Response Count Percentage It never occurred to me to look for one when I was buying the vehicle 7 5833 The rearview camera was not an option on my vehicle 3 25 I thought the rearview camera would be a nuisance or distraction 0 0 I wouldnrsquot trust the rearview camera 0 0 I donrsquot need a rearview camera because I have good backing skills 1 833 The rearview camera was not worth the extra cost 2 1667 The rearview camera was only available with other options I didnrsquot want 4 3333 I was not the person who purchased or made the decision to purchase this vehicle
0 0
No Response (Blank) 1 833
Q6 If you purchased this same model vehicle again would you want a rearview video camera system (circle one)
Response Count Percentage Yes 4 3333 No 0 0 Donrsquot Know 8 6667
94
116 Appendix F Participant Questionnaire With Results (Rearview Video Only)
The tabulated questionnaire results for the 12 participants in the video only (no sensors) condition are incorporated below Counts show the number of participants who selected a particular response to a question Some questions required participants to choose one best response while other questions allowed the participants to choose multiple responses In order to better understand the results the response percentages for both types of questions are based upon the total number of participants (12) not the total count of responses If a participant didnrsquot respond to a question it is accounted for in the table Questions with open-ended responses or comments are categorized when possible
Q1 During your final test drive did you anticipate the obstacle behind the vehicle during the backing maneuver (circle one)
Response Count Percentage Yes 0 0 No 12 100 Donrsquot Know 0 0
Q2 Where do you usually look to determine whether the area behind the vehicle is clear when backing (Check all that apply)
Response Count Percentage At the side mirrors 8 6667 At the center rearview mirror 10 8333 Over my shoulder 11 9167 At the rearview video display 10 8333
Q3 A rearview video camera displays the area behind the vehicle when you are backing on a screen inside the vehicle Your vehicle is equipped with this type of system If you
purchased this same model vehicle again would you want a rearview camera (circle one) Response Count Percentage Yes 12 100 No 0 0 Donrsquot Know 0 0
Q4 How did you learn to use your vehiclersquos rearview camera (check all boxes that apply)
Response Count Percentage
Instructions from the dealership such as a video brochure or demonstration 6 50
Vehicle ownerrsquos manual 1 833 Help from a friend or relative 2 1667 Information on the Internet 0 0 On-road experience and practice (trial and error) 10 8333 I have not yet learned how to use the rearview camera 0 0
Q5 How easy was it to learn how to use your vehiclersquos rearview camera to judge the distance to
95
objects behind your vehicle (choose one) Response Count Percentage Very easy to learn 1 833 Somewhat easy to learn 7 5833 Somewhat difficult to learn 2 1667 Very difficult to learn 2 1667 I have not tried to learn how to use the rearview camera 0 0 I do not want to learn how to use the rearview camera 0 0
Q6 Was there anything especially difficult to learn about your vehiclersquos rearview camera (circle one)
Response Count Percentage Yes 5 4167 No 7 5833
If yes please explain Difficulty in judging distances using rearview camera 4 3333 Difficulty backing in straight line over long distances when using only the
rearview camera 1 833
Q7 Are you aware of any warnings or limitations about your vehiclersquos rearview camera (circle one)
Response Count Percentage Yes 2 1667 No 8 6667 Both lsquoYesrsquo and lsquoNorsquo Circled 2 1667
If yes please explain Learning curve judging distances (Yes response) 1 833 Distortion due to type of lens on camera (Yes response) 1 833 There are areas that can not be seen by camera (Yes and No response) 1 833 Not being able to see anything when backing toward the sun (Yes and No
response) 1 833
Q8 In the last two weeks did you ever use just the camera when backing without checking the mirrors or turning to look out the rear window (circle one)
Response Count Percentage Yes 2 1667 No 10 8333
96
Q9 Which of the following best describes how much you normally pay attention to the rearview camera when backing (choose one)
Response Count Percentage I rarely or never look at it 1 833 I usually just take a quick glance at the camera screen to determine if I can
back up 5 4167
I share my attention about equally between the rearview camera screen and my mirrors or glances over my shoulder
6 50
I pay attention to the rearview camera screen more than to my mirrors and glances over my shoulder
0 0
I usually back up the vehicle using only the camera I donrsquot feel that I need to check mirrors or look out the rear windows
0 0
Q10 Imagine that your vehicles rearview camera broke down How would your driving behavior change if you could not use your vehiclersquos rearview camera anymore (check boxes for all
that apply) Response Count Percentage I would back up much more slowly 4 3333 I would avoid parking in places where I would have to back up 0 0 I would not try to fit into tight parking spaces 3 25 I would rely more on my mirrors andor glances over my shoulder to see
whatrsquos behind my vehicle 8 6667
My driving behavior would not change 3 25 Other (specify) 2 1667
More apt to get out and check behind vehicle 1 833 Nothing specified (blank) 1 833
Q11 How well does your vehiclersquos rearview camera work in the following weather conditions (choose one response for each row)
Q11A Darkness Response Count Percentage Not at All 0 0 Poorly 0 0 Fairly Well 8 6667 Perfectly 3 25 Donrsquot Know 1 833
Q11B Fog Response Count Percentage Not at All 0 0 Poorly 3 25 Fairly Well 2 1667 Perfectly 0 0 Donrsquot Know 7 5833
97
Q11C Cold temperatures Response Count Percentage Not at All 0 0 Poorly 1 833 Fairly Well 1 833 Perfectly 6 50 Donrsquot Know 4 3333
Q11D Rain Response Count Percentage Not at All 0 0 Poorly 2 1667 Fairly Well 6 50 Perfectly 3 25 Donrsquot Know 1 833
Q11E Snow Response Count Percentage Not at All 0 0 Poorly 1 833 Fairly Well 3 25 Perfectly 1 833 Donrsquot Know 7 5833
Q11F Bright sun (1 participant gave 2 responses) Response Count Percentage Not at All 1 833 Poorly 3 25 Fairly Well 4 3333 Perfectly 5 4167 Donrsquot Know 0 0
98
Q11 Part 2 Are there any other conditions when your vehiclersquos rearview camera does not work well Explain
When camera is dirty 1 833 Video takes time to brighten up when car is put in reverse if screen is initially
dark due to navigation system being off 1 833
Q12 Overall how easy is the rearview camera to use when backing out of a driveway (circle one)
Response Count Percentage Very easy to use 7 5833 Somewhat easy to use 3 25 Somewhat difficult to use 2 1667 Very difficult to use 0 0 Donrsquot know 0 0
Q13 How has your usage of the rearview camera changed since you first got the vehicle (circle one) If it changed then why
Response Count Percentage I use it more now than I did in the beginning 4 3333 I use it less now than I did in the beginning 0 0 My usage has stayed about the same 8 6667
If you use it more now than in the beginning then why More comfortable after proven reliability 1 833 Gotten used to it over time 2 1667 Helps when backing out of a driveway on a hill 1 833
99
Q14 Please indicate how much you agree or disagree with the following statements (choose one response for each row)
Q14A The rearview camera screen is in a location where it is easy to see when I am backing Response Count Percentage Strongly Disagree 0 0 Disagree 0 0 Neutral 1 833 Agree 5 4167 Strongly Agree 6 50
Q14B I am more confident in my backing abilities when I use the rearview camera Response Count Percentage Strongly Disagree 1 833 Disagree 1 833 Neutral 2 1667 Agree 3 25 Strongly Agree 5 4167
Q14C I am more willing to park in small or difficult parking spaces when I use the rearview camera
Response Count Percentage Strongly Disagree 1 833 Disagree 2 1667 Neutral 2 1667 Agree 6 50 Strongly Agree 1 833
Q14D Itrsquos easy to tell how close I am to an obstacle by looking at the rearview camera display Response Count Percentage Strongly Disagree 2 1667 Disagree 1 833 Neutral 3 25 Agree 5 4167 Strongly Agree 1 833
Q14E The rearview camera does not show the entire area behind the vehicle that I need to see when backing in other words there is a blind spot
Response Count Percentage Strongly Disagree 1 833 Disagree 5 4167 Neutral 4 3333 Agree 1 833 Strongly Agree 1 833
Q14F The rearview camera display gets blurry or hard to see if I am moving
Response Count Percentage Strongly Disagree 1 833 Disagree 7 5833
100
Neutral 4 3333 Agree 0 0 Strongly Agree 0 0
Q14G The rearview camera gets dirty and makes obstacles hard to see Response Count Percentage Strongly Disagree 1 833 Disagree 6 50 Neutral 4 3333 Agree 0 0 Strongly Agree 1 833
Q14H Sun glare on the video display makes it hard for me to see objects or people Response Count Percentage Strongly Disagree 0 0 Disagree 4 3333 Neutral 4 3333 Agree 2 1667 Strongly Agree 2 1667
Q14I Itrsquos hard to distinguish something or someone who may be in a shadow area behind my vehicle (Image contrast level is poor in camera)
Response Count Percentage Strongly Disagree 0 0 Disagree 5 4167 Neutral 5 4167 Agree 2 1667 Strongly Agree 0 0 Q14J My risk of hitting somebody while backing is lower with the rearview camera than without
it Response Count Percentage Strongly Disagree 0 0 Disagree 2 1667 Neutral 0 0 Agree 3 25 Strongly Agree 7 5833
101
Q15 Suppose that the diagram below shows an overhead view of your vehicle and areas labeled ldquoArdquo ndash ldquoQrdquo Based on your experience please circle the letters for all areas where your rearview camera would show you obstacles such as a small child standing behind the
vehicle
Response Areas Count Percentage A 0 0 B 1 833 C 6 50 D 8 6667 E 9 75 F 11 9167 G 9 75 H 8 6667 I 6 50 J 3 25 K 0 0 L 2 1667 M 6 50 N 2 1667 O 7 5833 P 11 9167 Q 7 5833
Rear Bumper
Front Bumper
Distance in feet
2
3
4
5
6
7
8
9
10
11
0
1
12
13
14
15
16
17
20
18
19
A
B
C
D
E F G
H
I
K
J
L M N
O P Q
Q16 Have you ever unintentionally backed into something or had a ldquoclose callrdquo since you started driving this vehicle (circle one)
Response Count Percentage Yes 3 25 No 9 75
If yes were you using the camera at the time Please describe the situation Backing out of parking space at mall lady yelled when came too close 1 833 Backing out of driveway used camera early but hit garbage can when looking
over shoulder at the time of collision 1 833
Hit mailbox at end of driveway roads snow covered camera lens dirty from road grime 1 833
102
Q17 Does using the rearview camera create any new driving problems or safety concerns for you (circle one)
Response Count Percentage Yes 1 833 No 11 9167
If yes please explain Hard to focus on driving while looking at the camera 1 833
Q18 Overall does having the rearview camera make you a safer driver (circle one) Response Count Percentage Safer 8 6667 Neither more nor less safe 4 3333 Less safe 0 0
Q19 Since you have owned this vehicle have you driven another vehicle without a backing aid system or rearview video system and backed into something or had a ldquoclose callrdquo because
you expected the vehicle to give you a warning or display the obstacle on the video screen (circle one)
Response Count Percentage Yes 0 0 No 12 100
Q20 Is there anything about the rearview camera that you think should be improved (circle one) Response Count Percentage Yes 8 6667 No 4 3333
If yes please explain Thoughts on improvements include some kind of distance markers have the video come on quicker
create a wider angle of view eliminate sun glare improve the determinability of the distance to an object prevent disorientation improve field of view find a way for it to see better in the rain and make it so it would be easier to determine if one is going straight or not
Q21 In general do you believe that car manufacturers are doing enough to design their vehicles to accommodate an aging population (circle one)
Response Count Percentage Yes 10 8333 No 2 1667
If you answered ldquonordquo then what more do you believe could be done Explain Could be more universal symbols and more standard location of controls and
switches 1 833
No explanation (blank) 1 833
103
117 Appendix G Participant Questionnaire With Results (Rearview Video and Rear Parking Sensors)
The tabulated questionnaire results for the 13 participants in the video plus sensors condition are incorporated below Counts show the number of participants who selected a particular response to a question Some questions required participants to choose one best response while other questions allowed the participants to choose multiple responses In order to better understand the results the response percentages for both types of questions are based upon the total number of participants (13) not the total count of responses If a participant didnrsquot respond to a question it is accounted for in the table Questions with open-ended responses or comments are categorized when possible
Q1 During your final test drive did you anticipate the obstacle behind the vehicle during the backing maneuver (circle one)
Response Count Percentage Yes 0 0 No 13 100 Donrsquot Know 0 0
Q2 Where do you usually look to determine whether the area behind the vehicle is clear when backing (Check all that apply)
Response Count Percentage At the side mirrors 8 6154 At the center rearview mirror 10 7692 Over my shoulder 12 9231 At the rearview video display 8 6154 At the backing aid display 3 2308
Q3 A backing aid system helps the driver back up by providing sounds lights or symbols when the vehicle is near an obstacle Your vehicle is equipped with this type of system If you
purchased this same model vehicle again would you want the backing aid system (circle one)
Response Count Percentage Yes 12 9231 No 0 0 Donrsquot Know 1 769
Q4 A rearview video camera shows the driver the area behind the vehicle when you are backing on a screen inside the vehicle Your vehicle is equipped with this type of system If you
purchased this same model vehicle again would you want a rearview camera (circle one) Response Count Percentage Yes 10 7692 No 1 769 Donrsquot Know 2 1538
104
Q5 How did you learn to use your vehiclersquos backing aid system (check all that apply) Response Count Percentage Instructions from the dealership such as a video brochure or demonstration 4 3077 Vehicle ownerrsquos manual 3 2308 Help from a friend or relative 2 1538 Information on the Internet 1 769 On-road experience and practice (trial and error) 10 7692 I have not yet learned how to use the backing aid 0 0
Q6 How did you learn to use your vehiclersquos rearview camera (check all that apply) Response Count Percentage Instructions from the dealership such as a video brochure or demonstration 5 3846 Vehicle ownerrsquos manual 4 3077 Help from a friend or relative 1 769 Information on the Internet 0 0 On-road experience and practice (trial and error) 11 8462 I have not yet learned how to use the rearview camera 0 0
Q7 Are you aware of any warnings or limitations about your vehiclersquos rearview camera (circle one)
Response Count Percentage Yes 5 3846 No 8 6154
If yes please explain Distance appears distorted 1 769 System doesnrsquot come on immediately 1 769 Limited field of view 1 769 Objects are closer than they appear when looking at video 2 1538
Q8 How easy was it to learn how to use your vehiclersquos backing aid and rearview camera together to judge the distance to objects behind your vehicle (circle one)
Response Count Percentage Very easy to learn 3 2308 Somewhat easy to learn 6 4615 Somewhat difficult to learn 1 769 Very difficult to learn 0 0 I have not tried to learn how to use the backing aid 3 2308 I do not want to learn how to use the backing aid 1 769
105
Q9 Were there things that were especially difficult to learn about your vehiclersquos backing aid system andor rearview camera (circle one)
Response Count Percentage Yes 5 3846 No 8 6154
If yes please explain Tends to ignore sounds since a user cannot tell the difference when the sounds
go off when parking and backing 1 769
Find it hard to break a 25 year behavior or pattern 1 769
Find it hard to watch camera and more comfortable to look over the shoulder when backing up 1 769
Distance is not easy to judge 2 1538
Q10 Are you aware of any warnings or limitations about your vehiclersquos backing aid system (circle one)
Response Count Percentage Yes 3 2308 No 9 6923 No Response (Blank) 1 769
If yes please explain False alarms of the sensors (in environments such as sides of a garage drive-
thru windows and driveways having a slope) 3 2308
Q11 In the last two weeks did you ever use just the backing aid system andor rearview camera when backing without checking the mirrors or turning to look out the rear window (circle
one) Response Count Percentage Yes 2 1538 No 11 8462
Q12 Which of the following best describes how much you normally pay attention to the backing aid system display when backing (circle one)
Response Count Percentage I rarely or never look at it 5 3846 I usually just take a quick glance at the display to determine if I can back up 5 3846 I share my attention about equally between the display and my mirrors or
glances over my shoulder 3 2308
I pay attention to the rearview camera screen more than to my mirrors and glances over my shoulder 0 0
I usually back up the vehicle using only the camera I donrsquot feel that I need to check mirrors or look out the rear windows
0 0
106
Q13 Which of the following best describes how much you normally pay attention to the rearview camera when backing (circle one)
Response Count Percentage I rarely or never look at it 3 2308 I usually just take a quick glance at the camera screen to determine if I
can back up 5 3846
I share my attention about equally between the rearview camera screen and my mirrors or glances over my shoulder
5 3846
I pay attention to the rearview camera screen more than to my mirrors and glances over my shoulder
1 769
I usually back up the vehicle using only the camera I donrsquot feel that I need to check mirrors or look out the rear windows
0 0
Q14 Imagine that your vehiclersquos backing aid system and rearview camera broke down How would your driving behavior change if you could not use these systems anymore (check
boxes for all that apply) Response Count Percentage I would back up much more slowly 6 4615 I would avoid parking places where I would have to back up 1 769 I would not try to fit into tight parking spaces 1 769 I would rely more on my mirrors andor glances over my shoulder to see
what is behind my vehicle 8 6154
My driving behavior would not change 3 2308 Other (specify) 0 0
Q15 How well does your vehiclersquos backing aid system and rearview camera work in the following weather conditions (choose one response for each row)
Q15A Darkness Response Count Percentage Not at All 0 0 Poorly 3 2308 Fairly Well 5 3846 Perfectly 3 2308 Donrsquot Know 2 1538
107
Q15B Fog Response Count Percentage Not at All 0 0 Poorly 1 769 Fairly Well 4 3077 Perfectly 1 769 Donrsquot Know 7 5385
Q15C Cold temperatures Response Count Percentage Not at All 0 0 Poorly 0 0 Fairly Well 4 3077 Perfectly 5 3846 Donrsquot Know 4 3077
Q15D Rain Response Count Percentage Not at All 0 0 Poorly 2 1538 Fairly Well 10 7692 Perfectly 0 0 Donrsquot Know 1 769
Q15E Snow Response Count Percentage Not at All 0 0 Poorly 2 1538 Fairly Well 4 3077 Perfectly 1 769 Donrsquot Know 6 4615
108
Q15F Bright sun (1 participant commented instead of circling a response) Response Count Percentage Not at All 0 0 Poorly 2 1538 Fairly Well 5 3846 Perfectly 4 3077 Donrsquot Know 1 769 Comment hard to see image in the bright sun but the sensors still work under
such conditions 1 769
Q15 Part 2 Are there any other conditions where your vehiclersquos backing aid system or rearview camera does not work well Explain
When camera lens is dirty 1 769 Glare on the screen 1 769 See above comment in lsquoBright sunrsquo section (Q15F)
Q16 Please rate how well the backing aid and rearview camera would assist you to avoid colliding under the following circumstances (choose one response for each row)
Q16A You are slowly backing out of a driveway into the street There is a car that you canrsquot see approaching on the street as you begin to back into its path
Response Count Percentage Not at All 1 769 Poorly 7 5385 Fairly Well 3 2308 Perfectly 1 769 Donrsquot Know 1 769
Q16B You are backing quickly down a long driveway going about 10 mph There is a bicycle behind the vehicle that you didnrsquot see
Response Count Percentage Not at All 0 0 Poorly 2 1538 Fairly Well 8 6154 Perfectly 2 1538 Donrsquot Know 1 769
109
Q16C You begin to back out of a garage and there is a child immediately under the rear bumper Response Count Percentage Not at All 4 3077 Poorly 4 3077 Fairly Well 5 3846 Perfectly 1 769 Donrsquot Know 0 0
Q16D You are slowly backing out of a parking space and there is a pedestrian standing 10 feet behind your rear bumper
Response Count Percentage Not at All 0 0 Poorly 3 2308 Fairly Well 5 3846 Perfectly 5 3846 Donrsquot Know 0 0
Q16E You are backing up to a narrow sign post Response Count Percentage Not at All 0 0 Poorly 2 1538 Fairly Well 5 3846 Perfectly 4 3077 Donrsquot Know 2 1538 Q16F You are backing into a parallel parking space The space is tight and you have to back very
close to the car behind you Response Count Percentage Not at All 0 0 Poorly 3 2308 Fairly Well 7 5385 Perfectly 3 2308 Donrsquot Know 0 0
Q17 Overall how easy are the backing aid system and rearview camera to use when backing out of a driveway (circle one)
Response Count Percentage Very easy to use 5 3846 Somewhat easy to use 5 3846 Somewhat difficult to use 0 0 Very difficult to use 3 2308 Donrsquot Know 0 0
110
Q18 Your vehiclersquos backing aid system has both lightssymbols sounds and a rearview camera display Which do you rely on more (circle one)
Response Count Percentage I rely on the lightssymbols more than the sounds 0 0 I rely on the sounds more than the lightssymbols 3 2308 I rely on the rearview video display more than the lightssymbols or sounds 2 1538 I rely on the sounds more than the rearview video display 2 1538 I rely on the lightssymbols and sounds about equally 1 769 I rely on the rearview video display and sounds about equally 3 2308 I rely on the rearview video display and lightssymbols and sounds about
equally 0 0
I donrsquot rely on the systems I just use my mirrors or look over my shoulder 5 3846
Q19 Have you ever unintentionally backed into something or had a ldquoclose callrdquo since you started driving this vehicle (circle one)
Response Count Percentage Yes 4 3077 No 9 6923
If yes please describe the situation Almost hit light post when backing into parking space 1 769 Situation with toy balls behind the back tires 1 769 Close calls with trash cans in the driveway 1 769 Got too close to another vehicle when backing into parking spot and had to
readjust 1 769
Q20 Since you have owned this vehicle have you driven another vehicle without a backing aid system or rearview video system and backed into something or had a ldquoclose callrdquo because
you expected the vehicle to give you a warning or display the obstacle on the video screen (circle one)
Response Count Percentage Yes 0 0 No 13 100
111
Q21 Have you ever received an unexpected warning when backing because you didnrsquot know what was behind your vehicle (circle one)
Response Count Percentage Yes (one person forgot to respond but answered subsequent questions as if
lsquoyesrsquo was the response) 9 6923
No 4 3077 If yes then how did you react the last time this happened
I got out of the vehicle and checked for obstacles 5 3846 I stopped immediately and checked my mirrors andor looked out the rear
window before continuing to back up 3 2308
I slowed down and looked for the obstacle before stopping 0 0 I ignored the warning because I was sure that no obstacle was behind me 1 769
If yes what was the reason for the last unexpected warning It was nothing that I could identify 1 769 It was another vehicle 1 769 It was a person 1 769 It was a pole post or tree 1 769 It was a curb 1 769 It was some other object on the ground 4 3077
Q22 Does using the backing aid system and rearview camera create any new driving problems or safety concerns for you (circle one)
Response Count Percentage Yes 5 3846 No 8 6154
If yes please explain More sounds causes more checking 1 769 It messes up the rear distance concept 1 769 Relying more on the camera and not the side mirrors or over the shoulder 1 769 Sounds are distracting and overly cautious (especially when parallel parking) 1 769 Would be harder to back up if one totally relied on the backing aid system and
rearview camera 1 769
112
Q23 Please indicate how much you agree or disagree with the following statements (choose one response for each row)
Q23A Itrsquos easy to hear the sounds made by the backing aid system Response Count Percentage Strongly Disagree 1 769 Disagree 2 1538 Neutral 0 0 Agree 0 0 Strongly Agree 10 7692 Not Applicable 0 0
Q23B Itrsquos easy to see the lightssymbols on the backing aid system Response Count Percentage Strongly Disagree 1 769 Disagree 3 2308 Neutral 4 3077 Agree 3 2308 Strongly Agree 0 0 Not Applicable 2 1538
Q23C Itrsquos easy to see rear obstacles in the rearview video system display Response Count Percentage Strongly Disagree 1 769 Disagree 0 0 Neutral 2 1538 Agree 10 7692 Strongly Agree 0 0 Not Applicable 0 0
Q23D When I use the backing aid I use my mirrors less often than I would if I did not have the backing aid
Response Count Percentage Strongly Disagree 4 3077 Disagree 5 3846 Neutral 0 0 Agree 3 2308 Strongly Agree 1 769 Not Applicable 0 0 Q23E When I use the backing aid I look over my shoulder less often than I would if I did not have
the backing aid Response Count Percentage Strongly Disagree 4 3077 Disagree 3 2308 Neutral 1 769 Agree 4 3077 Strongly Agree 1 769 Not Applicable 0 0
113
Q23F I am more confident in my ability to detect pedestrians when I use the backing aid Response Count Percentage Strongly Disagree 0 0 Disagree 2 1538 Neutral 4 3077 Agree 6 4615 Strongly Agree 1 769 Not Applicable 0 0
Q23G I am more willing to park in small or difficult parking spaces when I use the backing aid Response Count Percentage Strongly Disagree 2 1538 Disagree 4 3077 Neutral 5 3846 Agree 2 1538 Strongly Agree 0 0 Not Applicable 0 0
Q23H The backing aid gives me a good idea of my distance from an obstacle Response Count Percentage Strongly Disagree 2 1538 Disagree 2 1538 Neutral 1 769 Agree 8 6154 Strongly Agree 0 0 Not Applicable 0 0
114
Q23I The backing aid gives alerts with enough time to avoid hitting an obstacle Response Count Percentage Strongly Disagree 1 769 Disagree 1 769 Neutral 3 2308 Agree 7 5385 Strongly Agree 1 769 Not Applicable 0 0 Q23J The backing aid gives too many false warnings when I am not in danger of hitting anything Response Count Percentage Strongly Disagree 0 0 Disagree 6 4615 Neutral 1 769 Agree 5 3846 Strongly Agree 1 769 Not Applicable 0 0
Q23K The backing aid fails to warn me about an obstacle when it should have Response Count Percentage Strongly Disagree 1 769 Disagree 8 6154 Neutral 4 3077 Agree 0 0 Strongly Agree 0 0 Not Applicable 0 0
115
Q24 Please indicate how much you agree or disagree with the following statements (choose one Q24A The rearview camera screen is in a location where it is easy to see when I am backing
Response Count Percentage Strongly Disagree 2 1538 Disagree 0 0 Neutral 2 1538 Agree 6 4615 Strongly Agree 3 2308
Q24B I am more confident in my backing abilities when I use the rearview camera Response Count Percentage Strongly Disagree 3 2308 Disagree 1 769 Neutral 1 769 Agree 4 3077 Strongly Agree 4 3077
Q24C I am more willing to park in small or difficult parking spaces when I use the rearview camera
Response Count Percentage Strongly Disagree 3 2308 Disagree 3 2308 Neutral 3 2308 Agree 4 3077 Strongly Agree 0 0
Q24D Itrsquos easy to tell how close I am to an obstacle by looking at the rearview camera display Response Count Percentage Strongly Disagree 4 3077 Disagree 2 1538 Neutral 3 2308 Agree 4 3077 Strongly Agree 0 0
116
Q24E The rearview camera does not show the entire area behind the vehicle that I need to see when backing in other words there is a blind spot
Response Count Percentage Strongly Disagree 0 0 Disagree 5 3846 Neutral 1 769 Agree 6 4615 Strongly Agree 1 769
Q24F The rearview camera display gets blurry or hard to see if I am moving Response Count Percentage Strongly Disagree 2 1538 Disagree 6 4615 Neutral 4 3077 Agree 1 769 Strongly Agree 0 0
Q24G The rearview camera gets dirty and makes obstacles hard to see Response Count Percentage Strongly Disagree 2 1538 Disagree 6 4615 Neutral 2 1538 Agree 2 1538 Strongly Agree 1 769
Q24H Sun glare on the video display makes it hard for me to see objects or people Response Count Percentage Strongly Disagree 0 0 Disagree 2 1538 Neutral 2 1538 Agree 6 4615 Strongly Agree 3 2308
Q24I Itrsquos hard to distinguish something or someone who may be in a shadow area behind my vehicle (Image contrast level is poor in camera)
Response Count Percentage Strongly Disagree 0 0 Disagree 3 2308 Neutral 6 4615 Agree 3 2308 Strongly Agree 1 769
Q24J My risk of hitting somebody while backing is lower with the rearview camera than without it Response Count Percentage Strongly Disagree 0 0 Disagree 1 769 Neutral 3 2308 Agree 6 4615 Strongly Agree 3 2308
117
Q25 Suppose that the diagram below shows an overhead view of your vehicle and areas labeled ldquoArdquo ndash ldquoQrdquo Based on your experience please circle the letters for all areas where your rearview camera would show you obstacles such as a small child standing behind the
vehicle
Response Areas Count Percentage A 1 769 B 5 3846 C 9 6923 D 12 9231 E 11 8462 F 12 9231 G 11 8462 H 12 9231 I 9 6923 J 5 3846 K 1 769 L 5 3846 M 9 6923 N 5 3846 O 10 7692 P 11 8462 Q 10 7692
Rear Bumper
Front Bumper
Distance in feet
2
3
4
5
6
7
8
9
10
11
0
1
12
13
14
15
16
17
20
18
19
A
B
C
D
E F G
H
I
K
J
L M N
O P Q
118
Count
0 1 2 Bumper 2 1 0
0 1 7 7 1 0 7 8 7
0 1 7 12 12 12 7 1 0
0 1 5 9 5 1 0
0 1 4 5 4 1 0
0 1 4 5 4 1 0
0 1 3 3 3 1 0
0 0 1 2 1 0 0
0 0 1 1 1 0 0
0 0 1 1 1 0 0
0 0 1 1 1 0 0
Percentages
0 77 154 Bumper 154 77 0
0 77 538 538 77 0 538 615 538
0 77 538 923 923 923 538 77 0
0 77 385 692 385 77 0
0 77 308 385 308 77 0
0 77 308 385 308 77 0
0 77 231 231 231 77 0
0 0 77 154 77 0 0
0 0 77 77 77 0 0
0 0 77 77 77 0 0
0 0 77 77 77 0 0
119
Q26 Suppose that the diagram below shows an overhead view of your vehicle Based on your experience write an ldquoXrdquo in all rectangles where you think your backing aid system would
detect a small standing child and give you a warning
Q27 How has your reliance on the backing aid and rearview video systems changed since you first got the vehicle (circle one) If it changed then why
Response Count Percentage I rely on it more now than I did in the beginning 8 6154 I rely on it less now than I did in the beginning 1 769 My reliance has stayed about the same 4 3077
If you rely on it more now than in the beginning then why It makes a noise 1 769 I rely on the camera due to blind spots when looking over the shoulder 1 769 Gotten used to having it ndash use the camera more and ignore the sensors more 1 769 After learning about the distance over time 1 769 No Response (Blank) 4 3077
If you rely on it less now than in the beginning then why No Response (Blank) 1 769
Q28 Overall does having the backing aid make you a safer driver (circle one) Response Count Percentage Yes safer 7 5385 Neither more nor less safe 6 4615 No less safe 0 0
120
Q29 Does using the backing aid andor rearview video system create any new driving problems or safety concerns for you (circle one)
Response Count Percentage Yes 5 3846 No 8 6154
If yes please explain They create a need to look closer 1 769 The beep is distracting 1 769 There are false alarms with backing aid like at a drive-thru window 1 769 One relies on the sensors to the point of not checking the mirrors 1 769 If one uses it and looks over the shoulder then one is more likely to run into
something 1 769
Q30 Is there anything about the way that the backing aid andor rearview video system works that you think should be improved (circle one)
Response Count Percentage Yes 8 6154 No 5 3846
If yes please explain A different sound for backing parking would be helpful ndash become immune to
warning sound when parking 1 769
Need different beeping sounds for the side versus the rear 1 769 Consider more sensors and no camera 1 769 Provide a better judge of distance 1 769 Therersquos a time lapse when the video comes on 1 769 Directly behind the vehicle is undetected by the backing aid 1 769 Have a way to temporarily turn off the sensor 1 769 Have it behind the person so it can be seen when one is turned around to back
up 1 769
Q31 In general do you believe that car manufacturers are doing enough to design vehicles to accommodate an aging population (circle one)
Response Count Percentage Yes 11 8462 No 2 1538
If you answered ldquonordquo then what more do you believe could be done It would be good to have seats that turned toward the door and that a lift device
might also be good 1 769
There is always more that can be done 1 769
121
118 Appendix H Details of Mechanisms Used in Presenting the Obstacle Event
The obstacle event involved a two-dimensional life-size image of a child popping up behind the test vehicle while the participant was backing out of a garage at the end of the second test drive The image consisted of a full-color photo a 36-inch-tall toddler The photo was printed on a corrugated plastic substrate (see Figure 16) The 36-inchshyheight corresponded approximately to the height of a 25 year old child
A 6 inch by 12 inch piece of sheet metal was attached to the back side of the photo sheet using tape The plate was positioned on the lower portion of the cutout so the edge extended slightly outside of the childrsquos right leg A 6-inch length of metal hinge was attached with screws to the bottom of the metal plate to form the fulcrum Two holes were drilled though the plate and child cutout for attachment of a spring and tether Figure 38 shows the locations of the spring eye bolt and tether holes
Figure 47 Backing Plate for Cutout
122
The dimensions of the spring were 516 inch x 16-18 inches x 0047 inch (Century Spring Corporation part number CS-3) The spring was attached to an eye bolt using a thick zip tie Additional cable ties were fastened to the remaining eye bolt space in order the keep the spring attachment point near the middle part of the bolt eye
The tether was a two-piece construction The first piece was a loop made from a 25 inch long piece of 50 pound test monofilament line and a wire cable stop The cable stop was crimped to the two ends of the 50 pound test line to create a loop 1rdquo in length when the loop was pinched lengthwise The loop was then pushed through the tether hole from the backing plate side until the cable stop contacted the plate and the loop protruded from front side of the child cutout
The second piece of the tether was constructed of a length of 17 pound test monofilament with a size 5 barrel swivel attached to each end The barrel swivels had clips that allow for quick connectdisconnect The length of this 17 pound test tether piece measured 1325rdquo from tip to tip of the barrel swivels One swivel clip was attached to the 50 pound test loop while the other clip was eventually attached to a pavement anchor
At this point in construction the entire back side of this assembly was coated with gray textured spray paint in order to allow the cutout to blend in with asphalt pavement when laid flat prior to it being triggered into an upright position Figure 39 shows the back side of a completed assembly
Figure 48 Complete Cutout Assembly
Attachment to Pavement
The assembly was placed face down and the hinge was attached to the pavement using two lag bolts (the insert part of the lags remain permanently fixed in the pavement) A third lag was inserted into the pavement 17 inches back from the hinge to accept a
123
316rdquo eye bolt that was used to anchor the spring Two small sheet metal type eye screws were screwed directly into the pavement on either side of the cutout The screw on the cutoutrsquos left side was used as the anchor point for the tether The position of the eye was not critical as long as it did not interfere with the cutout laying flat and the tether allows the cutout to stand fully upright when extended The screw on the cutoutrsquos right side was used to hold a cotter pin in place The cotter pin held the assembly down with the spring stretched taught The ends of the cotter pin were bent to prevent it from hanging up on pavement irregularities and to accommodate for the thickness of the assembly Figure 40 shows the anchor points used
Figure 49 Anchor Points
The assembly raised to an upright position when the cotter pin was pulled due to spring tension and the tether stop The cotter pin was attached via a 50 pound test braided low-stretch line to a Bimba model 091-RP air piston The piston was connected to a Skinner Electric Valves 12V 1000 psi valve and an air source The piston and valve were mounted to a metal plate that was held in place with a 50 pound weight placed on top of the plate (see Figure 41)
124
Figure 50 Piston and Electric Air Valve Assembly
A 12V battery was used to activate the valve which in turn makes the piston move its full stroke thus pulling the cotter pin An NPD7050 field effect transistor was used to turn on the 12V batteryelectric valve circuit This transistor was turned on from a signal received from a garage door beam sensor (wwwnorthwestern1combeam_detectorhtm)
The garage door sensor was installed on the garage floor behind the front wheel stop mat so that the vehiclersquos front wheels break the garage door sensor beam when backing up The breaking of the beam triggered the NPD7050 transistor The garage door sensor had its own power supply which was connected to a hidden toggle switch Thus the beam could be turned off until the garage door was open and any technicians were clear of the beam eliminating any false triggers by persons walking through the beam before the event began
125
DOT HS 811 024September 2008

DISCLAIMER
This publication is distributed by the US Department of Transportation National
Highway Traffic Safety Administration in the interest of information exchange The
opinions findings and conclusions expressed in this publication are those of the
author(s) and not necessarily those of the Department of Transportation or the National
Highway Traffic Safety Administration The United States Government assumes no
liability for its contents or use thereof If trade or manufacturersrsquo names or products are
mentioned it is because they are considered essential to the object of the publication
and should not be construed as an endorsement The United States Government does
not endorse products or manufacturers
ii
Technical Report Documentation Page 1 Report No DOT HS 811 024
2 Government Accession No 3 Recipients Catalog No
4 Title and Subtitle
On-Road Study of Driversrsquo Use of Rearview Video Systems (ORSDURVS)
5 Report Date September 2008
6 Performing Organization Code NHTSANVS-312
7 Author(s) Elizabeth N Mazzae and Frank Barickman National Highway Traffic Safety Administration G H Scott Baldwin and Thomas Ranney Transportation Research Center Inc
8 Performing Organization Report No
9 Performing Organization Name and Address National Highway Traffic Safety Administration Vehicle Research and Test Center PO Box 37 East Liberty OH 43319
10 Work Unit No (TRAIS)
11 Contract or Grant No
12 Sponsoring Agency Name and AddressNational Highway Traffic Safety Administration1200 New Jersey Ave SE
Washington DC 20590
13 Type of Report and Period Covered
Final Report 14 Sponsoring Agency Code
15 Supplementary Notes The authors thank Heath Albrecht Adam Andrella Christopher Boday Jodi Clark Thomas Gerlach Ed Parmer and Scott Vasko of TRC Steve Wilson of SSI and John Martin of The Ohio State University for their technical support in performing this research
16 Abstract Driverrsquos use of rearview video (RV) systems was observed during staged and naturalistic backing maneuvers to determine
whether drivers look at the RV display during backing and whether use of the system affects backing behavior The 37 test participants aged 25 to 60 years were comprised of 12 drivers of RV equipped vehicles 13 drivers of vehicles equipped with an RV system and a rear parking sensor system (RPS) and 12 drivers of vehicles having no backing aid All participants had driven and owned a 2007 Honda Odyssey minivan as their primary vehicle for at least 6 months Participants were told that the purpose of the study was to assess how drivers learn to use the features and functions of a new vehicle
Participants visited the sponsorrsquos research lab to have unobtrusive video and other data recording equipment installed in their personal vehicles and take a brief test drive Participants then drove their vehicles for a period of 4 weeks in their normal daily activities while backing maneuvers were recorded At the end of the 4 weeks participants returned to the research lab to have the recording equipment removed Participants took a 2nd test drive identical to the first except that when backing out of the garage bay at the end of the drive an unexpected obstacle appeared behind the vehicle
Drivers with RV made 13 to 14 percent of glances to the RV video screen during initial phases of backing in the staged maneuvers independent of system presence drivers spent over 25 percent of backing time looking over their right shoulder in the staged backing maneuvers Only participants with an RV system who looked at the RV display more than once during the maneuver avoided a crash Results showed that RV system presence was associated with a statistically significant 28 percent reduction in crashes compared with the unexpected obstacle participants without a system All 12 participants in the ldquono systemrdquo condition crashed More participants in the lsquoRV amp RPSrsquo condition crashed (85 percent) than did in the RV condition (58 percent) Substantial benefits of the presence of an RPS system were not seen in the staged obstacle event Only 5 of 13 participants in the ldquoRV amp RPSrsquo condition received RPS warning indicating the presence of a rear obstacle Of those 5 participants 4 crashed
In naturalistic backing maneuvers the 37 participants made 6145 backing maneuvers None of the 6145 naturalistic backing events resulted in a significant collision There were several minor collisions during routine backing with for example trash cans and other vehicles Approximately 61 percent of backing events involved no concurrent driver activity In real-world backing situations drivers with RV systems spent 8 to 12 percent of the backing time looking at the RV display On average drivers made less than one glance to the console or RV display location when no video display was present versus 217 glances when only the RV system was present and 165 glances with RV plus RPS Overall drivers looked at least once at the RV display on approximately 65 percent of backing events and looked more than once at RV on approximately 40 percent of backing events
Overall results of this study revealed that drivers look at rearview video displays during backing maneuvers at least some of the time Approximately 14 percent of glances in baseline and obstacle events and 10 percent of glances in naturalistic backing maneuvers went to the RV display In addition there was no evidence to support the hypothesis that driverrsquos backing behavior (ie speed and acceleration) was influenced by the presence of absence of an RV system in either the staged obstacle event or the naturalistic backing maneuvers Driversrsquo average backing speed in naturalistic backing maneuvers was 226 miles per hour 17 Key Words 18 Distribution Statement
Document is available to the public from the National Technical Information Service Springfield VA 22161
19 Security Classif (of this report) Unclassified
20 Security Classif (of this page) Unclassified
21 No of Pages 139
22 Price
Form DOT F 17007 (8-72) Reproduction of completed page authorized
ii
TABLE OF CONTENTS
TABLE OF CONTENTS i
LIST OF FIGURES iii
LIST OF TABLES v
EXECUTIVE SUMMARY vii
10 INTRODUCTION 111 Background 112 Related Research 213 Current Study Objectives 3
20 VEHICLE SELECTION 521 Performance of 2007 Honda Odyssey Parking Sensor System 11
211 Odyssey RPS Performance in Detecting Stationary Objects 11212 Sensor Detection Zone Area Repeatability Tests with Stationary Objects 14213 Odyssey RPS Performance in Detecting Dynamic Objects 18
30 METHOD 2131 Experimental Design 2132 Participant Recruitment 2133 Participants 2234 Ruse 2235 Data Acquisition and Instrumentation 22
40 PROCEDURE 2541 Initial Meeting 2542 Naturalistic Driving Period 2643 Final Meeting and Surprise Obstacle Event 26
431 Details of the Obstacle Event Scenario 2744 Data Reduction Method 31
50 RESULTS NATURALISTIC DRIVING 3351 Characteristics of Naturalistic Driving 3352 Characteristics of Naturalistic Backing Maneuvers 3453 Naturalistic Backing Crashes 3754 Eye Glance Behavior During Naturalistic Backing Events 38
541 Eye Glance Behavior During Backing as a Function of Environmental Conditions 42
55 Driversrsquo Activities During Naturalistic Backing Events 5056 RPS Use 52
60 RESULTS INITIAL lsquoBASELINE EVENTrsquo AND FINAL lsquoOBSTACLE EVENTrsquo 5361 Backing Behavior During Baseline and Obstacle Events 5362 Obstacle Event Outcome Results 55
63 Eye Glance Behavior During Baseline and Obstacle Events 59
70 QUESTIONNAIRE RESULTS 65
80 DISCUSSION 7281 Rearview Video System Display Response Time 7282 Why Was RV (only) Associated with Fewer Crashes Than RV amp RPS 7383 Impact of Rearview Video Use on Likelihood of Backover Crash Avoidance 7484 Caveats 7485 What is ldquoGoodrdquo Driver Glance Behavior During Backing 75
90 SUMMARY and CONCLUSIONS 76
100 REFERENCES 79
110 APPENDICES 80111 Appendix A Results for Performance Testing of the 2007 Honda Odysseyrsquos
Parking Sensor System ndash Front Sensors 80112 Appendix B Participant Information Summary 81113 Appendix C Vehicle Condition Check Sheet 91114 Appendix D Participant Debrief Form 92115 Appendix E Participant Questionnaire With Results (No System) 93116 Appendix F Participant Questionnaire With Results (Rearview Video Only) 95117 Appendix G Participant Questionnaire With Results (Rearview Video and
Rear Parking Sensors) 104118 Appendix H Details of Mechanisms Used in Presenting the Obstacle Event
122
ii
LIST OF FIGURES
Figure 1 Percent Crashes by System Condition for the Staged Obstacle Event viiiFigure 2 Number of Glances Per Naturalistic Backing Maneuver Trial to the
Rearview Video Display or Center Console Area (For the lsquoNo Systemrsquo Condition) x
Figure 3 Rearview Video System Visual Display of the 2007 Honda Odyssey 6Figure 4 Field of View of the 2007 Honda Odyssey Rearview Video System for a 294
Inch-Tall Object 7Figure 5 Rear Field of View for the 2007 Honda Odyssey with 60-Inch-Tall Driver
Viewing a 294 Inch-Tall Object 8Figure 6 Rear Field of View for the 2007 Honda Odyssey with 70-Inch-Tall Driver
Viewing a 294 Inch-Tall Object 9Figure 7 Photo of Warning Message from Odyssey Parking Sensor System 10Figure 8 Image of the Locations of the Four Rear Parking System Sensors 11Figure 9 2007 Honda Odyssey RPS Detection Results for the 18-Inch-Tall Traffic
Cone 12Figure 10 2007 Honda Odyssey RPS Detection Results for the 36-Inch-Tall Traffic
Cone 13Figure 11 2007 Honda Odyssey RPS Detection Results for the 1-Year-Old ATD 13Figure 12 2007 Honda Odyssey RPS Detection Results for the 3-Year-Old ATD 14Figure 13 Repeatability Test Results for the 2007 Odyssey RPS Detecting a 28shy
Inch-Tall Traffic Cone 15Figure 14 Repeatability Test Results for the 2007 Odyssey RPS Detecting a 40shy
Inch-Tall PVC Pole 16Figure 15 Repeatability Test Results for the 2007 Honda Odyssey RPS Detecting an
Adult Male 17Figure 16 Illustration of How Test Objects Were Towed Behind the Test Vehicle 18Figure 17 Numbered Walking Paths for ldquoAdult Waking Diagonallyrdquo Trials 20Figure 18 Two-Dimensional Image of a Child Used in the Surprise Obstacle Event 28Figure 19 Photograph of the Obstacle at the Beginning of Surprise Obstacle Event29Figure 20 Photograph of the Obstacle at the End of Surprise Obstacle Event 30Figure 21 Locations of the Subject Vehicle Obstacle and Surrounding Objects
During the Staged Backing Maneuver 31Figure 22 Mean Percentage of Glances by Glance Location and System Condition39Figure 23 Mean Number of Glances Per Backing Maneuver by Glance Location and
System Condition 40Figure 24 Mean Total Glance time by Glance Location and System Condition 41Figure 25 Mean Glance Duration by Glance Location and System Condition 41Figure 26 Mean Percentage of Glance Time by Location and System Condition 42Figure 27 Percentage Glance Time by Eye Glance Location and Maneuver Length
43Figure 28 Percentage Glance Time by Location and Visibility 44Figure 29 Percentage Glance Time by Starting Location and Glance Location 44Figure 30 Percent Glance Time by Starting Location and System Condition 45Figure 31 Percent Glance Time by Visibility No System 47
iii
Figure 32 Percent Glance Time by Backing Maneuver Length and System Condition 49
Figure 33 Mean Time (plusmnSD) Between Shifting into Reverse Gear and the Beginning of Rearward Motion (Baseline and Obstacle Events) 53
Figure 34 Mean Backing Speed (plusmnSD) by System Condition (Baseline and Obstacle Events) 54
Figure 35 Mean Maximum Backing Speed (plusmnSD) by System Condition (Baseline and Obstacle Events) 54
Figure 36 Maximum Backing Acceleration (plusmnSD) by System (Baseline and Obstacle Events) 55
Figure 37 Percent Crashes by System Condition for the Staged Obstacle Event 56Figure 38 Summary of Participantsrsquo Glances to the Rearview Video System During
the Obstacle Event 57Figure 39 Obstacle Event Crashes as a Function of Rearview Video Glances 58Figure 40 Mean Number of Glances Per Trial by Glance Location and System
(Baseline and Obstacle Events) 62Figure 41 Mean Percentage of Glances by Glance Location and System Condition
(Baseline and Obstacle Events) 63Figure 42 Mean Glance Duration by Glance Location and System Condition
(Baseline and Obstacle Events) 63Figure 43 Mean Percentage of Total Glance Time by Glance Location and System
Condition (Baseline and Obstacle Events) 64Figure 44 Graphic Used to Assess in Which Areas Participants Thought a Small
Child Standing Behind Their Vehicle Could Be Seen in the RV Display 69Figure 45 Summary of Questionnaire Responses Indicating in Which Areas a Small
Standing Child Would Be Detected by the RPS 70Figure 46 PSS Front Sensorsrsquo Detection Results for the Various Traffic Cones a 40shy
iInch-Tall PVC Pole and an Adult Male 80Figure 47 Backing Plate for Cutout 122Figure 48 Complete Cutout Assembly 123Figure 49 Anchor Points 124Figure 50 Piston and Electric Air Valve Assembly 125
iv
LIST OF TABLES
Table 1 System Conditions and Numbers of Test Participants viiTable 2 Availability of Vehicles Equipped with Parking Aid Systems and Rearview
Video Systems in the US (20052006 Model Year) 5Table 3 Maximum Detection Range as a Function of Test Object Speed 19Table 4 Data Channels 23Table 5 Characteristics of the Participantsrsquo Naturalistic Driving 33Table 6 Characteristics of the Participants Naturalistic Driving By System
Condition 34Table 7 Characteristics of the 6145 Recorded Backing Maneuver Events 34Table 8 Distribution of Time Between Shift to Reverse and Beginning of Backing by
Backing System Condition (Naturalistic Backing Events) 35Table 9 Mean Maximum Backing Speed by System Condition (Naturalistic Backing
Events) 36Table 10 Quantiles of Overall Distribution of Maximum Backing Speed (from 6037
Naturalistic Backing Events) 36Table 11 Extreme Values of Maximum Backing Speed (from 6037 Naturalistic
Backing Events) 37Table 12 Descriptive Statistics for Backing Maneuver Characteristics by Maneuver
Starting Location 37Table 13 Naturalistic Crashes Observed 38Table 14 Number of Glances to the RV Display Per Backing Maneuver by System
Condition 39Table 15 Descriptive Characteristics of Naturalistic Backing Maneuvers by
Maneuver Length 43Table 16 Driversrsquo Activities During Backing Events 50Table 17 Summary of Observed Instances of Multiple Activities During Backing 51Table 18 Driversrsquo Primary Activity By System Condition 52Table 19 Mean Maximum Backing Speed by System Condition (Baseline and
Obstacle Events) 55Table 20 Staged Obstacle Event Outcomes 56Table 21 Hypothetical Staged Obstacle Event Outcomes 59Table 22 Obstacle Event Outcomes as a Function of RPS Detection 59Table 23 Summary of Participantsrsquo Glances to the Rearview Video System During
the Baseline and Obstacle Events 60Table 24 Number of Glances to the ConsoleRV Display by System and Baseline or
Event Trial 61Table 25 Number of Glances to the ConsoleRV Display by RV Presence and
Baseline or Event Trial 61Table 26 Questionnaire Responses Regarding Where Drivers Look to Determine
Whether the Area Behind Their Vehicle is Clear Prior to Backing 65Table 27 Percent Responses Regarding Why ldquoNo Systemrdquo Participants Did Not
Choose To Purchase a Backing Aid System 66Table 28 Participant Responses Regarding Whether They Would Like Their Next
New Vehicle to be Equipped With a Backing Aid System (by System Condition) 66
v
Table 29 How Did Participants Learn to Use Their RV or RPS 66Table 30 How Well Does Your Vehiclersquos RPS (N=13) and RV (N=12) Work in the
Following Weather Conditions 67Table 31 Summary of Participant Responses to the Question ldquoHow Easy is Your
(System) To Use When Backing Out of a Driveway 68Table 32 Summary of Questionnaire Responses Indicating in Which Areas (in
Figure 44) a Small Standing Child Could Be Seen in the RV Display 68Table 33 RV Display Measured Response Time (s) 72
vi
EXECUTIVE SUMMARY
A backover crash involves a vehicle moving in reverse striking a person frequently a young child Over the past 15 years NHTSA has studied rear object detection systems for heavy trucks medium straight trucks and passenger vehicles and evaluated their performance in detecting people As recently as 2007 NHTSA research found that sensor-based systems perform poorly and unreliably in detecting people particularly children
The advent of rearview video systems gave drivers a means to see the area directly behind the vehicle without reliability issues or object detection performance issues in most conditions However we are aware of no research to date that has examined driversrsquo use of rearview video systems in a naturalistic setting to assess driversrsquo ability to integrate this information source into their everyday backing behavior in real-world conditions
Research was conducted to examine driversrsquo use of rearview video systems during backing maneuvers The main purposes of the study were to 1) determine whether drivers look at the rearview video display during backing maneuvers and 2) determine whether use of the system affects backing performance (ie obstacle avoidance success)
An experiment was conducted to observe the driving behavior of drivers aged 25 to 60 years in both laboratory-staged and naturalistic backing maneuvers The 37 test participants were comprised of 12 drivers of a vehicle equipped with a rearview video (RV) system 13 drivers of vehicles equipped with an RV system and a rear parking sensor system (RPS) and 12 drivers of vehicles having no backing maneuver aid as summarized in Table 1 All participants drove a 2007 Honda Odyssey minivan as their primary vehicle and had owned the vehicle for at least 6 months prior to study participation Participants were told that the purpose of the study was to assess how drivers learn to use the features and functions of a new vehicle
Table 1 System Conditions and Numbers of Test Participants System Number of Test Participants No System 12 Rearview Video (RV) Only 12 Rearview Video and Rear Parking Sensors (RV amp RPS) 13
The Odysseyrsquos RV system had a center dashboard-mounted video display The Odysseyrsquos RPS had four rear bumper-mounted ultrasonic sensors and warned the driver of obstacles using a visual alert presented under the speedometer and an auditory alert
At the start of their participation drivers visited the sponsorrsquos research lab to consent to study participation and have an unobtrusive data recording system installed in their
vii
personal vehicles Installed equipment included five video cameras a video recorder and a data acquisition system which controlled the recording of driving events During this visit participants took a test drive in an instrumented vehicle that was essentially identical to their own At the end of the test drive participants backed out of a garage bay without incident Participants then drove their personal vehicles for a period of 4 weeks in their normal daily activities while backing maneuvers were recorded by the installed recording equipment At the end of the 4 weeks participants returned to the research lab to have the recording equipment removed from their vehicle Participants took a second test drive identical to that driven in their first visit except that when backing out of the garage bay at the end of the drive an unexpected obstacle appeared behind the vehicle The obstacle was a rigid photo image of a small child Participantsrsquo responses to this obstacle event were recorded
Staged Obstacle Event Results
The rearview video system examined in this study improved detection and avoidance of a crash with a simulated stationary object in the experimental trials Overall the RV system presence was associated with a 28 percent reduction in crashes with the unexpected obstacle presented at the end of the second test drive (ie 7 out of 25 participants with RV did not crash) Since it was essentially impossible to directly see the obstacle without an RV system 100 percent of participants in the lsquono systemrsquo condition crashed as shown below in Figure 1 Participants with an RV system experienced significantly fewer crashes than those without a system More participants in the lsquoRV amp RPSrsquo condition crashed (85 percent) than did participants in the RV condition (58 percent) however this difference was not statistically significant
100
90
80
70
60
50
40
30
20
10
0 None RV RV amp RPS RV and RV amp
RPS Combined
Perc
ent C
rash
es
Figure 1 Percent Crashes by System Condition for the Staged Obstacle Event
viii
Only participants with an RV system who looked at the RV display more than once during the backing maneuver avoided a crash Two participants with an RV system who looked at the display more than once and still crashed were likely unable to see the obstacle in the RV display due to a delay in the RV image appearance A brief examination of the timing of presentation of the RV image in that vehicle showed a 644 second delay between the time the driver shifted into reverse until the time the RV image appeared when reversing soon after starting the vehicle
Drivers varied in their use of the RV system during the staged baseline and event trials Specifically among drivers with an RV system 16 of 25 participants (64 percent) made at least one glance to the RV during the staged event trials When both baseline and event trials were considered the percentage of glance time directed at the RV display varied between 0 and 81 percent of the first 12 seconds of backing Drivers with RV made 13 to 14 percent of glances to the RV video display during initial phases of backing Without an RV system drivers could not see obstacle in the staged obstacle event Independent of system presence drivers spent over 25 percent of backing time looking over their right shoulder in the staged backing maneuvers
There are several possible reasons why the RV systems did not have a bigger benefit in the obstacle event trials These include the delay associated with the appearance of the image in the RV display the inappropriate timing of the driversrsquo looks to the RV system their failure to make multiple glances at the RV display and the possibility that drivers had strong expectations that no such event would occur in the research setting which may have led them to become less vigilant than in real-world backing
Substantial benefits associated with the presence of an RPS system on the vehicle were not seen in the staged obstacle event Only 5 of 13 participants in the lsquoRV amp RPSrsquo condition received RPS warnings indicating the presence of an obstacle behind the vehicle Of those 5 participants 4 crashed
Naturalistic Backing Results
In the naturalistic portion of this study among 37 participants each of whom participated for 28 days for a total of 42982 miles there were 6145 backing maneuvers A typical backing event took approximately 10 seconds and covered 34 feet Twenty-two percent of backing maneuvers involved multiple backing components in which backing motion was separated by a period of stopped time for example when a driver backed to the end of a driveway stopped to wait for traffic then continued backing into the street The results of naturalistic data collection reveal that on average drivers made approximately 114 backing maneuvers per trip average trip length was slightly less than 9 miles
None of the 6145 naturalistic backing events resulted in a significant collision There were several minor collisions during routine backing with for example trash cans and other vehicles
There is no evidence to support the hypothesis that driversrsquo backing behavior (ie speed and acceleration) was influenced by the presence or absence of an RV system
ix
ConsoleVideo
Driversrsquo average backing speed in naturalistic backing maneuvers was 226 miles per hour the average maximum speed was 364 miles per hour
Glance behavior during backing appears to be robust and relatively invariant over different environmental conditions In real-world backing situations drivers with RV systems spent 8 to 12 percent of the backing time looking at the location of the RV display Drivers with no system spent about 3 percent of their backing time looking at the center console area Ignoring the possible effects of differential exposure the differences between these values (5 to 9 percent) constitute one estimate of the percentage of backing time devoted to looking at the rearview video display Furthermore this result suggests that in addition to the routine preparatory tasks involving the console (radio HVAC) drivers regularly look at the RV system while backing Drivers with no RV system do not devote more glance time to the rear view mirror
Overall drivers looked at least once at the RV display on approximately 65 percent of backing events and looked more than once at the RV display on approximately 40 percent of backing events Figure 2 highlights that on average drivers made less than one (M=081) glance per trial to the consolevideo display location when no video display was present (eg to look at the vehicle clock) versus 217 (RV) and 189 glances (RV amp RPS) when the RV system was present Data suggest that participants in the RV amp RPS condition made no glances per trial to the RV display more often than those in the lsquoRV onlyrsquo condition The data also suggest that participants in the RV amp RPS condition made four or more glances per trial to the RV display less often than those in the lsquoRV onlyrsquo condition This trend of more participants with lsquoRV onlyrsquo looking at the RV display than those with RV amp RPS may indicate that participants in the RV amp RPS condition were relying on the sensors to alert them of an obstacle However differences in the particular backing situations between driver groups (ie differential exposure) or individual differences in backing habits between groups may have contributed to this difference
Num
ber o
f Gla
nces
None RV RV amp RPS
25
2
15
1
05
0
Figure 2 Number of Glances Per Naturalistic Backing Maneuver Trial to the Rearview Video Display or Center Console Area (For the lsquoNo Systemrsquo Condition)
x
Approximately 61 percent of backing events involved no concurrent driver activity Among the remaining 39 percent of backing events concurrent activities included activation of garage door remote (13 percent) talking with passenger (13 percent) using cell phone (3 percent) and securing seat belt (3 percent) among others In 508 backing events (approximately 10 percent of the subset for which driver activity was recorded) drivers were engaged in multiple concurrent activities while backing
The specific patterns of driver glance behavior and visual sampling of the center dashboard-mounted rearview video display may not be similar to those that would be observed in drivers using an RV display mounted in the center rearview mirror Additional research would be required to determine whether rates of driversrsquo glances to the RV display seen in this study would be similar with a display in the rearview mirror
Conclusions
Overall results of this study revealed that drivers look at rearview video displays during backing maneuvers at least some of the time Approximately 14 percent of glances in baseline and obstacle events and 10 percent of glances in naturalistic backing maneuvers were to the rearview video display While this evidence of driversrsquo use of the rearview video systems is encouraging it should be noted that due to the wide range of directions and speeds in which an obstacle might approach the area behind a vehicle and the timing in which a driver may choose to glance at the rearview video display a rearview video system cannot be expected to prevent all backing crashes
While rearview video systems offer the driver a useful tool for detecting rear obstacles some guidance may be necessary to educate drivers as to the most effective way to incorporate this new visual information source into their glance behavior during backing maneuvers Encouraging drivers to make more than one glance to the RV display during backing maneuvers and to glance at the display throughout the maneuver rather than just at the beginning may increase the benefits attainable with these systems
xi
10 INTRODUCTION
A backover crash is one in which a vehicle moving in reverse strikes a person Tragically the victims of these crashes are typically young children
The size of the backover safety problem can only be roughly estimated because many of the backover crashes that occur on private property are not recorded in State or Federal crash databases which focus on crashes occurring in traffic-ways Supplementing NHTSA crash records with death certificate reports backover crashes involving all vehicle types are estimated to cause at least 183 fatalities annually [1] In addition between 6700 and 7419 injuries per year result from pedestrian backovers [1] A substantial portion of these injuries are minor
11 Background
In 2006 in response to Section 10304 of the Safe Accountable Flexible Efficient Transportation Equity Act A Legacy for Users (SAFETEA-LU) the National Highway Traffic Safety Administration (NHTSA) published both a report to Congress about backover crashes [1] and an assessment of methods for reducing the incidence of injury death and property damage caused by collisions of backing passenger vehicles [2] This second report documented the results of an assessment of available backover avoidance technologies for their ability to detect a variety of objects including small children
Eight sensor-based parking aid systems were examined to measure a variety of aspects of their object detection performance Measurements included static field of view static field of view repeatability and dynamic detection range for a variety of test objects including small children An examination of three rear video and two auxiliary mirror systems was also conducted which involved measurement of field of view and displayed image quality
Test results revealed that sensor-based systems generally exhibited poor ability to detect pedestrians particularly children located behind the vehicle Sensor-based systemsrsquo performance in detecting children was inconsistent unreliable and in nearly all cases quite limited in range However the rearview video systems examined were found to accurately display images of pedestrians or obstacles behind the vehicle
While rearview video systems can display objects behind a vehicle unless coupled with electronic proximity sensors they cannot alert the driver to the presence of a rear obstacle Thus rearview video systems alone are passive and require the driver to take the initiative to look at the video display perceive any pedestrian or obstacle present and respond correctly Without knowing whether drivers will make effective use of rearview video systems it is not possible to estimate the benefits such a system may provide The true efficacy of rearview video systems cannot be known without assessing whether drivers effectively incorporate the information into their visual scanning patterns Thus the current research seeks to investigate whether drivers will actively use rearview video systems when making backing maneuvers
1
NHTSA also examined rear cross-view mirrors as part of a separate NHTSA study [3] that examined commercially-available rear object detection systems intended for use on medium straight trucks For this study NHTSA tested three sensor-based rear object detection systems one rear object detection system that combined sensors with rearview video one rearview video (only) rear object detection system and one rear cross-view mirror Overall the quality of the rear cross-view mirror image was found to be insufficient to allow drivers to resolve small objects behind the step van (or other vehicles of this length) It was found to be very hard to impossible to see small children over much of the blind zone behind the vehicle Larger children and adults were visible although there the combination of high distortion plus significant minification may reduce detection likelihood in certain portions of the blind zone Weather effects such as water droplets or ice on the mirror surface will obscure the view of images in the rear cross-view mirror People or objects behind a vehicle may not be sufficiently visible in the mirror in conditions of darkness Overall this study reported that rear cross-view mirrors are not a very effective means of allowing a driver to see behind a vehicle Additionally NHTSA has concerns that drivers may not use the mirrors effectively
12 Related Research
Two prior studies by General Motors (GM) examined driver performance while using rear parking aids that included an ultrasonic rear park assist system (URPA) and a rear video (RV) system [456]
The 2003 study [4] examined driver backing performance with an ultrasonic rear park assist (URPA) rear video (RV) URPA with RV or no aid The focus of the study was on parking behaviors therefore participants performed a number of parking trials Participants were asked to perform five parking tasks with each of the four levels of parking aid The four parking aid systems were presented using a 2002 Cadillac Escalade Seventy-two percent of participants drove an SUV truck or van as their primary vehicle while 19 percent reported their secondary vehicle was an SUV truck or van Prior to performing the trials the use of the parking aid systems was explained to the participant After all parking trials had been completed an unexpected obstacle scenario was presented to examine obstacle avoidance performance differences that could result from the presence or absence of the parking aid systems [4] Overall 23 of 29 (83 percent) participants crashed into the obstacle (pylon) Of 5 participants who did not strike the obstacle only 3 of them avoided it by viewing it in the video display The paper states that of the five participants who did not hit the obstacle ldquothree saw the obstacle using the RV (two in the RV condition one in the URPA with RV condition) one saw the obstacle in their mirror (in the URPA with RV condition) and one saw the obstacle out the back window (in the RV condition)rdquo However the authors report that glance behavior during the parking tasks indicated that drivers were using both the URPA and RV systems when available
The 2004 study [5] examined the effectiveness of backing warnings and showed low effectiveness for the warnings tested Driver performance during backing maneuvers was examined in an open parking lot using two instrumented vehicles both equipped
2
with prototype backing warning systems All participants were trained on the integrated parking assist capability of the warning system while a portion was provided specific training on the backing warning functionality A surprise obstacle event was presented with the assistance of a distraction task involving a small video screen adjacent to the rear window For drivers who received warnings from the system only 13 percent avoided hitting the obstacle Many drivers who experienced the warning (68 percent) demonstrated precautionary behaviors in response to the warning (eg covering the brake pedal) Participants reported that they did not expect there to be an obstacle present during the surprise obstacle maneuver Many participants reported searching for an obstacle after receiving the warning but since they ldquodidnrsquot see anythingrdquo they continued to back The authors noted that these observations suggest that expectancy is a powerful determinant guiding driver perception and behavior Many drivers appeared to want direct sensory confirmation of obstacle presence before initiating avoidance behaviors [6]
These studies used drivers who were unfamiliar with the use of the parking aid systems tested Furthermore participants drove ldquotest vehiclesrdquo which were not necessarily the same make model as a vehicle they drove on a regular basis Therefore it cannot be determined whether lack of familiarity with the systems or the test vehicle contributed to the poor parking aid system effectiveness in the unexpected obstacle scenario
13 Current Study Objectives
Research was conducted to examine driversrsquo use of rearview video systems during backing maneuvers The main purpose of the study was to 1) determine whether drivers look at the rearview video display prior to andor during backing and 2) determine whether use of the system affects backing performance (ie obstacle avoidance success) The following research questions were addressed
1 How do drivers ldquouserdquo the systemDo drivers of vehicles equipped with rearview video systems look at the video display during backing to gain information about the environment behind the vehicle
Do drivers of vehicles equipped with rearview video systems glance at the mirrors and over their shoulder less than drivers without such a system
Are glances made to the side and center rearview mirrors during a backing maneuver shorter in duration andor fewer in frequency when using a rearview video system than when not using such a system
Do drivers of vehicles equipped with rearview video systems look at the video before they initiate rearward motion of the vehicle
Do drivers of vehicles equipped with rearview video systems and backing sensors look at the video display less often during backing than do drivers with rearview video only
2 What effect do systems have on driversrsquo behavior and performance during backing maneuvers
3
Do drivers of vehicles equipped with rearview video systems experience fewer collisions with rear obstacles
Do drivers of vehicles equipped with a backing aid system perform backing maneuvers differently than drivers of vehicles without such equipment
4
20 VEHICLE SELECTION
A single vehicle makemodel was used in this study to prevent confounding of study results due to the differing physical characteristics of multiple vehicles To select a vehicle with features relevant to this research an early 2006 report [7] containing inventories of available in-vehicle technologies were reviewed to identify vehicles equipped with original equipment backing systems Table 2 taken from the Early Adopters Survey Results Report [8] shows the availability of rearview video and sensor-based backing systems on recent model year vehicles
Table 2 Availability of Vehicles Equipped with Parking Aid Systems and Rearview Video Systems in the US (20052006 Model Year)
System Vehicle Manufacturer
Model Lines with System as Optional
Equipment
Model Lines with Feature as Standard
Equipment Backing aid only 21 82 22 Rearview video system only 0 8 2 Backing aid and rearview video system 10 10 2
This study required a 2007 model year vehicle that could be obtained with a factory-installed rearview video system alone or augmented by a factory-installed backing aid system The vehicles that fit this description included models such as the Honda Odyssey Acura TL and MDX and Porsche Cayenne Based on this list of vehicles the model having the highest sales the Honda Odyssey was chosen for use in this study
The rearview video system of the 2007 Honda Odyssey operates whenever the vehicle is in reverse (R) gear and the ignition switch is in the ldquoonrdquo position The camera was located to the right side of the rear license plate The visual display for the system was located at the top center of the dashboard Figure 3 contains a photograph of the rearview camera systemrsquos visual display showing a grid of 1 foot squares Figure 4 contains a graphical representation of the field of view of the vehiclersquos rearview camera For comparison purposes Figures 5 and 6 present the rear field of view (from the side mirrors rearward) for the Odyssey using only direct glances and mirrors for a 60-inch-tall driver and a 70-inch-tall driver
5
Figure 3 Rearview Video System Visual Display of the 2007 Honda Odyssey
6
Figure 4 Field of View of the 2007 Honda Odyssey Rearview Video System for a 294 Inch-Tall Object
7
Figure 5 Rear Field of View for the 2007 Honda Odyssey with 60-Inch-Tall Driver Viewing a 294 Inch-Tall Object
8
Figure 6 Rear Field of View for the 2007 Honda Odyssey with 70-Inch-Tall Driver Viewing a 294 Inch-Tall Object
The Odysseyrsquos factory-equipped backing system was referred to as a ldquoParking Sensor Systemrdquo (PSS) Note that for the purposes of this report the rear sensor portion of the system is referred to as the ldquoRear Parking Systemrdquo or ldquoRPSrdquo The vehiclersquos ownerrsquos manual stated that the system ldquolets you know the approximate distance between your vehicle and most rear obstacles while you are parkingrdquo [9] The system alerts the driver to the presence of a rear obstacle using ldquoa beeperrdquo and ldquosystem messages on the multi-information displayrdquo [9] Figure 7 shows an image of a warning message from the Parking Sensor System The manual further states that ldquoAll obstacles may not always be sensed Even when the system is on you should look for obstacles near your vehicle to make sure it is safe to parkrdquo The Parking Sensor System could be activated and deactivated via a button on the dashboard
9
Figure 7 Photo of Warning Message from Odyssey Parking Sensor System
The vehiclersquos ownerrsquos manual [9] stated that the Parking Sensor System had two front corner sensors (20 in range) two rear corner sensors (20 in range) and a rear center sensor (70 in range) However the Odyssey ldquoTouringrdquo model vehicle acquired for use as a test drive vehicle for this study had two rear corner sensors and two rear center sensors as shown in Figure 8 According to the vehiclersquos ownerrsquos manual [9] the ldquorear center sensor works only when the shift level is in reverse (R) and the vehicle speed is less than 5 mph (8 kmh)rdquo The manual also stated that the ldquocorner sensors work only when the shift lever is in any position other than P and the vehicle speed is less than 5 mph (8 kmh) The system alerts the driver to the presence of a nearby obstacle using a visual indicator presented on the multi-information display The visual alert consists of an icon representing an overhead view of a car with a polygon adjacent to the location of the sensor that detected the obstacle The system uses three different beep frequencies to indicate the range of the obstacle detected (ldquoshort beepsrdquo for 16-20 in ldquovery short beepsrdquo for 12-16 in or ldquocontinuous beeprdquo for 12 in or less)
Two 2007 Honda Odyssey minivans were obtained for use as the test vehicles to be driven during the initial and final test drives These vehicles helped expedite the test procedure by allowing for the participantrsquos vehicle to have instrumentation installed or removed at the same time as the test drive was being conducted A Touring trim level Odyssey equipped with ldquoHonda Satellite-Linked Navigation System with voice recognition and rearview camerardquo was used as the test drive vehicle for participants owning vehicles equipped with rearview video (only) and rearview video plus parking sensors An Odyssey LX was used as the test drive vehicle for participants whose personal vehicle was not equipped with a rearview video system or rear parking sensors
10
Figure 8 Image of the Locations of the Four Rear Parking System Sensors
21 Performance of 2007 Honda Odyssey Parking Sensor System
Hardware testing was performed to characterize the performance of the 2007 Honda Odysseyrsquos s Rear Parking Sensors (RPS) portion of the Parking Sensor System (PSS) Tests measured the ability of the systemrsquos rear sensors to detect stationary and moving targets including an adult male various sizes of traffic cones two anthropomorphic test devices (ATD) representing a 1-year-old and 3-year-old child an ISO-specified PVC pole and a plastic traffic curb A detailed description of the methods used can be found in the NHTSA report ldquoExperimental Evaluation of the Performance of Available Backover Prevention Technologiesrdquo [2] Selected results of testing of the current vehicle are presented in this section Brief testing of the PSSrsquos front parking sensors was also performed and results are presented in Appendix A
211 Odyssey RPS Performance in Detecting Stationary Objects For stationary object testing trials were conducted to determine whether or not a particular test object was detected in a location on the test grid and what approximate level of warning was provided by the system A systemrsquos response was considered an ldquoinconsistent warningrdquo if the system produced a sporadic or occasional visual or auditory alert in response to the objectrsquos presence Each graph of detection results shows an overhead view of the test grid with the vehiclersquos rear bumper (not to scale) at the bottom of the graph positioned at the 0 longitudinal point on the grid
11
The RPS was found to be unable to detect short objects behind the vehicle including a 12-inch-tall traffic cone plastic parking curb and an adult male lying on the ground An 18-inch-tall traffic cone was detectable in the range of 1 to 4 feet from the vehiclersquos rear bumper however due to the height of the object and the shape of the sensor detection ldquobeamsrdquo it could not be detected within the first 12 inches as shown in Figure 9 The detection results for a 36-inch-tall traffic cone shown in Figure 10 indicate that this object twice as tall as the aforementioned one showed only slightly better detectability and still was generally invisible to the sensors within a 12-inch range The 1-year-old ATD with its 294-inch height was detectable within a 12-inch range in each outer one-third of the bumper span but was invisible in that range within 1 foot to either side of the vehiclersquos centerline Figure 11 also shows that the 1-year-old ATD was only detected consistently out to a distance of 4 feet The 3-year old ATD which was 372 inches in height was detected over a slightly broader area (up to 1 ft in either lateral direction) and 1 foot further in range than was the 1-year old ATD (see Figure 12)
Figure 9 2007 Honda Odyssey RPS Detection Results for the 18-Inch-Tall Traffic Cone
12
Figure 10 2007 Honda Odyssey RPS Detection Results for the 36-Inch-Tall Traffic Cone
Figure 11 2007 Honda Odyssey RPS Detection Results for the 1-Year-Old ATD
13
Figure 12 2007 Honda Odyssey RPS Detection Results for the 3-Year-Old ATD
212 Sensor Detection Zone Area Repeatability Tests with Stationary Objects Providing consistent accurate object detection performance is important to ensure the detection of critical objects and to ensure that the driver will trust and therefore use and respond to the system To assess repeatability additional trials of static sensor system detection zone measurements were conducted with a subset of test objects to capture day-to-day variability in the detection performance of sensor systems The degree of variability noted in these tests was whether or not an object was detected in a particular location (ie differences in level of warning provided were not noted) on a particular day Systemsrsquo performance in detecting objects was measured on each of 3 consecutive days The procedure used was the same as that used in the other static sensor system detection zone measurements Objects used in these tests included the 28-inch cone 40-inch-tall PVC pole and an adult male human
Figures 13 through 15 show the static detection zone repeatability test results Each figure contains three graphs one for each day in which the test was run Each graph shows an overhead view of the test grid with the vehiclersquos rear bumper positioned at the bottom of the graph at the 0 longitudinal point on the grid
Results for the 28-inch-tall traffic cone were fairly similar in each repetition with variability concentrated in the far extent of the systemrsquos range between 4 and 5 feet Detection results for the 40-inch-tall PVC pole were very consistent across the three repetitions with each test showing a detection range of 5 feet Results for detection of the adult male show consistent detection to a range of 5 feet and sporadic detection within the range of 5 to 6 feet The far left and right edges of the detection zone also showed variable detection of the adult male as shown in Figure 15 Overall the variability seen in these repeatability results is consistent with that of similar previously tested systems [2]
14
Figure 13 Repeatability Test Results for the 2007 Odyssey RPS Detecting a 28shyInch-Tall Traffic Cone
15
Figure 14 Repeatability Test Results for the 2007 Odyssey RPS Detecting a 40shyInch-Tall PVC Pole
16
Figure 15 Repeatability Test Results for the 2007 Honda Odyssey RPS Detecting an Adult Male
17
213 Odyssey RPS Performance in Detecting Dynamic Objects RPS performance in detecting objects moving behind the vehicle was measured using several test objects that were towed laterally (parallel to the vehiclersquos bumper) to determine the maximum range at which they were detected Figure 16 illustrates the way in which test objects were moved during this test The object was first moved behind the vehicle at a range of 1 foot from the rear bumper and if successfully detected the object was moved 1 foot further from the rear bumper Table 3 presents results for the maximum range at which the dynamic objects were detected by the RPS The maximum distance from the bumper at which any object was detected was 6 feet
Figure 16 Illustration of How Test Objects Were Towed Behind the Test Vehicle
18
Table 3 Maximum Detection Range as a Function of Test Object Speed TEST OBJECT TEST OBJECT SPEED (mph) MAXIMUM DETECTION
RANGE (ft) 40-inch PVC pole (as per ISO 17386)
2 5 3 5
CRABI 12-month-old ATD 2 4 3 3
Hybrid III 3-year-old ATD 2 4 3 4
Cozy coupe (toy car) 2 6 3 6
Adult male human (height 6 ft 275 in weight 183 lbs) Comfortable walking speed 5
Note Referred to in this report as ldquo1-year-old ATDrdquo
RPS performance was also tested in a variety of scenarios using a walking adult male The Odyssey RPS was able to detect an adult male walking laterally behind the vehicle out to a range of 5 ft An adult male walking a longitudinal path toward the rear of the vehicle was successful detected along paths located 1 to 3 ft to either side of the vehiclersquos centerline However an adult male walking toward the rear of the vehicle at the vehiclersquos centerline was not detected
Dynamic RPS performance trials were conducted with the adult walking diagonally with respect to the rear bumper (ie at a 45 degree angle) as shown in Figure 17 In this figure the rear bumper of the system-equipped test vehicle (not to scale) is shown at the bottom of the figure with the walking paths behind it indicated with arrows and labeled with numbers The subject performed two trials for each path one walking toward the vehicle and one walking away from it In these trials nearly every path that crossed within a 5-foot longitudinal range of the area directly behind the vehicle was detected Paths 7 through 13 which intersected the far corners of the systemrsquos detection zone went undetected
19
Figure 17 Numbered Walking Paths for ldquoAdult Waking Diagonallyrdquo Trials
Note Each square in the grid had the dimensions of 1 foot by 1 foot
20
30 METHOD
In order to answer the research questions the driving behavior of drivers of rearview video system equipped vehicles was compared to that of drivers without such a system To determine whether the addition of backing sensors might enhance any benefits achievable through the use of a rearview video system a third condition was tested that included rear object detection sensors in addition to rearview video A total of twelve participants participated in each system condition Participants were observed driving their own vehicles in a naturalistic setting for 4 weeks followed by presentation of a controlled backing crash avoidance scenario Additional details of the method follow
31 Experimental Design
The experiment used a between-subjects design with a single independent variable ldquosystemrdquo referring to the type of backing aid present on the vehicle The variable had three levels no system rearview video (RV) system and rearview video system plus backing sensors (RV amp RPS) To control variability all three treatment levels were presented using the same vehicle model
Dependent variables included measures such as the number and duration of glances to the rearview video display side and center rearview mirrors and glances over the shoulder during backing maneuvers Additional measures included vehicle backing speed and collision avoidance success The method by which these dependent measures were acquired is detailed in the following section
32 Participant Recruitment
Persons owning 2007 Honda Odyssey minivans were sought out for participation The State of Ohio Bureau of Motor Vehicles was contacted to obtain the names and addresses of persons who registered a vehicle having a Vehicle Identification Number (VIN) corresponding to that of a 2007 Honda Odyssey Mailings were sent to these owners asking about the equipment present on their minivans and inviting them to participate in the study The mailings included a response form with several questions about the personrsquos vehicle driving habits and availability to participate Persons who submitted a completed response form and met the study criteria listed were contacted by phone to explain additional details about the study and acquire additional information to use in evaluating their suitability for participation The following points constituted the main criteria for participation
Between 25 and 60 years of age No health problems that could negatively impact driving performance Make 2 or more trips per day in the subject vehicle Agree to be the only driver of the subject vehicle during the 4-week study
period Agree to drive to NHTSArsquos Vehicle Research and Test Center (VRTC) to
have instrumentation installed and later removed from the subject vehicle
21
Agree to accommodate data retrieval visits as frequently as once per week
Agree to perform two brief test drives Consent to release of video and engineering data for research scientific
and outreach purposes
33 Participants
Participants were 37 Ohioans who owned 2007 Honda Odyssey minivans and had driven them as their primary vehicle for at least 6 months Participantsrsquo ages ranged from 25 to 60 years (M=400 SD=83) On average participants had owned their Odysseys 2607 days (SD=630) at the time they began participation in the study The average odometer reading at the time study participation began was 116104 miles (SD=47340) Participants were paid $800 for completing participation in the study plus 50 cents per mile up to a total of $200 for mileage driven between their residence and VRTC for the initial and final meetings
Recruitment preference was given to persons who reported making a minimum of 2-5 trips per day in the subject vehicle and who stated that they drove with one or more children in the vehicle ldquosometimesrdquo or ldquoalwaysrdquo
34 Ruse
During recruitment prospective participants were told that the purpose of the study was to determine how people become familiar with and learn to take advantage of the features of new vehicles By observing people driving in real-world situations we would hope to better understand driver behavior and estimate the degree of safety that newer vehicles may provide Prospective participants were asked about the features of their vehicle (eg radio navigation rear seat DVD) and whether their vehicle was equipped with a rearview video system To minimize any possible influence on their backing behavior due to knowledge of the studyrsquos focus prospective participants were asked a number of other questions about their vehicle so they would not be alerted to the focus of the study
35 Data Acquisition and Instrumentation
A data acquisition system (DAS) capable of collecting data within less than 5 seconds after the vehicle was powered on was developed for this study The DAS was programmed to record data during all backing maneuvers To ensure that all backing maneuvers were recorded the DAS was primed to record data each time the vehiclersquos doors were unlocked using the key fob one of the vehiclersquos doors was opened or the key was placed in the ignition After one of these events the system began recording data automatically as soon as the power up sequence was complete Data would continue to be recorded until it was triggered to stop recording through timeout settings The DAS was triggered to stop recording data (but remain powered on) if the vehiclersquos transmission had not been placed into reverse gear within 3 minutes of the time when data recording began If the transmission was placed into reverse gear the DAS would
22
begin recording data Following any backing maneuver data recording was triggered to cease 10 seconds after the transmission had been placed into a gear other than reverse The DAS turned off when the vehiclersquos engine was turned off
Instrumentation included video cameras digital video recording equipment an embedded DAS wiring and a GPS antenna mounted on the roof of the vehicle Wiring was used to access CAN bus signals and transmit desired data to the DAS Video and sensor data were transmitted to an embedded DAS The DAS stored data files to a Secure Digital (SD) card Table 4 lists the data channels that were recorded to acquire the needed dependent measures
Table 4 Data Channels Data Acquisition Method Equipment Video image of driverrsquos face to determine glance location (to rearview video display mirrors over the shoulder)
Camera (full resolution)
Video images of areas surrounding vehicle (Environmental conditions in which backing occurs)
Cameras 1 rear 1 each side (quad multiplexed frac14 resolution)
Backing sensor warnings (record each backing maneuver) Parking System module Info that triggers data collection start (driverrsquos door open key insertion ignition)
B-CAN Bus
Transmission gear selection F-CAN Bus Brake applications F-CAN Bus Throttle percent displacement F-CAN Bus Vehicle speed F-CAN Bus GPS Headlights (on or off) B-CAN Bus Turn signal (left right) F-CAN Bus Vehicle location (latitude longitude heading use to determine path)
GPS or derive from video data
Time of day GPS or real-time computer clock Odometer (per trip if possible) Derive from CAN Bus Vehicle longitudinal acceleration Derive from speed Collisions Derive from video data
Video cameras were installed in unobtrusive locations A camera mounted to the rear license plate frame recorded the scene behind the vehicle Cameras mounted to the vehiclersquos undercarriage just aft of each front wheel recorded the scene on either side of the vehicle Lastly a video camera positioned above the center rearview mirror focused on the driverrsquos face to facilitate collection of eye glance data As part of the ruse a fifth camera was mounted above the center rearview mirror facing forward to prevent test participants from realizing the focus was on what was behind the vehicle Initially video data were recorded using small digital video recorders Due to a high malfunction rate in those devices they were replaced with mini-DV digital video tape recorders
Vehicles equipped with parking sensor systems were instrumented such that their parking sensor system status (eg which sensor is detecting something if any) was recorded during backing maneuvers To acquire data indicating the status of the parking system the parking system module located under the dashboard required wires soldered to it for transmission of bus data to the DAS To make installation of this
23
connection faster (and not modify a participantrsquos equipment long-term) the parking system module of the participantrsquos vehicle was replaced for the duration of the study with an identical module that had soldered connections on it to allow for access of the signal data
24
40 PROCEDURE
The 36 participants were divided into three groups of 12 drivers The three groups of participants were run sequentially Each set of 12 drivers contained a balanced number of each treatment condition Due to an incident where one driver lost use of her rear parking sensors during the course of the study a 37th participant was run in order to ensure the treatment conditions were balanced
The procedure had three main components an initial meeting 4 weeks of naturalistic driving and a final meeting Both the initial and final meetings were held at NHTSArsquos Vehicle Research and Test Center (VRTC) located on the Transportation Research Center Inc (TRC) proving ground These meetings and the procedural aspects of the 4 weeks of naturalistic driving are described in detail below
41 Initial Meeting
The first component involved the participants attending an ldquoinitial meetingrdquo at which they completed consent paperwork received instructions and allowed instrumentation to be installed in their vehicles The participants also made a short test drive in a vehicle with identical features as their own
Each participant attended an initial meeting which lasted between 2 and 3 hours Upon arrival at VRTC the participant was asked to read the Participant Information Summary which described the experiment and set forth the terms of participation (Appendix B) Participants also read a Confidential Information form (TRC PampP153) for visitors to the TRC proving ground which describes TRCrsquos policy for safeguarding proprietary information After all questions were answered the participant signed the documents thereby giving informed consent to participate in the study and have the instrumentation installed in his or her personal vehicle No individuals declined to participate
The participant was then escorted outside to the parking lot where a technician was inspecting the pre-existing condition of the participantrsquos vehicle by completing the Vehicle Condition Check Sheet (Appendix C) While the technician was inspecting the participantrsquos vehicle the experimenter documented the current vehicle mileage and the mileage it took to get from the participantrsquos residence to VRTC (used for payment purposes) The experimenter also showed the participant the location of the cameras and other equipment by using VRTCrsquos identical experimental vehicle as an example In addition the experimenter provided verbal tips for preventing damage to the equipment when washing the car
After the participant reviewed the condition of the vehicle with the technician and signed the Vehicle Condition Check Sheet to complete the vehicle inspection the technician drove the participantrsquos vehicle to the garage for the installation of instrumentation The experimenter and the participant went inside to discuss the test drive and guidelines for driving on the 75-mile oval test track During this time the participant was offered the opportunity to ask more questions and take a break if needed before going on the actual test drive
25
The test drive was used both to occupy the participants while waiting for their vehicle to be instrumented as well as to give the opportunity to present an obstacle avoidance event at the final meeting The test drive also helped support the primary experimental ruse of recording the participantrsquos driving behavior in the new vehicle under a variety of conditions The participant was asked to enter the test vehicle adjust the mirrors and controls to their comfort level and to wear the seatbelt at all times The test drive consisted of a tour of selected TRC facilities in which the experimenter gave directions In order to help establish the ruse for the surprise event the test drive consisted of a mix of rural road residential parking lot and test track (interstate speeds) driving At the completion of the test drive the participant was asked to drive the vehicle into a garage bay at VRTC so a technician could offload the data collected during the test drive In actuality this data offloading step was another ruse used to set up the conditions for an obstacle avoidance event that would occur at the end of the final meetingrsquos test drive The participant was instructed to drive the vehicle into the garage bay and park with the left front wheel on a yellow wheel stop mat The mat was used to obtain a consistent location of the test vehicle to ensure that the initial position of the vehicle prior to the obstacle event at the final meeting was the same for all participants Once the vehicle was stopped the technician closed the garage door and commenced with data offloading while the participant and experimenter waited in the car
After the technician offloaded the data and raised the garage door the participant drove the vehicle to the front parking lot and returned to the conference room with the experimenter to wait on the completion of the installation of instrumentation into their vehicle When the technician returned the vehicle the participant was escorted to the parking lot and given an opportunity to review the vehicle and instrumentation before departing for the 4 weeks of participation
42 Naturalistic Driving Period
During the four weeks of naturalistic driving a technician was dispatched weekly to retrieve data from each test vehicle at a place and time convenient for the participant The procedure of offloading data and checking instrumentation typically took up to 1 hour To retrieve the data the technician would obtain the vehicle keys from the participant and then get into the vehicle to offload the engineering data to a laptop computer and change the miniDV tape in the video recorder and SD card that held other data While offloading data the technician would inspect the system and check the cameras to ensure everything was still working properly If a problem was detected the technician would exchange the malfunctioning component with a properly functioning replacement and make any necessary repairs Once the data retrieval was complete the technician would return the vehicle keys to the participant and confirm a date and time for the next data retrieval or final meeting
43 Final Meeting and Surprise Obstacle Event
The final meeting followed a format similar to the initial meeting This time when the participant arrived however the first step was the vehicle inspection since the informed consent and confidential information paperwork were already covered during the initial
26
meeting The current vehicle mileage was documented during the inspection such that the total mileage driven for the 4 weeks could be calculated Once the Vehicle Condition Check Sheet was completed as in the initial meeting the technician took the vehicle to the garage again this time for instrumentation to be removed from the vehicle
The participant was given an opportunity for a break and then followed the same test drive procedures as in the initial meeting Once in the test vehicle participants were again encouraged to adjust the mirrors and controls to their comfort level and to wear the seatbelt at all times The test drive consisted of a tour in which the experimenter gave the same directions as in the initial meeting
At the end of the test drive the participant was instructed to drive the vehicle into the garage bay and park with the left front wheel on a yellow wheel stop mat Once the vehicle was parked inside the garage door was closed A technician opened the rear hatch of the vehicle and appeared to connect a laptop to the data acquisition system and copy data while the experimenter and participant sat inside the vehicle During the apparent data download process another member of the research staff was outside setting up the obstacle (see Appendix H for a description of the obstacle event mechanics) When the obstacle was ready for the event the technician copying the data from the vehicle was signaled that the obstacle setup was complete He then closed the rear door of the vehicle and raised the garage door
At that time the participant was told that it was time to return to the conference room for debriefing and to await the completion of the vehicle instrumentation removal from their vehicle The experimenter instructed the participant to back out of the garage and then drive the vehicle to the front parking lot so the vehicle could be parked However this time the obstacle event was triggered as the vehicle backed out of the garage After the event was complete the participant drove the vehicle to the front parking lot and returned to the conference room
Participants were then informed of the surprise event details using a Debrief form (Appendix D) and were given a questionnaire to complete The questionnaire was adapted from that used for another NHTSA study investigating early adoptersrsquo use of sensor-based backing aid systems and rearview video cameras [8] Three versions of the questionnaire were used to address the different system conditions (no system RV only or RV and rear parking sensors) (Appendices E F and G) Each participant completed the questionnaire version that corresponded to their vehiclersquos equipment Once the questionnaire was complete the participant was given payment for participation
431 Details of the Obstacle Event Scenario The obstacle event involved a two-dimensional life-size image of a small child popping up behind the test vehicle while the participant was backing out of a garage at the end of the final meeting test drive The image consisted of a full-color photo of a 36-inch-tall toddler The photo was printed on a corrugated plastic substrate (see Figure 18) The 36-inch height corresponded approximately to the height of a 25 year old child
27
Figure 18 Two-Dimensional Image of a Child Used in the Surprise Obstacle Event
The photo obstacle was located along the centerline of the vehicle to prevent it from being seen by a driver using the side rearview mirrors Originally a wheeled obstacle towed laterally into the area behind the vehicle was planned However an object that moved into the rear blind zone on a lateral path could be seen in the side mirror making it difficult to know whether the subject had seen the obstacle using the rearview video or the mirror While a backing scenario involving a centered stationary object may not be representative of all the different types of real world backover crash scenarios it allowed for the clear determination of whether visual detections of the obstacle were attributable to rearview video system use
The distance of 14 feet between the bumper of the vehicle and the obstacle at the start of the staged backing maneuver was selected for a few reasons At average backing speeds (based on baseline (initial meeting) event backing speed data from the first 12 participants) this distance would give the participant approximately 5 to 7 seconds to visually detect the obstacle before the rear bumper would contact it This distance also placed the obstacle within the blind spot area of average-height drivers The obstacle could not be seen with mirrors or over the shoulder glances by a properly belted driver
28
of average or below average height As a result participants had to use the rearview video system in order to detect the presence of the obstacle While this situation put the participants in the ldquono systemrdquo category at an obvious disadvantage it also allowed for clear determination of whether visual detections of the obstacle were attributable to rearview video system use
When the participant drove the vehicle into the garage the obstacle was not present After the participant had driven the van into the garage and the door was closed behind them the object was set up The back side of the obstacle was painted with textured paint to mimic the appearance of asphalt pavement (see Figure 19) With the rigid photograph laid flat in a face-down (child image side) orientation its presence was concealed Once the obstacle was in its face-down position and ready for the event the staff member conducting the data download was notified that all was clear for the event The garage door was then opened and the participant was told to back out so they could return the vehicle to its designated parking space in the parking lot outside The obstacle was not present at the beginning of the maneuver After the vehicle traveled 3 feet in reverse it contacted a switch in the pavement that triggered the obstacle to swiftly move into an upright position as shown in Figure 20 This delayed presentation was intended to mimic the scenario of child running into the blind zone after the vehicle has started backing It also facilitated observation of whether drivers would look at the RV screen multiple times during a backing maneuver rather than only once at the start of the maneuver
The method used to cause the obstacle to pop up into a vertical position in a controlled manner is described in detail in Appendix H
Figure 19 Photograph of the Obstacle at the Beginning of Surprise Obstacle Event 29
Figure 20 Photograph of the Obstacle at the End of Surprise Obstacle Event
Figure 21 shows the location of the vehicle at the beginning of the event features of the surrounding area and the location of the obstacle Two dark red colored vehicles were positioned outside the garage bay entrance on either side A white step van was also positioned outside the garage bay door in line with its opening to provide a consistent visual field behind the backing vehicle
30
Figure 21 Locations of the Subject Vehicle Obstacle and Surrounding Objects During the Staged Backing Maneuver
44 Data Reduction Method
Characteristics of eye glance behavior and details of the conditions of naturalistic backing maneuvers were determined through manual video data reduction Vehicle-based engineering data channels recorded by the DAS were validated and then processed using Matlab to extract metrics of interest Naturalistic video data files for
31
particular backing maneuvers were matched to their corresponding engineering data files using software
Data were reduced and analyzed to provide quantitative and qualitative measures of driversrsquo backing behavior (eg glance patterns) and performance (ie avoiding a crash) as well as their use of the rearview video system (when present) Information about the conditions in which drivers perform backing maneuvers and how the conditions may affect mirror or system use was obtained
32
50 RESULTS NATURALISTIC DRIVING
While more than 6000 naturalistic backing maneuvers were recorded in this study they were made by only 37 people This is a relatively small sample size Each maneuver an individual participant made was not an independent data point Due to the statistical problems associated with using multiple events from the same person the use of summary measures such as the mean number of glances to system per backing event was deemed the most appropriate method in which to compare conditions
51 Characteristics of Naturalistic Driving
The 37 participants in this study drove 42982 miles during 5219 trips On average each participant drove 12354 miles (SD=5342) Miles driven per day during study participation 441 miles on average was similar to that driven prior to the study 453 miles per day (based on mileage at the start of participation and time of ownership) A total of 6145 naturalistic backing events were recorded for the 37 drivers This equates to an average of 166 backing maneuvers per driver Table 5 summarizes additional characteristics of participantsrsquo naturalistic driving and Table 6 breaks down these same results by system condition
Table 5 Characteristics of the Participantsrsquo Naturalistic Driving Variable N Mean Standard Deviation Minimum Maximum
Trips 37 14105 5253 3100 27200 Mean Backing Maneuvers per Trip 37 114 020 061 160 Mean Distance per Trip (mi) 37 889 445 278 2404 Backing Maneuvers 37 16311 6816 1900 31800 Sum Miles 37 116169 57359 27075 341403 Mean Backing Maneuvers per Mile 37 016 008 006 038
33
Table 6 Characteristics of the Participants Naturalistic Driving By System Condition
System Variable N Mean Standard Deviation Minimum Maximum
Trips 12 11683 4856 3100 21000 Mean Backing Maneuvers per Trip 12 104 020 061 135
None Mean Distance per Trip (mi) 12 1014 397 430 1810 Backing Maneuvers 12 12400 5629 1900 22300 Sum Miles 12 112771 51986 27075 204278 Mean Backing Maneuvers per Mile 12 012 006 007 026 Trips 12 15017 6163 6400 27200 Mean Backing Maneuvers per Trip 12 112 007 103 128
RV Mean Distance per Trip (mi) 12 833 395 278 1562 Backing Maneuvers 12 16792 7216 7600 31800 Sum Miles 12 115371 51354 29419 191495 Mean Backing Maneuvers per Mile 12 017 009 007 038 Trips 13 15500 4187 11100 22800 Mean Backing Maneuvers per Trip 13 126 023 079 160
RV amp Mean Distance per Trip (mi) 13 825 531 417 2404 RPS Backing Maneuvers 13 19477 6017 8800 28600
Sum Miles 13 120042 70334 65304 341403 Mean Backing Maneuvers per Mile 13 019 008 006 030
52 Characteristics of Naturalistic Backing Maneuvers
Table 7 summarizes the characteristics of the naturalistic backing maneuver events Of the 6145 recorded backing maneuvers observed during this study 72 percent had durations of 5 to 20 seconds A large majority of backing maneuvers 78 percent involved only one reverse movement The other 22 percent of backing maneuvers involved multiple reverse movements eg the driver brought the vehicle to a stop during the backing maneuver or engaged in parallel parking
Average backing speed during the naturalistic maneuvers 226 mph was essentially identical to that observed in the staged baseline and obstacle events Maximum backing speed was correlated with backing time (r=77) and backing distance (r=73)
Table 7 Characteristics of the 6145 Recorded Backing Maneuver Events Variable Mean Standard Deviation
Distance (ft) 3397 2596 Time Backing (s) 1008 644 Average Backing Speed (mph) 226 089 Maximum Backing Speed (mph) 364 151 Maximum Lateral Acceleration (g) 008 004 Maximum Long Acceleration (g) 009 004 Number Reverse Movements 134 081
34
The time between when the drivers shifted into reverse and the vehicle began moving backwards was noted for naturalistic backing maneuvers that had an interpretable time value (38 percent of maneuvers) The data summarized in Table 8 indicate a trend that agrees with the baselineobstacle event finding The time between shifting and rearward movement was longer for drivers with RV and RV amp RPS than for drivers with no system The longer time intervals between shifting into reverse and rearward motion for drivers with a rearview video system may be attributable to a delay in the appearance of the RV image that was typical for the specific makemodel of test vehicle used in this study Separate testing found this delay to have an average duration of 644 seconds when reversing immediately after vehicle ignition (the delay was shorter when backing after the vehicle had been running for a period of time) This RV display delay issue is discussed further in Section 81
Table 8 Distribution of Time Between Shift to Reverse and Beginning of Backing by Backing System Condition (Naturalistic Backing Events)
Quantile None (576)
RV (862)
RV amp RPS (948)
100 Max 2577 2944 3156 99 1751 1707 2162 95 981 1007 1021 90 633 711 709
75 Q3 328 408 428 50 Median 209 239 258 25 Q1 158 169 173
10 121 136 135 5 103 115 116 1 094 082 100
0 Min 042 062 076
Table 9 presents mean maximum backing speeds for naturalistic backing events The overall mean value for maximum backing speed was 37 mph which was consistent with the baseline and event trials
With respect to the interpretation of this trend one hypothesis from the outset was that drivers with RV systems might choose to back faster than drivers without such systems The lack of consistency between the lsquoRVrsquo and lsquoRV amp RPSrsquo system conditions and the fact that the mean for the lsquoNonersquo system condition is between these two extremes suggests that such an overall effect does not exist However no statistical testing was performed Moreover the discrepancy between the lsquoRVrsquo and lsquoRV ampRPSrsquo means is likely to be an artifact of the fact that different subjects were involved and that they drove in different situations This variance added noise to all comparisons made across systems
35
Table 9 Mean Maximum Backing Speed by System Condition (Naturalistic Backing Events)
N Mean Maximum Backing Speed (mph)
Standard Deviation
None 1489 37069275 14144236 RV 2016 39878938 15622352 RV amp RPS 2532 34505742 13884731
Table 10 summarizes the quantiles for the overall distribution of maximum backing speed (from 6037 naturalistic backing events) Maximum and minimum values are shown along with some other percentile values Table 11 shows the extreme values of maximum backing speed for naturalistic backing maneuvers with the absolute fastest speed being of particular interest These values represent observed values of maximum backing speed from individual backing maneuvers These data show that only a few backing segments had maximum speeds greater than 10 mph While the distribution of maximum backing speed was not strictly normal (since zero is boundary they were positively skewed) they were not bimodal Thus they did not reveal an obvious split between parking spaces and garages or short versus long backs Table 12 provides descriptive statistics for backing maneuver duration average and maximum backing speed and backing distance for driveway garage and parking space backing maneuvers
Table 10 Quantiles of Overall Distribution of Maximum Backing Speed (from 6037 Naturalistic Backing Events)
Quantiles (Definition 5) Quantile Estimate 100 Max 14291 99 7542 95 6275 90 5633 75 Q3 4649 50 Median 3532 25 Q1 2581 10 1899 5 1572 1 1160 0 Min 1001
36
Table 11 Extreme Values of Maximum Backing Speed (from 6037 Naturalistic Backing Events)
Extreme Observations Lowest Highest
1001 10979 1010 12545 1013 13414 1013 13684 1015 14291
Table 12 Descriptive Statistics for Backing Maneuver Characteristics by Maneuver Starting Location
Starting Location N Variable N Mean Std Dev Minimum Maximum
Driveway 1303
Backing Duration (s) Average Backing Speed (mph) Maximum Backing Speed (mph) Distance Backed (ft)
1287 1287
1287
1287
108659 27450
43643
440675
56975 08609
13321
271696
032 071
1024
0344
4892 8359
10665
372473 Backing Duration (s) 1138 166410 64863 142 4286
Garage 1154 Average Backing Speed (mph) Maximum Backing Speed (mph)
1138
1138
24573
45140
07923
14804
0796
1015
5487
8934
Distance Backed (ft) 1138 586050 255014 1918 14477
Parking Space 2198
Backing Duration (s) Average Backing Speed (mph) Maximum Backing Speed (mph) Distance Backed (ft)
2170 2170
2170
2170
75454 20253
30935
213259
31119 06568
102858
90866
036 0756
101
0421
5281 5495
7181
255693
53 Naturalistic Backing Crashes
A small number of minor crashes were observed during the naturalistic portion of this study These incidents and their conditions are summarized in Table 13 Five drivers were involved in a total of 6 collisions Ironically 5 of the 6 incidents involved drivers whose vehicles were equipped with an RV system and 4 of those 5 also were equipped with a RPS The obstacles involved in these incidents were likely to be visible in an RV system display
37
Table 13 Naturalistic Crashes Observed Subject Number
System Condition Situation Description
1 RV amp RPS Backing out of driveway Struck trash can 8 RV amp RPS Parking Backed into a vehicle while parking 8 RV amp RPS Unknown Struck unknown object while backing in a gravel lot 15 None Backing out of driveway Struck trash can poodle on lap 24 RV amp RPS Parking Backed into a vehicle while parking
28 RV Parking Struck wheeled cooler while backing out of parking space
54 Eye Glance Behavior During Naturalistic Backing Events
This section presents data describing eye glance data during naturalistic backing maneuvers with a focus on reporting driversrsquo use of (ie glances to) rearview video systems Glance locations noted for these data were as follows
Over left shoulder (Left Shoulder) Out left window or at left mirror (Left) Instrument panel Forward (out windshield) Rearview mirror RV display or center console (consolevideo) Out right window or at right mirror Over right shoulder Other
The driver was considered to be looking at the noted location if their eyes were determined to be focused on that location regardless of their body orientation
In the figures presented in this section the lsquootherrsquo glance category represents a significant portion of the glances Typically these glances represent non-driving-related behavior for example when a driver looks down to the passenger seat to the floor or to his or her lap For the most part they do occur during the backing maneuver and thus give a rough estimation of the percentage of time devoted to potentially distracting activities during backing
During naturalistic driving an average of 10 percent of glances was to the RV display Individual driversrsquo percentages of glances to the RV display varied between 2 percent and 26 percent These data along with glance percentages for other glance locations are shown in Figure 22
38
Left S
hould
er Left
Forward
Inst P
anel
Rearvi
ew M
irror
Conso
leVide
o Righ
t
Right S
hould
er
Other
0
5
10
15
20
25
30 Pe
rcen
t None RV RV amp RPS
Figure 22 Mean Percentage of Glances by Glance Location and System Condition Note Based on 1 value per subject
Overall drivers looked at least once at the RV display on approximately 65 percent of backing events and looked more than once at RV on approximately 40 percent of backing events Table 14 summarizes the number of glances to the RV display per naturalistic backing maneuver by system condition These data show that participants in the RV amp RPS condition made no glances per trial to the RV display more often than those in the lsquoRV onlyrsquo condition The data also show that participants in the RV amp RPS condition made four or more glances per trial to the RV display less often than those in the lsquoRV onlyrsquo condition This trend of more participants with lsquoRV onlyrsquo looking at the RV display than those with RV amp RPS may indicate that participants in the RV amp RPS condition were relying on the sensors to alert them of an obstacle However differences in the particular backing situations between driver groups (ie differential exposure) or individual differences in backing habits between groups may have contributed to this difference
Table 14 Number of Glances to the RV Display Per Backing Maneuver by System Condition
0 1 2 3 4+ Total RV 274
(3285) 197
(2362) 125
(1499) 74
(887) 164
(1966) 834 100
RV amp RPS 389 (3898)
219 (2194)
152 (1523)
95 (952)
143 (1433)
999 100
Total 663 (3619)
416 (2271)
277 (1512)
169 (922)
307 (1676)
1832 100
The following figures illustrate glance behavior data from naturalistic backing events These figures include data for all glances except the very first segments of video data files before the subject begins to focus on the driving task In essence they all show
39
increased glance activity to the consolerear video area when a rear video system is available For example Figure 23 shows that on average drivers made less than one (M = 081) glance to the consolevideo location when no video (System = None) display is present versus 217 (RV) and 189 glances (RV amp RPS) when the RV systems are present In this and the following figures there also is a trend toward slightly more use of the rearview mirror when no backing system is present This difference is not nearly as large however as the differences in glance behavior to the consolevideo area suggesting that drivers do not simply trade consolevideo glances for rearview mirror glances
0 05
1 15
2 25
3 35
4 45
Left Sh
oulde
r Le
ft
Forward
Inst Pa
nel
Rearvi
ewMirro
r
Conso
leVide
o Righ
t
Right S
hould
er
Other
Num
ber o
f Gla
nces
None RV RV amp RPS
Figure 23 Mean Number of Glances Per Backing Maneuver by Glance Location and System Condition
A similar pattern is evident for Figure 24 that shows the total glance time by location and backing system While drivers with no system looked at the consolevideo area for less than one second (M = 090) drivers with other systems looked on average for 289 and 184 seconds respectively
With all of these comparisons it must be noted that because different drivers were included in each backing system group comparisons are based on differential exposure Despite these differences in exposure it appears that the tendency to look more often and for more time at the consolevideo area supports the conclusion that drivers make regular use of these systems
40
0
1
2
3
4
5
6
Left Sh
oulde
r Le
ft
Forward
Inst P
anel
Rearvi
ewMirro
r
Conso
leVide
o Righ
t
Right Sh
oulde
r
Other
Tota
l Gla
nce
Tim
e (s
)
None RV RV amp RPS
Figure 24 Mean Total Glance time by Glance Location and System Condition
Figure 25 shows that driversrsquo glances to the consolevideo area were on average considerably longer for participants in the RV and RV amp RPS conditions than for those in the ldquono systemrdquo condition Noteworthy also is the observation that the mean durations of driversrsquo glances to other locations do not appear to differ as much as the durations to the consolevideo area
0 02 04 06 08
1 12 14 16
Left Sh
oulde
r Le
ft
Forward
Inst Pan
el
Rearvi
ewMirro
r
Conso
leVide
o Righ
t
Right Sh
oulde
r
Other
Gla
nce
Dur
atio
n (s
)
None RV RV amp RPS
Figure 25 Mean Glance Duration by Glance Location and System Condition
Figure 26 illustrates the same data in terms of the percentage of glance time directed to each of the locations Drivers with no system devoted 33 percent of the recorded
41
glance time to looking at the consolevideo while those with RV and RV amp RPS systems devoted 116 and 75 percent respectively to this area Percentages of glances to other areas remain more consistent and this is remarkable given the wide variety of backing situations and possible differences between these situations by backing system group The results suggest that glance behavior during backing is relatively consistent across backing situations
0 002 004 006 008
01 012 014 016 018
02
Left Sho
ulder Le
ft
Forward
Inst P
anel
Rearvi
ewMirr
or
Conso
leVide
o Righ
t
Right S
hould
er
Other
Perc
ent1
00
None RV RV amp RPS
Figure 26 Mean Percentage of Glance Time by Location and System Condition
541 Eye Glance Behavior During Backing as a Function of Environmental Conditions
Starting location provides one classification of backing situations The first level of characterization of backing maneuvers was based on maneuver length The following table provides descriptive characteristics for the set of backing events separated into Long versus Short backing maneuver length categories No strict criterion was used for this categorization As is evident from the ranges of values there is overlap in the two categories Longer backs were indeed longer in duration and in distance on average They were associated with higher average and maximum backing speeds Figure 27 illustrates percent eye glance time by eye glance location and maneuver length
42
Table 15 Descriptive Characteristics of Naturalistic Backing Maneuvers by Maneuver Length
Backing Distance
N Obs Variable N Mean
Std Dev Minimum Maximum
Long 1417 Backing Duration (s) 1415 153465 61853 223 5281 Average Backing Speed (mph)
1415 27405 09289 0847 9868
Maximum Backing Speed (mph)
1415 46735 14237 1059 14291
Distance Backed (ft) 1415 591853 273475 4009 372473 Short 3941 Backing Duration (s) 3846 83300 48539 032 4286
Average Backing Speed (mph)
3846 21456 07677 071 7013
Maximum Backing Speed (mph)
3846 33773 13145 101 12545
Distance Backed (ft) 3846 260564 181645 0344 190239
0 002 004 006 008
01 012 014 016 018
Left Sho
ulder
Forward
Inst Pan
el Le
ft
Rearvi
ewMirro
r
Other
Right Sh
oulde
r
Right
Conso
leVide
o
Perc
ent1
00
Long Short
Figure 27 Percentage Glance Time by Eye Glance Location and Maneuver Length
Naturalistic backing maneuvers were also characterized by the degree of visibility surrounding the vehicle at the time of the maneuver If the area was clear of visual obstructions and it was possible to see vehicles and other objects coming from a variety of directions then the visibility was characterized as being ldquoopenrdquo If the area around the vehicle was surrounded by trees buildings or other objects that obstructed visibility then the visibility was characterized as ldquoclosedrdquo Figure 28 illustrates results for percent glance time by eye glance location and visibility
43
0 002 004 006 008 01
012 014 016 018 02
Left Sho
ulder
Forward
Inst Pan
el Le
ft
Rearvi
ewMirro
r
Other
Right Sho
ulder
Right
Conso
leVide
o
Perc
ent1
00
Closed Open
Figure 28 Percentage Glance Time by Location and Visibility
All naturalistic backing maneuvers were classified as starting from a garage driveway parking space or other Figure 29 presents results for percent glance time by eye glance location and backing maneuver starting location
0 002 004 006 008
01 012 014 016 018
02
Left Sho
ulder
Forward
Inst Pan
el Le
ft
Rearvi
ewMirr
or
Other
Right Sh
oulde
r
Right
Conso
leVide
o
Perc
ent1
00
Driveway Garage Parking Space
Figure 29 Percentage Glance Time by Starting Location and Glance Location
Figure 30 shows percentages of glance time to each location as a function of the starting location and system condition These figures represent within-subject comparisons
44
Figure 30 Percent Glance Time by Starting Location and System Condition
45
The second environmental variable considered was the visibility surrounding the vehicle at the time of the back which was coded either as Closed (eg narrow driveway) or Open (eg parking lot) Figure 31 presents comparisons by system condition The data show that drivers in the ldquono systemrdquo condition made greater adaptations to their glance behavior based on the quality of visibility surrounding their vehicle For example ldquono systemrdquo condition participants show bigger differences in the percent of time spent glancing to the right and right shoulder and less over the left shoulder in closed conditions versus open conditions Also for closed conditions drivers with no RV system also appear to glance over their right shoulders approximately 7 percent more than those with lsquoRV onlyrsquo and approximately 12 percent more than those with RV amp RPS Drivers in the RV amp RPS condition looked over their left shoulders in closed conditions approximately 9 percent more than those with RV or no system Overall differences between system conditions appeared smaller for open conditions The data show comparatively low usage of the center rearview mirror for all system conditions regardless of the surrounding visibility
46
Figure 31 Percent Glance Time by Visibility No System
47
The third environmental coding classification was the distance driven in the backing maneuver or backing maneuver length Maneuvers were coded as ldquolongrdquo or ldquoshortldquo Figure 32 examines whether there were any differences in percentage of time spent looking at different locations for long versus short backing maneuvers as a function of system condition Long maneuvers appear to correspond to more time spent glancing over the left shoulder and to the right particularly for the no system and RV amp RPS conditions As with the prior analyses these data show comparatively low usage of the center rearview mirror for all system conditions regardless of maneuver length
48
Figure 32 Percent Glance Time by Backing Maneuver Length and System Condition
49
55 Driversrsquo Activities During Naturalistic Backing Events
This section provides descriptive statistics on activities performed by drivers during naturalistic backing maneuvers Table 16 lists the activities observed during 5076 of the 6145 naturalistic backing maneuvers that were able to be coded (ie video data files were available for review) The frequency with which these activities were observed was noted If the driver performed multiple activities during a backing maneuver each activity was noted
Overall 61 percent of backing maneuvers involved the driver maneuvering the vehicle without performing any additional activities The two most frequent activities during backing were pushing a garage door remote (1336 percent) and talking to a passenger (1277 percent)
Table 16 Driversrsquo Activities During Backing Events
Activity Frequency Percent
None Just Backing 3115 6137 Pushing Garage Remote 673 1326 Talking With Passenger 648 1277 Other 239 471 Using Cell Phone 157 309 Securing Seat Belt 133 262 Touching Passenger Or Dog 69 136 Unknown 42 083
Total 5076 10000
Table 17 highlights observed instances of multiple activities during backing The most common combination of identified activities was pushing a garage door remote while talking with a passenger
50
Table 17 Summary of Observed Instances of Multiple Activities During Backing First Recorded Driver Activity Second Recorded Driver Activity Count Percent
Using Cell Phone Other 4 07874 Using Cell Phone Pushing Garage Remote 20 3937 Using Cell Phone Securing Seat Belt 3 05906 Other Pushing Garage Remote 24 47244 Other Securing Seat Belt 1 01969 Other Touching Passenger Or Dog 3 05906 Other Talking With Passenger 21 41339 Pushing Garage Remote Using Cell Phone 1 01969 Pushing Garage Remote Other 77 151575 Pushing Garage Remote Securing Seat Belt 15 29528 Pushing Garage Remote Touching Passenger Or Dog 14 27559 Pushing Garage Remote Talking With Passenger 74 145669 Securing Seat Belt Using Cell Phone 2 03937 Securing Seat Belt Other 16 31496 Securing Seat Belt Pushing Garage Remote 59 116142 Securing Seat Belt Touching Passenger Or Dog 2 03937 Securing Seat Belt Talking With Passenger 18 35433 Touching Passenger Or Dog Other 4 07874 Touching Passenger Or Dog Pushing Garage Remote 10 19685 Touching Passenger Or Dog Talking With Passenger 3 05906 Talking With Passenger Other 49 96457 Talking With Passenger Pushing Garage Remote 84 165354 Talking With Passenger Securing Seat Belt 2 03937 Talking With Passenger Touching Passenger Or Dog 2 03937
508 100
Table 18 summarizes driver activities during backing as a function of system condition The data show that drivers in the RV amp RPS condition were slightly less likely to engage in any other activity while backing Conducting statistical testing to demonstrate that participants in the RV amp RPS condition were less likely to engage in secondary activities while backing is inappropriate because of the multiple backing events included for each driver in the analyses Statistical testing would assume that all backing events were from different drivers This could overstate the findings because these data represent multiple instances of the tendencies of the small sample of drivers used in the study Nevertheless it is fair to say without statistical backing that the RV amp RPS drivers were more likely not to engage in secondary activities while backing than drivers with other systems and that the RV drivers were less likely than drivers with no system to engage in secondary activities while backing
51
Table 18 Driversrsquo Primary Activity By System Condition
Driver Activity System
TotalFrequency
Column Percent None RV RV amp
RPS
None Just Backing 656 5169
223 1757
905 6001
217 1439
1554 6759
233 1013
3115 6137
673 1326
Pushing Garage Remote
Talking With Passenger 185 1458
191 1267
272 1183
648 1277
Other 72 567
69 458
98 426
239 471
Using Cell Phone 29 229
38 252
90 391
157 309
Securing Seat Belt 28 221
60 398
45 196
133 262
Touching Passenger Or Dog 41 323
21 139
7 03
69 136
Unknown 35 276
7 046
0 0
42 083
Total 1269 1508 2299 5076 100
56 RPS Use
During the course of the experiment five participants made unsolicited comments to members of the research staff about turning off the RPS on their vehicle One person reported that he just did not use it Another person stated that she did not know that the button had to be pushed for the RPS to work (the vehicle was equipped with a button for turning off the RPS) Three participants stated that they frequently turned the RPS off when driving through a restaurant drive-through lane due to nuisance alarms (ie audible notifications of the presence of vehicles that the driver is already aware of) Lastly a sixth participant was observed having the RPS on their vehicle switched off during their initial meeting visit When this participant returned for their final meeting visit the RPS was observed to be switched on In summary half of the participants in the RV amp RPS system condition stated or were observed to have turned the RPS on their vehicle off at least some of the time
52
60 RESULTS INITIAL lsquoBASELINE EVENTrsquo AND FINAL lsquoOBSTACLE EVENTrsquo
This section presents results for the backing maneuvers occurring at the end of participantsrsquo initial and final test drives The backing maneuver occurring at the end of the final test drive involved presentation of an unexpected obstacle and therefore is at times referred to here as the ldquoobstacle eventrdquo The initial test drive backing maneuver is also referred to as the ldquobaseline eventrdquo
61 Backing Behavior During Baseline and Obstacle Events
In an effort to assess how quickly drivers initiate a backing maneuver the time between when the drivers shifted into reverse and the vehicle began moving backwards was noted for the baseline and obstacle events Figure 33 illustrates these times as a function of system condition Analysis results showed no significant difference due to system condition or trial (baseline versus obstacle event) However the somewhat longer times seen for the RV and RV amp RPS conditions may indicate that drivers were waiting for the RV display image to appear
Figure 33 Mean Time (plusmnSD) Between Shifting into Reverse Gear and the Beginning of Rearward Motion (Baseline and Obstacle Events)
Mean backing speed during the baseline and obstacle events was also determined Figure 34 illustrates mean backing speeds for baseline trials and all obstacle event trials in which the driver did not see the obstacle and stop Overall mean backing speed in these staged events was 225 mph No significant difference between system condition or trial (baseline versus obstacle event) was observed
53
Figure 34 Mean Backing Speed (plusmnSD) by System Condition (Baseline and Obstacle Events)
Figure 35 and Table 19 present mean maximum backing speeds for the baseline and event trials Trials in which the participant stopped the vehicle in the middle of the maneuver were removed from these data The mean maximum backing speed mean of 37 mph is fairly constant across systems
0
05
1
15
2
25
3
35
4
45
5
None RV RV amp RPS
Mea
n M
axim
um B
acki
ng S
peed
(mph
)
Figure 35 Mean Maximum Backing Speed (plusmnSD) by System Condition (Baseline and Obstacle Events)
54
Acc
eler
atio
n (g
)
012
011
01
009
008
007
006
005 None RV RV amp RPS
Figure 36 Maximum Backing Acceleration (plusmnSD) by System (Baseline and Obstacle Events)
Table 19 Mean Maximum Backing Speed by System Condition (Baseline and Obstacle Events)
System Mean Maximum Backing Speed (mph) Std Dev
None 37683478 06027962 RV 37020556 07232739 RV amp RPS 37695238 05924636
Figure 362 presents means for the maximum acceleration during the baseline and obstacle event backing maneuvers Maximum acceleration did not differ significantly as a function of system condition
62 Obstacle Event Outcome Results
Results for the outcomes of the staged obstacle scenario are presented in Table 20 Overall 81 percent of participants crashed in this staged scenario Combining the results for participants with lsquoRV onlyrsquo with results of those with RV amp RPS shows that a total of 72 percent of participants with RV crashed as seen in Figure 37 Participants with RV crashed significantly less than those without RV (χ2(2)=695 p=03) The difference between the percent of crashes for participants with lsquoRV onlyrsquo and RV amp RPS while seemingly large was not significant (χ2(1)=213 p=14) However it was found that if hypothetically the sample size was doubled with the same outcomes then the difference between those two conditions would become statistically significant
55
100
90
80
70
60
50
40
30
20
10
0 None RV RV amp RPS RV and RV amp
RPS Combined
Perc
ent C
rash
es
Figure 37 Percent Crashes by System Condition for the Staged Obstacle Event
Table 20 Staged Obstacle Event Outcomes System N Number that Crashed Percent Crashed
No system 12 12 100 RV only 12 7 58 RV amp RPS 13 11 85
Total 37 30 81
Data illustrated in Figure 38 indicate whether participants driving a vehicle equipped with RV actually looked at the RV display during the obstacle event scenario Overall 16 of 25 participants (64 percent) glanced at the RV display during the obstacle event backing maneuver Trends in these data suggest that participants with lsquoRV onlyrsquo glanced at the RV display slightly more than those in the lsquoRV amp RPSrsquo condition
56
0
1
2
3
4
5
6
7
8
9
10
RV only RV amp RPS Total
Did Not Look Looked Once Initially Looked Multiple Times Looked After Crashing
Figure 38 Summary of Participantsrsquo Glances to the Rearview Video System During the Obstacle Event
Data presented in Figure 39 show that participants who glanced at the RV display multiple times during the backing maneuver tended to avoid a crash more often than those who glanced only once initially or not at all All participants who failed to look at the RV display or who looked once at the beginning of the maneuver but never looked again crashed since the obstacle was not present until the vehicle had moved 3 feet rearward
57
0
1
2
3
4
5
6
7
8
9
10
Did Not Look Looked Once Initially Looked Multiple Times
Looked After Crashing
Num
ber o
f Cra
shes
Figure 39 Obstacle Event Crashes as a Function of Rearview Video Glances
Crashes involving participants who made multiple glances to the RV display may be attributable to a delay in the appearance of the RV image that was typical for the specific makemodel of test vehicle used in this study As noted previously separate testing found this delay to have an average duration of 644 seconds when reversing immediately after vehicle ignition (the delay was shorter when backing after the vehicle had been running for a period of time) This RV display delay issue is discussed further in Section 81
Table 21 presents hypothetical results showing what the outcomes might have been a) had the obstacle been present at the start of the maneuver and b) had the RV display delay been less than 1 second in duration These hypothetical results were determined through review of participantsrsquo sequences of glances during the obstacle event in consideration with the timing of the appearance of the RV image The figures in Table 21 assume that if the driver had glanced at the RV display at the start of the maneuver then the driver would have successfully identified the presence of the obstacle through that RV display glance
58
Table 21 Hypothetical Staged Obstacle Event Outcomes Hypothetical NumberPercent That May Have Crashed Hadhellip
System N Number
that Crashed
The Obstacle Been Present at the Start of
the Maneuver
The RV Display Delay Been lt 1
Second in Duration Both
Occurred
No system 12 12 12 (100) 12 (100) 12 (100) RV only 12 7 5 (417) 7 (583) 5 (417) RV amp RPS 13 11 8 (615) 9 (692) 6 (461) Total 37 30 25 (676) 28 (757) 23 (622)
Table 22 highlights obstacle event outcome (ie crash) results as a function of whether or not the RPS detected the obstacle Four out of five or 80 percent of the cases in which the RPS detected the obstacle and provided a visual and audible warning alert the participant still crashed Of the four who received RPS warnings and crashed one driver did not look at the RV display one driver looked once initially (before the obstacle was present) and two looked more than once but the RV image had not displayed yet (due to RV display delay) It should be noted that while the RV display exhibited a delay in appearance of the video image the RPS worked independently and did not exhibit a similar delay
Table 22 Obstacle Event Outcomes as a Function of RPS Detection System N Detected Object Did Not Detect Object
RV amp RPS 13 5 (385) 8 (615) Number That Crashed 11 4 7
The one person who did not receive a RPS warning alert in the obstacle event and did not crash had observed the obstacle in the RV display and was able to stop without striking it The RPS appeared to be unable to detect the obstacle if it was located at the centerline of the vehicle Thus those participants who backed out of the garage on an off-center path were the ones who tended to receive RPS warning alerts This observation agrees with RPS detection performance results presented in Section 21
63 Eye Glance Behavior During Baseline and Obstacle Events
This section presents results for eye glance behavior observed during baseline and obstacle events Glance locations noted for these data were as follows
Over left shoulder (Left Shoulder) Out left window or at left mirror (Left) Instrument panel Forward (out windshield) Rearview mirror RV display or center console (consolevideo) Out right window or at right mirror
59
Over right shoulder Other
The driver was considered to be looking at the noted location if their eyes were determined to be focused on that location regardless of their body orientation
Data presented in Table 23 summarize glances to the RV display for baseline and obstacle events Note that data are from the first 12 seconds of backing (after car began to move as judged visually) Note further that these data may include more than 12 seconds of glance behavior This would occur when the driver began backing while in the middle of a glance In these situations the entire glance duration was included These data have an N of 46 because they represent two trials for each of the 25 participants with a rearview video system in their vehicle (12 who had lsquoRV onlyrsquo and 13 who had lsquoRV amp RPSrsquo) minus two participants for which eye glance data was not available due to problems with data recording equipment
Table 23 Summary of Participantsrsquo Glances to the Rearview Video System During the Baseline and Obstacle Events
Dependent Variable N Mean Std Dev Min Max Number of Glances to RV 46 141 145 000 600 Total Number of Glances 46 1050 328 400 1800 Percentage of Glances to RV 46 1400 1300 000 5000 Percentage of Time Viewing RV 46 1500 1900 000 8100 Total Glance Time (s) 46 1174 153 577 1444
On average drivers made 1050 distinct glances during a backing event that lasted 1174 seconds Of these glances 141 were to the RV display This value ranged between 0 and 60 The percentage of time spent looking at the RV display was 15 percent (SD=19 range 0 to 81) Drivers with RV made 13 to 14 percent of glances to the RV display during initial phases of backing
With respect to individual drivers one subject (S2) viewed the RV display for 63 percent and 81 percent of the two experimental backing trials although the latter number is undoubtedly inflated by the fact that the object was seen in the rear video Thus the baseline trials may be better representations of uneventful backing Following the highest value for proportion of time spent viewing the RV display the next highest values were 40 percent (S37) 37 percent (S7) and 27 percent (S34)
The following table presents the number of subjects for each combination of Trial (baseline or event) System (None RV RV amp RPS) and Glance category (0 1 or 2+)
60
Table 24 Number of Glances to the ConsoleRV Display by System and Baseline or Event Trial Glances to ConsoleVideo System 0 1 2+ Total subjects Baseline None 10 1 0 11
RV 5 3 4 12 RVamp RPS 2 5 4 11
Event None 11 1 0 12 RV 3 4 4 11 RV amp RPS 4 4 4 12
If the two systems with RV are combined the results shown in Table 25 are obtained
Table 25 Number of Glances to the ConsoleRV Display by RV Presence and Baseline or Event Trial
Glances to ConsoleVideo System 0 1 2+ Total subjects
Baseline None 10 1 0 11 RV combined 7 8 8 23
Event None 11 1 0 12 RV combined 7 8 8 23
Thus for both baseline and event trials 16 of 23 (70 percent) of the subjects looked at least once at the consolevideo area The corresponding values for baseline trials were 1 out of 11 (9 percent) and 1 out of 12 (8 percent)
These data are remarkably consistent in the aggregate however when the glance behavior of each subject was considered it became apparent that there was some inconsistency in individual subjectsrsquo glance behavior between baseline and event conditions Specifically
bull 6 subjects were consistent between baseline and event trials in the specific number (1 or 2+) of recorded glances to the consolevideo
bull 3 subjects were consistent in not glancing at consolevideo across trials bull 4 subjects were consistent in devoting some glances to the consolevideo but
the number differed between baseline and event trials bull 8 subjects were not consistent each of these had one or more glances on one
condition but none in the other condition bull (4 subjects had eye glance data from only one of the two conditions)
These data can be summarized in several ways
1 For the event trials 70 percent (16 of 23) of drivers looked at least once at the video display The corresponding percentage for the baseline trials was also 70 percent
61
2 When we consider driversrsquo behavior on both trials together we find that 18 (86 percent of the 21 drivers for which both sets of glance data were available) drivers looked at the consolevideo area on at least one of the two trials (10 on both 8 on one or the other) while 3 drivers looked on neither trial
3 When we consider only consistency of behavior across the two trials we find that 13 drivers were consistent in their behavior (10 in looking 3 in not looking) while 8 were inconsistent in their behavior (looked on one trial but not the other)
Figure 40 shows the mean number of glances per backing trial (baseline and obstacle events) for the first 12 seconds of backing by glance location and system condition The start of backing was determined visually (ie manual review of video-recorded data) for baseline and obstacle event trials Overall drivers with no system made slightly more glances per maneuver (M=119 SD=34) compared to those drivers with RV (M=99 SD=34) and RV amp RPS (M=95 SD=50) systems Relative to those with RV systems drivers with no RV system made more glances over the left shoulder forward left and right Drivers with no RV system did not look more frequently at the rear view mirror Drivers with RV made 13-14 percent of glances to the RV display during the initial phases of backing (see Figure 39)
0
05
1
15
2
25
3
Left S
hould
er Left
Forward
Inst Pa
nel
Rearvi
ewMirro
r
Conso
leVide
o Righ
t
Right Sh
oulde
r
Other
Mea
n N
umbe
r of G
lanc
es
None RV RV amp RPS
Figure 40 Mean Number of Glances Per Trial by Glance Location and System (Baseline and Obstacle Events)
Summary data for glance frequency and mean percentage of glances by location (see Figure 41) reveal similar patterns Drivers glanced predominantly forward left or right during backing Drivers with no RV system glanced more often over their left shoulders Drivers with RV systems directed almost 15 percent of glances during the first 12 seconds of backing to the RV system display These data show an extremely low percentage of glances to consolevideo among drivers in the ldquono systemrdquo condition which differs from naturalistic findings (presented in Section 50) and probably reflects
62
Left S
hould
er Left
Forward
Inst P
anel
earvi
ew M
irror
Conso
leVide
o Righ
t
Right S
hould
er
Other
0
5
10
15
20
25
Per
cent None
RV RV amp RPS
R
the fact that the drivers had no need to look at the console (eg for radio or HVAC) while backing out of the garage in the staged obstacle event scenario
Figure 41 Mean Percentage of Glances by Glance Location and System Condition (Baseline and Obstacle Events)
Figure 42 presents eye glance durations by glance location and system condition for baseline and obstacle events Mean durations were computed first by subject For drivers with no RV system results indicate slightly shorter glances to the consolevideo and slightly longer glances to the rearview mirror Glances over the right shoulder were slightly shorter for those in the no system condition
0
05
1
15
2
25
Left Sh
oulde
r Le
ft
Forward
Inst P
anel
Rearvi
ewMirr
or
Conso
leVide
o Righ
t
Right S
hould
er
Other
Gla
nce
Dur
atio
n (s
)
None RV RV amp RPS
Figure 42 Mean Glance Duration by Glance Location and System Condition (Baseline and Obstacle Events)
63
Figure 43 illustrates the mean percentage of total glance time by glance location and system condition for the baseline and obstacle events Independent of system presence drivers spent over 25 percent of backing time looking over their right shoulder and 15 percent of time looking toward the right mirror or window
0
005
01
015
02
025
03
035
Left S
hould
er Left
Forward
Inst Pan
el
Rearvi
ewMirro
r
Conso
leVide
o Righ
t
Right S
hould
er
Other
Perc
ent1
00
None RV RV amp RPS
Figure 43 Mean Percentage of Total Glance Time by Glance Location and System Condition (Baseline and Obstacle Events)
64
Glance Location No System (12) RV (12) RV amp RPS (13) At the side mirrors 75 6667 615 At the center rearview mirror 75 8333 769Over my shoulder 9167 9167 923 At the rearview video display 8333 615At the backing aid display 231
Note Multiple responses to this question were allowed
70 QUESTIONNAIRE RESULTS
This section presents summaries of selected questionnaire items A full set of questionnaire responses is provided in Appendices E through G
Immediately after experiencing the obstacle event participants were asked to complete a questionnaire tailored to their system condition The first question asked whether the participants had anticipated the obstacle event ie were they genuinely surprised All participants in all system conditions reported that they did not anticipate the obstacle event
Participantsrsquo responses regarding where they look primarily to determine whether the area behind the vehicle is clear when backing showed a fairly equal distribution of reported glances to the side mirrors center rearview mirror over their shoulders and at the rearview video display (when present) However as shown in Table 26 only 3 of 13 (23 percent) drivers of vehicles with a RPS system stated that they used RPS information
Table 26 Questionnaire Responses Regarding Where Drivers Look to Determine Whether the Area Behind Their Vehicle is Clear Prior to Backing
One participant in the lsquoRV onlyrdquo condition and three participants in the lsquoRV amp RPSrsquo condition stated that they rarely or never look at the rearview video display when backing Five of thirteen participants with RV amp RPS stated that they rarely or never look at the backing aid display when backing
When asked why their vehicle did not have an RV or RPS system a majority of participants in the ldquono systemrdquo condition gave three responses Thirty-three percent said that it never occurred to them to look for an RV system and 58 percent responded similarly in regard to a RPS A third of participants reported that the RV or RPS was packaged with options that they were not interested in purchasing Nearly 42 percent of participants in the ldquono systemrdquo condition reported that an RV system was not an option on their vehicle while 25 percent reported that a RPS was not an option (Note that since RV amp RPS were available for their vehicle this indicates a lack of awareness of these systems) Table 27 presents a complete summary of responses
65
Table 27 Percent Responses Regarding Why ldquoNo Systemrdquo Participants Did Not Choose To Purchase a Backing Aid System
Response Choices RV RPS It never occurred to me to look for one when I was buying the vehicle 333 583 It was not an option on my vehicle 417 250 I thought the (system) would be a nuisance or distraction 83 0 I wouldnrsquot trust the (system) 83 0 I donrsquot need a (system) because I have good backing skills 83 83 The (system) was not worth the extra cost 83 167 The (system) was only available with other options that I didnrsquot want 333 333 I was not the person who purchased or made the decision to purchase this vehicle 0 0 No response 0 83
As noted in Table 28 all 12 participants in the RV system condition reported that they would want RV on their next vehicle Twelve of 13 RV amp RPS participants reported that they would be repeat customers of a RPS Two-thirds of participants in the ldquono systemrdquo group reported that they did not know if they would like an RV or RPS system on their next vehicle
Table 28 Participant Responses Regarding Whether They Would Like Their Next New Vehicle to be Equipped With a Backing Aid System (by System Condition)
Response
System Condition No System RV RV amp RPS
Would you Want RV RPS RV RV RPS
Yes 333 333 100 769 923 No 0 0 0 77 0 Donrsquot Know 667 667 0 154 77
Table 29 summarizes the responses of participants in the RV and RV amp RPS groups regarding how they learned to use their RV and RPS systems as appropriate
Table 29 How Did Participants Learn to Use Their RV or RPS System Condition RV RV amp RPS
How Did the Participant Learn To Usehellip RV RV RPS
Instructions from the dealership such as a video brochure or demonstration 500 385 308
Vehicle ownerrsquos manual 83 308 231 Help from a friend or relative 167 77 154 Information on the Internet 0 0 77 On-road experience and practice (trial and error) 833 846 769 I have not yet learned how to use the system 0 0 0
66
When asked whether there was anything difficult about learning to use an RV system 4 participants in the RV system condition reported that it was difficult to judge the distance between the vehicle and an object behind it and 7 reported that it was easy to judge distances Five participants in the RV amp RPS condition reported varied difficulties in learning to use their systems including ignoring the audible warning tones difficulty incorporating use of the aid into their normal backing behavior and difficulty in judging distances
Two of 12 participants in the RV condition and 2 of 13 participants in the RV amp RPS condition reported that at some point in the prior 2 weeks they had made a backing maneuver using only the RV system Conversely one participant in the RV condition and five in the RV amp RPS condition reported via questionnaire response that she ldquorarely or never look(ed) at (her) systemrdquo It is interesting to note that this participant who reported not looking at her system crashed in the staged obstacle event scenario but had no crashes during her recorded period of naturalistic driving
When asked about how well their vehiclersquos RV or RV amp RPS work in certain weather conditions 23 percent of participants in the RV condition reported that their system does not work well in darkness One commented that it doesnrsquot work well when the camera is dirty Table 30 provides a complete summary of responses regarding participantsrsquo perceptions of RV and RPS performance in difference environmental conditions
Table 30 How Well Does Your Vehiclersquos RPS (N=13) and RV (N=12) Work in the Following Weather Conditions
Darkness Fog Cold Temperatures Rain Snow Bright Sun
Response RV RV amp RPS
RV RV amp RPS
RV RV amp RPS
RV RV amp RPS
RV RV amp RPS
RV RV amp RPS
Not at All 0 0 0 0 0 0 0 0 0 0 83 0
Poorly 0 231 25 77 83 0 167 154 83 154 25 154 Fairly Well
667 385 167 308 83 308 50 769 25 308 333 385
Perfectly 25 231 0 77 50 385 25 0 83 77 417 308
Donrsquot Know
83 154 583 539 333 308 83 769 583 462 0 77
Question 16 of the lsquoRV amp RPSrsquo questionnaire sought to determine whether participants had any misconceptions about the utility of the rearview video and rear parking sensor systems One misconception identified was the belief of ten of thirteen participants that the RPS would be operational when backing at a speed of 10 mph (ultrasonic systems are typically not operational above 3 mph) Six participants did not realize that an RPS cannot detect a child located under the rear bumper and four participants thought that the system would detect a child in that location poorly Nine participants optimistically thought that their RPS would detect a narrow sign post behind their vehicle at least fairly well
67
Given that backover crashes frequently happen in driveways participants were asked how easy their RV or RV amp RPS are to use when backing out of a driveway Table 31 summarizes these responses Three participants in the RV amp RPS system condition felt that their vehiclersquos equipment was difficult to use in this situation Specifics regarding what these participants found difficult about using the system were not obtained
Table 31 Summary of Participant Responses to the Question ldquoHow Easy is Your (System) To Use When Backing Out of a Driveway
Response RV RV amp RPS Very easy to use 583 385 Somewhat easy to use 250 385 Somewhat difficult to use 167 0 Very difficult to use 0 231 Donrsquot Know 0 0
Participants in the RV and RV amp RPS conditions were presented with a schematic (see Figure 44) of a vehicle with defined areas behind it labeled ldquoArdquo through ldquoQrdquo and asked in which of these areas a small standing child could be seen in the RV display Table 32 summarizes the percentages of participants who chose each area as a place where such a child would be visible Using data presented earlier in Section 2 the difference between which areas participants believe they would be able to see in the RV display and what they actually would be able to see are compared In Table 29 areas in which a small standing child would not be visible in the RV display are presented with dark shading Lightly shaded areas indicate locations in which a small standing child may not be visible in the RV display As was shown in Figure 4 the 2007 Honda Odyssey RV systemrsquos camera appears to have a range of approximately 100 degrees This visible range leaves approximately 40 degrees on each side of the vehicle that are not visible in the RV display These invisible areas coincide with areas A B J K and most of C I L and N in Figure 44
Table 32 Summary of Questionnaire Responses Indicating in Which Areas (in Figure 44) a Small Standing Child Could Be Seen in the RV Display
Response RV RV amp RPS A 0 769 B 833 3846 C 5000 6923 D 6667 9231 E 7500 8462 F 9167 9231 G 7500 8462 H 6667 9231 I 5000 6923 J 2500 3846 K 0 769
68
Rear Bumper
Front Bumper
Distance in feet
2
3
4
5
6
7
8
9
10
11
0
1
12
13
14
15
16
17
20
18
19
A
B
C
D
E F G
H
I
K
J
L M N
O P Q
L 1667 3846 M 5000 6923 N 1667 3846 O 5833 7692 P 9167 8462 Q 5833 7692
Figure 44 Graphic Used to Assess in Which Areas Participants Thought a Small Child Standing Behind Their Vehicle Could Be Seen in the RV Display
Participants in the RV amp RPS condition were presented with another schematic (see Figure 45) of a vehicle with defined rectangular areas behind it and asked in which of these areas a small standing child would be detected by the RPS Figure 45 contains the illustration provided in the questionnaire with summarized data overlaid on it to highlight the percentages of participants who chose each area as a place where such a
69
child would be detectable by the RPS Shaded areas indicate locations in which RPS detection performance testing (summarized previously in Section 20) showed the system to be unable to detect objects Based on these responses it seems that participants in this study overestimated the detection range capabilities of the RPS on their vehicles There was not one location where all 13 participants unanimously agreed a standing child would be detected with the most detectable area being in the one to three foot range of the area straight back from the vehiclersquos bumper
Figure 45 Summary of Questionnaire Responses Indicating in Which Areas a Small Standing Child Would Be Detected by the RPS
When asked whether having an RV system made them safer drivers 8 of 12 participants in the RV condition responded lsquoyesrsquo while the other 4 reported that it made
70
no difference Seven of 13 participants in the RV amp RPS system condition reported that having the system made them a safer driver while 6 reported that it made no difference
When asked whether or not they think there is anything about their vehiclersquos system that could be improved 8 of the 12 participants in the RV condition responded lsquoYesrsquo Some of their recommendations included provision of a distance indication quicker appearance of the RV image after shifting into reverse a wider angle of view elimination of sun glare and improved image quality in rain One RV participant also stated that the RV system needs a way to make it easier to determine if the vehicle is going straight or not
Participants in the RV amp RPS condition were asked whether they thought improvements were warranted for their vehiclesrsquo RV and RPS features Eight of 13 participants in the RV amp RPS condition thought improvements were warranted including use of a different sound for backing versus parking use of different sounds for side versus rear provision of a distance indication elimination of the RV image appearance delay after shifting into reverse and relocation the RPS visual warning display so the driver can see it when looking backwards over their shoulder One participant in the RV amp RPS condition suggested that the system have more sensors and no camera Lastly one participant in the RV amp RPS condition suggested that the manufacturer provide a way to temporarily turn off the sensors apparently not realizing that such a switch is provided
71
80 DISCUSSION
81 Rearview Video System Display Response Time
The time it takes for the rearview video image to appear on the systemrsquos visual display once the transmission has been shifted into reverse gear may affect driversrsquo use of a rearview video system The rearview video image response time was measured for the study vehicle (2007 Honda Odyssey) and two additional vehicles equipped with rearview video systems a 2007 Cadillac Escalade and a 2005 Infiniti FX35
Rearview video system display timing was recording using a tripod-mounted digital video camera pointed at the video screen and the gear shift control Timing information was extracted by watching the recorded video files using a software program allowing frame-by-frame video analysis with accuracy to 130 of a second Video frames in which the gear shift control was placed into park and in which the rearview video image appeared were marked The marked times were written to a text file which was opened in a spreadsheet program The response time was calculated by subtracting the time the car was shifted into reverse gear from the time that the rearview image appeared This calculation was made for two cases one in which the car was just started and a second in which the car had been running for some time before the transmission was shifted into reverse Table 33 summarizes these data
Table 33 RV Display Measured Response Time (s) Time from shifting into reverse gear until the RV image appears
2007 Honda Odyssey Touring
2007 Cadillac Escalade
2005 Infiniti FX35
Car just started 644 181 045 Car already running 081 199 045
The case that corresponds to that which participants experienced in the staged unexpected obstacle event is that of the Honda Odyssey in which the car has just been started before shifting into reverse gear As shown in Table 31 this response time was the longest of the test conditions Shorter RV image response time would make the view behind the vehicle available to the driver for a larger portion of the maneuver duration
For the Odyssey the authors believe that the RV image delay after vehicle ignition is due to the manufacturerrsquos priority scheme for the display namely giving initialization priority to the navigation system over the RV system Two of the three vehicles examined exhibited RV image response times of less than 2 seconds demonstrating that quick presentation of the RV image is technologically possible Given the busy nature of peoplesrsquo lives in this day and age and the emphasis on safety giving priority to the RV image would be a more sensible option
72
82 Why Was RV (only) Associated with Fewer Crashes Than RV amp RPS
Results of the staged obstacle event in this study found that 58 percent of participants with RV crashed and 85 percent of participants in the RV amp RPS condition crashed This result is counterintuitive if you assume that having two driver assistance systems for backing is better than one However not all drivers in the RV amp RPS condition received warnings from the RPS during the obstacle event As stated in Section 62 the RPS appeared to be unable to detect the obstacle if it was located at the centerline of the vehicle Thus those participants who backed out of the garage on an off-center path were the ones who tended to receive RPS warning alerts This observation agrees with RPS detection performance results presented in Section 21
Participants in the lsquoRV amp RPSrsquo system condition seemed to glance at the RV display less often On average drivers made less than one (M=081) glance to the center console area (eg to look at the vehiclersquos clock) when no video display was present versus 217 (RV) and 165 glances (RV amp RPS) when the RV system was present Data suggest that participants in the RV amp RPS condition made no glances at all per trial to the RV display more often than those in the lsquoRV onlyrsquo condition The data also suggest that participants in the RV amp RPS condition made four or more glances per trial to the RV display less often than those in the lsquoRV onlyrsquo condition This trend of more participants with lsquoRV onlyrsquo looking at the RV display than those with RV amp RPS may indicate that participants in the RV amp RPS condition were relying on the sensors to alert them of an obstacle However differences in the particular backing situations between driver groups (ie differential exposure) or individual differences in backing habits between groups may have contributed to this difference
Even if an RPS provides a visual or audible warning of a rear obstacle drivers may not look at the visual alert or heed an audible one The RPS visual alert in the specific vehicle used in this study was located under the speedometer This location is not one that drivers tend to check while backing Drivers of vehicle equipped with RV amp RPS in this make model had two new visual sources of information to check during backing the center dashboard-mounted RV display and the RPS alert under the speedometer An RV display with integrated warnings would avoid the situation of divided attention between multiple displays (RV and visual alert) Alternatively presenting a warning alert in another location that a driver typically checks when backing (eg right C-pillar) should be more beneficial
In a 2005 study by Llaneras et al nearly three quarters of drivers hit a toy coupe obstacle that was presented despite being given warnings by a RPS system In the current study 80 percent of drivers that received RPS warnings still collided with the obstacle Therefore the obstacle event crash results of the current study also support Llanerasrsquo statement that ldquonone of the interface warning conditions reliably induced avoidance braking under the surprise event conditionrdquo The combined results of these studies may suggest that intervention by a collision avoidance system may be necessary in order to achieve a significant reduction in backing crashes
73
83 Impact of Rearview Video Use on Likelihood of Backover Crash Avoidance
The likelihood that a backover crash scenario could be mitigated by use of a rearview video system depends on several conditions most notably the location and movement (or path) of the obstacle A review of NHTSA Special Crash Investigation (SCI) not-inshytraffic crashes shows that for the 66 percent of cases in which the location of the child was determinable 24 percent (10 of 42 cases 9 stationary 1 running toward a car from the rear) of them involved a child behind the car and 43 percent (18 of 42 cases) involved a child approaching the area behind the car from the left or right Considering that drivers in the backing maneuver obstacle event reported on here made only 141 glances on average to the RV display during a backing maneuver the case in which the victim is stationary behind the vehicle would seem to provide the best opportunity for mitigation via rearview video system A child moving into the area behind the vehicle may not be present in the RV systemrsquos field of view at the time that the driver looks at the RV display
In this study 15 of 25 (60 percent) participants with an RV (including RV amp RPS condition participants) glanced at the RV display at least once during the obstacle event If it is assumed that a driver would successfully identify the presence of a stationary or longitudinally moving child behind the vehicle then it can be asserted that 60 percent of the 10 relevant SCI crashes or 214 percent (6 of 28) may have been avoidable through the use of an RV system
In naturalistic backing maneuvers observed in this study drivers with RV looked more than once at the RV display in approximately 40 percent of maneuvers and looked at least once in approximately 65 percent of maneuvers If based on the above mentioned SCI data 357 percent (10 of 28) of crash scenarios involve a stationary victim behind the vehicle effectiveness can be estimated to be 143 percent (357 x 40 x 100) if more than one RV glance is required to detect object or 232 percent (357 x 65 x 100) if just one RV glance will result in object detection Based on SCI data and both obstacle event and naturalistic data from the current study overall effectiveness of RV (only) is anticipated to be around 20 percent
A vehicle equipped with an RPS could have the ability to detect a rear obstacle and alert the driver to the presence of the object eliciting a look by the driver to the RV display However RPSrsquos tested to date by NHTSA have exhibited poor performance in detecting children and general unreliability in a variety of test conditions
84 Caveats
This study examined a set of people driving a single vehicle model a minivan Participants may not have exhibited same glance behavior as they would in a vehicle of a different type or size
The particular rearview video system in the vehicle chosen for use in this study had a center dashboard-mounted display Some model year 2008 vehicles come equipped with a rearview video display located in the center rearview mirror It is unknown whether the glance behavior observed with a center dashboard-mounted display would
74
be similar to that of drivers in a vehicle equipped with the RV display in the center rearview mirror
85 What is ldquoGoodrdquo Driver Glance Behavior During Backing
Examining the extent to which drivers look at a rearview video system during backing maneuvers to assess whether drivers are using the systems sufficiently invites the question ldquowhat should driversrsquo glance behavior be like during backingrdquo Driversrsquo glance behavior should vary according to the backing situation Different driving environments traffic conditions degrees of pedestrian presence and vehicle configurations all can warrant different eye glance behavior The following statements highlight was some aspects of ldquogoodrdquo glance behavior during backing maneuvers might be like
1 When a rearview video system is present on the vehicle drivers should not begin backing until the RV display image becomes visible and they have looked at the image
2 Drivers should also look at the RV display periodically during backing One glance immediately before or at the beginning of backing is not enough
3 Drivers should look more frequently at the RV display if they are in a busy area or if they hear noise that might suggest movement behind the vehicle
4 Drivers should look more frequently at the video screen if they think they see a moving object in one of the mirrors
5 Drivers should not use the RV display to avoid looking in other locations They should look to both sides and in all mirrors in addition to their use of the RV system
6 Drivers should be aware of the approximate size of blind zone behind their vehicle as well as limitations in lateral visibility for their specific vehicle(s)
7 Drivers of vehicles equipped with rear parking sensor systems should not rely on alerts from that system to indicate the presence of people particularly children behind the vehicle The driver must actively look out the vehiclersquos windows and in the mirrors to aid in the detection of pedestrians
75
90 SUMMARY AND CONCLUSIONS
Results of this study revealed that drivers look at rearview video displays during backing maneuvers at least some of the time This study found that approximately 14 percent of glances in baseline and obstacle events and 10 percent of glances in naturalistic backing maneuvers were to the rearview video display The timing and frequency of their glances to the RV display has a noticeable impact on the likelihood of rear obstacle detection Making single or multiple glances to the RV display at the start of the maneuver do not ensure that the path behind the vehicle will remain clear for the entire backing maneuver
Drivers varied in their use of the RV system during the staged baseline and event trials Specifically among drivers with an RV system 16 of 25 participants (64 percent) made at least one glance to the RV during the staged event trials When both baseline and event trials were considered the percentage of glance time directed at the RV display varied between 0 and 81 percent of the first 12 seconds of backing The staged obstacle event scenario was designed such that without an RV system drivers could not see obstacle
The rearview video system examined in this study improved detection and avoidance of a crash with a simulated stationary object in the experimental trials Overall the RV system presence was associated with a 28 percent reduction in crashes The addition of RPS had no additional benefit in fact although statistically not significant participants in the RV amp RPS system condition crashed more often than those in the lsquoRV onlyrsquo system condition For reasons that are not completely understood the RPS on the specific vehicle used in the study only detected the obstacle in 38 percent of obstacle event trials involving participants in the RV amp RPS system condition
There are several possible reasons why the RV systems did not have a bigger benefit in the obstacle event trials These include the delay associated with the appearance of the image in the RV display the inappropriate timing of the driversrsquo looks to the RV display their failure to make multiple glances and the possibility that drivers had strong expectations that no such event would occur in the research setting which may have led them to become less vigilant than in real-world backing
The presence of an RV system has no apparent effect on driversrsquo backing behavior (eg speed acceleration) in the baseline and obstacle event trials There was a statistically non-significant tendency for drivers of vehicles with RV systems to wait longer after shifting into reverse before starting to back This may be related to driversrsquo waiting for the rearview video image to appear however there is no direct evidence to support this conclusion
In the naturalistic portion of this study among 37 participants each of whom participated for 28 days for a total of 42982 miles there were 6145 backing maneuvers A typical backing event took approximately 10 seconds and covered 34 feet Driversrsquo average backing speed was 226 miles per hour the average maximum speed was 364 miles per hour Twenty-two percent of backing maneuvers involved multiple backing
76
components in which backing motion was separated by a period of stopped time for example when a driver backed to the end of a driveway stopped to wait for traffic then continued backing into the street The results of naturalistic data collection reveal that on average drivers made approximately 114 backing maneuvers per trip average trip length was slightly less than 9 miles
None of the 6145 naturalistic backing events resulted in a significant collision There were several minor collisions during routine backing with for example trash cans and other vehicles
There is no evidence to support the hypothesis that driversrsquo backing behavior (ie speed and acceleration) was influenced by the presence or absence of an RV system Mean backing speeds across all system conditions was approximately 225 mph in both staged and naturalistic backing maneuvers in this study
Glance behavior during backing appears to be robust and relatively invariant over different environmental conditions In real-world backing situations drivers with RV systems spent 8 to 12 percent of the backing time looking at the location of the RV display Drivers with no system spent about 3 percent of their backing time looking at the consolevideo Ignoring the possible effects of differential exposure the differences between these values (5 to 9 percent) constitute one estimate of the percentage of backing time devoted to looking at the rearview video display Furthermore this result suggests that in addition to the routine preparatory tasks involving the console (radio HVAC) drivers regularly look at the RV system while backing Drivers with no RV system do not devote more glance time to the rear view mirror
While the evidence of driversrsquo use of the rearview video systems obtained in this study is encouraging it should be noted that due to the wide range of directions and speeds in which an obstacle might approach the area behind a vehicle and the timing in which a driver may choose to glance at the rearview video display a rearview video system cannot be expected to prevent all backing crashes
Approximately 61 percent of backing events involved no concurrent driver activity Among the remaining 39 percent of backing events concurrent activities included activation of garage door remote (13 percent) talking with passenger (13 percent) using cell phone (3 percent) and securing seat belt (3 percent) among others In 508 backing events (approximately 10 percent of the subset for which driver activity was recorded) drivers were engaged in multiple concurrent activities while backing
The specific patterns of driversrsquo eye glance behavior and visual sampling of the center dashboard-mounted rearview video display may not be similar to those that would be observed in drivers using an RV display mounted in the center rearview mirror Additional research would be required to determine whether rates of driversrsquo glances to the RV display seen in this study would be similar with a display in the rearview mirror
While rearview video systems offer the driver a useful tool for detecting rear obstacles some guidance may be necessary to educate drivers as to the most effective way to
77
incorporate this new visual information source into their glance behavior during backing maneuvers Encouraging drivers to make more than once glance to the RV display during backing maneuvers and to glance at the display throughout the maneuver rather than just at the beginning may increase the benefits attainable with these systems
78
100 REFERENCES
[1] National Highway Traffic Safety Administration (2006) Vehicle Backover Avoidance Technology Study (Report to Congress)
[2] Mazzae E N and Garrott W R (2006) Experimental Evaluation of the Performance of Available Backover Prevention Technologiesrdquo National Highway Traffic Safety Administration DOT HS 810 634 September 2006
[3] Mazzae E N and Garrott W R Experimental Evaluation of the Performance of Available Backover Prevention Technologies for Medium Straight Trucks DOT HS 810 865 November 2007
[4] McLaughlin SB Hankey J M Green C A and Kiefer R J (2003) Driver Performance Evaluation of Two Rear Parking Aids 2003 Enhanced Safety of Vehicles Conference Paper 522
[5] Llaneras RE Green CA Chundrik W Altan OD and Singer JP (2005) Design and Evaluation of a Prototype Rear Obstacle Detection and Driver Warning System Human Factors Vol 47 No 1 Spring 2005 Human Factors and Ergonomics Society
[6] Green C A and Deering R K (2006) Driver Performance Research Regarding Systems for Use While Backing SAE International Paper No 2006-01-1982
[7] Llaneras E amp Neurauter L (2005) Early Adopters Safety-Related Driving With Advanced Technologies 2005 Inventory of In-vehicle Devices amp Interface Characteristics (Task Order 10 under Project DTNH22-99-D-07005)
[8] Jenness J W Lerner N D Mazor S Osberg J S and Tefft B C (2007) Use of Advanced In-Vehicle Technology by Young and Older Early Adopters Survey Results on Sensor-Based Backing Aid Systems and Rear-View Video Cameras National Highway Traffic Safety Administration DOT HS 810 828
[9] Honda (2006) 2007 Odyssey Ownerrsquos Manual
79
110 APPENDICES
111 Appendix A Results for Performance Testing of the 2007 Honda Odysseyrsquos Parking Sensor System ndash Front Sensors
Figure 46 PSS Front Sensorsrsquo Detection Results for the Various Traffic Cones a 40shyiInch-Tall PVC Pole and an Adult Male
80
112 Appendix B Participant Information Summary
81
You are being asked to participate in this research study because you
bull Are 25-60 years of age bull Have a valid unrestricted US driverrsquos license (except for restrictions concerning corrective
Page 1 of 9
Version Date 13 June 2007 Participants Initials
STUDY Driving Behavior in New Vehicles STERLING IRB ID 2495 DATE OF IRB REVIEW 061307
PARTICIPANT INFORMED CONSENT AND CONFIDENTIAL INFORMATION FORM
STUDY TITLE Driving Behavior in New Vehicles
STUDY DOCTOR Elizabeth N Mazzae MSE
STUDY SITE NHTSA Vehicle Research and Test Center (VRTC) 10820 SR 347 East Liberty OH 43319
TELEPHONE 800-262-8309 937-666-4511
SPONSOR National Highway Traffic Safety Administration
You are being asked to participate in a research study Your participation in this research is strictly voluntary meaning that you may or may not choose to take part To decide whether or not you want to be part of this research you should understand the study risks and benefits in order to make an informed decision This process is known as informed consent This consent form describes the purpose procedures possible benefits and risks of the study This form also explains how your information will be used and who may see it You are being asked to take part in this study because the study investigator feels that you meet the qualifications of the study
The study investigator or staff will answer any questions you may have about this form or about the study Please read this document carefully and do not hesitate to ask anything about this information This form may contain words that you do not understand Please ask the investigator or staff to explain the words or information that you do not understand After reading the consent form if you would like to participate you will be asked to sign and date this consent form You may have a copy of this form to review at your leisure and keep for your records
This study is being conducted by the U S Department of Transportationrsquos National Highway Traffic Safety Administration (NHTSA)
STUDY PURPOSE
This research study is being conducted to assess how drivers learn to use the features and functions of a new vehicle By learning more about how people become familiar with and learn to take advantage of their vehiclersquos features we hope to better understand driver behavior and estimate the degree of safety that newer vehicles may provide
STUDY REQUIREMENTS
eyewear) bull Have a minimum of 2 years driving experience bull Drive at least 7000 miles per year bull Are in general good health bull Are the primary driver of a 2007 Honda Odyssey and drive it as your primary source of
transportation bull Agree to be the sole driver of the 2007 Honda Odyssey for the duration of your participation
NUMBER OF STUDY SITES AND STUDY PARTICIPANTS
This study will take place at one research site (NHTSArsquos Vehicle Research and Test Center VRTC) and will include up to 39 participants
STUDY PROCEDURES
Before participating in this research study you will be asked to read this Participant Informed Consent Form After all of your questions have been answered you will be asked to sign this form to show that you voluntarily consent to participate in this research study
Summary of Study Procedures
Your participation in this study will last for about 4 weeks There are three phases involved in this study
bull an initial meeting with test drive bull a 4-week period of monitored driving bull a final meeting with test drive
Details regarding these three phases follow
Initial Meeting
bull You will be asked to review and sign this consent form bull Your vehicle will be inspected for any pre-existing damage by a member of the research
staff You will be asked to sign a form acknowledging the current condition of your vehicle bull Technicians will install electronic recording equipment in your vehicle It will take
approximately 2 hours to install the equipment in your vehicle bull While the recording equipment is being installed you and a member of the research study
staff will go for a brief test drive A member of the research staff will be with you in the vehicle at all times and will give you detailed instructions during the test drive During the test drive you will be asked to perform various basic driving maneuvers such as changing lanes turning and backing The test drive will take place on specific driving courses and on two-lane private access roads on the grounds of the Transportation Research Center
bull Your vehicle will be returned to you and the locations of any visible instrumentation or wiring will be pointed out for your information
Page 2 of 9
Version Date 13 June 2007 Participants Initials
STUDY Driving Behavior in New Vehicles STERLING IRB ID 2495 DATE OF IRB REVIEW 061307
4 Weeks of Monitored Driving
bull You will drive your own vehicle as you normally would for a period of approximately 4 weeks During this time your driving behavior will be recorded using special sensors and a video recorder (Please see the following section regarding ldquo4 Weeks of Monitored Drivingrdquo below for additional details)
bull A technician will check your vehicle approximately once per week during the 4-week period to determine the remaining available data storage capacity and add additional storage media as needed
Final meeting
bull A member of the study staff will give you detailed instructions and accompany you on a brief test drive You will be asked to perform various basic driving maneuvers during the test drive
bull Electronic recording equipment will be removed from your vehicle bull You will be presented with additional information regarding this study bull You will complete a brief questionnaire regarding your driving experiences bull Your vehicle will be returned to you in the same condition as in the first meeting
Test Drives
During your participation you will be asked to complete two ldquotest drivesrdquo that involve driving a vehicle equipped with special recording instruments You will drive on private access roads a 75shymile oval test track and parking lots located on the grounds of the Transportation Research Center (TRC) in East Liberty Ohio The instrumented vehicle will be of the same make and model as your vehicle but may have a different trim level The instrumented vehicle is equipped with sensors to record information on your steering braking and gas pedal use A video camera pointed at the driverrsquos face will record eye glance locations The camera and sensors are located so that they will not affect your driving The information collected by these sensors is recorded so that it can be analyzed at a later time
You will be given instructions on the rules and procedures before driving on the TRC test track and other driving areas at TRC You will be required to wear a seat belt at all times while driving Although a member of the study staff will be with you at all times he or she is not able to ensure complete safety Therefore it is important to remember that you as the driver are in control of the vehicle and you must be the final judge as to when to complete the tasks during this study
4 Weeks of Monitored Driving
The monitored driving will involve 4 weeks of driving your own vehicle as you normally would while allowing your driving behavior to be recorded The study investigator may request that you permit a technician to access your vehicle approximately once a week during the 4 week period to check the condition of installed instrumentation and data recording capacity Arrangements for these meetings will be made at your convenience
Your vehicle will be equipped with video and electronic monitoring equipment that we will install for the 4 week period This equipment should not be in your way A data collection system including
Page 3 of 9
Version Date 13 June 2007 Participants Initials
STUDY Driving Behavior in New Vehicles STERLING IRB ID 2495 DATE OF IRB REVIEW 061307
up to 5 small digital video cameras video and data recording equipment and associated wiring will be installed in your vehicle to record data that will document your driving A camera that will record your eye glances will be placed securely inside the vehicle above your center rearview mirror Up to four video cameras will be placed securely on the exterior of the vehicle one under the vehicle just behind each front tire and one or two attached to the rear license plate mounting bracket All cameras will be attached to your vehicle using existing bolt holes or temporary non-damaging adhesive A GPS antenna will be magnetically attached to the roof of your vehicle A rugged box containing data recording equipment will be placed securely in the rear cargo area of the vehicle Interior vehicle trim panels may be removed temporarily to allow wires to be run beneath them Your vehiclersquos electrical system will be used to power data collection equipment while the vehicle is running but should not noticeably impact your vehiclersquos performance or battery voltage All installed equipment will be temporarily yet securely attached to your vehicle to prevent the equipment from moving in the event of a crash No permanent changes will be made to your vehicle In the unlikely event that your vehicle is damaged during equipment installation or removal you will be compensated for the reasonable cost of vehicle repair
NEW INFORMATION
No changes to procedures are anticipated to occur during this study However any new information developed during testing that may affect your willingness to participate will be provided to you
RISKS
During the test drives participants will be subject to all risks and uncertainties normally associated with driving on the TRC test track TRC access roads (two-lane rural roads) and in parking lots A number of controls have been put in place to reduce the risk of crashing Specifically test track traffic is generally light and travels in one direction only The test track access is controlled Data collection will be conducted only in daylight conditions In the event of bad weather your test drive may be delayed until conditions for driving improve The experimental vehicle is equipped with a kill switch which can be activated by the study staff to initiate full braking in an emergency situation For these reasons the risks are considered to be less than might be expected when performing comparable driving tasks while traveling on a controlled access freeway under light to moderate traffic conditions
While driving your vehicle on public roads you will be subject to all risks and uncertainties normally associated with your daily driving routine
You will not be asked to perform any unsafe acts There are no known physical or psychological risks associated with participation in this study beyond those described above
BENEFITS
There is no personal benefit to you from participating in this study You are not expected to receive direct benefit from your participation in this research study
The research study will provide data on driver behavior and performance that may be used by researchers to develop recommendations or standards for increasing vehicle and driving safety
Page 4 of 9
Version Date 13 June 2007 Participants Initials
STUDY Driving Behavior in New Vehicles STERLING IRB ID 2495 DATE OF IRB REVIEW 061307
STUDY Driving Behavior in New Vehicles STERLING IRB ID 2495 DATE OF IRB REVIEW 061307
ALTERNATIVES
This study is for research purposes only Your alternative is to not participate
CONDITIONS OF PARTICIPATION WITHDRAWAL AND TERMINATION
Participation in this research is voluntary By consenting to your participation you agree to allow instrumentation to be installed in and later removed from your vehicle You agree that you will drive the vehicle on a regular basis and that you will not let another person drive the vehicle during the 4-week monitored driving period You agree to permit a member of the research staff to access your vehicle approximately once per week to ensure that the in-vehicle data collection system has sufficient data storage capacity to record the entire 4 week period of monitored driving
During test drives on TRC property you agree to operate the research vehicle in accordance with all instructions provided by the study staff If you fail to follow instructions or behave in a dangerous manner you may be terminated from the study
You may withdraw your consent and discontinue your participation without penalty at any time If you decide to withdraw from the research study you should notify the study investigator In addition you agree to make your vehicle available for the removal of government-owned data recording equipment should you withdraw from the study early
COSTS TO YOU
Other than the time you contribute there will be no costs to you
COMPENSATION
You will receive $80000 if you complete the study If you do not complete the entire study you will be paid a pro-rated portion of this amount In addition you will be compensated 50 cents per mile (up to a maximum of $20000) for driving from your residence to our facility to attend the required initial and final meetings In the event that severe weather causes a delay in your initial or final test drive completion you will receive $2500 per hour for up to 2 hours spent at the research facility in excess of 3 hours Therefore you may receive up to a total of $110000 for participating in this study
COMPENSATION FOR RESEARCH RELATED INJURY
The contractor assisting with the conduct of this study TRC will maintain insurance to cover you in the event of a crash occurring in a government-owned research vehicle on TRC facilities This insurance covers injuries to yourself up to a limit of $1000000 You may contact your insurance company to check on additional coverage Coverage is also provided for injuries to others including the driver and any passengers of other vehicles involved in the crash as well as damages resulting from any crashes occurring during your participation in this study up to a $1000000 limit Except to the extent covered by such insurance policy neither the TRC nor NHTSA will be responsible for your actions during this study nor will they indemnify you or otherwise compensate you for any problems arising out of your actions or the normal risks associated with driving However you will not be liable for loss or damage to the vehicle instrumentation the government-owned research vehicle or other equipment during your Page 5 of 9
Version Date 13 June 2007 Participants Initials
participation unless there is gross negligence on your part
If you are injured in a crash while on TRC facilities emergency personnel will be dispatched to treat you The nearest hospital is about 15 miles away
If you are injured while driving your vehicle off-site during your participation in the study either you or your insurance company will be responsible for the costs associated with your medical treatment and your vehicle repairs
USE OF INFORMATION COLLECTED
In the course of this study the following data will be collected
bull Engineering data (such as the information recorded by the study vehicle sensors) bull Video data (such as the information recorded by the video cameras)
Information NHTSA may release
bull The engineering data collected and recorded in this study will include measures of driving behavior and performance These data will be analyzed along with data gathered from other participants to characterize driver behavior and performance NHTSA may publicly release the data in reports or other publications or media for scientific educational research or outreach purposes
bull The video data recorded in this study includes your video-recorded likeness Video data will be used to assess your driving performance NHTSA may publicly release video image data (in continuous video or still formats) either separately or in association with the appropriate engineering data for scientific educational research or outreach purposes
bull Information NHTSA may not release
bull Any release of engineering data or video data will not include release of your name However in the event of court action NHTSA may not be able to prevent release of your name or other personal identifying information NHTSA will not release any information collected regarding your health and driving record
QUESTIONS
Any questions you have about the study can be answered by Elizabeth N Mazzae MSE or the study staff by calling 1-800-262-8309 or 937-666-4511
If you have any questions regarding your rights as a research subject you may contact Sally P Green MD Chairman of Sterling Institutional Review Board 6300 Powers Ferry Road Suite 600shy351 Atlanta Georgia 30339 (mailing address) at telephone number 1-888-636-1062 (toll free)
Page 6 of 9
Version Date 13 June 2007 Participants Initials
STUDY Driving Behavior in New Vehicles STERLING IRB ID 2495 DATE OF IRB REVIEW 061307
INFORMED CONSENT
By signing the informed consent statement contained in this document you agree that participation is voluntary and you accept all terms of this agreement Also by signing the informed consent statement you agree to operate the study vehicle in accordance with all instructions provided by the study staff You may withdraw your consent and discontinue your participation in the study at any time without penalty
NHTSA will retain a signed copy of this Informed Consent form A copy of this form will also be provided to you
I do not give up any of my legal rights by signing this form
Informed Consent Statement
I certify that
bull I have a valid US driverrsquos license
bull I am the primary driver of the following vehicle 2007 Honda Odyssey
bull All personal and vehicle information as well as information regarding my normal daily driving habits provided by me to NHTSA andor the Transportation Research Center (TRC) employees associated with this study during the pre-participation phone interview and the introductory briefing was true and accurate to the best of my knowledge
bull I have been informed about the study in which I am about to participate
bull I have been told how much time and compensation is involved
bull I have been told that the purpose of this study is to examine how drivers learn about the features and functions of a new vehicle
bull I agree to operate the research vehicle in accordance with all instructions provided to me by the study staff
I have been told that
bull The study involves a period of electronically recorded observation of my driving my own vehicle over public and other roads and locations and that the risk of injury is identical to that which I would normally experience in my typical daily driving
bull The study involves a period of observation of my driving a government-owned vehicle on the TRC test courses and private roads and that the risk of injury due to a motor vehicle collision is less than in real world driving due to the closed environment and safety precautions which include an on-board experimenter ready to intervene if necessary
Page 7 of 9
Version Date 13 June 2007 Participants Initials
STUDY Driving Behavior in New Vehicles STERLING IRB ID 2495 DATE OF IRB REVIEW 061307
bull For scientific educational research or outreach purposes video images of my driving which will contain views of my face may be used or disclosed by NHTSA but my name and any health data or driving record information will not be used or disclosed by NHTSA
bull My participation is voluntary and I may refuse to participate or withdraw my consent and stop taking part at any time without penalty or loss of benefits to which I may be entitled
bull I have the right to ask questions at any time and I may contact the study investigator Elizabeth Mazzae or the study staff at 937-666-4511 or 800-262-8309 for information about the study and my rights
I have been given adequate time to read this informed consent form I hereby consent to take part in this research study
I voluntarily consent to participate (Printed Name of Participant)
Signature of Participant Date
Signature of Person Obtaining Consent Date
STUDY Driving Behavior in New Vehicles STERLING IRB ID 2495 DATE OF IRB REVIEW 061307
Page 8 of 9 Version Date 13 June 2007
INFORMATION DISCLOSURE
By signing the information disclosure statement below you agree that NHTSA and its authorized contractors and agents will have the right to use the engineering data and the video data collected during your participation for scientific educational research or outreach purposes This includes wide distribution or publication of your likeness in video or still photo format Neither NHTSA nor its authorized contractors or agents shall release your name You have been told that in the event of court action NHTSA may not be able to prevent release of names or other personal identifying information NHTSA will not release any information collected regarding your health and driving record either by questionnaire or medical examination Your permission to disclose this information will not expire on a specific date
Information Disclosure Statement
I grant permission to the National Highway Traffic Safety Administration (NHTSA) to use publish or otherwise distribute NHTSA engineering data and NHTSA video image data of my likeness (including continuous video and still photo formats) collected in this study either separately or in association with the appropriate engineering data for scientific educational research or outreach purposes I have been informed that such use may involve widespread distribution to the public and may involve distribution of my likeness in video or still photo formats but will not result in release of my name or other identifying personal information by NHTSA or its authorized contractors or agents I have been told that my permission to disclose this information will not expire on a specific date
Signature of Participant Date
STUDY Driving Behavior in New Vehicles STERLING IRB ID 2495 DATE OF IRB REVIEW 061307
Page 9 of 9 Version Date 13 June 2007
I acknowledge that the description of my vehiclersquos condition as noted on this form is accurate
Print Name Signature Date
113 Appendix C Vehicle Condition Check Sheet
Driving Study Vehicle Condition Check Sheet
This form is used to document the condition of your vehicle before and after data recording equipment is installed or removed from your vehicle by the research staff A member of the research staff will look over your vehicle and indicate on this form any damage observed Your signature at the bottom of this form will document your acknowledgement that the damage was pre-existing and not caused during the process of installation or removal of data recording equipment by the research staff In the unlikely event that scratches or other damage to your vehicle occur during the installation or removal of data recording equipment VRTC will pay for the cost of repairs performed at a manufacturerrsquos dealership service facility
Research Staff Using the drawing below indicate the locations of any damage using an ldquoSrdquo for scratches and ldquoDrdquo for dents) Fill in the VIN below
VIN _ _ _ _ _ _ _ _ _ _ _ _ _ _ _ _ _
91
114 Appendix D Participant Debrief Form
Debrief
ldquoWe are very sorry but we staged this event and deliberately caused an object to be behind you There were no real people in the way We did this because part of our research is to observe where people look while they are driving including when backing
Did you have any idea that this would happen ___ Yes ___ No
The reason we didnt tell you that this would happen ahead of time is that we wanted to observe your natural reaction I hope you will understand why we deliberately misled you Also I hope you can appreciate that the kind of event you just experienced is similar to real situations that occasionally occur in everyday driving
This type of surprise wont happen again And since we are testing at least through the end of the year we would be grateful if you did not discuss this surprise event experience with anyone until after our research is completed
We can now walk back to the conference room where we have some questionnaires for you to complete Then we can take care of payment information while we wait for your vehicle to get de-instrumentedrdquo
92
115 Appendix E Participant Questionnaire With Results (No System)
The tabulated questionnaire results for the 12 participants in the no video or sensor condition are incorporated below Counts show the number of participants who selected a particular response to a question Some questions required participants to choose one best response while other questions allowed the participants to choose multiple responses In order to better understand the results the response percentages for both types of questions are based upon the total number of participants (12) not the total count of responses If a participant didnrsquot respond to a question it is accounted for in the table
Q1 During your final test drive did you anticipate the obstacle behind the vehicle during the backing maneuver (circle one)
Response Count Percentage Yes 0 0 No 12 100 Donrsquot Know 0 0
Q2 Where do you usually look to determine whether the area behind the vehicle is clear when backing (Check all that apply)
Response Count Percentage At the side mirrors 9 75 At the center rearview mirror 9 75 Over my shoulder 11 9167
Q3 A backing aid system helps the driver back up by providing sounds lights or symbols when the vehicle is near an obstacle Your vehicle does not have a system like this Why not
(check boxes for all that apply) Response Count Percentage It never occurred to me to look for one when I was buying the vehicle 4 3333 It was not an option on my vehicle 5 4167 I thought it would be a nuisance or distraction 1 833 I wouldnrsquot trust the backing aid system to give me warnings when I need them 1 833 I donrsquot need a backing aid system because I have good backing skills 1 833 The backing aid was not worth the extra cost 1 833 The backing aid was only available with other options that I didnrsquot want 4 3333 I was not the person who purchased or made the decision to purchase this 0 0
Q4 If you purchased this same model vehicle again would you want a backing aid system (circle one)
Response Count Percentage Yes 4 3333 No 0 0 Donrsquot Know 8 6667
93
Q5 A rearview video camera system shows the driver the area behind the vehicle when you are backing on a screen inside the vehicle Your vehicle does not have a rearview video camera
system like this Why not (check boxes for all that apply) Response Count Percentage It never occurred to me to look for one when I was buying the vehicle 7 5833 The rearview camera was not an option on my vehicle 3 25 I thought the rearview camera would be a nuisance or distraction 0 0 I wouldnrsquot trust the rearview camera 0 0 I donrsquot need a rearview camera because I have good backing skills 1 833 The rearview camera was not worth the extra cost 2 1667 The rearview camera was only available with other options I didnrsquot want 4 3333 I was not the person who purchased or made the decision to purchase this vehicle
0 0
No Response (Blank) 1 833
Q6 If you purchased this same model vehicle again would you want a rearview video camera system (circle one)
Response Count Percentage Yes 4 3333 No 0 0 Donrsquot Know 8 6667
94
116 Appendix F Participant Questionnaire With Results (Rearview Video Only)
The tabulated questionnaire results for the 12 participants in the video only (no sensors) condition are incorporated below Counts show the number of participants who selected a particular response to a question Some questions required participants to choose one best response while other questions allowed the participants to choose multiple responses In order to better understand the results the response percentages for both types of questions are based upon the total number of participants (12) not the total count of responses If a participant didnrsquot respond to a question it is accounted for in the table Questions with open-ended responses or comments are categorized when possible
Q1 During your final test drive did you anticipate the obstacle behind the vehicle during the backing maneuver (circle one)
Response Count Percentage Yes 0 0 No 12 100 Donrsquot Know 0 0
Q2 Where do you usually look to determine whether the area behind the vehicle is clear when backing (Check all that apply)
Response Count Percentage At the side mirrors 8 6667 At the center rearview mirror 10 8333 Over my shoulder 11 9167 At the rearview video display 10 8333
Q3 A rearview video camera displays the area behind the vehicle when you are backing on a screen inside the vehicle Your vehicle is equipped with this type of system If you
purchased this same model vehicle again would you want a rearview camera (circle one) Response Count Percentage Yes 12 100 No 0 0 Donrsquot Know 0 0
Q4 How did you learn to use your vehiclersquos rearview camera (check all boxes that apply)
Response Count Percentage
Instructions from the dealership such as a video brochure or demonstration 6 50
Vehicle ownerrsquos manual 1 833 Help from a friend or relative 2 1667 Information on the Internet 0 0 On-road experience and practice (trial and error) 10 8333 I have not yet learned how to use the rearview camera 0 0
Q5 How easy was it to learn how to use your vehiclersquos rearview camera to judge the distance to
95
objects behind your vehicle (choose one) Response Count Percentage Very easy to learn 1 833 Somewhat easy to learn 7 5833 Somewhat difficult to learn 2 1667 Very difficult to learn 2 1667 I have not tried to learn how to use the rearview camera 0 0 I do not want to learn how to use the rearview camera 0 0
Q6 Was there anything especially difficult to learn about your vehiclersquos rearview camera (circle one)
Response Count Percentage Yes 5 4167 No 7 5833
If yes please explain Difficulty in judging distances using rearview camera 4 3333 Difficulty backing in straight line over long distances when using only the
rearview camera 1 833
Q7 Are you aware of any warnings or limitations about your vehiclersquos rearview camera (circle one)
Response Count Percentage Yes 2 1667 No 8 6667 Both lsquoYesrsquo and lsquoNorsquo Circled 2 1667
If yes please explain Learning curve judging distances (Yes response) 1 833 Distortion due to type of lens on camera (Yes response) 1 833 There are areas that can not be seen by camera (Yes and No response) 1 833 Not being able to see anything when backing toward the sun (Yes and No
response) 1 833
Q8 In the last two weeks did you ever use just the camera when backing without checking the mirrors or turning to look out the rear window (circle one)
Response Count Percentage Yes 2 1667 No 10 8333
96
Q9 Which of the following best describes how much you normally pay attention to the rearview camera when backing (choose one)
Response Count Percentage I rarely or never look at it 1 833 I usually just take a quick glance at the camera screen to determine if I can
back up 5 4167
I share my attention about equally between the rearview camera screen and my mirrors or glances over my shoulder
6 50
I pay attention to the rearview camera screen more than to my mirrors and glances over my shoulder
0 0
I usually back up the vehicle using only the camera I donrsquot feel that I need to check mirrors or look out the rear windows
0 0
Q10 Imagine that your vehicles rearview camera broke down How would your driving behavior change if you could not use your vehiclersquos rearview camera anymore (check boxes for all
that apply) Response Count Percentage I would back up much more slowly 4 3333 I would avoid parking in places where I would have to back up 0 0 I would not try to fit into tight parking spaces 3 25 I would rely more on my mirrors andor glances over my shoulder to see
whatrsquos behind my vehicle 8 6667
My driving behavior would not change 3 25 Other (specify) 2 1667
More apt to get out and check behind vehicle 1 833 Nothing specified (blank) 1 833
Q11 How well does your vehiclersquos rearview camera work in the following weather conditions (choose one response for each row)
Q11A Darkness Response Count Percentage Not at All 0 0 Poorly 0 0 Fairly Well 8 6667 Perfectly 3 25 Donrsquot Know 1 833
Q11B Fog Response Count Percentage Not at All 0 0 Poorly 3 25 Fairly Well 2 1667 Perfectly 0 0 Donrsquot Know 7 5833
97
Q11C Cold temperatures Response Count Percentage Not at All 0 0 Poorly 1 833 Fairly Well 1 833 Perfectly 6 50 Donrsquot Know 4 3333
Q11D Rain Response Count Percentage Not at All 0 0 Poorly 2 1667 Fairly Well 6 50 Perfectly 3 25 Donrsquot Know 1 833
Q11E Snow Response Count Percentage Not at All 0 0 Poorly 1 833 Fairly Well 3 25 Perfectly 1 833 Donrsquot Know 7 5833
Q11F Bright sun (1 participant gave 2 responses) Response Count Percentage Not at All 1 833 Poorly 3 25 Fairly Well 4 3333 Perfectly 5 4167 Donrsquot Know 0 0
98
Q11 Part 2 Are there any other conditions when your vehiclersquos rearview camera does not work well Explain
When camera is dirty 1 833 Video takes time to brighten up when car is put in reverse if screen is initially
dark due to navigation system being off 1 833
Q12 Overall how easy is the rearview camera to use when backing out of a driveway (circle one)
Response Count Percentage Very easy to use 7 5833 Somewhat easy to use 3 25 Somewhat difficult to use 2 1667 Very difficult to use 0 0 Donrsquot know 0 0
Q13 How has your usage of the rearview camera changed since you first got the vehicle (circle one) If it changed then why
Response Count Percentage I use it more now than I did in the beginning 4 3333 I use it less now than I did in the beginning 0 0 My usage has stayed about the same 8 6667
If you use it more now than in the beginning then why More comfortable after proven reliability 1 833 Gotten used to it over time 2 1667 Helps when backing out of a driveway on a hill 1 833
99
Q14 Please indicate how much you agree or disagree with the following statements (choose one response for each row)
Q14A The rearview camera screen is in a location where it is easy to see when I am backing Response Count Percentage Strongly Disagree 0 0 Disagree 0 0 Neutral 1 833 Agree 5 4167 Strongly Agree 6 50
Q14B I am more confident in my backing abilities when I use the rearview camera Response Count Percentage Strongly Disagree 1 833 Disagree 1 833 Neutral 2 1667 Agree 3 25 Strongly Agree 5 4167
Q14C I am more willing to park in small or difficult parking spaces when I use the rearview camera
Response Count Percentage Strongly Disagree 1 833 Disagree 2 1667 Neutral 2 1667 Agree 6 50 Strongly Agree 1 833
Q14D Itrsquos easy to tell how close I am to an obstacle by looking at the rearview camera display Response Count Percentage Strongly Disagree 2 1667 Disagree 1 833 Neutral 3 25 Agree 5 4167 Strongly Agree 1 833
Q14E The rearview camera does not show the entire area behind the vehicle that I need to see when backing in other words there is a blind spot
Response Count Percentage Strongly Disagree 1 833 Disagree 5 4167 Neutral 4 3333 Agree 1 833 Strongly Agree 1 833
Q14F The rearview camera display gets blurry or hard to see if I am moving
Response Count Percentage Strongly Disagree 1 833 Disagree 7 5833
100
Neutral 4 3333 Agree 0 0 Strongly Agree 0 0
Q14G The rearview camera gets dirty and makes obstacles hard to see Response Count Percentage Strongly Disagree 1 833 Disagree 6 50 Neutral 4 3333 Agree 0 0 Strongly Agree 1 833
Q14H Sun glare on the video display makes it hard for me to see objects or people Response Count Percentage Strongly Disagree 0 0 Disagree 4 3333 Neutral 4 3333 Agree 2 1667 Strongly Agree 2 1667
Q14I Itrsquos hard to distinguish something or someone who may be in a shadow area behind my vehicle (Image contrast level is poor in camera)
Response Count Percentage Strongly Disagree 0 0 Disagree 5 4167 Neutral 5 4167 Agree 2 1667 Strongly Agree 0 0 Q14J My risk of hitting somebody while backing is lower with the rearview camera than without
it Response Count Percentage Strongly Disagree 0 0 Disagree 2 1667 Neutral 0 0 Agree 3 25 Strongly Agree 7 5833
101
Q15 Suppose that the diagram below shows an overhead view of your vehicle and areas labeled ldquoArdquo ndash ldquoQrdquo Based on your experience please circle the letters for all areas where your rearview camera would show you obstacles such as a small child standing behind the
vehicle
Response Areas Count Percentage A 0 0 B 1 833 C 6 50 D 8 6667 E 9 75 F 11 9167 G 9 75 H 8 6667 I 6 50 J 3 25 K 0 0 L 2 1667 M 6 50 N 2 1667 O 7 5833 P 11 9167 Q 7 5833
Rear Bumper
Front Bumper
Distance in feet
2
3
4
5
6
7
8
9
10
11
0
1
12
13
14
15
16
17
20
18
19
A
B
C
D
E F G
H
I
K
J
L M N
O P Q
Q16 Have you ever unintentionally backed into something or had a ldquoclose callrdquo since you started driving this vehicle (circle one)
Response Count Percentage Yes 3 25 No 9 75
If yes were you using the camera at the time Please describe the situation Backing out of parking space at mall lady yelled when came too close 1 833 Backing out of driveway used camera early but hit garbage can when looking
over shoulder at the time of collision 1 833
Hit mailbox at end of driveway roads snow covered camera lens dirty from road grime 1 833
102
Q17 Does using the rearview camera create any new driving problems or safety concerns for you (circle one)
Response Count Percentage Yes 1 833 No 11 9167
If yes please explain Hard to focus on driving while looking at the camera 1 833
Q18 Overall does having the rearview camera make you a safer driver (circle one) Response Count Percentage Safer 8 6667 Neither more nor less safe 4 3333 Less safe 0 0
Q19 Since you have owned this vehicle have you driven another vehicle without a backing aid system or rearview video system and backed into something or had a ldquoclose callrdquo because
you expected the vehicle to give you a warning or display the obstacle on the video screen (circle one)
Response Count Percentage Yes 0 0 No 12 100
Q20 Is there anything about the rearview camera that you think should be improved (circle one) Response Count Percentage Yes 8 6667 No 4 3333
If yes please explain Thoughts on improvements include some kind of distance markers have the video come on quicker
create a wider angle of view eliminate sun glare improve the determinability of the distance to an object prevent disorientation improve field of view find a way for it to see better in the rain and make it so it would be easier to determine if one is going straight or not
Q21 In general do you believe that car manufacturers are doing enough to design their vehicles to accommodate an aging population (circle one)
Response Count Percentage Yes 10 8333 No 2 1667
If you answered ldquonordquo then what more do you believe could be done Explain Could be more universal symbols and more standard location of controls and
switches 1 833
No explanation (blank) 1 833
103
117 Appendix G Participant Questionnaire With Results (Rearview Video and Rear Parking Sensors)
The tabulated questionnaire results for the 13 participants in the video plus sensors condition are incorporated below Counts show the number of participants who selected a particular response to a question Some questions required participants to choose one best response while other questions allowed the participants to choose multiple responses In order to better understand the results the response percentages for both types of questions are based upon the total number of participants (13) not the total count of responses If a participant didnrsquot respond to a question it is accounted for in the table Questions with open-ended responses or comments are categorized when possible
Q1 During your final test drive did you anticipate the obstacle behind the vehicle during the backing maneuver (circle one)
Response Count Percentage Yes 0 0 No 13 100 Donrsquot Know 0 0
Q2 Where do you usually look to determine whether the area behind the vehicle is clear when backing (Check all that apply)
Response Count Percentage At the side mirrors 8 6154 At the center rearview mirror 10 7692 Over my shoulder 12 9231 At the rearview video display 8 6154 At the backing aid display 3 2308
Q3 A backing aid system helps the driver back up by providing sounds lights or symbols when the vehicle is near an obstacle Your vehicle is equipped with this type of system If you
purchased this same model vehicle again would you want the backing aid system (circle one)
Response Count Percentage Yes 12 9231 No 0 0 Donrsquot Know 1 769
Q4 A rearview video camera shows the driver the area behind the vehicle when you are backing on a screen inside the vehicle Your vehicle is equipped with this type of system If you
purchased this same model vehicle again would you want a rearview camera (circle one) Response Count Percentage Yes 10 7692 No 1 769 Donrsquot Know 2 1538
104
Q5 How did you learn to use your vehiclersquos backing aid system (check all that apply) Response Count Percentage Instructions from the dealership such as a video brochure or demonstration 4 3077 Vehicle ownerrsquos manual 3 2308 Help from a friend or relative 2 1538 Information on the Internet 1 769 On-road experience and practice (trial and error) 10 7692 I have not yet learned how to use the backing aid 0 0
Q6 How did you learn to use your vehiclersquos rearview camera (check all that apply) Response Count Percentage Instructions from the dealership such as a video brochure or demonstration 5 3846 Vehicle ownerrsquos manual 4 3077 Help from a friend or relative 1 769 Information on the Internet 0 0 On-road experience and practice (trial and error) 11 8462 I have not yet learned how to use the rearview camera 0 0
Q7 Are you aware of any warnings or limitations about your vehiclersquos rearview camera (circle one)
Response Count Percentage Yes 5 3846 No 8 6154
If yes please explain Distance appears distorted 1 769 System doesnrsquot come on immediately 1 769 Limited field of view 1 769 Objects are closer than they appear when looking at video 2 1538
Q8 How easy was it to learn how to use your vehiclersquos backing aid and rearview camera together to judge the distance to objects behind your vehicle (circle one)
Response Count Percentage Very easy to learn 3 2308 Somewhat easy to learn 6 4615 Somewhat difficult to learn 1 769 Very difficult to learn 0 0 I have not tried to learn how to use the backing aid 3 2308 I do not want to learn how to use the backing aid 1 769
105
Q9 Were there things that were especially difficult to learn about your vehiclersquos backing aid system andor rearview camera (circle one)
Response Count Percentage Yes 5 3846 No 8 6154
If yes please explain Tends to ignore sounds since a user cannot tell the difference when the sounds
go off when parking and backing 1 769
Find it hard to break a 25 year behavior or pattern 1 769
Find it hard to watch camera and more comfortable to look over the shoulder when backing up 1 769
Distance is not easy to judge 2 1538
Q10 Are you aware of any warnings or limitations about your vehiclersquos backing aid system (circle one)
Response Count Percentage Yes 3 2308 No 9 6923 No Response (Blank) 1 769
If yes please explain False alarms of the sensors (in environments such as sides of a garage drive-
thru windows and driveways having a slope) 3 2308
Q11 In the last two weeks did you ever use just the backing aid system andor rearview camera when backing without checking the mirrors or turning to look out the rear window (circle
one) Response Count Percentage Yes 2 1538 No 11 8462
Q12 Which of the following best describes how much you normally pay attention to the backing aid system display when backing (circle one)
Response Count Percentage I rarely or never look at it 5 3846 I usually just take a quick glance at the display to determine if I can back up 5 3846 I share my attention about equally between the display and my mirrors or
glances over my shoulder 3 2308
I pay attention to the rearview camera screen more than to my mirrors and glances over my shoulder 0 0
I usually back up the vehicle using only the camera I donrsquot feel that I need to check mirrors or look out the rear windows
0 0
106
Q13 Which of the following best describes how much you normally pay attention to the rearview camera when backing (circle one)
Response Count Percentage I rarely or never look at it 3 2308 I usually just take a quick glance at the camera screen to determine if I
can back up 5 3846
I share my attention about equally between the rearview camera screen and my mirrors or glances over my shoulder
5 3846
I pay attention to the rearview camera screen more than to my mirrors and glances over my shoulder
1 769
I usually back up the vehicle using only the camera I donrsquot feel that I need to check mirrors or look out the rear windows
0 0
Q14 Imagine that your vehiclersquos backing aid system and rearview camera broke down How would your driving behavior change if you could not use these systems anymore (check
boxes for all that apply) Response Count Percentage I would back up much more slowly 6 4615 I would avoid parking places where I would have to back up 1 769 I would not try to fit into tight parking spaces 1 769 I would rely more on my mirrors andor glances over my shoulder to see
what is behind my vehicle 8 6154
My driving behavior would not change 3 2308 Other (specify) 0 0
Q15 How well does your vehiclersquos backing aid system and rearview camera work in the following weather conditions (choose one response for each row)
Q15A Darkness Response Count Percentage Not at All 0 0 Poorly 3 2308 Fairly Well 5 3846 Perfectly 3 2308 Donrsquot Know 2 1538
107
Q15B Fog Response Count Percentage Not at All 0 0 Poorly 1 769 Fairly Well 4 3077 Perfectly 1 769 Donrsquot Know 7 5385
Q15C Cold temperatures Response Count Percentage Not at All 0 0 Poorly 0 0 Fairly Well 4 3077 Perfectly 5 3846 Donrsquot Know 4 3077
Q15D Rain Response Count Percentage Not at All 0 0 Poorly 2 1538 Fairly Well 10 7692 Perfectly 0 0 Donrsquot Know 1 769
Q15E Snow Response Count Percentage Not at All 0 0 Poorly 2 1538 Fairly Well 4 3077 Perfectly 1 769 Donrsquot Know 6 4615
108
Q15F Bright sun (1 participant commented instead of circling a response) Response Count Percentage Not at All 0 0 Poorly 2 1538 Fairly Well 5 3846 Perfectly 4 3077 Donrsquot Know 1 769 Comment hard to see image in the bright sun but the sensors still work under
such conditions 1 769
Q15 Part 2 Are there any other conditions where your vehiclersquos backing aid system or rearview camera does not work well Explain
When camera lens is dirty 1 769 Glare on the screen 1 769 See above comment in lsquoBright sunrsquo section (Q15F)
Q16 Please rate how well the backing aid and rearview camera would assist you to avoid colliding under the following circumstances (choose one response for each row)
Q16A You are slowly backing out of a driveway into the street There is a car that you canrsquot see approaching on the street as you begin to back into its path
Response Count Percentage Not at All 1 769 Poorly 7 5385 Fairly Well 3 2308 Perfectly 1 769 Donrsquot Know 1 769
Q16B You are backing quickly down a long driveway going about 10 mph There is a bicycle behind the vehicle that you didnrsquot see
Response Count Percentage Not at All 0 0 Poorly 2 1538 Fairly Well 8 6154 Perfectly 2 1538 Donrsquot Know 1 769
109
Q16C You begin to back out of a garage and there is a child immediately under the rear bumper Response Count Percentage Not at All 4 3077 Poorly 4 3077 Fairly Well 5 3846 Perfectly 1 769 Donrsquot Know 0 0
Q16D You are slowly backing out of a parking space and there is a pedestrian standing 10 feet behind your rear bumper
Response Count Percentage Not at All 0 0 Poorly 3 2308 Fairly Well 5 3846 Perfectly 5 3846 Donrsquot Know 0 0
Q16E You are backing up to a narrow sign post Response Count Percentage Not at All 0 0 Poorly 2 1538 Fairly Well 5 3846 Perfectly 4 3077 Donrsquot Know 2 1538 Q16F You are backing into a parallel parking space The space is tight and you have to back very
close to the car behind you Response Count Percentage Not at All 0 0 Poorly 3 2308 Fairly Well 7 5385 Perfectly 3 2308 Donrsquot Know 0 0
Q17 Overall how easy are the backing aid system and rearview camera to use when backing out of a driveway (circle one)
Response Count Percentage Very easy to use 5 3846 Somewhat easy to use 5 3846 Somewhat difficult to use 0 0 Very difficult to use 3 2308 Donrsquot Know 0 0
110
Q18 Your vehiclersquos backing aid system has both lightssymbols sounds and a rearview camera display Which do you rely on more (circle one)
Response Count Percentage I rely on the lightssymbols more than the sounds 0 0 I rely on the sounds more than the lightssymbols 3 2308 I rely on the rearview video display more than the lightssymbols or sounds 2 1538 I rely on the sounds more than the rearview video display 2 1538 I rely on the lightssymbols and sounds about equally 1 769 I rely on the rearview video display and sounds about equally 3 2308 I rely on the rearview video display and lightssymbols and sounds about
equally 0 0
I donrsquot rely on the systems I just use my mirrors or look over my shoulder 5 3846
Q19 Have you ever unintentionally backed into something or had a ldquoclose callrdquo since you started driving this vehicle (circle one)
Response Count Percentage Yes 4 3077 No 9 6923
If yes please describe the situation Almost hit light post when backing into parking space 1 769 Situation with toy balls behind the back tires 1 769 Close calls with trash cans in the driveway 1 769 Got too close to another vehicle when backing into parking spot and had to
readjust 1 769
Q20 Since you have owned this vehicle have you driven another vehicle without a backing aid system or rearview video system and backed into something or had a ldquoclose callrdquo because
you expected the vehicle to give you a warning or display the obstacle on the video screen (circle one)
Response Count Percentage Yes 0 0 No 13 100
111
Q21 Have you ever received an unexpected warning when backing because you didnrsquot know what was behind your vehicle (circle one)
Response Count Percentage Yes (one person forgot to respond but answered subsequent questions as if
lsquoyesrsquo was the response) 9 6923
No 4 3077 If yes then how did you react the last time this happened
I got out of the vehicle and checked for obstacles 5 3846 I stopped immediately and checked my mirrors andor looked out the rear
window before continuing to back up 3 2308
I slowed down and looked for the obstacle before stopping 0 0 I ignored the warning because I was sure that no obstacle was behind me 1 769
If yes what was the reason for the last unexpected warning It was nothing that I could identify 1 769 It was another vehicle 1 769 It was a person 1 769 It was a pole post or tree 1 769 It was a curb 1 769 It was some other object on the ground 4 3077
Q22 Does using the backing aid system and rearview camera create any new driving problems or safety concerns for you (circle one)
Response Count Percentage Yes 5 3846 No 8 6154
If yes please explain More sounds causes more checking 1 769 It messes up the rear distance concept 1 769 Relying more on the camera and not the side mirrors or over the shoulder 1 769 Sounds are distracting and overly cautious (especially when parallel parking) 1 769 Would be harder to back up if one totally relied on the backing aid system and
rearview camera 1 769
112
Q23 Please indicate how much you agree or disagree with the following statements (choose one response for each row)
Q23A Itrsquos easy to hear the sounds made by the backing aid system Response Count Percentage Strongly Disagree 1 769 Disagree 2 1538 Neutral 0 0 Agree 0 0 Strongly Agree 10 7692 Not Applicable 0 0
Q23B Itrsquos easy to see the lightssymbols on the backing aid system Response Count Percentage Strongly Disagree 1 769 Disagree 3 2308 Neutral 4 3077 Agree 3 2308 Strongly Agree 0 0 Not Applicable 2 1538
Q23C Itrsquos easy to see rear obstacles in the rearview video system display Response Count Percentage Strongly Disagree 1 769 Disagree 0 0 Neutral 2 1538 Agree 10 7692 Strongly Agree 0 0 Not Applicable 0 0
Q23D When I use the backing aid I use my mirrors less often than I would if I did not have the backing aid
Response Count Percentage Strongly Disagree 4 3077 Disagree 5 3846 Neutral 0 0 Agree 3 2308 Strongly Agree 1 769 Not Applicable 0 0 Q23E When I use the backing aid I look over my shoulder less often than I would if I did not have
the backing aid Response Count Percentage Strongly Disagree 4 3077 Disagree 3 2308 Neutral 1 769 Agree 4 3077 Strongly Agree 1 769 Not Applicable 0 0
113
Q23F I am more confident in my ability to detect pedestrians when I use the backing aid Response Count Percentage Strongly Disagree 0 0 Disagree 2 1538 Neutral 4 3077 Agree 6 4615 Strongly Agree 1 769 Not Applicable 0 0
Q23G I am more willing to park in small or difficult parking spaces when I use the backing aid Response Count Percentage Strongly Disagree 2 1538 Disagree 4 3077 Neutral 5 3846 Agree 2 1538 Strongly Agree 0 0 Not Applicable 0 0
Q23H The backing aid gives me a good idea of my distance from an obstacle Response Count Percentage Strongly Disagree 2 1538 Disagree 2 1538 Neutral 1 769 Agree 8 6154 Strongly Agree 0 0 Not Applicable 0 0
114
Q23I The backing aid gives alerts with enough time to avoid hitting an obstacle Response Count Percentage Strongly Disagree 1 769 Disagree 1 769 Neutral 3 2308 Agree 7 5385 Strongly Agree 1 769 Not Applicable 0 0 Q23J The backing aid gives too many false warnings when I am not in danger of hitting anything Response Count Percentage Strongly Disagree 0 0 Disagree 6 4615 Neutral 1 769 Agree 5 3846 Strongly Agree 1 769 Not Applicable 0 0
Q23K The backing aid fails to warn me about an obstacle when it should have Response Count Percentage Strongly Disagree 1 769 Disagree 8 6154 Neutral 4 3077 Agree 0 0 Strongly Agree 0 0 Not Applicable 0 0
115
Q24 Please indicate how much you agree or disagree with the following statements (choose one Q24A The rearview camera screen is in a location where it is easy to see when I am backing
Response Count Percentage Strongly Disagree 2 1538 Disagree 0 0 Neutral 2 1538 Agree 6 4615 Strongly Agree 3 2308
Q24B I am more confident in my backing abilities when I use the rearview camera Response Count Percentage Strongly Disagree 3 2308 Disagree 1 769 Neutral 1 769 Agree 4 3077 Strongly Agree 4 3077
Q24C I am more willing to park in small or difficult parking spaces when I use the rearview camera
Response Count Percentage Strongly Disagree 3 2308 Disagree 3 2308 Neutral 3 2308 Agree 4 3077 Strongly Agree 0 0
Q24D Itrsquos easy to tell how close I am to an obstacle by looking at the rearview camera display Response Count Percentage Strongly Disagree 4 3077 Disagree 2 1538 Neutral 3 2308 Agree 4 3077 Strongly Agree 0 0
116
Q24E The rearview camera does not show the entire area behind the vehicle that I need to see when backing in other words there is a blind spot
Response Count Percentage Strongly Disagree 0 0 Disagree 5 3846 Neutral 1 769 Agree 6 4615 Strongly Agree 1 769
Q24F The rearview camera display gets blurry or hard to see if I am moving Response Count Percentage Strongly Disagree 2 1538 Disagree 6 4615 Neutral 4 3077 Agree 1 769 Strongly Agree 0 0
Q24G The rearview camera gets dirty and makes obstacles hard to see Response Count Percentage Strongly Disagree 2 1538 Disagree 6 4615 Neutral 2 1538 Agree 2 1538 Strongly Agree 1 769
Q24H Sun glare on the video display makes it hard for me to see objects or people Response Count Percentage Strongly Disagree 0 0 Disagree 2 1538 Neutral 2 1538 Agree 6 4615 Strongly Agree 3 2308
Q24I Itrsquos hard to distinguish something or someone who may be in a shadow area behind my vehicle (Image contrast level is poor in camera)
Response Count Percentage Strongly Disagree 0 0 Disagree 3 2308 Neutral 6 4615 Agree 3 2308 Strongly Agree 1 769
Q24J My risk of hitting somebody while backing is lower with the rearview camera than without it Response Count Percentage Strongly Disagree 0 0 Disagree 1 769 Neutral 3 2308 Agree 6 4615 Strongly Agree 3 2308
117
Q25 Suppose that the diagram below shows an overhead view of your vehicle and areas labeled ldquoArdquo ndash ldquoQrdquo Based on your experience please circle the letters for all areas where your rearview camera would show you obstacles such as a small child standing behind the
vehicle
Response Areas Count Percentage A 1 769 B 5 3846 C 9 6923 D 12 9231 E 11 8462 F 12 9231 G 11 8462 H 12 9231 I 9 6923 J 5 3846 K 1 769 L 5 3846 M 9 6923 N 5 3846 O 10 7692 P 11 8462 Q 10 7692
Rear Bumper
Front Bumper
Distance in feet
2
3
4
5
6
7
8
9
10
11
0
1
12
13
14
15
16
17
20
18
19
A
B
C
D
E F G
H
I
K
J
L M N
O P Q
118
Count
0 1 2 Bumper 2 1 0
0 1 7 7 1 0 7 8 7
0 1 7 12 12 12 7 1 0
0 1 5 9 5 1 0
0 1 4 5 4 1 0
0 1 4 5 4 1 0
0 1 3 3 3 1 0
0 0 1 2 1 0 0
0 0 1 1 1 0 0
0 0 1 1 1 0 0
0 0 1 1 1 0 0
Percentages
0 77 154 Bumper 154 77 0
0 77 538 538 77 0 538 615 538
0 77 538 923 923 923 538 77 0
0 77 385 692 385 77 0
0 77 308 385 308 77 0
0 77 308 385 308 77 0
0 77 231 231 231 77 0
0 0 77 154 77 0 0
0 0 77 77 77 0 0
0 0 77 77 77 0 0
0 0 77 77 77 0 0
119
Q26 Suppose that the diagram below shows an overhead view of your vehicle Based on your experience write an ldquoXrdquo in all rectangles where you think your backing aid system would
detect a small standing child and give you a warning
Q27 How has your reliance on the backing aid and rearview video systems changed since you first got the vehicle (circle one) If it changed then why
Response Count Percentage I rely on it more now than I did in the beginning 8 6154 I rely on it less now than I did in the beginning 1 769 My reliance has stayed about the same 4 3077
If you rely on it more now than in the beginning then why It makes a noise 1 769 I rely on the camera due to blind spots when looking over the shoulder 1 769 Gotten used to having it ndash use the camera more and ignore the sensors more 1 769 After learning about the distance over time 1 769 No Response (Blank) 4 3077
If you rely on it less now than in the beginning then why No Response (Blank) 1 769
Q28 Overall does having the backing aid make you a safer driver (circle one) Response Count Percentage Yes safer 7 5385 Neither more nor less safe 6 4615 No less safe 0 0
120
Q29 Does using the backing aid andor rearview video system create any new driving problems or safety concerns for you (circle one)
Response Count Percentage Yes 5 3846 No 8 6154
If yes please explain They create a need to look closer 1 769 The beep is distracting 1 769 There are false alarms with backing aid like at a drive-thru window 1 769 One relies on the sensors to the point of not checking the mirrors 1 769 If one uses it and looks over the shoulder then one is more likely to run into
something 1 769
Q30 Is there anything about the way that the backing aid andor rearview video system works that you think should be improved (circle one)
Response Count Percentage Yes 8 6154 No 5 3846
If yes please explain A different sound for backing parking would be helpful ndash become immune to
warning sound when parking 1 769
Need different beeping sounds for the side versus the rear 1 769 Consider more sensors and no camera 1 769 Provide a better judge of distance 1 769 Therersquos a time lapse when the video comes on 1 769 Directly behind the vehicle is undetected by the backing aid 1 769 Have a way to temporarily turn off the sensor 1 769 Have it behind the person so it can be seen when one is turned around to back
up 1 769
Q31 In general do you believe that car manufacturers are doing enough to design vehicles to accommodate an aging population (circle one)
Response Count Percentage Yes 11 8462 No 2 1538
If you answered ldquonordquo then what more do you believe could be done It would be good to have seats that turned toward the door and that a lift device
might also be good 1 769
There is always more that can be done 1 769
121
118 Appendix H Details of Mechanisms Used in Presenting the Obstacle Event
The obstacle event involved a two-dimensional life-size image of a child popping up behind the test vehicle while the participant was backing out of a garage at the end of the second test drive The image consisted of a full-color photo a 36-inch-tall toddler The photo was printed on a corrugated plastic substrate (see Figure 16) The 36-inchshyheight corresponded approximately to the height of a 25 year old child
A 6 inch by 12 inch piece of sheet metal was attached to the back side of the photo sheet using tape The plate was positioned on the lower portion of the cutout so the edge extended slightly outside of the childrsquos right leg A 6-inch length of metal hinge was attached with screws to the bottom of the metal plate to form the fulcrum Two holes were drilled though the plate and child cutout for attachment of a spring and tether Figure 38 shows the locations of the spring eye bolt and tether holes
Figure 47 Backing Plate for Cutout
122
The dimensions of the spring were 516 inch x 16-18 inches x 0047 inch (Century Spring Corporation part number CS-3) The spring was attached to an eye bolt using a thick zip tie Additional cable ties were fastened to the remaining eye bolt space in order the keep the spring attachment point near the middle part of the bolt eye
The tether was a two-piece construction The first piece was a loop made from a 25 inch long piece of 50 pound test monofilament line and a wire cable stop The cable stop was crimped to the two ends of the 50 pound test line to create a loop 1rdquo in length when the loop was pinched lengthwise The loop was then pushed through the tether hole from the backing plate side until the cable stop contacted the plate and the loop protruded from front side of the child cutout
The second piece of the tether was constructed of a length of 17 pound test monofilament with a size 5 barrel swivel attached to each end The barrel swivels had clips that allow for quick connectdisconnect The length of this 17 pound test tether piece measured 1325rdquo from tip to tip of the barrel swivels One swivel clip was attached to the 50 pound test loop while the other clip was eventually attached to a pavement anchor
At this point in construction the entire back side of this assembly was coated with gray textured spray paint in order to allow the cutout to blend in with asphalt pavement when laid flat prior to it being triggered into an upright position Figure 39 shows the back side of a completed assembly
Figure 48 Complete Cutout Assembly
Attachment to Pavement
The assembly was placed face down and the hinge was attached to the pavement using two lag bolts (the insert part of the lags remain permanently fixed in the pavement) A third lag was inserted into the pavement 17 inches back from the hinge to accept a
123
316rdquo eye bolt that was used to anchor the spring Two small sheet metal type eye screws were screwed directly into the pavement on either side of the cutout The screw on the cutoutrsquos left side was used as the anchor point for the tether The position of the eye was not critical as long as it did not interfere with the cutout laying flat and the tether allows the cutout to stand fully upright when extended The screw on the cutoutrsquos right side was used to hold a cotter pin in place The cotter pin held the assembly down with the spring stretched taught The ends of the cotter pin were bent to prevent it from hanging up on pavement irregularities and to accommodate for the thickness of the assembly Figure 40 shows the anchor points used
Figure 49 Anchor Points
The assembly raised to an upright position when the cotter pin was pulled due to spring tension and the tether stop The cotter pin was attached via a 50 pound test braided low-stretch line to a Bimba model 091-RP air piston The piston was connected to a Skinner Electric Valves 12V 1000 psi valve and an air source The piston and valve were mounted to a metal plate that was held in place with a 50 pound weight placed on top of the plate (see Figure 41)
124
Figure 50 Piston and Electric Air Valve Assembly
A 12V battery was used to activate the valve which in turn makes the piston move its full stroke thus pulling the cotter pin An NPD7050 field effect transistor was used to turn on the 12V batteryelectric valve circuit This transistor was turned on from a signal received from a garage door beam sensor (wwwnorthwestern1combeam_detectorhtm)
The garage door sensor was installed on the garage floor behind the front wheel stop mat so that the vehiclersquos front wheels break the garage door sensor beam when backing up The breaking of the beam triggered the NPD7050 transistor The garage door sensor had its own power supply which was connected to a hidden toggle switch Thus the beam could be turned off until the garage door was open and any technicians were clear of the beam eliminating any false triggers by persons walking through the beam before the event began
125
DOT HS 811 024September 2008