on does quality of work life really matters for the
TRANSCRIPT
SRJIS/BIMONTHLY / DR. SUJAY MADHUKAR KHADILKAR (2853-2877)
JAN-FEBRUARY, 2015. VOL-III/XVI www.srjis.com Page 2853
ON DOES QUALITY OF WORK LIFE REALLY MATTERS FOR THE
ORGANIZATIONS? - THE EXPLORATORY STUDY
Sujay Madhukar Khadilkar, Ph. D.
(B.E (Elect), M.B.A.) Asso. Professor, KIT’s IMER, Kolhapur (MAH )
1.1 Introduction
The research was conducted in ELCOM INTERNATIONAL PRIVATE LIMITED.
Theoretical knowledge is insufficient to cope up with the modern functioning of the
companies. So in order to gain knowledge about competencies of employees from ELCOM
INTERNATIONAL PRIVATE LIMITED on the paper “A research paper ON significance
of competencies for organization”.
1.2 Significance of the Study:
Quality of work life covers various aspects under the general umbrella of supportive
organizational behavior. Thus, the QWL should be broad in its scope. It must be evaluate the
attitude of the employees towards the personnel policies. The research will be helpful in
understanding the current position of the respective company. And provide some strategies to
extent the employee’s satisfaction with little modification which is based on the internal
facilities of the company.
This research can be further used to evaluate the facilities provided by the management
towards the employees. This study also helps in manipulating the basic exception of the
employees.
1.3 Objectives of the Study:
To study the quality of work life of (QWL) employees in ELCOM INTERNATIONAL
PRIVATE LIMITED.
To find out how quality of work life leads to high satisfaction.
To know the existing working conditions, Industrial Health and safety help to improve
the quality of work life.
SRJIS/BIMONTHLY / DR. SUJAY MADHUKAR KHADILKAR (2853-2877)
JAN-FEBRUARY, 2015. VOL-III/XVI www.srjis.com Page 2854
To study the workers participation in ELCOM INTERNATIONAL PRIVATE
LIMITED
To examine how the training and development programmes helps to improve the quality
of work life.
To know how the various welfare activities and other benefits helps to bring a better
quality of work life.
1.5 Review of Literature
Definition
Quality of work life means “the degree top which members of a work organization are able to
satisfy important personal needs through their experience in the organization”
QWL could be defined as “the Quality of the relationship between the man and task.
Meaning
Quality of work life has gained deserved prominence in the Organizational Behavior as an
indicator of the overall of human experience in the work place. It expresses a special way of
thinking about people their work, and the organizational in which careers are fulfilled.
QWL refers to the relationship between a worker and his environment, adding the human
dimension to the technical and economic dimensions within which the work is normally
viewed and designed. QWL focus on the problem of creating a human working environment
where employees work co – operatively and achieve results collectively. It also includes.
The programme seeks to promote human dignity and growth
Employees work collaboratively They determine work change participate
The programmes assume compatibility of people and organization
QWL refers to the level of satisfaction, motivation, involvement and commitment individuals
experience with respect to their line at work. QWL is the degree of excellence brought about
work and working conditions which contribute to the overall satisfaction and performance
primarily at the individual level but finally at the organizational level.
Concept
QWL is a prescriptive concept, it attempts to design work environments so as to maximize
concern for human welfare. QWL acts in two dimensions.
Goal
Process
QWL acts as goal by
Creation of more involving
SRJIS/BIMONTHLY / DR. SUJAY MADHUKAR KHADILKAR (2853-2877)
JAN-FEBRUARY, 2015. VOL-III/XVI www.srjis.com Page 2855
satisfying and effective jobs
Work environment for people at all levels of the organization
QWL acts as process by
Make efforts to realize this goal through active participation
The whole essence of QWL may be stated thus, the QWL is co – operative rather than
authoritarian; evolutionary and open rather static and rigid; informal rather than mechanistic;
mutual respect and trust than hatred against each other.
Objectives of QWL
The major two main objectives for the QWL are
Improve employees satisfaction strengthen workplace learning, and
Better manage on – going chance and transition
stated thus.
1.7 Sampling Procedure
Sampling is a method of selecting a few items from a particular group to be obtaining
relevant data which help in drawing conclusions regarding the entire group i.e. population or
universe.
Sampling Size:
The sample size selected for the study was 100 employees of “ELCOM INTERNATIONAL
PRIVATE LIMITED”.
Analysis And Interpretation:
The data collected are classified, analysed and calculated. The statistical tools are
applied for the analysis of the data. The tools used are Percentage analysis, weighted average
method and Chi – square test.
1. Percentage analysis:
Percentage refers is a special kind of ratio. Percentages are used in making comparison
between two or more series of data. They are used to describe relationship. More over
percentages can also be use to compare the relative terms of the distribution of two or more
series of data.
Formula:
Percentage of Respondents = No. of respondents * 100
Total no. of respondents
2. Weighted Average Method:
SRJIS/BIMONTHLY / DR. SUJAY MADHUKAR KHADILKAR (2853-2877)
JAN-FEBRUARY, 2015. VOL-III/XVI www.srjis.com Page 2856
Weighted Average Method was applied to find out the desirable policies & practices that are
adopted by the company by ranking certain criteria's in some of the important functional
areas of H.R.
Formula:
Weighted average method = (X1W1 + X2W2 + X3W3 +……..)
n
3. Chi - square test:
Chi - Square is a non-parametric technique, most commonly used fay a research to test the
analysis. The main objective of chi-square is to determine whether significant difference exist
among group of data.
Formula:
Chi - Square test = (Oi - Ei) 2
/ Ei
Oi = Observed frequency
Ei = Expected frequency
Degree of freedom = n – 1.
Table No. 2 Experience of the respondents
Experience No. of Respondents Percentage
Below 1 year - -
1 – 5 years 19 19
5 – 10 years 24 24
Above 10 years 57 57
Total 100 100
INFERENCE:
The above table shows that majority of 57% of the respondents are with an experience of
more than 10 years and 24% are 5 to 10 years of experience. 19% of the respondents are
with 1-5 years experience. No respondent is less experienced. The study reveals that all the
respondents are well experienced, so they are well capable of assessing the quality of their
work life.
SRJIS/BIMONTHLY / DR. SUJAY MADHUKAR KHADILKAR (2853-2877)
JAN-FEBRUARY, 2015. VOL-III/XVI www.srjis.com Page 2857
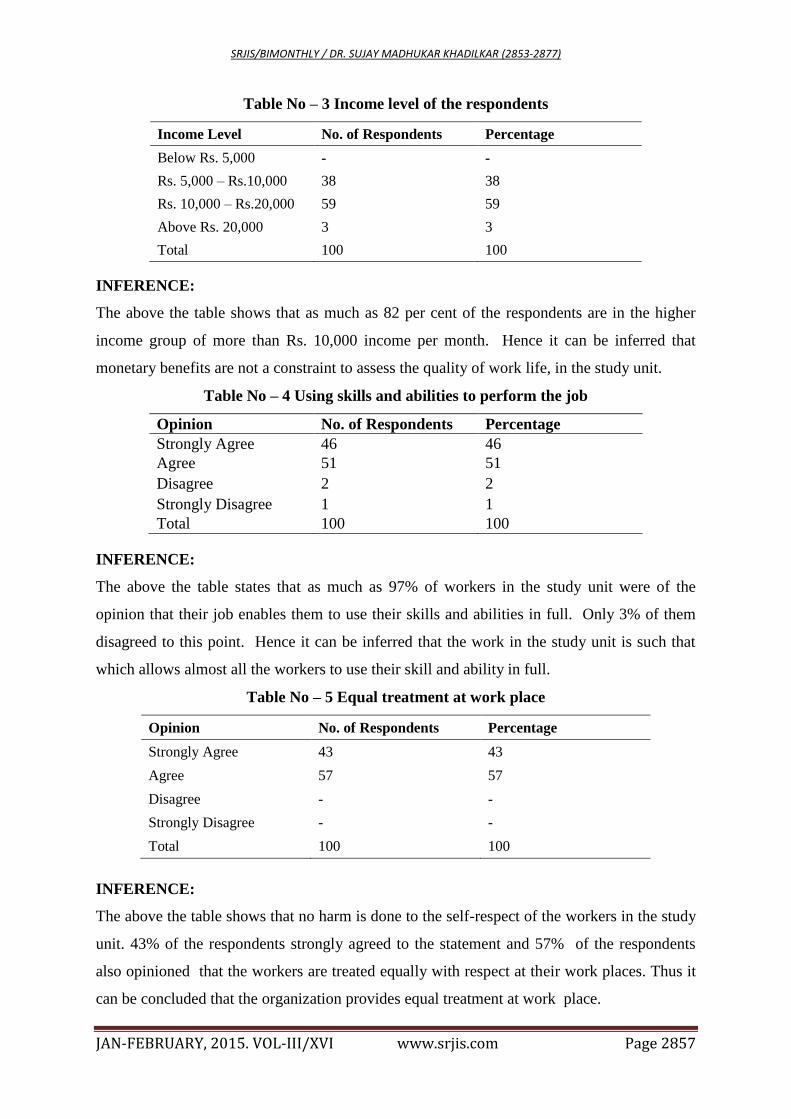
Table No – 3 Income level of the respondents
Income Level No. of Respondents Percentage
Below Rs. 5,000 - -
Rs. 5,000 – Rs.10,000 38 38
Rs. 10,000 – Rs.20,000 59 59
Above Rs. 20,000 3 3
Total 100 100
INFERENCE:
The above the table shows that as much as 82 per cent of the respondents are in the higher
income group of more than Rs. 10,000 income per month. Hence it can be inferred that
monetary benefits are not a constraint to assess the quality of work life, in the study unit.
Table No – 4 Using skills and abilities to perform the job
Opinion No. of Respondents Percentage
Strongly Agree 46 46
Agree 51 51
Disagree 2 2
Strongly Disagree 1 1
Total 100 100
INFERENCE:
The above the table states that as much as 97% of workers in the study unit were of the
opinion that their job enables them to use their skills and abilities in full. Only 3% of them
disagreed to this point. Hence it can be inferred that the work in the study unit is such that
which allows almost all the workers to use their skill and ability in full.
Table No – 5 Equal treatment at work place
Opinion No. of Respondents Percentage
Strongly Agree 43 43
Agree 57 57
Disagree - -
Strongly Disagree - -
Total 100 100
INFERENCE:
The above the table shows that no harm is done to the self-respect of the workers in the study
unit. 43% of the respondents strongly agreed to the statement and 57% of the respondents
also opinioned that the workers are treated equally with respect at their work places. Thus it
can be concluded that the organization provides equal treatment at work place.
SRJIS/BIMONTHLY / DR. SUJAY MADHUKAR KHADILKAR (2853-2877)
JAN-FEBRUARY, 2015. VOL-III/XVI www.srjis.com Page 2858
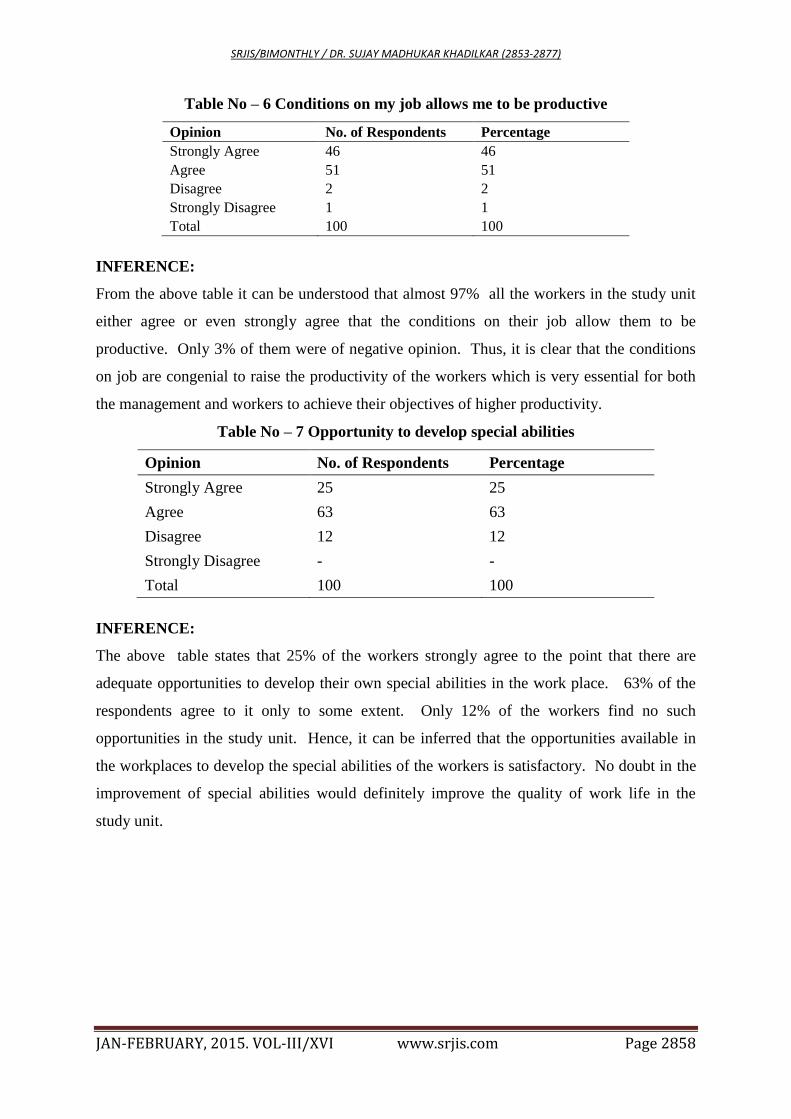
Table No – 6 Conditions on my job allows me to be productive
Opinion No. of Respondents Percentage
Strongly Agree 46 46
Agree 51 51
Disagree 2 2
Strongly Disagree 1 1
Total 100 100
INFERENCE:
From the above table it can be understood that almost 97% all the workers in the study unit
either agree or even strongly agree that the conditions on their job allow them to be
productive. Only 3% of them were of negative opinion. Thus, it is clear that the conditions
on job are congenial to raise the productivity of the workers which is very essential for both
the management and workers to achieve their objectives of higher productivity.
Table No – 7 Opportunity to develop special abilities
Opinion No. of Respondents Percentage
Strongly Agree 25 25
Agree 63 63
Disagree 12 12
Strongly Disagree - -
Total 100 100
INFERENCE:
The above table states that 25% of the workers strongly agree to the point that there are
adequate opportunities to develop their own special abilities in the work place. 63% of the
respondents agree to it only to some extent. Only 12% of the workers find no such
opportunities in the study unit. Hence, it can be inferred that the opportunities available in
the workplaces to develop the special abilities of the workers is satisfactory. No doubt in the
improvement of special abilities would definitely improve the quality of work life in the
study unit.
SRJIS/BIMONTHLY / DR. SUJAY MADHUKAR KHADILKAR (2853-2877)
JAN-FEBRUARY, 2015. VOL-III/XVI www.srjis.com Page 2859
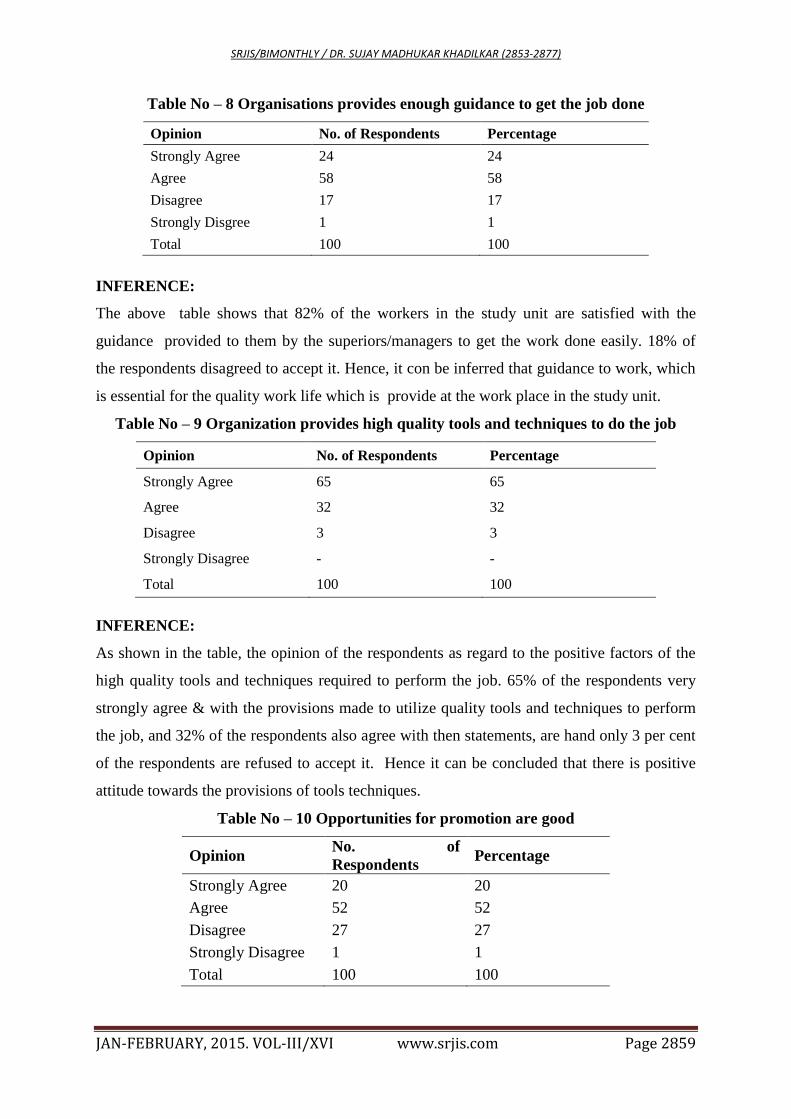
Table No – 8 Organisations provides enough guidance to get the job done
Opinion No. of Respondents Percentage
Strongly Agree 24 24
Agree 58 58
Disagree 17 17
Strongly Disgree 1 1
Total 100 100
INFERENCE:
The above table shows that 82% of the workers in the study unit are satisfied with the
guidance provided to them by the superiors/managers to get the work done easily. 18% of
the respondents disagreed to accept it. Hence, it con be inferred that guidance to work, which
is essential for the quality work life which is provide at the work place in the study unit.
Table No – 9 Organization provides high quality tools and techniques to do the job
Opinion No. of Respondents Percentage
Strongly Agree 65 65
Agree 32 32
Disagree 3 3
Strongly Disagree - -
Total 100 100
INFERENCE:
As shown in the table, the opinion of the respondents as regard to the positive factors of the
high quality tools and techniques required to perform the job. 65% of the respondents very
strongly agree & with the provisions made to utilize quality tools and techniques to perform
the job, and 32% of the respondents also agree with then statements, are hand only 3 per cent
of the respondents are refused to accept it. Hence it can be concluded that there is positive
attitude towards the provisions of tools techniques.
Table No – 10 Opportunities for promotion are good
Opinion No. of
Respondents Percentage
Strongly Agree 20 20
Agree 52 52
Disagree 27 27
Strongly Disagree 1 1
Total 100 100
SRJIS/BIMONTHLY / DR. SUJAY MADHUKAR KHADILKAR (2853-2877)
JAN-FEBRUARY, 2015. VOL-III/XVI www.srjis.com Page 2860
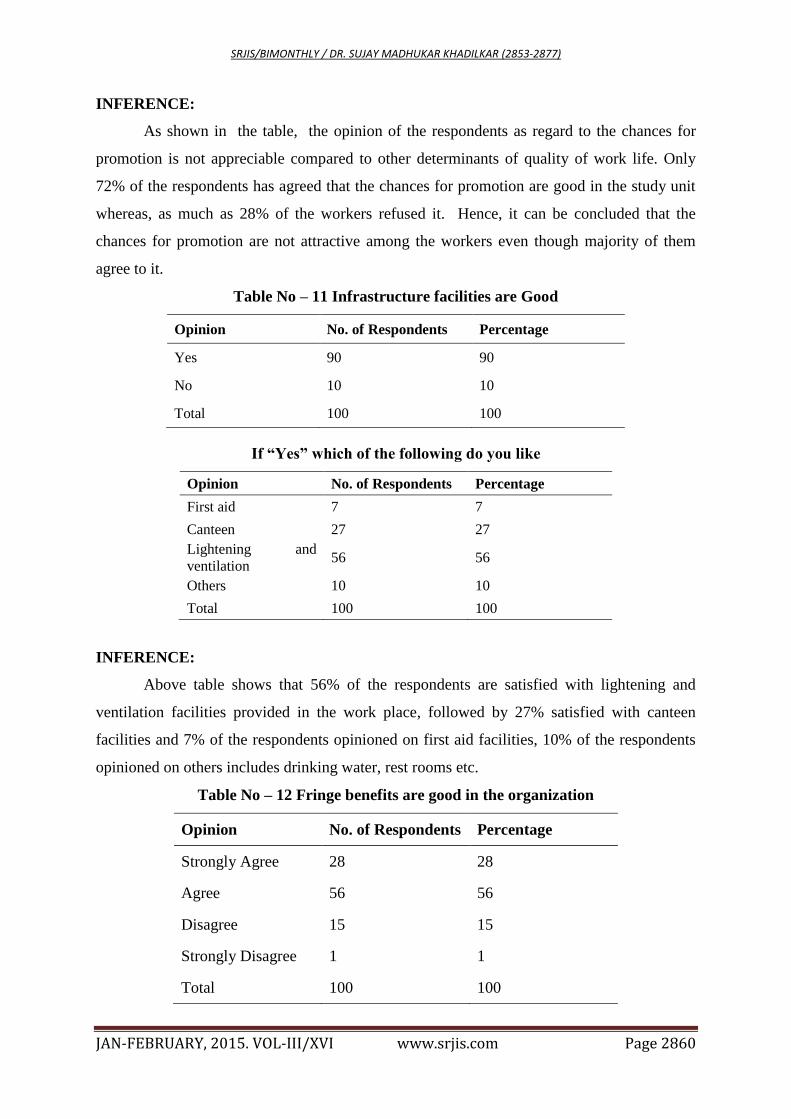
INFERENCE:
As shown in the table, the opinion of the respondents as regard to the chances for
promotion is not appreciable compared to other determinants of quality of work life. Only
72% of the respondents has agreed that the chances for promotion are good in the study unit
whereas, as much as 28% of the workers refused it. Hence, it can be concluded that the
chances for promotion are not attractive among the workers even though majority of them
agree to it.
Table No – 11 Infrastructure facilities are Good
Opinion No. of Respondents Percentage
Yes 90 90
No 10 10
Total 100 100
If “Yes” which of the following do you like
Opinion No. of Respondents Percentage
First aid 7 7
Canteen 27 27
Lightening and
ventilation 56 56
Others 10 10
Total 100 100
INFERENCE:
Above table shows that 56% of the respondents are satisfied with lightening and
ventilation facilities provided in the work place, followed by 27% satisfied with canteen
facilities and 7% of the respondents opinioned on first aid facilities, 10% of the respondents
opinioned on others includes drinking water, rest rooms etc.
Table No – 12 Fringe benefits are good in the organization
Opinion No. of Respondents Percentage
Strongly Agree 28 28
Agree 56 56
Disagree 15 15
Strongly Disagree 1 1
Total 100 100
SRJIS/BIMONTHLY / DR. SUJAY MADHUKAR KHADILKAR (2853-2877)
JAN-FEBRUARY, 2015. VOL-III/XVI www.srjis.com Page 2861
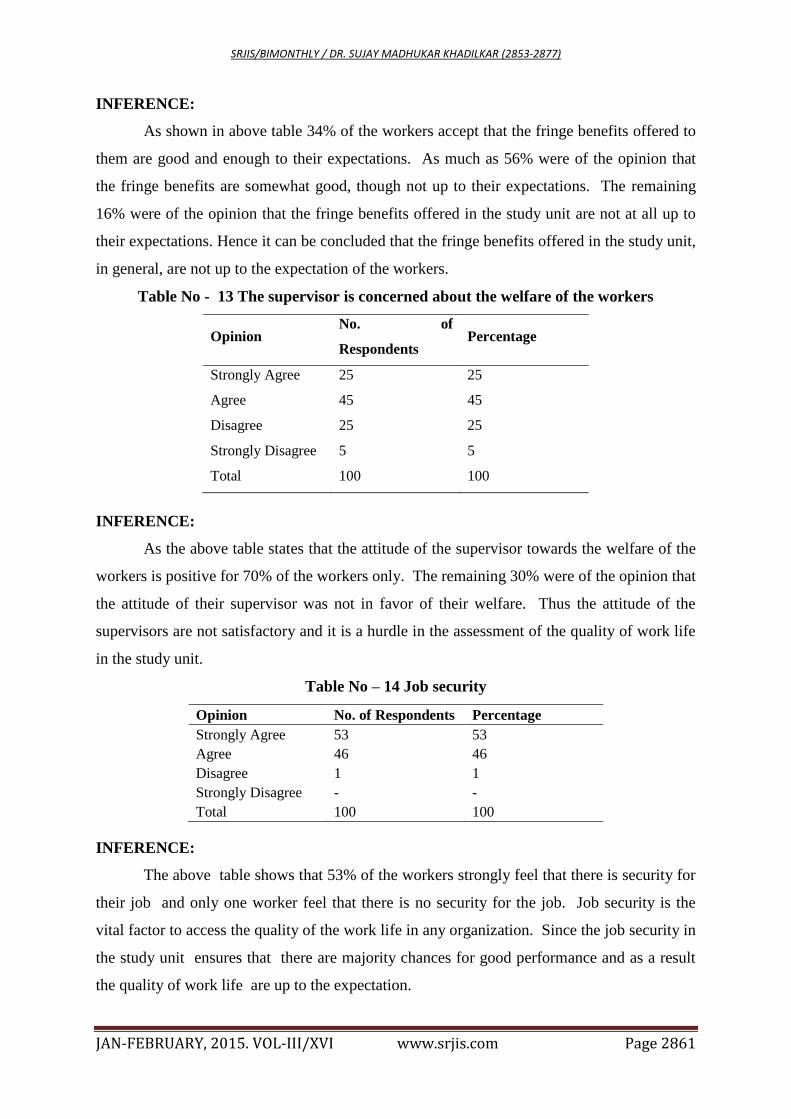
INFERENCE:
As shown in above table 34% of the workers accept that the fringe benefits offered to
them are good and enough to their expectations. As much as 56% were of the opinion that
the fringe benefits are somewhat good, though not up to their expectations. The remaining
16% were of the opinion that the fringe benefits offered in the study unit are not at all up to
their expectations. Hence it can be concluded that the fringe benefits offered in the study unit,
in general, are not up to the expectation of the workers.
Table No - 13 The supervisor is concerned about the welfare of the workers
Opinion No. of
Respondents Percentage
Strongly Agree 25 25
Agree 45 45
Disagree 25 25
Strongly Disagree 5 5
Total 100 100
INFERENCE:
As the above table states that the attitude of the supervisor towards the welfare of the
workers is positive for 70% of the workers only. The remaining 30% were of the opinion that
the attitude of their supervisor was not in favor of their welfare. Thus the attitude of the
supervisors are not satisfactory and it is a hurdle in the assessment of the quality of work life
in the study unit.
Table No – 14 Job security
Opinion No. of Respondents Percentage
Strongly Agree 53 53
Agree 46 46
Disagree 1 1
Strongly Disagree - -
Total 100 100
INFERENCE:
The above table shows that 53% of the workers strongly feel that there is security for
their job and only one worker feel that there is no security for the job. Job security is the
vital factor to access the quality of the work life in any organization. Since the job security in
the study unit ensures that there are majority chances for good performance and as a result
the quality of work life are up to the expectation.
SRJIS/BIMONTHLY / DR. SUJAY MADHUKAR KHADILKAR (2853-2877)
JAN-FEBRUARY, 2015. VOL-III/XVI www.srjis.com Page 2862
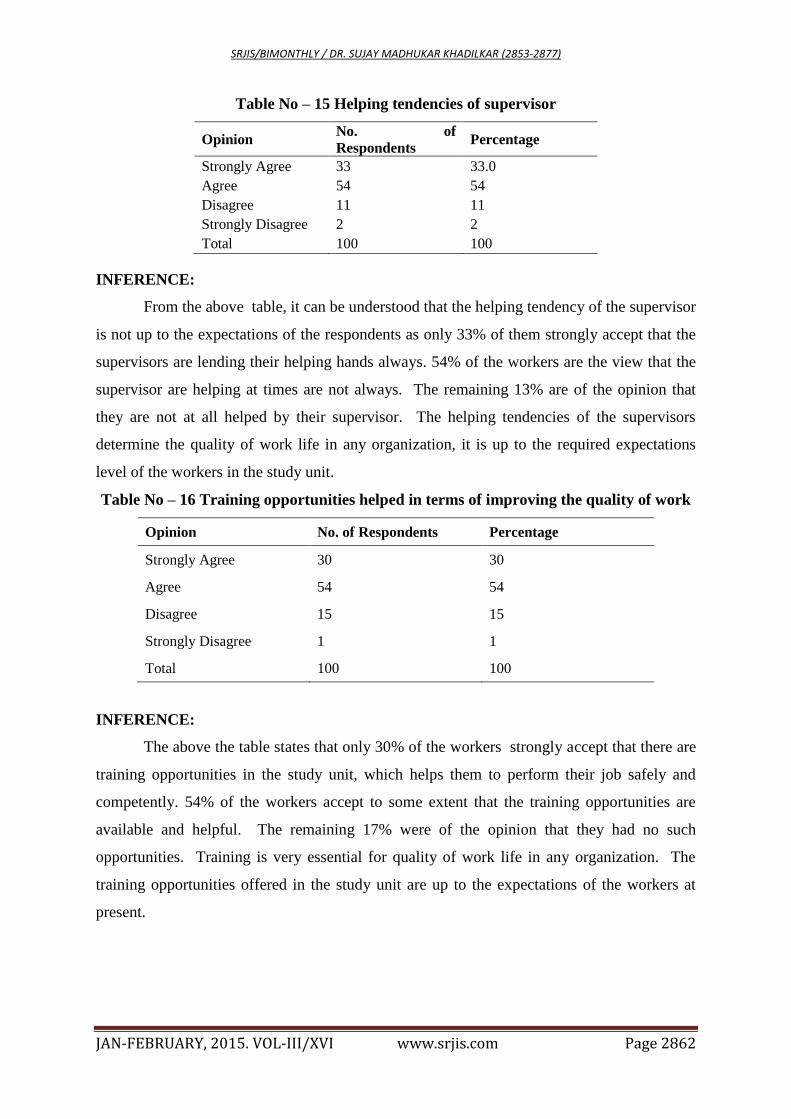
Table No – 15 Helping tendencies of supervisor
Opinion No. of
Respondents Percentage
Strongly Agree 33 33.0
Agree 54 54
Disagree 11 11
Strongly Disagree 2 2
Total 100 100
INFERENCE:
From the above table, it can be understood that the helping tendency of the supervisor
is not up to the expectations of the respondents as only 33% of them strongly accept that the
supervisors are lending their helping hands always. 54% of the workers are the view that the
supervisor are helping at times are not always. The remaining 13% are of the opinion that
they are not at all helped by their supervisor. The helping tendencies of the supervisors
determine the quality of work life in any organization, it is up to the required expectations
level of the workers in the study unit.
Table No – 16 Training opportunities helped in terms of improving the quality of work
Opinion No. of Respondents Percentage
Strongly Agree 30 30
Agree 54 54
Disagree 15 15
Strongly Disagree 1 1
Total 100 100
INFERENCE:
The above the table states that only 30% of the workers strongly accept that there are
training opportunities in the study unit, which helps them to perform their job safely and
competently. 54% of the workers accept to some extent that the training opportunities are
available and helpful. The remaining 17% were of the opinion that they had no such
opportunities. Training is very essential for quality of work life in any organization. The
training opportunities offered in the study unit are up to the expectations of the workers at
present.
SRJIS/BIMONTHLY / DR. SUJAY MADHUKAR KHADILKAR (2853-2877)
JAN-FEBRUARY, 2015. VOL-III/XVI www.srjis.com Page 2863
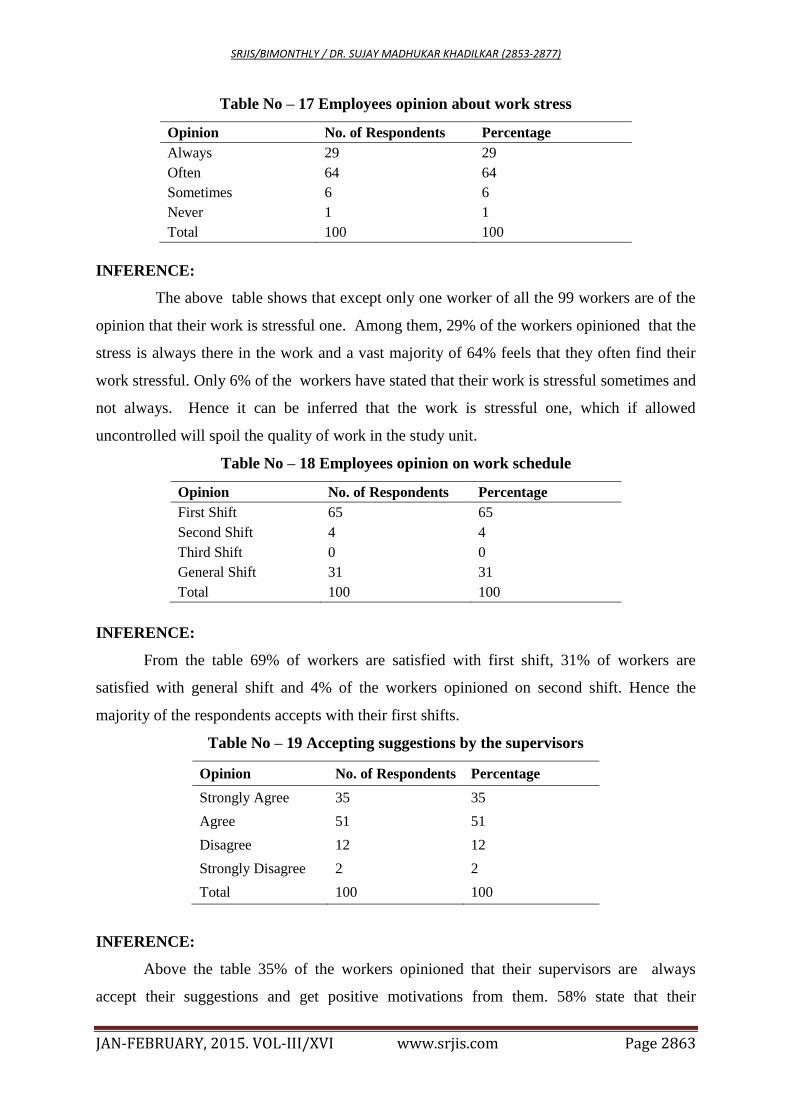
Table No – 17 Employees opinion about work stress
Opinion No. of Respondents Percentage
Always 29 29
Often 64 64
Sometimes 6 6
Never 1 1
Total 100 100
INFERENCE:
The above table shows that except only one worker of all the 99 workers are of the
opinion that their work is stressful one. Among them, 29% of the workers opinioned that the
stress is always there in the work and a vast majority of 64% feels that they often find their
work stressful. Only 6% of the workers have stated that their work is stressful sometimes and
not always. Hence it can be inferred that the work is stressful one, which if allowed
uncontrolled will spoil the quality of work in the study unit.
Table No – 18 Employees opinion on work schedule
Opinion No. of Respondents Percentage
First Shift 65 65
Second Shift 4 4
Third Shift 0 0
General Shift 31 31
Total 100 100
INFERENCE:
From the table 69% of workers are satisfied with first shift, 31% of workers are
satisfied with general shift and 4% of the workers opinioned on second shift. Hence the
majority of the respondents accepts with their first shifts.
Table No – 19 Accepting suggestions by the supervisors
Opinion No. of Respondents Percentage
Strongly Agree 35 35
Agree 51 51
Disagree 12 12
Strongly Disagree 2 2
Total 100 100
INFERENCE:
Above the table 35% of the workers opinioned that their supervisors are always
accept their suggestions and get positive motivations from them. 58% state that their
SRJIS/BIMONTHLY / DR. SUJAY MADHUKAR KHADILKAR (2853-2877)
JAN-FEBRUARY, 2015. VOL-III/XVI www.srjis.com Page 2864
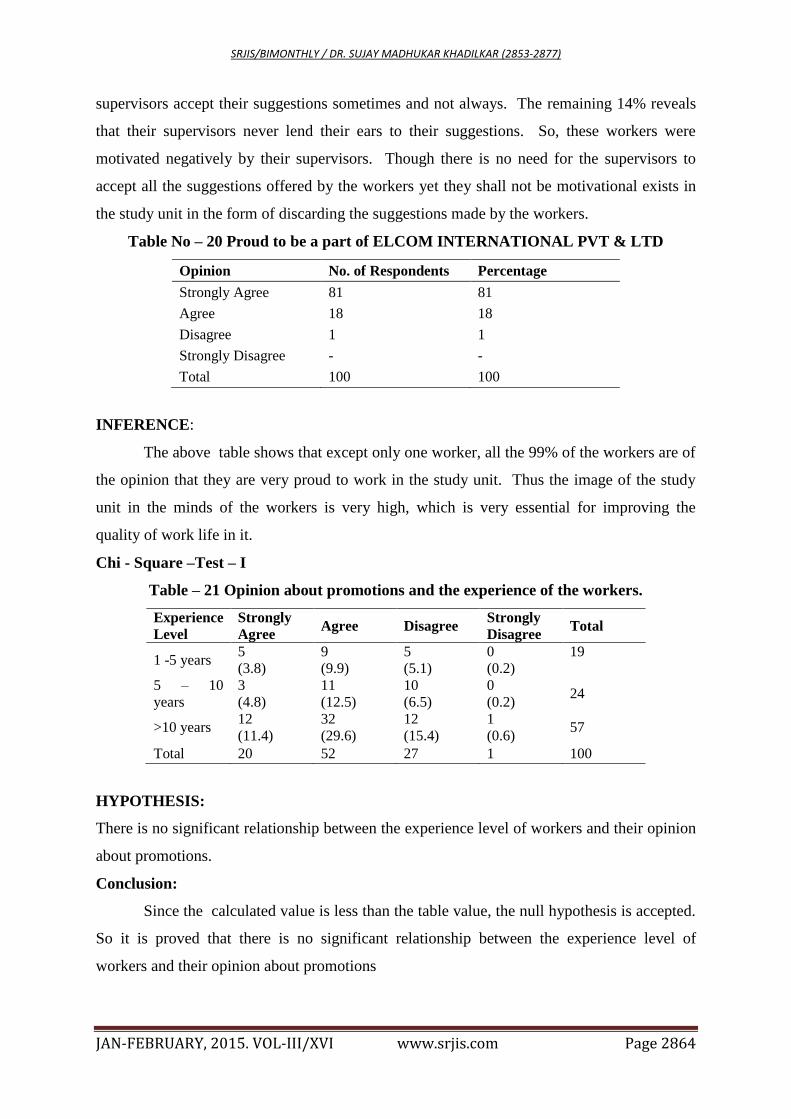
supervisors accept their suggestions sometimes and not always. The remaining 14% reveals
that their supervisors never lend their ears to their suggestions. So, these workers were
motivated negatively by their supervisors. Though there is no need for the supervisors to
accept all the suggestions offered by the workers yet they shall not be motivational exists in
the study unit in the form of discarding the suggestions made by the workers.
Table No – 20 Proud to be a part of ELCOM INTERNATIONAL PVT & LTD
Opinion No. of Respondents Percentage
Strongly Agree 81 81
Agree 18 18
Disagree 1 1
Strongly Disagree - -
Total 100 100
INFERENCE:
The above table shows that except only one worker, all the 99% of the workers are of
the opinion that they are very proud to work in the study unit. Thus the image of the study
unit in the minds of the workers is very high, which is very essential for improving the
quality of work life in it.
Chi - Square –Test – I
Table – 21 Opinion about promotions and the experience of the workers.
Experience
Level
Strongly
Agree Agree Disagree
Strongly
Disagree Total
1 -5 years 5
(3.8)
9
(9.9)
5
(5.1)
0
(0.2)
19
5 – 10
years
3
(4.8)
11
(12.5)
10
(6.5)
0
(0.2) 24
>10 years 12
(11.4)
32
(29.6)
12
(15.4)
1
(0.6) 57
Total 20 52 27 1 100
HYPOTHESIS:
There is no significant relationship between the experience level of workers and their opinion
about promotions.
Conclusion:
Since the calculated value is less than the table value, the null hypothesis is accepted.
So it is proved that there is no significant relationship between the experience level of
workers and their opinion about promotions
SRJIS/BIMONTHLY / DR. SUJAY MADHUKAR KHADILKAR (2853-2877)
JAN-FEBRUARY, 2015. VOL-III/XVI www.srjis.com Page 2865
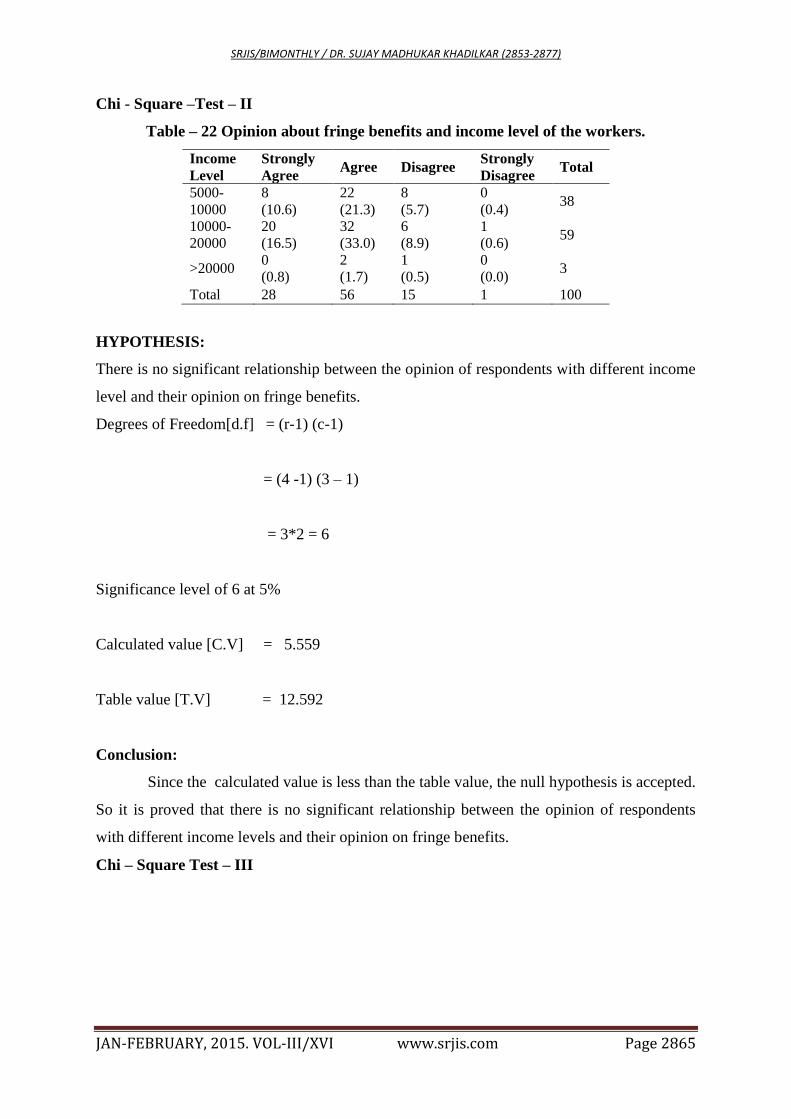
Chi - Square –Test – II
Table – 22 Opinion about fringe benefits and income level of the workers.
Income
Level
Strongly
Agree Agree Disagree
Strongly
Disagree Total
5000-
10000
8
(10.6)
22
(21.3)
8
(5.7)
0
(0.4) 38
10000-
20000
20
(16.5)
32
(33.0)
6
(8.9)
1
(0.6) 59
>20000 0
(0.8)
2
(1.7)
1
(0.5)
0
(0.0) 3
Total 28 56 15 1 100
HYPOTHESIS:
There is no significant relationship between the opinion of respondents with different income
level and their opinion on fringe benefits.
Degrees of Freedom[d.f] = (r-1) (c-1)
= (4 -1) (3 – 1)
= 3*2 = 6
Significance level of 6 at 5%
Calculated value [C.V] = 5.559
Table value [T.V] = 12.592
Conclusion:
Since the calculated value is less than the table value, the null hypothesis is accepted.
So it is proved that there is no significant relationship between the opinion of respondents
with different income levels and their opinion on fringe benefits.
Chi – Square Test – III
SRJIS/BIMONTHLY / DR. SUJAY MADHUKAR KHADILKAR (2853-2877)
JAN-FEBRUARY, 2015. VOL-III/XVI www.srjis.com Page 2866
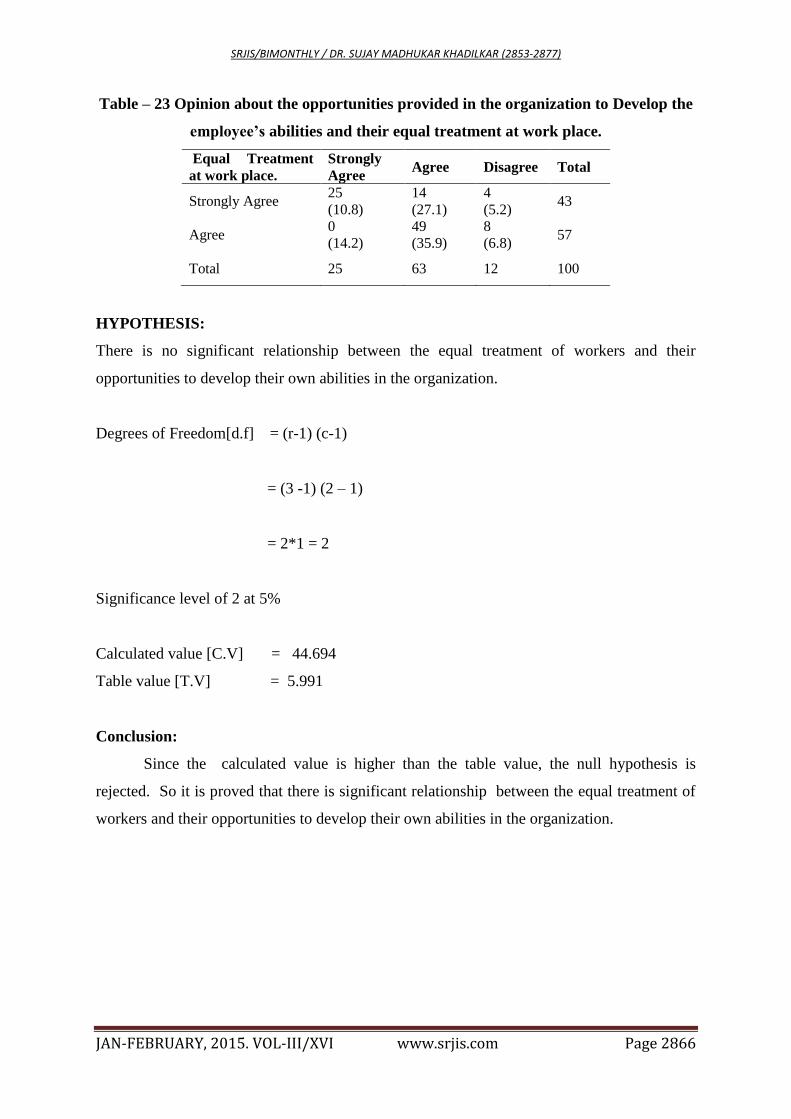
Table – 23 Opinion about the opportunities provided in the organization to Develop the
employee’s abilities and their equal treatment at work place.
Equal Treatment
at work place.
Strongly
Agree Agree Disagree Total
Strongly Agree 25
(10.8)
14
(27.1)
4
(5.2) 43
Agree 0
(14.2)
49
(35.9)
8
(6.8) 57
Total 25 63 12 100
HYPOTHESIS:
There is no significant relationship between the equal treatment of workers and their
opportunities to develop their own abilities in the organization.
Degrees of Freedom[d.f] = (r-1) (c-1)
= (3 -1) (2 – 1)
= 2*1 = 2
Significance level of 2 at 5%
Calculated value [C.V] = 44.694
Table value [T.V] = 5.991
Conclusion:
Since the calculated value is higher than the table value, the null hypothesis is
rejected. So it is proved that there is significant relationship between the equal treatment of
workers and their opportunities to develop their own abilities in the organization.
SRJIS/BIMONTHLY / DR. SUJAY MADHUKAR KHADILKAR (2853-2877)
JAN-FEBRUARY, 2015. VOL-III/XVI www.srjis.com Page 2867
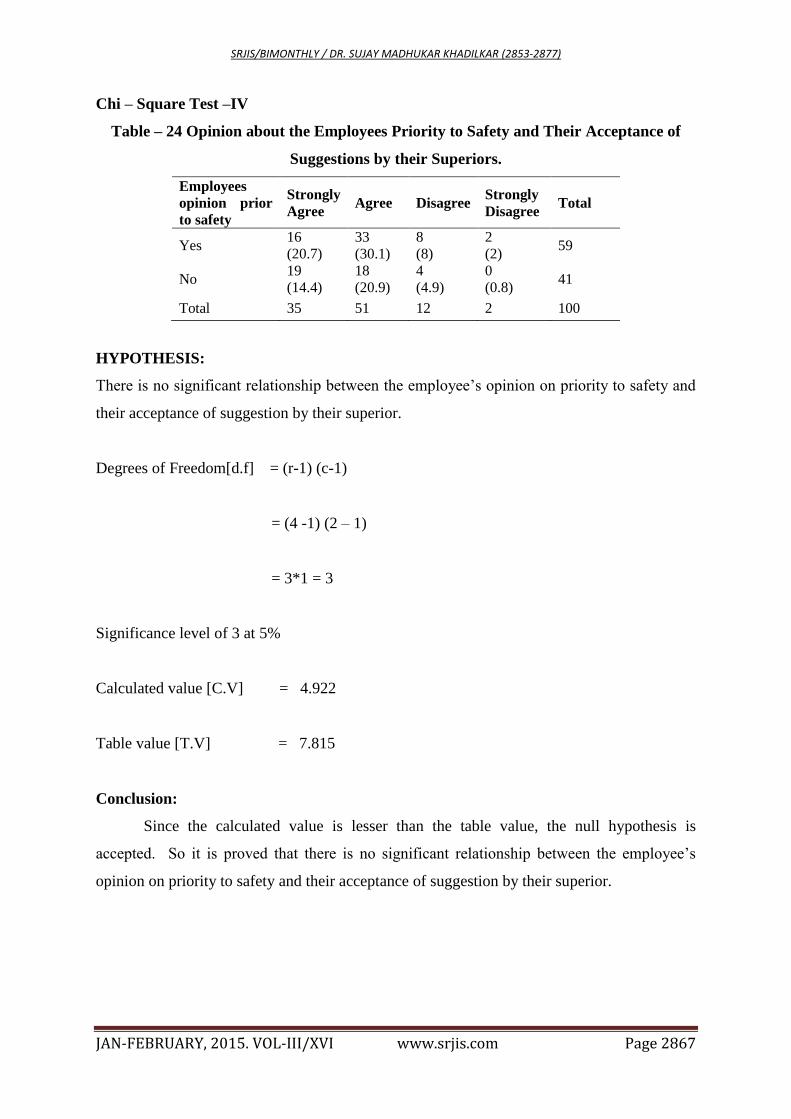
Chi – Square Test –IV
Table – 24 Opinion about the Employees Priority to Safety and Their Acceptance of
Suggestions by their Superiors.
Employees
opinion prior
to safety
Strongly
Agree Agree Disagree
Strongly
Disagree Total
Yes 16
(20.7)
33
(30.1)
8
(8)
2
(2) 59
No 19
(14.4)
18
(20.9)
4
(4.9)
0
(0.8) 41
Total 35 51 12 2 100
HYPOTHESIS:
There is no significant relationship between the employee’s opinion on priority to safety and
their acceptance of suggestion by their superior.
Degrees of Freedom[d.f] = (r-1) (c-1)
= (4 -1) (2 – 1)
= 3*1 = 3
Significance level of 3 at 5%
Calculated value [C.V] = 4.922
Table value [T.V] = 7.815
Conclusion:
Since the calculated value is lesser than the table value, the null hypothesis is
accepted. So it is proved that there is no significant relationship between the employee’s
opinion on priority to safety and their acceptance of suggestion by their superior.
SRJIS/BIMONTHLY / DR. SUJAY MADHUKAR KHADILKAR (2853-2877)
JAN-FEBRUARY, 2015. VOL-III/XVI www.srjis.com Page 2868
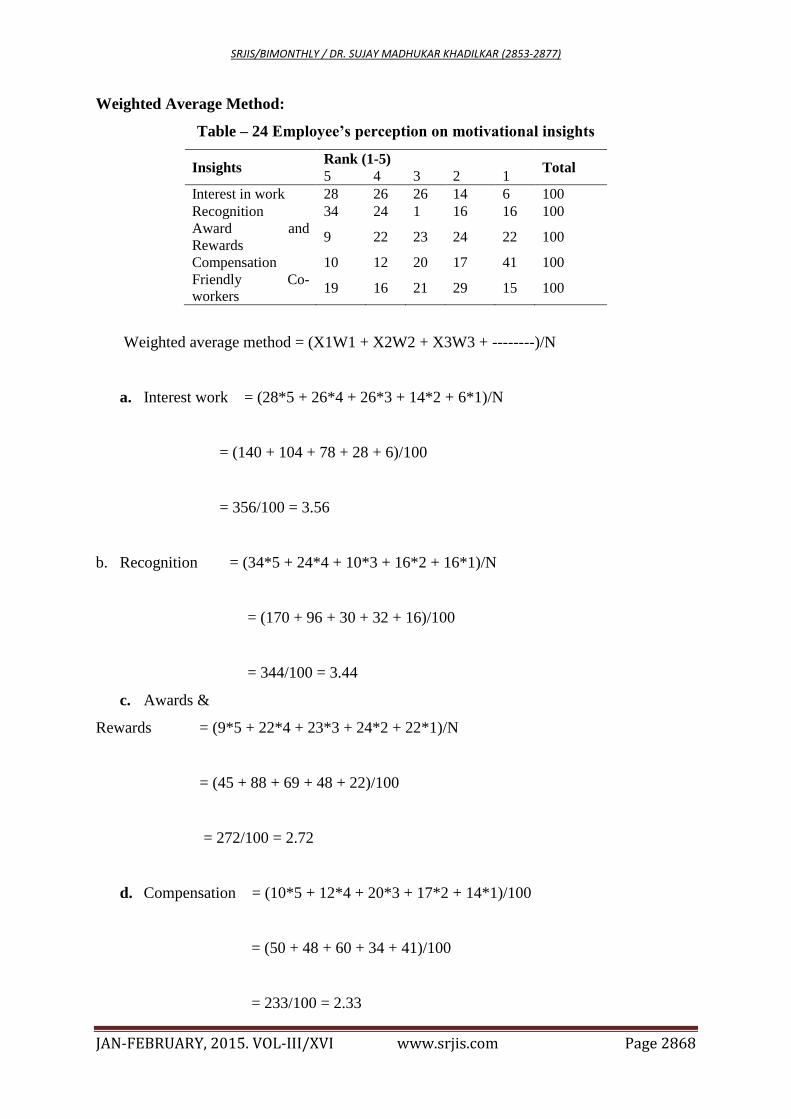
Weighted Average Method:
Table – 24 Employee’s perception on motivational insights
Insights Rank (1-5)
Total 5 4 3 2 1
Interest in work 28 26 26 14 6 100
Recognition 34 24 1 16 16 100
Award and
Rewards 9 22 23 24 22 100
Compensation 10 12 20 17 41 100
Friendly Co-
workers 19 16 21 29 15 100
Weighted average method = (X1W1 + X2W2 + X3W3 + --------)/N
a. Interest work = (28*5 + 26*4 + 26*3 + 14*2 + 6*1)/N
= (140 + 104 + 78 + 28 + 6)/100
= 356/100 = 3.56
b. Recognition = (34*5 + 24*4 + 10*3 + 16*2 + 16*1)/N
= (170 + 96 + 30 + 32 + 16)/100
= 344/100 = 3.44
c. Awards &
Rewards = (9*5 + 22*4 + 23*3 + 24*2 + 22*1)/N
= (45 + 88 + 69 + 48 + 22)/100
= 272/100 = 2.72
d. Compensation = (10*5 + 12*4 + 20*3 + 17*2 + 14*1)/100
= (50 + 48 + 60 + 34 + 41)/100
= 233/100 = 2.33
SRJIS/BIMONTHLY / DR. SUJAY MADHUKAR KHADILKAR (2853-2877)
JAN-FEBRUARY, 2015. VOL-III/XVI www.srjis.com Page 2869
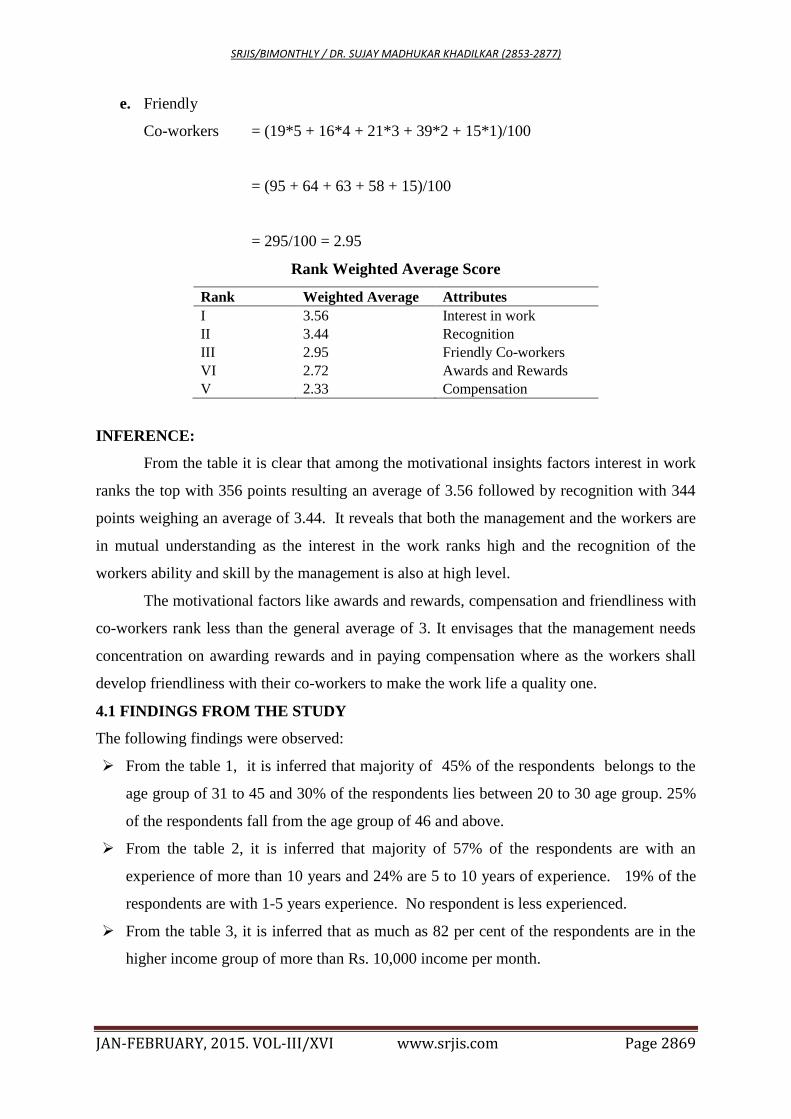
e. Friendly
Co-workers = (19*5 + 16*4 + 21*3 + 39*2 + 15*1)/100
= (95 + 64 + 63 + 58 + 15)/100
= 295/100 = 2.95
Rank Weighted Average Score
Rank Weighted Average Attributes
I 3.56 Interest in work
II 3.44 Recognition
III 2.95 Friendly Co-workers
VI 2.72 Awards and Rewards
V 2.33 Compensation
INFERENCE:
From the table it is clear that among the motivational insights factors interest in work
ranks the top with 356 points resulting an average of 3.56 followed by recognition with 344
points weighing an average of 3.44. It reveals that both the management and the workers are
in mutual understanding as the interest in the work ranks high and the recognition of the
workers ability and skill by the management is also at high level.
The motivational factors like awards and rewards, compensation and friendliness with
co-workers rank less than the general average of 3. It envisages that the management needs
concentration on awarding rewards and in paying compensation where as the workers shall
develop friendliness with their co-workers to make the work life a quality one.
4.1 FINDINGS FROM THE STUDY
The following findings were observed:
From the table 1, it is inferred that majority of 45% of the respondents belongs to the
age group of 31 to 45 and 30% of the respondents lies between 20 to 30 age group. 25%
of the respondents fall from the age group of 46 and above.
From the table 2, it is inferred that majority of 57% of the respondents are with an
experience of more than 10 years and 24% are 5 to 10 years of experience. 19% of the
respondents are with 1-5 years experience. No respondent is less experienced.
From the table 3, it is inferred that as much as 82 per cent of the respondents are in the
higher income group of more than Rs. 10,000 income per month.
SRJIS/BIMONTHLY / DR. SUJAY MADHUKAR KHADILKAR (2853-2877)
JAN-FEBRUARY, 2015. VOL-III/XVI www.srjis.com Page 2870
From the table 4, it is inferred that as much as 97% of workers in the study unit were of
the opinion that their job enables them to use their skills and abilities in full. Only 3% of
them disagreed to this point.
From the table 5, shows that no harm is done to the self-respect of the workers in the
study unit. 43% of the respondents strongly agreed to the statement and 57% of the
respondents also opinioned that the workers are treated equally with respect at their work
places.
From the table 6, it is inferred that almost 97% all the workers in the study unit either
agree or even strongly agree that the conditions on their job allow them to be productive.
Only 3% of them were of negative opinion.
From the table 7, it is inferred that 25% of the workers strongly agree to the point that
there are adequate opportunities to develop their own special abilities in the work place.
63% of the respondents agree to it only to some extent. Only 12% of the workers find
no such opportunities in the study unit.
From the table 8, it is inferred that 82% of the workers in the study unit are satisfied with
the guidance provided to them by the superiors/managers to get the work done easily.
18% of the respondents disagreed to accept it.
From the table 9, it is inferred that the opinion of the respondents as regard to the
positive factors of the high quality tools and techniques required performing to do the
job. 65% of the respondents very strongly agree & with the provisions made to utilize
quality tools and techniques to perform the job, and 32% of the respondents also agree
with the statements, and only 3% of the respondents are refused to accept it.
From the table 10, it is inferred that the opinion of the respondents as regard to the
chances for promotion is not appreciable compared to other determinants of quality of
work life. Only 72% of the respondents have agreed that the chances for promotion are
good in the study unit where as, as much as 28% of the workers refused it.
From table 11, it is inferred that 56% of the respondents are satisfied with lightening and
ventilation facilities provided in the work place, followed by 27% satisfied with canteen
facilities and 7% of the respondents opinioned on first aid facilities, 10% of the
respondents opinioned on others includes drinking water, rest rooms etc.
From the table 12, it is inferred that 34% of the workers accept that the fringe benefits
offered to them are good and enough to their expectations. As much as 56% were of the
opinion that the fringe benefits are somewhat good, though not up to their expectations.
SRJIS/BIMONTHLY / DR. SUJAY MADHUKAR KHADILKAR (2853-2877)
JAN-FEBRUARY, 2015. VOL-III/XVI www.srjis.com Page 2871
The remaining 16% were of the opinion that the fringe benefits offered in the study unit
are up to their expectations.
From the table 13, it is inferred that the attitude of the supervisor towards the welfare of
the workers is positive for 70% of the workers only. The remaining 30% were of the
opinion that the attitude of their supervisor was not in favor of their welfare.
From the table 14, it is inferred that 53% of the workers strongly feel that there is
security for their job and only one worker feel that there is no security for the job.
From the table 15, it is inferred that the helping tendency of the supervisor is not up to
the expectations of the respondents as only 33% of them strongly accept that the
supervisors are lending their helping hands always. 54% of the workers are the view that
the supervisor are helping at times are not always. The remaining 13% are of the
opinion that they are not at all helped by their supervisor.
From the table 16, it is inferred that only 30% of the workers strongly accept that there
are training opportunities in the study unit, which helps them to perform their job safely
and competently. 54% of the workers accept to some extent that the training
opportunities are available and helpful. The remaining 17% were of the opinion that
they had no such opportunities.
From the table 17, it is inferred that except only one worker of all the 99 workers are of
the opinion that their work is stressful one. Among them, 29% of the workers opinioned
that the stress is always there in the work and a vast majority of 64% feel that they often
find their work stressful. Only 6% of the workers have stated that their work is stressful
sometimes and not always.
From the table 18, it is inferred that 69% of workers are satisfied with first shift, 31% of
workers are satisfied with general shift and 4% of the workers opinioned on second shift.
From the table 19, it is inferred that 35% of the workers opinioned that their supervisors
are always accept their suggestions and get positive motivations from them. 58% state
that their supervisors accept their suggestions sometimes and not always. The remaining
14% reveals that their supervisors never lend their ears to their suggestions. So, these
workers were motivated negatively by their supervisors.
From the table 20, it is inferred that shows that except only one worker, all the 99% of
the workers are of the opinion that they are very proud to work in the study unit. Thus
the image of the study unit in the minds of the workers is very high, which is very
essential for improving the quality of work life in it.
SRJIS/BIMONTHLY / DR. SUJAY MADHUKAR KHADILKAR (2853-2877)
JAN-FEBRUARY, 2015. VOL-III/XVI www.srjis.com Page 2872
4.2 SUGGESTIONS AND RECOMMENDATIONS
The employees of ELCOM INTERNATIONAL PVT. LTD., expecting the following
from the company.
i. Improvement in rewarding and awarding policies.
ii. Introduction of Promotion policy at operation level
Employees need high motivation from the top management of the company.
Employees needs more compensation from the company.
Employees expects mutual relationship between co-workers
Employee’s needs special training from the company related to their job during working
period.
Employees expects the quality of work to be measured periodically be the company
4.3 CONCLUSIONS
From the study, it is clear that quality of work life of employees in ELCOM
INTERNATIONAL PVT LTD., is good. This research highlights some of the small gaps in
employee’s satisfaction towards the company.
Compared to other companies believe in employee’s satisfaction and brilliant
productivity hours. Quality mission includes not only the quality of the products but also the
Quality of Work Life.
ELCOM INTERNATIONAL PVT LTD aims to promote the peaceful industrial
relations and good organization which is highlighted by management and the employees.
Since employees are the backbone of the company. So company should satisfy them
in order to improve the business in the higher competitive market of the liberalized economy.
REFERENCES
BOOKS:
K. Aswathappa (1997), “Human Resources and Personal Management” Tata Mcgraw-Hill
Publishing Company Limited, New Delhi – 110 001.
C. R. Kothari (2001) “Research Methodology” of Wishwa Prakashan Publishing, Chennai – 17,
Edition
C. B. Mamoria and S. V. Gankar (2001), “Personnel Management Text & Cases”, Himalaya
Publishing house Mumbai, XXI Edition.
WEBSITES:
www.humanresources.com
www.qualityofworklife.com
www.ask.com
www.indianplasticportal.com
SRJIS/BIMONTHLY / DR. SUJAY MADHUKAR KHADILKAR (2853-2877)
JAN-FEBRUARY, 2015. VOL-III/XVI www.srjis.com Page 2873
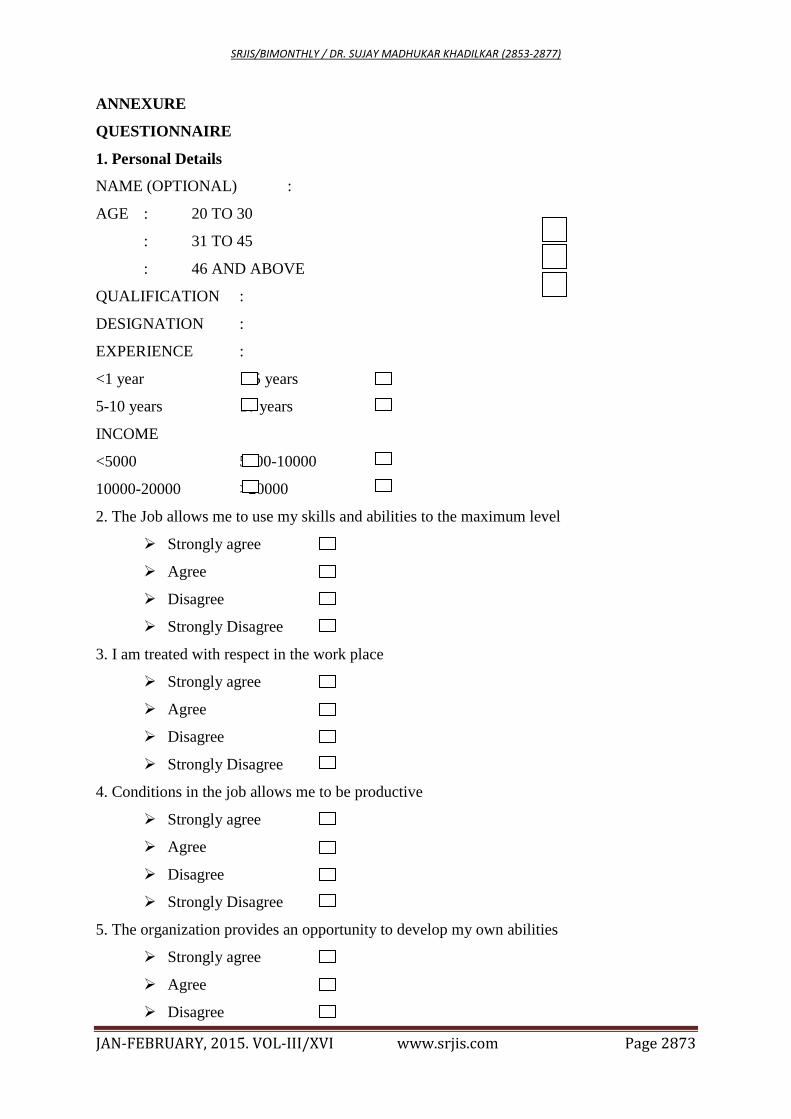
ANNEXURE
QUESTIONNAIRE
1. Personal Details
NAME (OPTIONAL) :
AGE : 20 TO 30
: 31 TO 45
: 46 AND ABOVE
QUALIFICATION :
DESIGNATION :
EXPERIENCE :
<1 year 1-5 years
5-10 years 10 years
INCOME
<5000 5000-10000
10000-20000 >20000
2. The Job allows me to use my skills and abilities to the maximum level
Strongly agree
Agree
Disagree
Strongly Disagree
3. I am treated with respect in the work place
Strongly agree
Agree
Disagree
Strongly Disagree
4. Conditions in the job allows me to be productive
Strongly agree
Agree
Disagree
Strongly Disagree
5. The organization provides an opportunity to develop my own abilities
Strongly agree
Agree
Disagree
SRJIS/BIMONTHLY / DR. SUJAY MADHUKAR KHADILKAR (2853-2877)
JAN-FEBRUARY, 2015. VOL-III/XVI www.srjis.com Page 2874
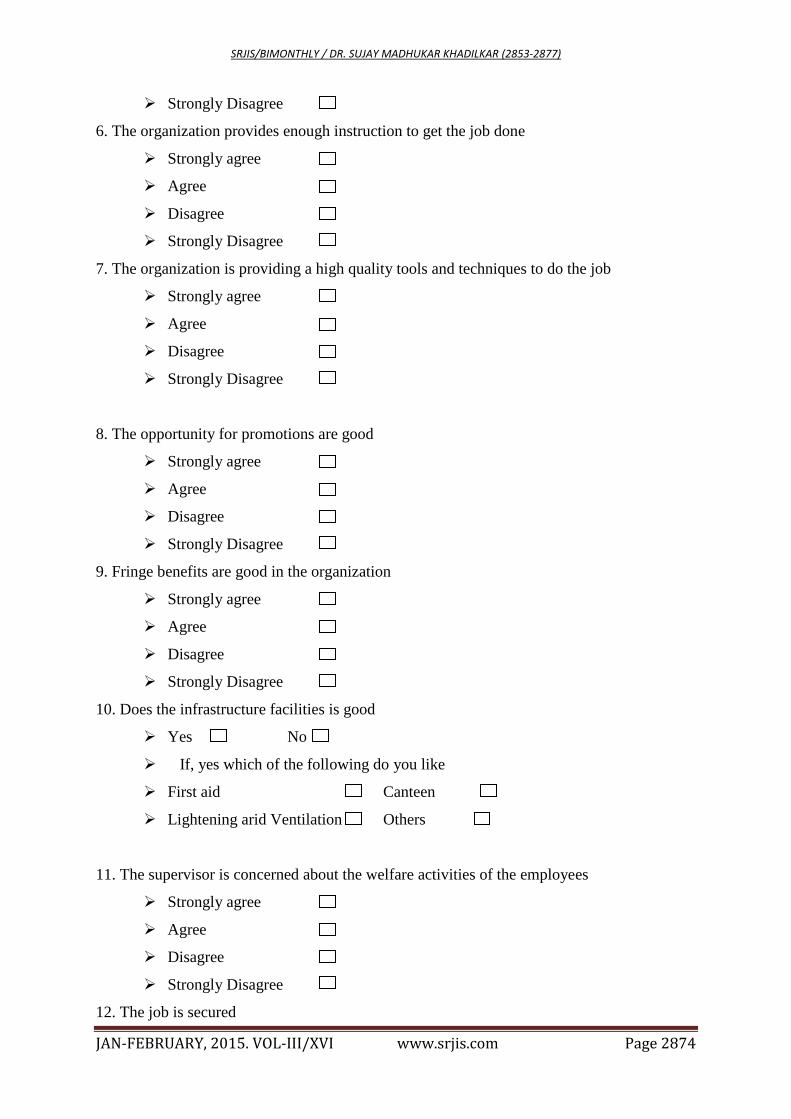
Strongly Disagree
6. The organization provides enough instruction to get the job done
Strongly agree
Agree
Disagree
Strongly Disagree
7. The organization is providing a high quality tools and techniques to do the job
Strongly agree
Agree
Disagree
Strongly Disagree
8. The opportunity for promotions are good
Strongly agree
Agree
Disagree
Strongly Disagree
9. Fringe benefits are good in the organization
Strongly agree
Agree
Disagree
Strongly Disagree
10. Does the infrastructure facilities is good
Yes No
If, yes which of the following do you like
First aid Canteen
Lightening arid Ventilation Others
11. The supervisor is concerned about the welfare activities of the employees
Strongly agree
Agree
Disagree
Strongly Disagree
12. The job is secured
SRJIS/BIMONTHLY / DR. SUJAY MADHUKAR KHADILKAR (2853-2877)
JAN-FEBRUARY, 2015. VOL-III/XVI www.srjis.com Page 2875
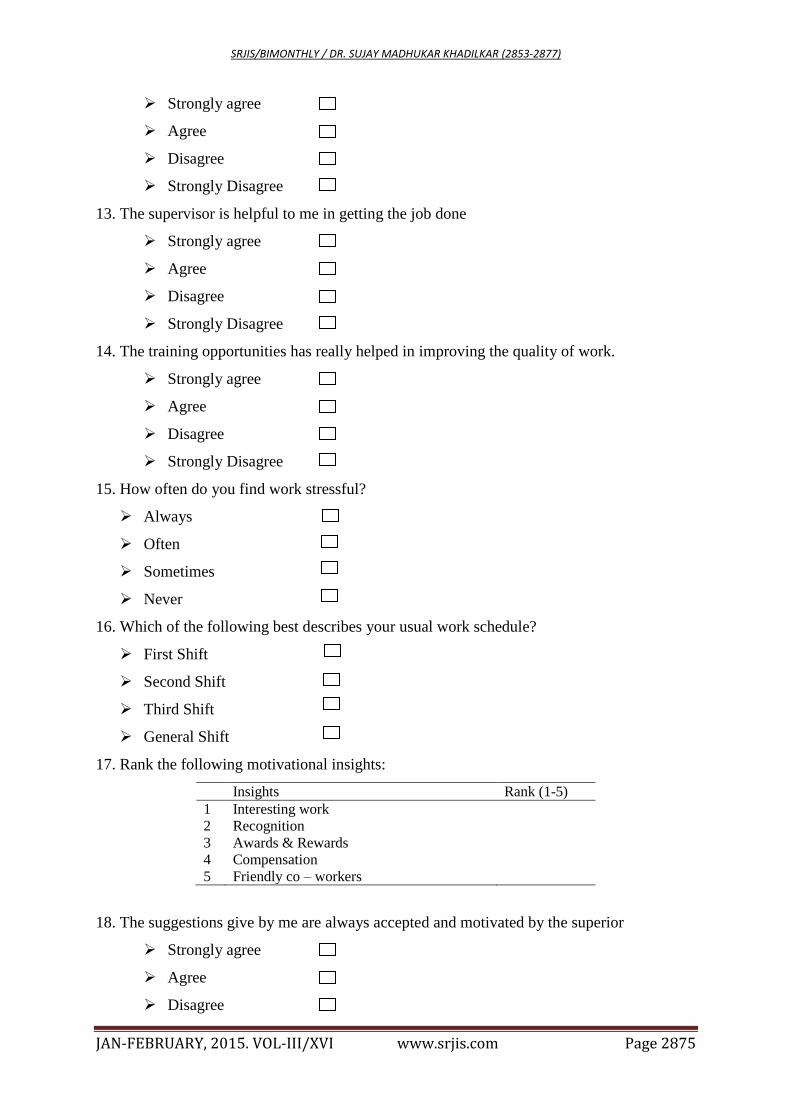
Strongly agree
Agree
Disagree
Strongly Disagree
13. The supervisor is helpful to me in getting the job done
Strongly agree
Agree
Disagree
Strongly Disagree
14. The training opportunities has really helped in improving the quality of work.
Strongly agree
Agree
Disagree
Strongly Disagree
15. How often do you find work stressful?
Always
Often
Sometimes
Never
16. Which of the following best describes your usual work schedule?
First Shift
Second Shift
Third Shift
General Shift
17. Rank the following motivational insights:
Insights Rank (1-5)
1 Interesting work
2 Recognition
3 Awards & Rewards
4 Compensation
5 Friendly co – workers
18. The suggestions give by me are always accepted and motivated by the superior
Strongly agree
Agree
Disagree
SRJIS/BIMONTHLY / DR. SUJAY MADHUKAR KHADILKAR (2853-2877)
JAN-FEBRUARY, 2015. VOL-III/XVI www.srjis.com Page 2876
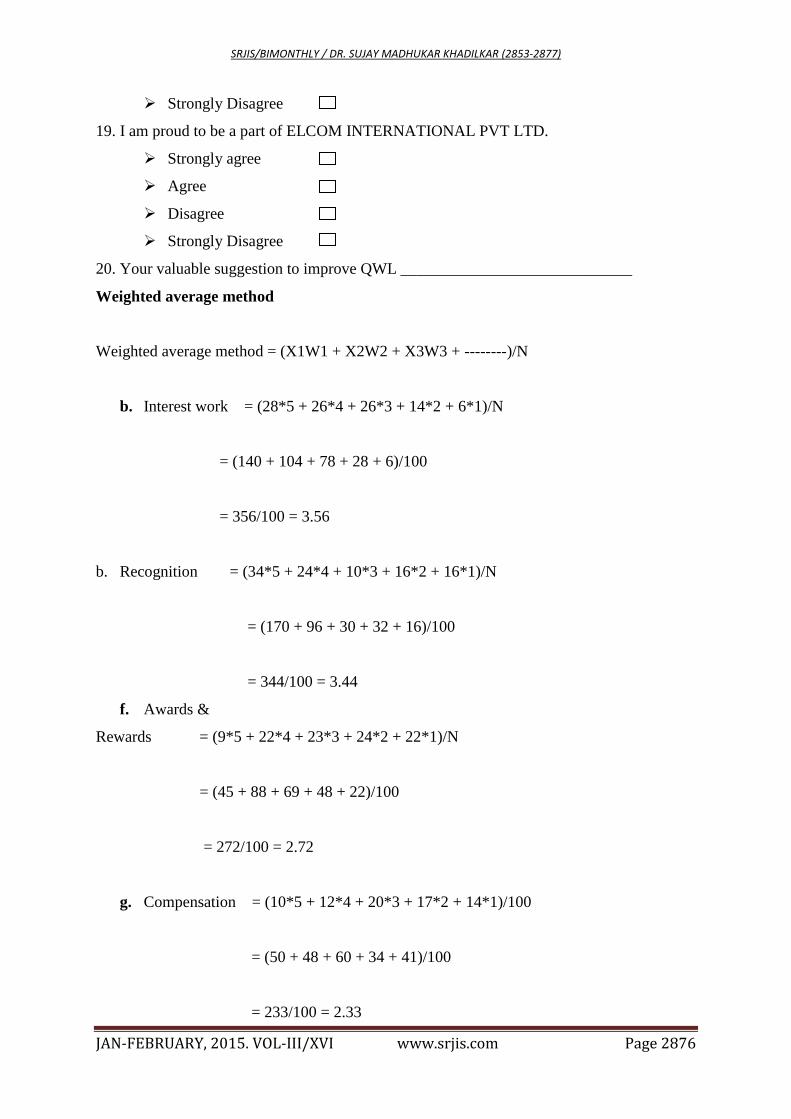
Strongly Disagree
19. I am proud to be a part of ELCOM INTERNATIONAL PVT LTD.
Strongly agree
Agree
Disagree
Strongly Disagree
20. Your valuable suggestion to improve QWL _____________________________
Weighted average method
Weighted average method = (X1W1 + X2W2 + X3W3 + --------)/N
b. Interest work = (28*5 + 26*4 + 26*3 + 14*2 + 6*1)/N
= (140 + 104 + 78 + 28 + 6)/100
= 356/100 = 3.56
b. Recognition = (34*5 + 24*4 + 10*3 + 16*2 + 16*1)/N
= (170 + 96 + 30 + 32 + 16)/100
= 344/100 = 3.44
f. Awards &
Rewards = (9*5 + 22*4 + 23*3 + 24*2 + 22*1)/N
= (45 + 88 + 69 + 48 + 22)/100
= 272/100 = 2.72
g. Compensation = (10*5 + 12*4 + 20*3 + 17*2 + 14*1)/100
= (50 + 48 + 60 + 34 + 41)/100
= 233/100 = 2.33
SRJIS/BIMONTHLY / DR. SUJAY MADHUKAR KHADILKAR (2853-2877)
JAN-FEBRUARY, 2015. VOL-III/XVI www.srjis.com Page 2877
h. Friendly
Co-workers = (19*5 + 16*4 + 21*3 + 39*2 + 15*1)/100
= (95 + 64 + 63 + 58 + 15)/100
= 295/100 = 2.95