oliver arthur kikkas financial performance assessment …
TRANSCRIPT

TALLINN UNIVERSITY OF TECHNOLOGY
School of Business and Governance
Department of Economics and Finance
Oliver Arthur Kikkas
FINANCIAL PERFORMANCE ASSESSMENT OF TESLA, INC.
AND NISSAN MOTOR COMPANY
Bachelor’s thesis
International Business Administration, Finance & Accounting
Supervisor: Kalle Ahi, MA
Tallinn 2020

I hereby declare that I have compiled the paper independently
and all works, important standpoints and data by other authors
has been properly referenced and the same paper
has not been previously presented for grading.
The document length is 8220 words from the introduction to the end of conclusion.
Oliver Arthur Kikkas ……………………………
(signature, date)
Student code: 164942TVTB
Student e-mail address: [email protected]
Supervisor: Kalle Ahi, MA:
The paper conforms to requirements in force
……………………………………………
(signature, date)
Chairman of the Defence Committee:
Permitted to the defence
…………………………………
(name, signature, date)

3
TABLE OF CONTENTS
ABSTRACT .................................................................................................................................... 4
INTRODUCTION ........................................................................................................................... 5
1. FINANCIAL STATEMENT ANALYSIS OVERVIEW ............................................................ 8
1.1. Financial Ratios .................................................................................................................... 8
1.1.1. Leverage ratios ............................................................................................................ 10
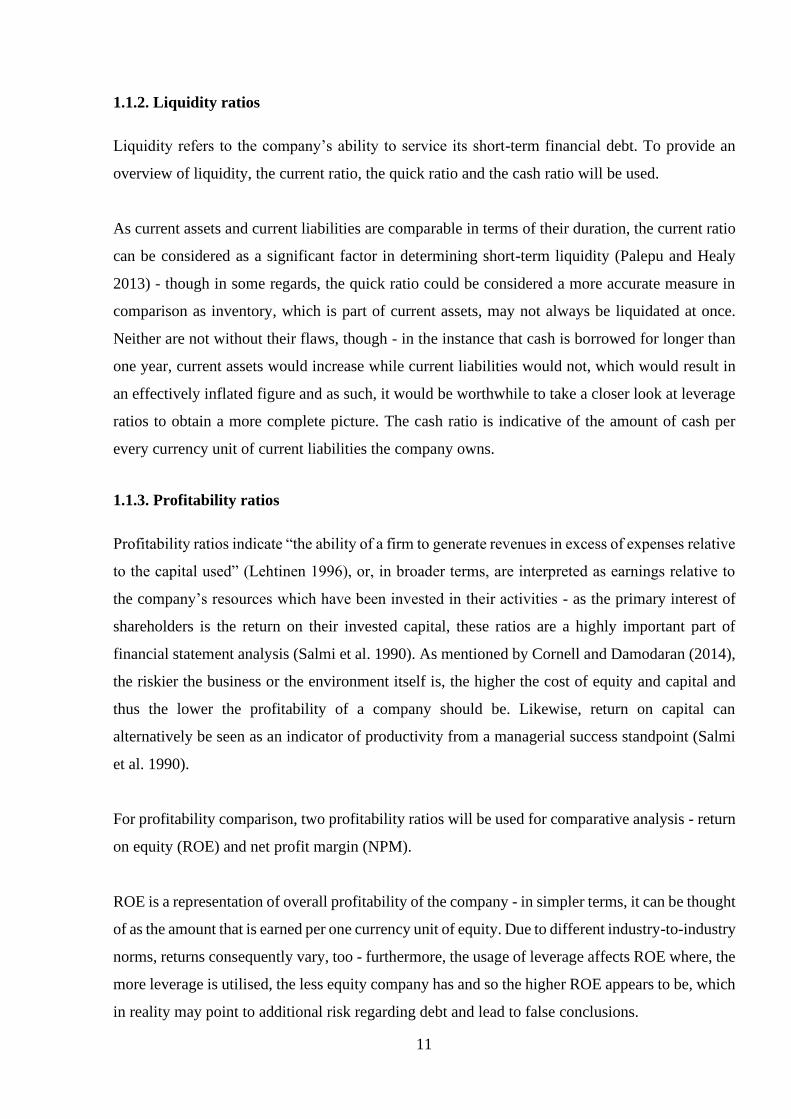
1.1.2. Liquidity ratios ............................................................................................................ 11
1.1.3. Profitability ratios ........................................................................................................ 11
1.1.4. Turnover ratios ............................................................................................................ 12
1.1.5. Market value ratios ...................................................................................................... 12
1.2. Failure prediction ................................................................................................................ 13
1.3. Vertical and horizontal analysis ......................................................................................... 15
2. OVERVIEW OF THE ELECTRIC CAR PRODUCTION INDUSTRY .................................. 17
2.1 Industry overview .................................................................................................................... 17
2.2. Overview of Tesla, Inc. and Nissan Motor Company ........................................................ 18
3. FINANCIAL ANALYSIS OF TESLA, INC. AND NISSAN MOTOR COMPANY .............. 21
3.1. Comparative ratio analysis ................................................................................................. 21
3.2. Comparative failure prediction analysis ............................................................................. 26
3.3. Vertical analysis ................................................................................................................. 27
3.4. Horizontal analysis ............................................................................................................. 28
3.4. Findings and suggestions .................................................................................................... 30
CONCLUSION ............................................................................................................................. 32
LIST OF REFERENCES .............................................................................................................. 33
APPENDICES ............................................................................................................................... 38
Appendix 1. Balance sheet of Tesla, Inc., FY2015-2018 (mUSD) ........................................... 38
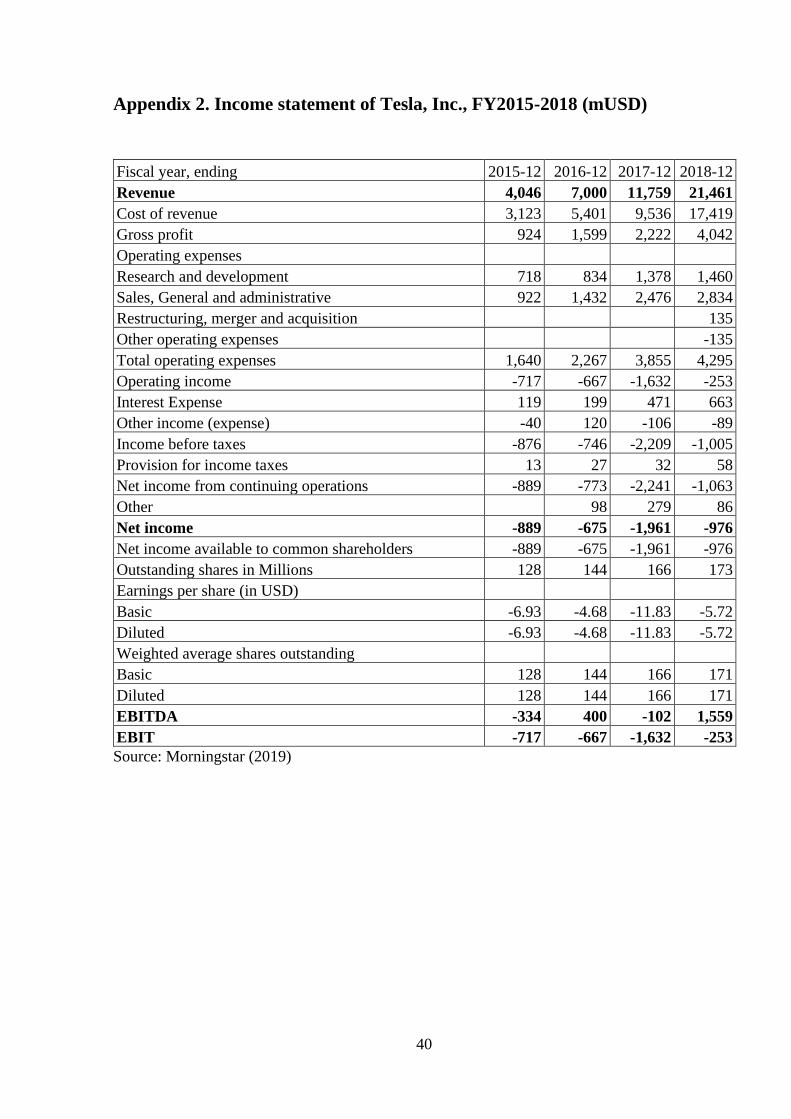
Appendix 2. Income statement of Tesla, Inc., FY2015-2018 (mUSD) ..................................... 40
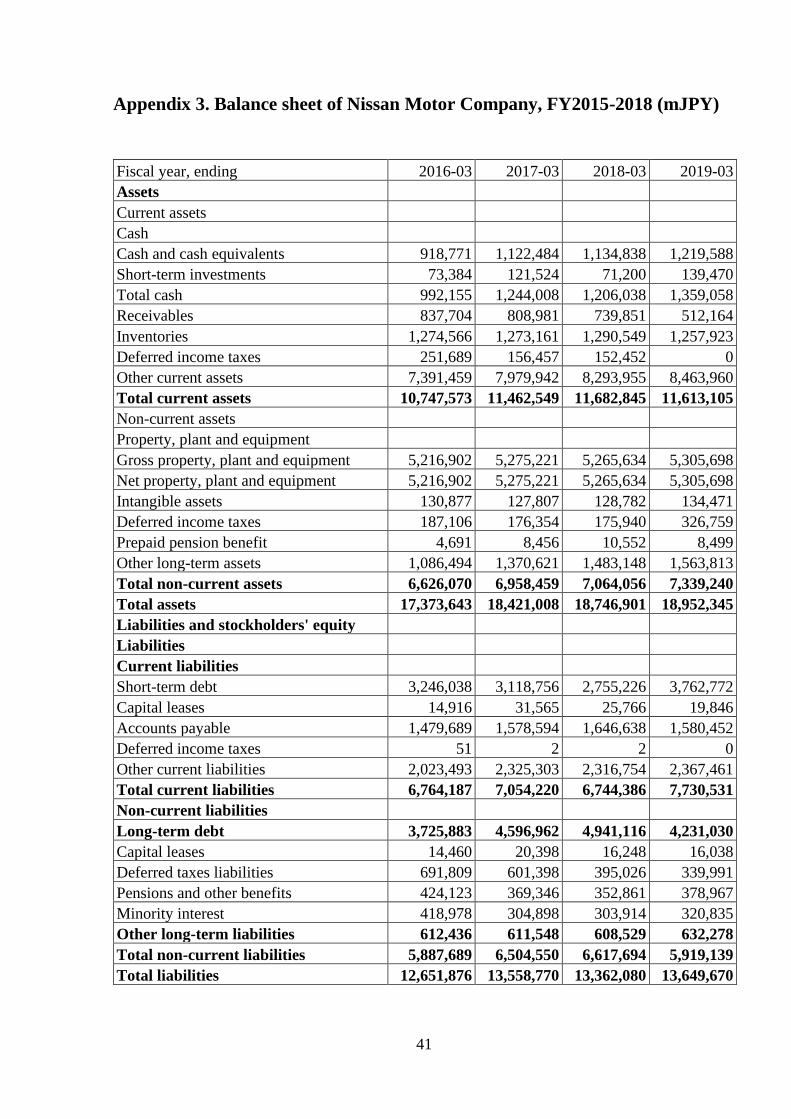
Appendix 3. Balance sheet of Nissan Motor Company, FY2015-2018 (mJPY) ....................... 41
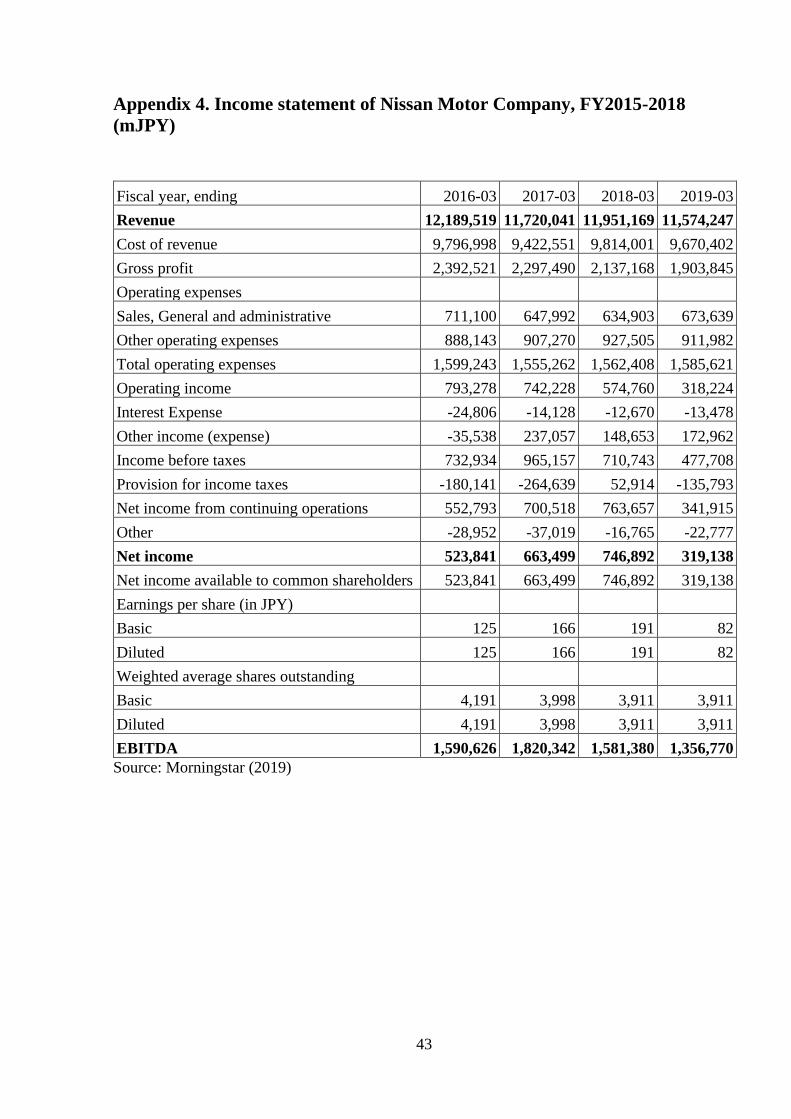
Appendix 4. Income statement of Nissan Motor Company, FY2015-2018 (mJPY) ................ 43
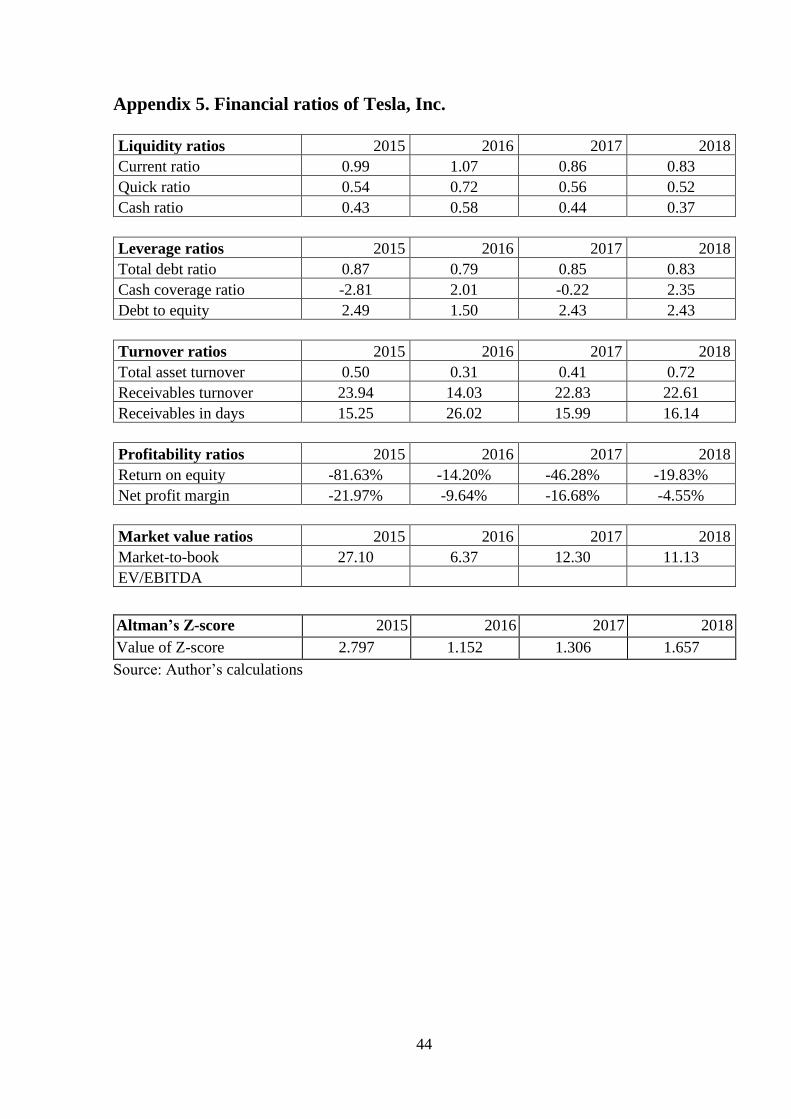
Appendix 5. Financial ratios of Tesla, Inc................................................................................. 44
Appendix 6. Financial ratios of Nissan Motor Company .......................................................... 45
Appendix 7. Formulas of financial ratios used .......................................................................... 46

4
ABSTRACT
Tesla, Inc. is perhaps the most well-known electric car manufacturer at the time of writing, having
developed a strong following in its relatively short existence due in part to its more advanced
technology as well as its forward-looking vision. This has caused industry-leading automobile
manufacturers to react in response to Tesla, Inc’s technological advantage, introducing rapid
development and competition within the electric car segment of the automobile industry.
This thesis compares the financial performance of Tesla, Inc. to Nissan Motor Company, whose
top-selling electric car model and globally the most well-selling electric car to date, the LEAF, is
a competitor to Tesla’s recently-released Model 3, the least expensive model Tesla has to offer at
the time of writing. Comparative financial statement analysis will be used by analysing and
comparing five types of financial ratios and Altman’s Z-score, as well as conducting vertical and
horizontal analysis of the balance sheets and income statements of both companies during the years
2015 to 2018.
The findings suggest that despite significant, five-fold revenue growth during the four-year period,
Tesla, Inc. remains in poor financial condition in comparison to Nissan Motor Company due to
large production-related investments and R&D efforts as part of its rapid path of growth in an
effort to maintain its technological lead in the electric car segment. Tesla was able to achieve its
first profitable quarter during that period in Q4 of 2018, followed by a profitable Q3 in 2019.
Keywords: financial ratio analysis, financial ratio, electric car industry

5
INTRODUCTION
The automobile manufacturing industry is one with a high barrier to entry both in terms of
competition and capital requirement - taking into consideration most household names in the car
industry were founded in the late 19th and early 20th century, it is somewhat surprising for Tesla
to have come as far as it has in its, speaking in relative terms, short existence as a car manufacturer.
It has offered competition and, by association, driven developmental progress within the industry
when it comes to both drivetrain and battery cell technology, the latter benefitting from its
partnership with Panasonic Corporation, prompting market leaders like Nissan Motor Company,
Daimler AG and Volkswagen Group to develop battery electric vehicles (BEVs) and their
supporting charging infrastructure of their own.
The primary reason behind choosing Tesla, Inc. and Nissan Motor Company as the two companies
to compare is the fact Nissan’s most well-selling electric car, the Leaf, is the best-selling electric-
powered car worldwide and as such, a direct competitor to the recently released Tesla Model 3,
which is the least expensive and the most mass adoption-directed car model Tesla, Inc. has to offer
at the time of writing. Furthermore, the car manufacturing industry is one with a known high barrier
to entry (due in part to its capital intensity) and Tesla has, thus far, managed to outperform the
expectation of becoming another failed venture in the industry while simultaneously developing
mould-breaking technologies and supportive infrastructure as well as offering considerable
competition to the already long-standing manufacturers through rapid development cycles.
Data from 2015 to 2018 will be compared so as to involve reasonable amounts of data in the
comparison itself - additionally, the time period chosen was partly influenced by the Volkswagen
emissions scandal that occurred in late 2015, a turbulent period passenger car manufacturing
industry as it lead to consumer distrust towards fossil fuel-powered vehicles and helped bring
further attention to alternative fuel-powered vehicles, including battery-electric vehicles (BEVs).

6
The goal of this thesis is to evaluate and compare the financial performance of Tesla, Inc. to Nissan
Motor Company through the use of financial ratios along in addition to vertical and horizontal
analysis of their annual financial data.
The thesis centers around the two main aspects: comparing a new car manufacturer in a new
segment of its market to an established car manufacturer in the process of transitioning into that
segment, and determining whether Tesla’s strategy of growth is risky enough to cause it to go
bankrupt. The analysis will be performed by means of comparative financial statement analysis,
with five types of financial ratio analysis as well as vertical and horizontal analysis of both
companies’ balance sheets and income statements throughout the years 2015 to 2018 being used
as the basis for analysis.
As financial ratios combine multiple sources of data into a single number, the context of the source
information may be lost in translation, requiring further, more in-depth analysis - also, reliable and
comprehensive industry-specific ratio norms on a global scale are not readily available with
regards to automobile manufacturing. As such, use of industry average ratios will be explicitly
mentioned in the subchapters of Chapter 3.
While Nissan Motor Company’s LEAF model is a leader in electric car sales and is thus a
competitor to Tesla, Inc. in this particular vehicle market segment, it also produces regular fossil
fuel-powered cars - i.e. its revenue is not derived primarily from electric nor hybrid vehicle sales
and their supportive infrastructure as is the case with Tesla. Furthermore, it must be considered
that unlike Tesla’s fiscal year, which ends in December, Nissan’s fiscal year ends in March and as
such, a nine-month shift exists between the two company’s fiscal years – to further add, car sales
are seasonal, peaking in spring months (Federal Reserve 2018). Being a long-standing
manufacturer, Nissan benefits from having multiple manufacturing plants globally in addition to
having supply chains already in place, amongst other factors.
The structure of the thesis consists of three main chapters - the overview of financial statement
analysis, the overview of the market the two companies are in as well as of the two companies
themselves and lastly, the financial analysis itself along with suggestions derived from the analysis.
The first chapter describes the analysis methods that will be used in conducting further analysis,
describing in detail the ratios, Altman’s Z-score formula as well as vertical and horizontal analysis
methods. The second chapter provides a brief overview of the electric car industry and a

7
description of the driving forces behind electric car adaptation, along with descriptions of both
companies and lastly, the third chapter describes the results of the conducted analysis as well as
possible explanations of the causes behind the results, outlining the conclusive results of the
analysis and suggestions.
The author would like to thank his closest friend for providing the basis for the idea, the supervisor
of this thesis for supportive ideas and improvements and additionally, friends from university for
providing continuous motivation while writing this thesis.

8
1. FINANCIAL STATEMENT ANALYSIS OVERVIEW
This chapter will provide an overview of various methods applied in the analysis of the financial
data used in this thesis.
The aim of conducting financial analysis is to determine the performance of a company relative to
its goals and market strategy (Palepu and Healy 2013). Depending on the role of the party
performing the analysis, the need for financial analysis is driven by the need for clarification before
a decision is made - for example, a credit institution has interest in the extent to which additional
debt obligations affect the operations of a company to determine a level of risk, while the
management of a company may want to conduct analysis of their competitors to determine their
strengths and weaknesses. The differences in accounting principles, causing differences regarding
inventories, depreciation and write-offs, as well as other aspects such as unanticipated changes in
balance sheet or income statement items, similarly constitute the need for analysis. Financial
statements that have been audited are to be used in such analysis as they are reviewed and approved
by an auditor who by definition is a trustworthy party independent of the management of a
company, which consequently adds to the credibility and the validity of the published financial
data as such statements for publicly traded companies are required by regulatory authorities on an
annual basis. Audited financial data can be usually obtained from the companies’ own websites,
as well as stock exchange websites and public databases such as Nasdaq or Morningstar.
1.1. Financial Ratios
Financial ratios can be used to time-efficiently determine the performance of a company as they
provide a meaningful way to study the relationships by combining two or more financial figures
into one (Ross et al. 2013). In terms of financial ratios, they can be expressed as a percentage, a
product of division or as a proportion of another figure. Ratio analysis enables the user to compare
data throughout several years, compare the analysed company to another company operating in

9
the same industry or compare the data to an absolute benchmark (Palepu and Healy 2013) and is,
by design, meant to “facilitate comparisons by eliminating size differences across firms and over
time (White et al. 1997). A more in-depth table including the underlying formulas for the
subsequent ratios used in this thesis can be found in Appendix 7.
The relevance and usage of a financial ratio highly depends on the role of the user in question - for
example, to a creditor, it is of relevance that the enterprise in question has the capacity to meet
their potential debt obligations, whereas an investor would utilize ratios so as to determine, with
some degree of accuracy, the value of a given company presently or at some point in time in the
future - the management board of a company, however, is interested in both of the aforementioned
qualities as it serves in their own best interest that investors as well as creditors are both content
in order for the company to obtain capital at the best possible terms available (Tugas 2012). Taking
the aforementioned aspects into account, it is noteworthy to mention that there is no so-called
“officially agreed-upon by a regulatory body” way to calculate financial ratios, which can, in some
instances with no additional clarification, lead to confusion (Ross et al. 2013). As such, before
comparisons can be drawn between companies and their ratios, it is of importance to know the
source formulas of the ratios being compared. One of the primary advantages of ratio analysis is
the ability to draw comparisons regarding risk and return between firms of different sizes operating
within the same industry (White et al. 1997).
Furthermore, ratios on their own may not paint a clear picture of a company’s financial state as,
for example, they can be affected by the seasonality of the industry (requiring a closer look at
quarterly data as opposed to annual) as well as by the company conducting business activities in
different industries simultaneously (rendering comparisons to industry average figures somewhat
illogical). As a consequence, it is worthy to keep in mind that extreme accuracy is not to be chased
after in calculations of financial ratios and additionally, that only appropriate and reasonable ratios
that are suitable relative to the company’s activities are to be applied in such analysis (Brookson
2001). Furthermore, as noted by White et al. (1997), due to the aforementioned factors in this
paragraph, the integrated use of ratios is required, for example, alongside the discounted cash flow
valuation method. This is especially true in relation to ratios relying on the price of the company’s
stock as from a behavioural standpoint, investors do not always act in a rational way, i.e. act based
on and derive decisions from logical conclusions. An example of this is seen in Figure 7 on page
25 of this thesis, in the EV/EBITDA ratio values for Tesla, Inc – between FY2016 and 2017, its
value swung, in absolute terms, over 6.5-fold into the negative due to a 46% increase in its stock

10
price despite a near 11% reduction in equity year-over-year and EBITDA falling by $502 million
to $-102 million.
As for the classification of financial ratios, there are several categories by which they can be
categorised. As stated by Ross et al. (2013), they can be largely categorised into five categories -
leverage, liquidity, profitability, market value and turnover ratios. These categories shall be used
moving forward.
1.1.1. Leverage ratios
Leverage ratios are an indication of the amount of borrowed capital used relative to equity.
Excessive use of leverage puts the company at risk of being unable to service their debt - using
leverage, profitability can be increased during economic upswings, but such debt obligations might
a burden during an economic downturn and is thus a “double-edged sword, increasing profits
during good times but compounding losses during bad times” (Horngren and Harrison 2007).
To compare leverage between the two companies, three ratios will be used - the cash coverage
ratio, the total debt ratio and the debt-to-equity ratio. The former represents a company’s ability to
cover its annual interest expense, while the second ratio represents how much debt the company
has per one currency unit of invested equity - the last ratio depicts the proportion of debt that
comprises its assets.
The cash coverage ratio indicates the amount of times the company has cash to cover its interest
expenses, should it need to do so immediately. Though depreciation and amortisation are, on
occasion, excluded in some sources, Ross et al (2013) notes that excluding those two aspects would
be incorrect as they are both non-cash expenses and would consequently present an incorrect view.
The total debt ratio depicts the proportion of a company’s assets that is debt - the higher the ratio,
the more leveraged the company is.
The debt-to-equity ratio is indicative of the multiple of times that a company has debt in
comparison to its own funds - consequently, it is also a measure of risk as the higher value it is,
the more debt-related risk is involved.
11
1.1.2. Liquidity ratios
Liquidity refers to the company’s ability to service its short-term financial debt. To provide an
overview of liquidity, the current ratio, the quick ratio and the cash ratio will be used.
As current assets and current liabilities are comparable in terms of their duration, the current ratio
can be considered as a significant factor in determining short-term liquidity (Palepu and Healy
2013) - though in some regards, the quick ratio could be considered a more accurate measure in
comparison as inventory, which is part of current assets, may not always be liquidated at once.
Neither are not without their flaws, though - in the instance that cash is borrowed for longer than
one year, current assets would increase while current liabilities would not, which would result in
an effectively inflated figure and as such, it would be worthwhile to take a closer look at leverage
ratios to obtain a more complete picture. The cash ratio is indicative of the amount of cash per
every currency unit of current liabilities the company owns.
1.1.3. Profitability ratios
Profitability ratios indicate “the ability of a firm to generate revenues in excess of expenses relative
to the capital used” (Lehtinen 1996), or, in broader terms, are interpreted as earnings relative to
the company’s resources which have been invested in their activities - as the primary interest of
shareholders is the return on their invested capital, these ratios are a highly important part of
financial statement analysis (Salmi et al. 1990). As mentioned by Cornell and Damodaran (2014),
the riskier the business or the environment itself is, the higher the cost of equity and capital and
thus the lower the profitability of a company should be. Likewise, return on capital can
alternatively be seen as an indicator of productivity from a managerial success standpoint (Salmi
et al. 1990).
For profitability comparison, two profitability ratios will be used for comparative analysis - return
on equity (ROE) and net profit margin (NPM).
ROE is a representation of overall profitability of the company - in simpler terms, it can be thought
of as the amount that is earned per one currency unit of equity. Due to different industry-to-industry
norms, returns consequently vary, too - furthermore, the usage of leverage affects ROE where, the
more leverage is utilised, the less equity company has and so the higher ROE appears to be, which
in reality may point to additional risk regarding debt and lead to false conclusions.
12
NPM is a representation of the company’s ability to generate profit relative to sales, less expenses
- to draw similarities between the example mentioned in the previous subchapter, net profit margin
can be thought of as the amount of money the company is left with after expenses have been
deducted, relative to one currency unit of sales. As is the case with all profitability ratios, the higher
the figure, the better.
1.1.4. Turnover ratios
Turnover ratios are indicative of a firm’s usage of its assets as they are descriptive of the extent to
which a company uses its assets in terms of efficiency and usage intensity (Ross et al. 2013) - a
low sales-to-assets figure would be symptomatic of room to improve the utilisation of assets to
generate sales, for instance. As turnover ratios provide an overview of past managerial efficiency,
future efficiency can be predicted on a reasonable basis (Glauntier and Underdown 1995). Such
ratios also vary greatly based on the nature of the industry - a good case in point is the very industry
under examination - automobile manufacturing, a capital-intensive industry where such ratios
would be considerably lower to those of service-based industries. An asset-turnover and a
receivables-turnover ratio will be included in the analysis.
The total asset turnover ratio used in the thesis represents the value of sales made per one currency
unit worth of the company’s total assets, i.e. how many currency units worth of sales a company
can generate per one CU of its assets. The receivables turnover ratio is representative of the
multiple of times that the sum of accounts receivable is loaned out to a company’s clients or
customers, or alternatively, how many times per year the company collects its amount of
receivables. When dividing 365 by the latter ratio value, the answer indicates the average amount
of days the company is owed money to for the sales it has made but not received money for.
1.1.5. Market value ratios
Market value ratios are useful in determining the valuation level of a given firm, i.e. whether it is
fairly, over- or undervalued. Because the value of any company is of importance, it is a point of
interest to parties like shareholders and the firm’s own management for ROI as well as public
perception reasons. Such ratios may not be applicable in all instances as private companies lack a
market value due to not being traded on the stock market. The choice of ratios may further be

13
limited assuming the inclusion a company’s annual earnings in the formula as the use of negative
earnings would result in a nonsensical ratio value.
The market-to-book ratio is also known as the “P/B ratio”, “P/B” standing for “price-to-book”. It
is indicative of the multiple of times of the market’s willingness to pay for a share of a company
in comparison to the company’s share price as per its own book value.
In this instance, the book value is represented by result of dividing the total equity of the company
by the average number of outstanding common stock. In the case of both Tesla, Inc. and Nissan
Motor Company, neither has outstanding preferred stock and thus will not be included in the
calculations. Historical price data from Nasdaq and Yahoo Finance will be used as a basis for
calculating the market value of both companies, respectively.
The Enterprise Value EV/EBITDA ratio is well-known valuation ratio. As defined by Damodaran
(2018), it is a measure of a company’s market value of assets against the cash flow generated by
those assets before tax obligations and other expenses. As is the case with the other mentioned
ratios, there is not a clearly defined range in which a company is over-,under- or fairly valued as
it varies from industry to industry, meaning for comparative value analysis purposes, the author
will rely on the global Auto & Truck industry average ratio values for FY2017 previously
calculated by Damodaran (2018), encompassing 133 manufacturers.
1.2. Failure prediction
In an empirical analysis performed by Glautier and Underdown (1995), it was found that, by
utilising financial ratio analysis, companies with a higher likelihood of failure could be
differentiated from financially healthy companies with an accuracy rate above that of a random
prediction, no less than five years before the actual bankruptcy - though it is notable that “the
ability of ratios alone to predict corporate collapse has not been conclusively proved” and thus
should not form a single basis for analysis, but rather be used in combination with additional and/or
supplemental financial analysis data so as to reach a conclusive verdict. The principle of permanent
factors being the cause of business failure was also suggested in the same analysis - furthermore,
an inverse relationship existed between the accuracy of the bankruptcy prediction and the age of
the source data used where, the older the data was, the less accurate the prediction became - in this

14
particular instance, the initial 95% accuracy rate based on financial data from the prior year
dropped to 72% when data from two years before had been used.
Altman’s Z-score is a comprehensive way of gauging the bankruptcy risk of a company, or more
broadly, determining a company’s financial state of health. It is named after Edward Altman by
whom it was developed in the late 1960s (Altman et al. 2016). The Z-score is based on the principle
of combining multiple variables, financial ratios in this instance, into one on a weighted basis. As
found by Eidleman (1995) and Altman et al. (2016), the Z-score is accurate in approximately 75%
of instances and thus makes for a reasonable basis for evaluation. There are three primary formula
versions of Altman’s Z-score - for public, private and non-manufacturing companies. As both of
the companies to be analysed are publicly listed companies, the Z-score formula for public
companies shall be used. The other two versions take into consideration X₄ listed below, where
the market value of equity is substituted with the book value of equity, and X₅, which for non-
manufacturing companies is eliminated entirely due to lesser capital intensity, respectively -
moreover, different weights are applied accordingly for all three versions (Eidleman 1995).
The formula for Altman’s Z-score is:
𝒁 = 𝟏. 𝟐 × 𝑿₁ + 𝟏. 𝟒 × 𝑿₂ + 𝟑. 𝟑 × 𝑿₃ + 𝟎. 𝟔 × 𝑿₄ + 𝟎. 𝟗𝟗𝟗 × 𝑿₅ (1)
where
Z – index result,
X₁ – working capital/total assets,
X₂ – retained earnings/total assets,
X₃ – EBIT/total assets,
X₄ – market value of equity/book value of total liabilities,
X₅ – sales/total assets.
Source: Altman (2000)
Altman defined three ranges for the Z-score - for the version of the formula adjusted for publicly
traded manufacturing companies, the ranges are:
High risk of bankruptcy: <1.81
Zone-of-ignorance: 1.81 to 2.99
Non-bankrupt: >2.99
Source: Eidleman (1995)

15
A considerable aspect of the Z-score is X₄ as indicated above - more specifically, the market value
of equity in the numerator of this ratio. Assuming irrational behaviour in the stock market, the Z-
score would be artificially inflated by a market cap value that does not correspond to reality.
1.3. Vertical and horizontal analysis
Vertical analysis is a method of analysing the financial data of a company where each of the
balance sheet or income statement items is calculated as a proportion of assets as well as total
liabilities and owner’s equity, or as a proportion of net sales, respectively. As opposed to horizontal
analysis in which data from one year is compared to the year prior, vertical analysis is constrained
to a given year and enables companies of different sizes to be compared as figures are compared
to a respective common base figure, resulting in a percentage value.
In terms of the income statement, vertical analysis depicts what percentage of net sales goes
towards costs, expenses, depreciation and more, while vertical analysis of a balance sheet
indicates, for example, the proportion of cash to total assets or short-term liabilities to total
liabilities and owner’s equity. This, for example, enables the end user to see what percentage of a
company’s assets is comprised of its inventory or what percentage of sales goes towards servicing
debt.
Vertical analysis be effectively used when comparing two companies of different sizes operating
in the same industry as it useful in “comparing companies with each other for a particular time
period or comparing a company with industry or sector data” (Robinson et al. 2015).
Horizontal analysis is method of analysing the financial data of a company where the difference
between the current and previous year figures of a balance sheet or income statement item is found
and, in addition, divided by the previous year’s figure to determine the percentage by which the
item in question has grown or declined compared to the year prior (Robinson et al. 2015).
Horizontal analysis is advantageous in the context of potential year-to-year correlations and
changes between, for example, sales and cost of goods sold or interest-bearing liabilities and
interest expense.

16
An additional method of conducting horizontal analysis is by way of trend analysis where a base
year is chosen, commonly the first year of a given period, and subsequent years are compared by
dividing the following year with the base year chosen to get a percentage figure. As opposed to
the previously described method of horizontal analysis which presents a percentage of growth
compared to the previous year, trend analysis essentially shows the multiple of times a balance
sheet or income statement item has grown in comparison to the base year.

17
2. OVERVIEW OF THE ELECTRIC CAR PRODUCTION
INDUSTRY
This chapter will provide an overview of the electric car production industry as well as of the two
subject companies of the thesis.
2.1 Industry overview
According to the 2018 Global Electric Vehicle Outlook report compiled by the International
Energy Agency (IEA), global electric car sales totalled 1.1 million, a 54% increase compared to
the previous year, with China being the largest customer market by sales volume with 580,000
electric cars sold. In terms of the market share of electric cars, Norway is the leader with 39% of
all new registered vehicles being electric in 2017, with countries like The Netherlands and
Denmark similarly having an above-average market share of electric vehicles (IEA 2018).
When compared to annual automobile production figures made available by OICA, it becomes
evident that relative to total annual production figures, electric-powered vehicle sales make up a
relatively small proportion. This can be put down to most electric vehicles (EVs) typically
commanding a premium over vehicles powered by internal combustion engines due to increased
research and development expenses and higher overall production costs. That said, the recent
fundamental shifts in the car business have, too, been recognised by the Chair of the Board of
Directors of Nissan as detailed in the annual report for FY2018. Factors such as the lack of
charging infrastructure, range anxiety, long charging times and lifestyle incompatibilities are also
to be taken into consideration, which are mostly, if not all, a limitation of the currently available,
production-ready technology.
With the global electric vehicle stock surpassing the five million mark in 2018, up 63% from 2017
(IEA 2019), it is reasonable to assume the mentioned obstacles will be resolved in the near future
18
as adaptation of electric vehicles grows and the cost of the most expensive component in any
electric vehicle at the time of writing, the battery, lowers as more and more such vehicles are
produced and as solid state battery technology makes its way into production vehicles in the
coming decade. According to a report compiled by Deloitte (2019), the estimated “tipping point”
of an electric vehicle’s ownership cost equalising with its present counterpart will arrive in 2022
– on average, every 22th car sold in China in 2018 was electric, while in Europe and in the US,
that figure stood at around one in 41 (IEA 2019).
To help speed up the adaptation of electric cars, it likely comes as no surprise that in countries
with the highest volume or market share of electric car sales, government-supported incentives
and tax breaks related to car ownership are coincidentally offered - in the United States, for
example, a federal tax credit is available for every electric car sold, while in Norway, numerous
incentives have been made available for the 230,000 registered BEVs in an effort to pivot away
from non-zero emission vehicles – they are exempt from import taxes and annual road taxes, 25%
VAT upon purchase is waived and the use of bus lanes has been made available for EVs, too,
amongst other incentives. The Norwegian Parliament has furthermore set the goal of having every
vehicle sold in the country be a zero-emission (i.e. powered by electricity or hydrogen) vehicle by
the year 2025 (Norwegian Electric Vehicle Association 2019). Incentives such as tax breaks or
free land are often offered to manufacturers, too, in hopes of boosting the local economy through
newly-created jobs and trade – Tesla, for example, received free land for its first Gigafactory
location in Nevada while Rivian, a smaller American electric vehicle manufacturer, received tax
breaks from the state of Illinois, contingent on meeting employment and investment quotas
(Bushey 2019).
2.2. Overview of Tesla, Inc. and Nissan Motor Company
Tesla, Inc., named Tesla Motors at the time of founding, was founded in 2003, making it a new
car manufacturer in relative terms when considering the market leaders were founded in the late
19th of early 20th century. As at the end of 2018, it had a market cap of 44 billion USD and
employed 48,817 full-time employees (Yahoo Finance 2019). As a result of their partnership with
Panasonic in co-developing and manufacturing battery cells, Tesla has a key advantage when it
comes to vehicle range compared to other manufacturers – the ability to offer its few models with

19
vastly varying degrees of performance at different price levels, enabling to cater to a much wider
customer base than its competition despite a small product portfolio. To demonstrate an example
of this – at the time of writing, the least expensive trim level of the Model 3, the Standard Range
Plus, with a maximum range of 409 kilometres, starts from a price of 39,500 euros - the least
expensive Nissan Leaf in comparison starts from 35,800 euros, but also has only 66% of the Model
3’s range and inferior performance. The closest equivalent trim level of the Leaf in terms of range,
however, starts from 43,600 euros – some 10% more expensive (Nissan 2019). The company also
benefits from selling directly to the consumer as opposed to sales flowing through manufacturer-
approved dealerships – a unique approach in this industry and from another perspective, a
necessary measure from Tesla’s perspective to help retain a higher margin on sales and build brand
loyalty. In relation to the latter, the company has been able to cultivate a following through its
technological achievements and marketing strategies that is unlike that of other car brands, ranging
from out-of-the-box car model designs to media events that are more akin to game console reveal
events than showing off a design concept mock-up at an international car show - all of which has
helped Tesla build the brand image and loyalty that it has today.
Figure 1. Closing stock price of Tesla, Inc. at the last trading day of each respective fiscal year and
its relative change from the previous years’ respective trading days
Source: Nasdaq (2019)
Nissan Motor Company was founded in 1933, some 80 years earlier, making it an experienced
automobile manufacturer in the industry. As at the end of FY2018, it had a market cap of 40.6
billion USD and employed 138,910 full-time employees (Yahoo Finance 2019) with a production
volume nearing 6 million vehicles in 2017, which is the equivalent of 6 percent of the global annual
240.01
213.69
311.35 332.80
7.91%
-10.97%
45.70%
6.89%
-20.00%
-10.00%
0.00%
10.00%
20.00%
30.00%
40.00%
50.00%
0
50
100
150
200
250
300
350
2015 2016 2017 2018
US
D,
closi
ng
Tesla, Inc. Relative change
20
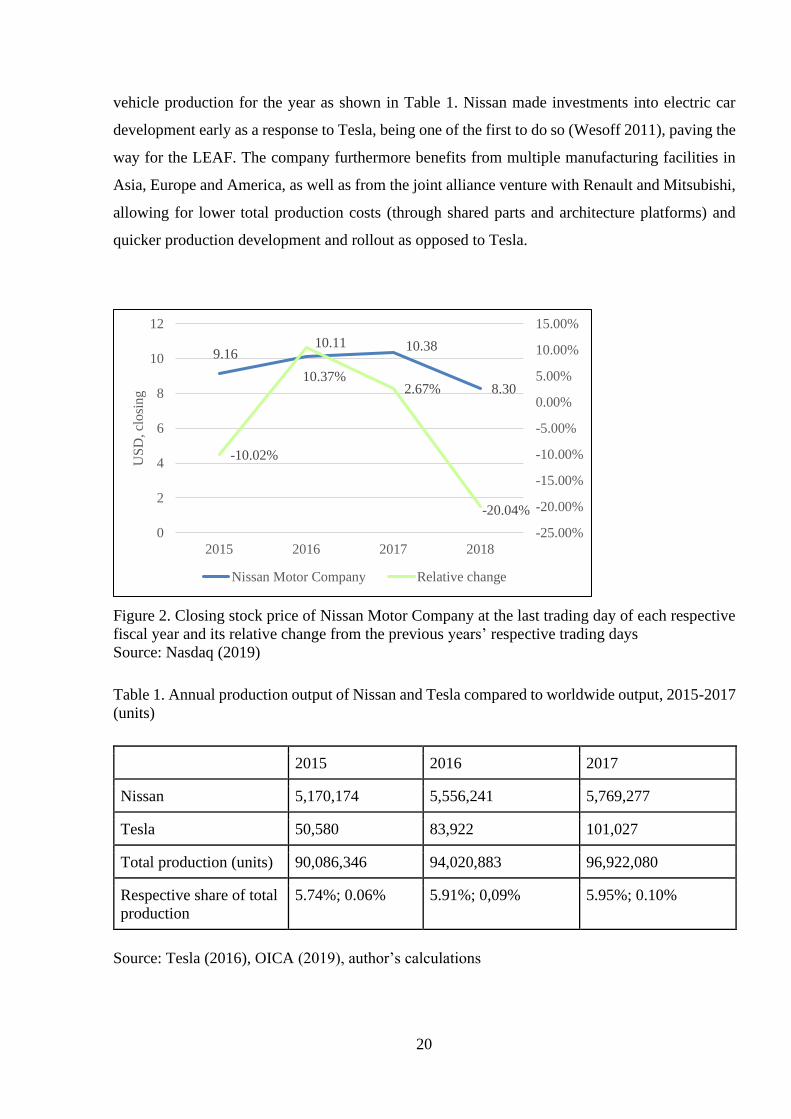
vehicle production for the year as shown in Table 1. Nissan made investments into electric car
development early as a response to Tesla, being one of the first to do so (Wesoff 2011), paving the
way for the LEAF. The company furthermore benefits from multiple manufacturing facilities in
Asia, Europe and America, as well as from the joint alliance venture with Renault and Mitsubishi,
allowing for lower total production costs (through shared parts and architecture platforms) and
quicker production development and rollout as opposed to Tesla.
Figure 2. Closing stock price of Nissan Motor Company at the last trading day of each respective
fiscal year and its relative change from the previous years’ respective trading days
Source: Nasdaq (2019)
Table 1. Annual production output of Nissan and Tesla compared to worldwide output, 2015-2017
(units)
2015 2016 2017
Nissan 5,170,174 5,556,241 5,769,277
Tesla 50,580 83,922 101,027
Total production (units) 90,086,346 94,020,883 96,922,080
Respective share of total
production
5.74%; 0.06% 5.91%; 0,09% 5.95%; 0.10%
Source: Tesla (2016), OICA (2019), author’s calculations
9.1610.11 10.38
8.30
-10.02%
10.37%2.67%
-20.04%
-25.00%
-20.00%
-15.00%
-10.00%
-5.00%
0.00%
5.00%
10.00%
15.00%
0
2
4
6
8
10
12
2015 2016 2017 2018
US
D, cl
osi
ng
Nissan Motor Company Relative change
21
3. FINANCIAL ANALYSIS OF TESLA, INC. AND NISSAN
MOTOR COMPANY
In this chapter, the results of the financial data analysis are presented. The exact results can be seen
in Appendices 5 and 6.
3.1. Comparative ratio analysis
Leverage ratios
As can be seen from Nissan’s balance sheet in Appendix 3, due to having very small interest
expenses in comparison to Tesla, Nissan is in a far better position to cover its interest-related
expenses. The large jump between 2016 and 2017 for Nissan is primarily caused due to a sharply-
increased cash balance.
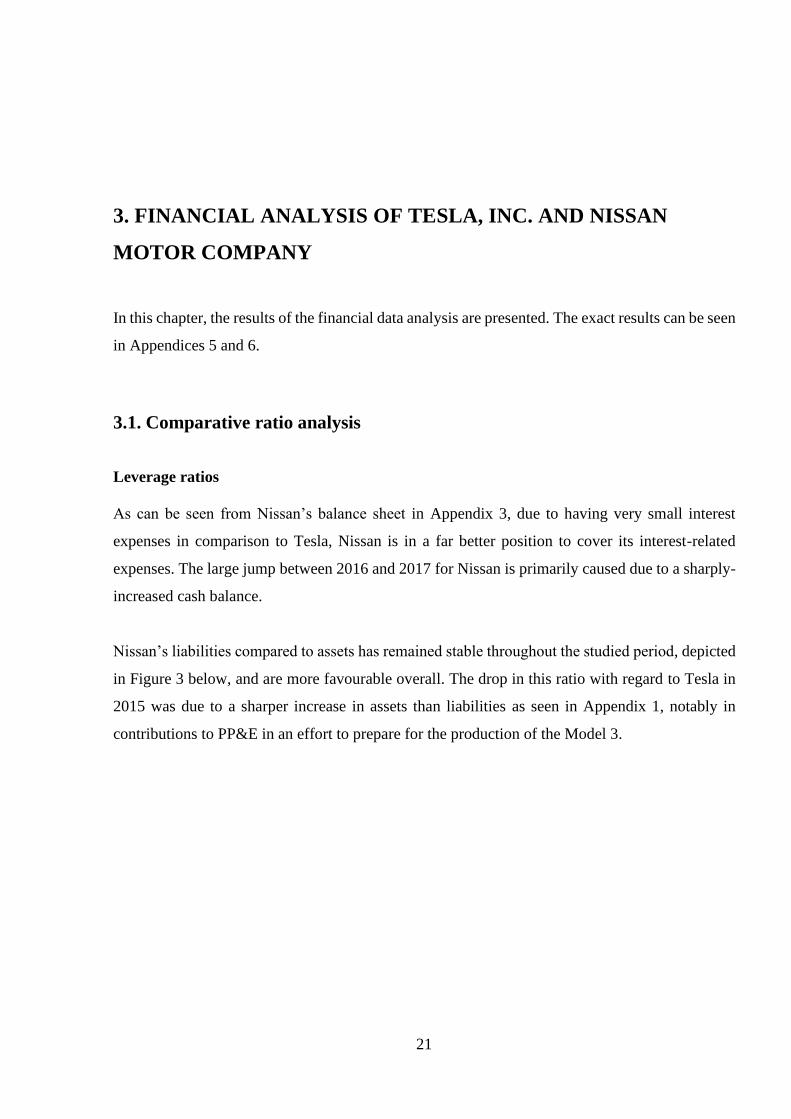
Nissan’s liabilities compared to assets has remained stable throughout the studied period, depicted
in Figure 3 below, and are more favourable overall. The drop in this ratio with regard to Tesla in
2015 was due to a sharper increase in assets than liabilities as seen in Appendix 1, notably in
contributions to PP&E in an effort to prepare for the production of the Model 3.
22
Figure 3. Debt-to-equity ratio values of Tesla, Inc. and Nissan Motor Company
Source: Author’s calculations
Similarly to the previous ratio, Nissan is in a more favourable position as it utilises far less debt
relative to its own equity, meaning lesser risk and reliance on external funding.
Liquidity ratios
When it comes to the current and quick ratio, Nissan is, similarly, in a significantly more
favourable position in comparison to Tesla. It also becomes evident that, as the difference between
the two ratios is the subtraction of inventory in the latter ratio, Nissan is anywhere from two to
three times as liquid in the short-term, seen in Figure 4, with Tesla having just around half a dollar
of current assets per current liabilities.
The exclusion of Tesla’s inventory from its ratio calculations also has a more significant impact
compared to Nissan, the difference being between 0.30 to 0.40 as opposed to 0.20 in Nissan’s
instance, meaning Tesla is operating on a lean basis and in a constant need for working capital.
With the exception of 2016 in Tesla’s case, the liquidity of both companies has generally remained
at a similar level throughout the four years.
2.49
1.50
2.43 2.43
1.481.59
1.43 1.51
0.00
0.50
1.00
1.50
2.00
2.50
3.00
2015 2016 2017 2018
Tesla
Nissan

23
Figure 4. Quick ratio values of Tesla, Inc. and Nissan Motor Company
Source: Author’s calculations
Throughout the four-year period, Tesla has had anywhere from two to over four times the cash at
hand to cover its current liabilities. While this fluctuation could be seen as a positive aspect, it
could also be indicative of having to constantly service debt, which, in reality, is the case with
Tesla.
Profitability ratios
As shown in Appendices 5 and 6, Tesla uses significant leverage and at the same time, has
significant expenses, it’s understandable that its return on equity is negative - while showing a
trend of improvement from 2015 to 2018, such a deeply negative return is not a hopeful indication.
Its counterpart, however, has maintained a steady ROE growth of approximately 2% per year.
Considering the average 2017 ROE of 10.38% in the Auto & Truck industry, Nissan had been
above the average three times, except in 2018 when its return on equity was 6.02%.
Both companies display a trend of improvement in this case, with Tesla’s margin improvements
being the more substantial ones in this comparison. Compared to the 2017 global Auto & Truck
industry average net profit margin of 4.76% (Damodaran 2018), Nissan managed to beat the
average twice, with its net profit margin growing by over two percent over three years, impacted
in 2018 by loss of sales in the US as well as Europe due to an aging product portfolio and ever-
stricter emission policies (Nissan 2018).
0.54
0.72
0.56 0.52
1.40 1.441.54
1.34
0.00
0.20
0.40
0.60
0.80
1.00
1.20
1.40
1.60
1.80
2015 2016 2017 2018
Tesla
Nissan
24
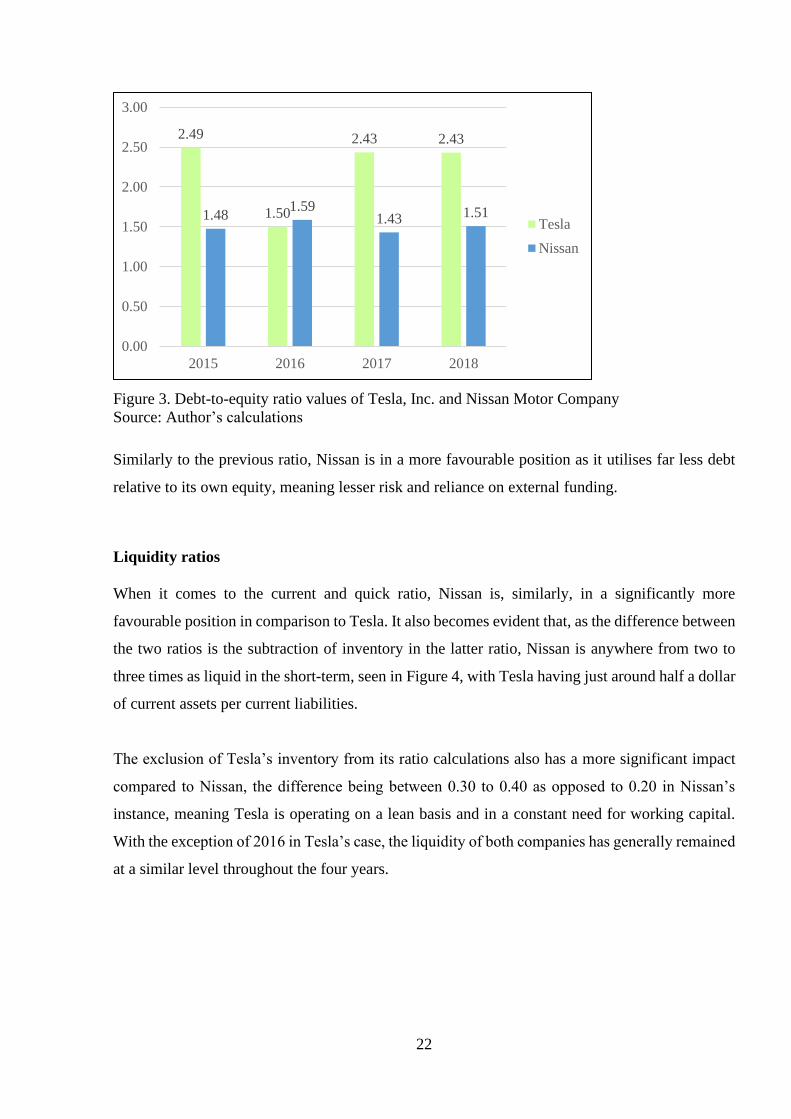
Figure 5. Annual net profit margin values of Tesla, Inc. and Nissan Motor Company
Source: Author’s calculations
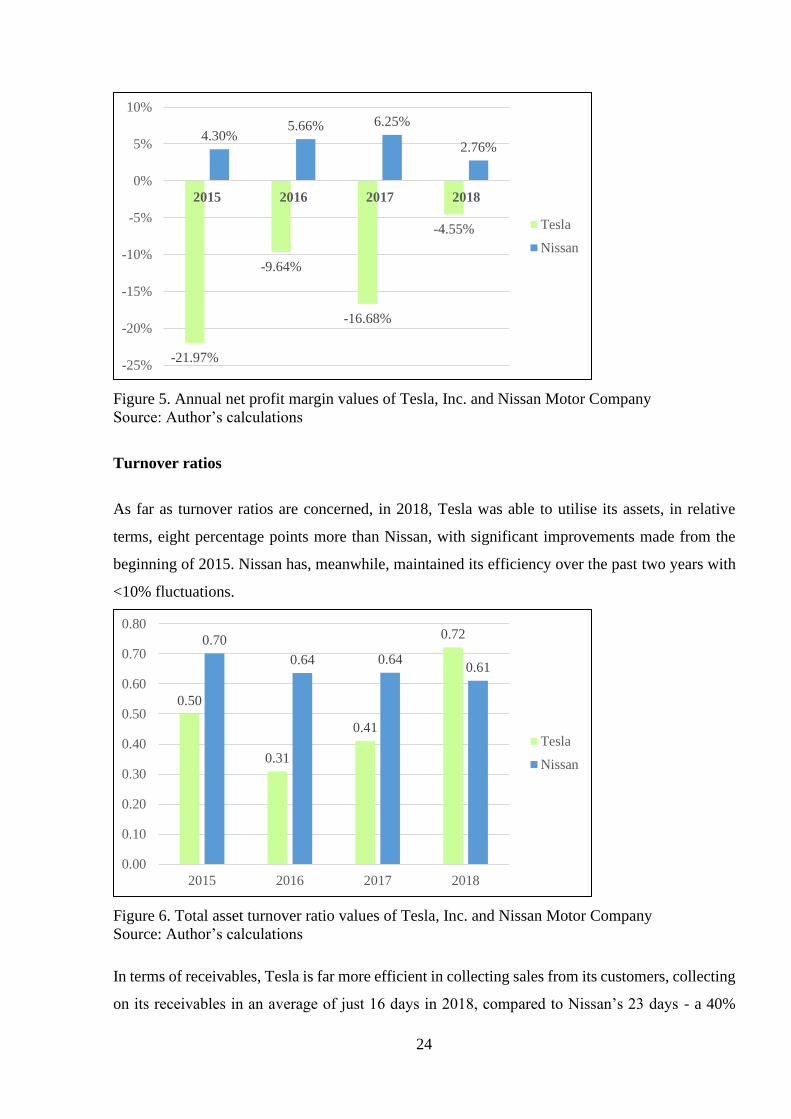
Turnover ratios
As far as turnover ratios are concerned, in 2018, Tesla was able to utilise its assets, in relative
terms, eight percentage points more than Nissan, with significant improvements made from the
beginning of 2015. Nissan has, meanwhile, maintained its efficiency over the past two years with
<10% fluctuations.
Figure 6. Total asset turnover ratio values of Tesla, Inc. and Nissan Motor Company
Source: Author’s calculations
In terms of receivables, Tesla is far more efficient in collecting sales from its customers, collecting
on its receivables in an average of just 16 days in 2018, compared to Nissan’s 23 days - a 40%
-21.97%
-9.64%
-16.68%
-4.55%
4.30%5.66% 6.25%
2.76%
-25%
-20%
-15%
-10%
-5%
0%
5%
10%
2015 2016 2017 2018
Tesla
Nissan
0.50
0.31
0.41
0.720.70
0.64 0.640.61
0.00
0.10
0.20
0.30
0.40
0.50
0.60
0.70
0.80
2015 2016 2017 2018
Tesla
Nissan

25
difference relative to Tesla - though it can be argued that it is vital for Tesla to collect on its sales
that much quicker so as to maintain its lean operations.
Market value ratios
Regarding Tesla’s market value, it is difficult to argue against the company being overvalued to
an extent when its constant losses and negative returns are taken into account, especially
considering its market cap doubling between 2016 and 2017 - an indication of severe volatility,
likely a result of speculative and irrational trading behaviour. On the contrary, by the same metric,
Nissan is what would be considered as rather undervalued, seemingly in part due to investor
inconfidence stemming from the company’s position within the alliance with Renault and the
continued public uncertainty, which is a result of the prosecution of its previous CEO over financial
misconduct related to misuse of the company’s assets and underreporting of income (Tacken
2019).
Figure 7. EV/EBITDA ratio values of Tesla, Inc. and Nissan Motor Company
Source: Author’s calculations
The figure of EV/EBITDA ratios above confirms the previously mentioned aspects. As mentioned
in Chapter 1, compared to Nissan, the ratio values for Tesla fluctuate severely and paints an almost
nonsensical picture when considering the volatility of its stock price, seen in Figure 1. The severe
variance between the years 2016 and 2017 was caused by EBITDA dropping to $-102 million
USD while the price of the stock increased by over 45% - that said, Nissan appears to be slightly
overvalued, too, taking into account the industry average of 9.37 for FY2017 (Damodaran 2018).
-92.70
84.85
-579.65
40.126.50 5.91 6.83 7.57
-700.00
-600.00
-500.00
-400.00
-300.00
-200.00
-100.00
0.00
100.00
200.00
2015 2016 2017 2018
Tesla Nissan

26
Figure 8. Price-to-book ratio values of Tesla, Inc. and Nissan Motor Company
Source: Author’s calculations
The P/B ratio values for both companies confirm the above-mentioned details. The average US
Auto & Truck industry P/B ratio value for FY2018 was 1.63 (Damodaran 2019), meaning Tesla’s
stock was valued just over 6.8 times above the industry average, while P/B ratio was 58% below
the US average.
3.2. Comparative failure prediction analysis
Though Tesla had a more financially healthy year in 2015 compared to Nissan going strictly by
this formula, it remains the only “healthier” year, with significant fluctuations yearly fluctuations,
especially between the years 2015 and 2016. The aforementioned fluctuation can be explained by
a decrease in the value of X₄ - as per their 2016 Form 10-K filing, sizable investments were made
in relation to the development and production efforts of the Model 3. That is in stark comparison
to Nissan, which, though at risk as per Altman’s defined range of classification, has remained
relatively stable, with its Z-score fluctuating by 0.051 between 2016 and 2017 at the most.
27.10
6.37
12.3011.13
0.92 0.88 0.80 0.69
0.00
5.00
10.00
15.00
20.00
25.00
30.00
2015 2016 2017 2018
Tesla Nissan

27
Figure 9. Altman’s Z-score values of Tesla, Inc. and Nissan Motor Company
Source: Author’s calculations
3.3. Vertical analysis
Vertical analysis of Tesla’s balance sheet reveals several aspects – firstly, the company is very
heavily invested in non-current assets, with an average of 71.75% of all assets comprising of
property, plant and equipment on the balance sheet across the studied four-year period – this is in
contrast to Nissan, whose gross property, plant and equipment makes up an average of just 29%
of total assets. Relative to total assets, Tesla’s current assets make up an average of 28% across
four years –in comparison to Nissan, it is almost perfectly reversed - its current assets consist of
62% of total assets on average, which is also reflected in the liquidity ratio comparison and is as
such indicative of Nissan’s more liquid position. Relative to each company’s respective
proportional amount of assets, Tesla keeps more cash, anywhere from two to four times, on hand
compared to Nissan as well.
On the liabilities side, the proportion of accounts payable is very similar between the two
companies, which is where the similarities come to an end. At FY2018 year-end for Tesla, over
83% of the company was financed by debt, with approximately a third of the company being
funded by long-term debt. Looking at Note 13 of Tesla’s Form 10-K for FY2018 which
summarises the company’s debt, the company has $11 billion worth of debt, $1.67 billion of which
is due in 2019. As per Appendix 2, in terms of the 2018 year-end cash and cash equivalents
balance, the total debt due in 2019 equates to 45% of it. Comparatively, Nissan operates on a 72/28
2.797
1.1521.306
1.6571.820 1.769 1.792
1.619
0.000
0.500
1.000
1.500
2.000
2.500
3.000
2015 2016 2017 2018
Tesla Nissan
28
split of liabilities-to-equity, with 91% of stockholders’ equity consisting of retained earnings.
Considering Tesla’s negative retained earnings, this leaves little room to argue against Nissan’s
more favourable financial performance for 2018.
Similarly to Tesla, Nissan’s cost of revenue and gross profit are both around the same figures, at
81% and 18% for 2018, respectively. Where they notably differ aside from income and profit-
related items, though, is operating and interest expenses. Concerning operating expenses, the
relative difference between the two companies was a surprising 27% in 2015, 19% in the two
following years and 7% in 2018 in Nissan’s favour, while interest expenses, percentagewise, were
over 27 times higher in Tesla’s case.
Though Tesla’s net income remained negative in 2018, EBITDA was positive at 7.3% of net sales,
fluctuating from -8% to the aforementioned figure throughout the years – in contrast, Nissan’s
EBITDA proportion of revenue has remained at a stable four-year average of 13.75%.
3.4. Horizontal analysis
As detailed in their latest Form 10-K, the depreciation incurred on PP&E has increased on an
annual basis due to the continuous investments into its production with the aim to automate as
much of the process and additionally, facilitate the production of the upcoming models, given their
rapid development cycle. Trend analysis suggests that there is not a single balance sheet item that
had not doubled at the very least by 2018 in comparison to 2015, with total assets having grown
by 3.68 times. Troublesome is the amount of debt that Tesla is continuing to pile upon itself with
short-term and long-term debt having increased by 406% and 452% during the studied period,
respectively, to a cumulative figure of nearly 12 billion USD by 2018 year-end, even though net
income shrunk even further by 87 million USD. That said, the expansion of the balance sheet in
general is in line with their aggressive expansion strategy and quick developmental cycle.
Nissan’s balance sheet in contrast has stayed fairly stable, with yearly growth being, in overall
terms, between 10 and 15%, with the outliers being its cash balance, which is exactly 1.5 times the
amount it was in 2015 having grown ~20-25% per year, and accumulated other comprehensive
income, which is a result of currency translations due to the financial data being compiled in
Japanese yen, having more than tripled over the course of four years.
29
When it comes to revenue, Tesla grown its revenue over five-fold in comparison to 2015, from
4.046 billion dollars to 21.461 billion dollars – an undoubtedly impressive achievement. Though
R&D expenses have doubled within the same period as well, as a percentage of revenue, it has
been declining yearly. Operating income had increased significantly in 2018 by $1.379 billion to
negative $253 million from 2017 – partially contributed to by the pre-order reservations for the
two upcoming models and the significantly increased production efficiency of the Model 3, as well
as by cost-saving measures through doing away with numerous physical store locations and
shifting more towards online sales in 2018 - all in addition to lowering employee headcount in the
beginning of the year as part of a restructuring plan. As expected, interest expense had grown by
457% in comparison to the base year. When it comes to net income, though it improved by nearly
$1 billion from 2017, losses still amounted to $976 million (Tesla 2017-2019).
In contrast, just as its balance sheet, Nissan’s income statement figures remains stable on the
whole, with approximately 10 to 15% changes year-on-year. Although 2018 revenue had grown
by just over 5% compared to 2015, net income had grown by over 63% to a record-setting 746.9
billion yen, which is due to the improvements Nissan had achieved in the Chinese market and due
to changes related to the American tax policy (Nissan 2017-2018).
30
3.4. Findings and suggestions
The overall results of the analysis present the view of mixed results in Tesla’s case and general
stability on the part of Nissan.
2017 was a particularly poor year for Tesla in financial terms as it aimed to finally get the Model
3 into the hands of their customers and the company did achieve that, but at a remarkable total
expense, ending the year with a near two billion dollar loss an in a highly illiquid financial state.
Ratio analysis revealed that while Tesla is in a better position from the standpoint of turnover-
related ratios and has significantly higher market value, Nissan is superior when it comes to
liquidity, profitability and usage of leverage.
With respect to Altman’s Z-score, both companies were somewhat close with the difference in the
2018 figures being apart by only 0.135. The overall lower score is typical of manufacturing
industries as higher capital requirements and lower margins contribute to a poor score as per the
standards outlined by Altman.
Vertical analysis of the balance sheet showed that, as similarly indicated by total debt ratio, Tesla
utilises proportionally more debt than Nissan with significantly less equity, indicative of potential
for instability and higher overall risks, with Nissan being invested in non-current assets and Tesla
having focused in investment in current assets, indicative of its aggressive growth profile.
Applying the same method of analysis to the income statement showed a considerable proportion
of sales going towards operating expenses in comparison to Nissan - similar was the case with
interest expenses, which is to be expected when looking at Tesla’s interest-bearing liabilities. The
rate of earnings compared to sales fluctuated a lot between the years, too, while it remained stable
in Nissan’s instance.
Horizontal analysis of the balance sheet depicted additional signs of Tesla’s aggressive growth as
there was not a single balance sheet item that had not doubled over the course of four years, with
investments made into PP&E as part of its efforts to increase the production rate of the Model 3 -
by association, short- and long-term debt also increased five-fold in both instances. Nissan’s
balance sheet by comparison grew in a stable fashion, with yearly increases being between 10 to
15% in most instances. Looking at the income statements of both companies, Tesla as grown its
revenue five times compared to 2015 from four billion to over 21 billion dollars, though net income

31
still declined by 87 million. Much like Nissan’s balance sheet, its income statement had improved
year-on-year, with revenue remaining at 2015 levels, but net income improving by over 60% in
2018 thanks to positive developments in the Chinese market and changes in the U.S. tax policy as
outlined in its latest annual report.
Considering the extent to which Tesla’s assets consist of PP&E and that significant investments
have already been made into long-term assets overall, combining production equipment usage
should be explored so as to avoid significant production-related expenses each time a new model
is put into production, as has happened with all of the previous models that Tesla currently sells.
This could be achieved through changes made in the design philosophy of the company’s car
models, more particularly through sharing a higher percentage of parts between models. That said,
Tesla is in a unique situation of its own and such large investments into manufacturing, research
and development are necessary at this stage.

32
CONCLUSION
Considering the stock market valuation of Tesla, Inc. and taking into consideration the fact that its
annual earnings per share have remained negative as indicated in its income statement, it is
apparent that the value of the company is in some aspects based upon its future potential and in
others, speculative views, especially considering when considering the financial performance as
well as annual manufacturing output and capabilities of Nissan - though it can be argued that with
high barriers to entry in the automobile manufacturing industry, it would take unusually long for
a new company to mature in terms of refining its operations and becoming profitable, which
seemingly could be the case in this instance. Although Tesla’s financials have improved recently
in many areas, notably regarding the amount of revenue and profitability margins, its costs
remained too high by any objective measure by the end of 2018 and as such, the length of the
process to become an economically viable operation will remain to be seen as such aggressive
growth cannot be endlessly fuelled and ultimately sustained by ever-increasing amounts of debt.
That said, so far it would appear that Tesla, though in a poor financial position compared to an
established manufacturer, is currently in a good overall market position given its superior
technology regarding drivetrain and battery cell technology, having got an early start ahead of
market leaders in this industry and thus far, been able to maintain that lead, too.
As the largest manufacturers in the industry are investing considerable resources in an effort to
close the technological gap that Tesla has created, it is the author’s view that the following four-
to five-year period will prove to be of utmost importance in determining if or when that lead will
start to close. Considering the volatility of Tesla’s stock price and the objectively irrational investor
behaviour surrounding the company, it would be difficult to recommend it as a sound, stable
investment, however bottomless the pockets of capital markets in combination with negative
interest rates may seem. This is not to say that Tesla will go bankrupt in the near-term, however,
as it very much is a functioning car manufacturer, operating in a very capital-intensive industry
that is projected to reach a profitable fiscal year within a similar timeframe as the one chosen for
this thesis.

33
LIST OF REFERENCES
Altman, E. I. (2000). Predicting financial distress of companies: revisiting the Z-score and ZETA
models. Stern School of Business, New York University.
Altman, E. I., Laitinen, E. K., Iwanicz‐Drozdowska, & M. Suvas, A. (2016). Financial Distress
Prediction in an International Context: A Review and Empirical Analysis of Altman's Z‐
Score Model. Retreived from https://onlinelibrary.wiley.com/doi/full/10.1111/jifm.12053,
03 March 2019.
Board of Governors of the Federal Reserve System. (2018). Retreived from
https://www.federalreserve.gov/releases/g17/mv_sales_sf.htm, 03 March 2019.
Bushey, C. (2019). Can Illinois out-innovate Elon Musk?. Chicago Business. Retrieved from
https://www.chicagobusiness.com/manufacturing/can-illinois-out-innovate-elon-musk, 28
December 2019.
Brookson, S. (2001). Understanding accounts. London: Dorling Kindersley.
Cornell, B., & Damodaran, A. (2014). Tesla: Anatomy of a Run-up Value Creation or Investor
Sentiment?. SSRN 2429778.
Damodaran, A. (2019). Price and Value to Book Ratio by Sector (US). Stern School of Business
at New York University. Retrieved from
http://pages.stern.nyu.edu/~adamodar/New_Home_Page/datafile/pbvdata.html, 02 January
2020.
Damodaran, A. (2018). The dark side of valuation: valuing young, distressed, and complex
businesses. Pearson Education.

34
Damodaran, A. (2018). Useful Data Sets - Cash Flow Estimation, operating and Net Margins by
Industry, Global, 1/18. Stern School of Business at New York University. Retrieved from
http://people.stern.nyu.edu/adamodar/New_Home_Page/dataarchived.html#industry, 28
December 2019.
Damodaran, A. (2018). Useful Data Sets – Growth Rate Estimation, Return on Equity
decomposition by Industry, Global, 1/18. Stern School of Business at New York University.
Retrieved from
http://people.stern.nyu.edu/adamodar/New_Home_Page/dataarchived.html#industry, 28
December 2019.
Damodaran, A. (2018). Useful Data Sets – Multiples, Value/EBIT & Value/EBITDA Multiples by
Industry Sector, Global, 1/18. Stern School of Business at New York University. Retrieved
from http://people.stern.nyu.edu/adamodar/New_Home_Page/dataarchived.html#industry,
28 December 2019.
Deloitte. (2019). New market. New entrants. New challenges. Battery electric vehicles. Retrieved
from https://www.iea.org/reports/global-ev-outlook-2019, 30 December 2019.
Eidleman, G. J. (1995). Z scores-A Guide to failure prediction. The CPA Journal, 65(2), 52.
Glautier, M.W.E., Underdown, B. (1995), “Accounting Theory and Practice”, 5th edition.
Singapore: Pitman Publishing.
Horngren, C. T., & Harrison, W. T. (2007). Accounting. Upper Saddle River, NJ: Pearson
Education.
International Energy Agency. (2018). Global EV Outlook 2018. Retreived from
https://webstore.iea.org/global-ev-outlook-2018, 19 April 2019.
International Energy Agency. (2019). Global EV Outlook 2019. Retrieved from
https://www.iea.org/reports/global-ev-outlook-2019, 31 December 2019.
35
International Organization of Motor Vehicle Manufacturers. (2019). World motor vehicle
production, year 2015. Retreived from http://www.oica.net/wp-
content/uploads//ranking2015.pdf, 19 March 2019.
International Organization of Motor Vehicle Manufacturers. (2019). World motor vehicle
production, years 2016-2017. Retreived from http://www.oica.net/wp-
content/uploads/World-Ranking-of-Manufacturers-1.pdf, 23 November 2019.
Lehtinen, J. (1996). Financial ratios in an international comparison: Validity and reliability. Vaasa:
Universitas Wasaensis.
Nissan Global. (2019). Nissan Motor Corporation Annual Report 2015-2019. Nissan Motor Co.,
Ltd. Retreived from https://www.nissan-global.com/EN/IR/LIBRARY/AR/2019/, 09
November 2019.
Nasdaq. (2019). Tesla, Inc. Common Stock (TSLA) Historical Data. Nasdaq, Inc. Retreived from
https://www.nasdaq.com/market-activity/stocks/tsla/historical, 02 October 2019.
Nasdaq. (2019). Nissan Motor Co. Ltd. (NSANF) Historical Data. Nasdaq, Inc. Retreived from
https://www.nasdaq.com/market-activity/stocks/nsanf/historical, 02 October 2019.
Norwegian Electric Vehicle Association. (2019). Norwegian EV policy. Norsk elbilforening.
Retreived from https://elbil.no/english/norwegian-ev-policy/, 28 December 2019.
Morningstar, Inc. (2019). Income Statement for Tesla, Inc (TSLA). Retreived from
http://financials.morningstar.com/income-
statement/is.html?t=TSLA®ion=usa&culture=en-US, 03 October 2019.
Morningstar. (2019). Balance Sheet for Tesla, Inc (TSLA). Morningstar, Inc. Retreived from
http://financials.morningstar.com/balance-
sheet/bs.html?t=TSLA®ion=usa&culture=en-US, 03 October 2019.

36
Morningstar, Inc. (2019). Income Statement for Nissan Motor Co Ltd (NSANF). Retreived from
http://financials.morningstar.com/income-
statement/is.html?t=NSANF®ion=usa&culture=en-US, 03 October 2019.
Morningstar. (2019). Balance Sheet for Nissan Motor Co Ltd (NSANF). Morningstar, Inc
(NSANF). Retreived from http://financials.morningstar.com/balance-
sheet/bs.html?t=NSANF®ion=usa&culture=en-US, 03 October 2019.
Palepu, K. G., & Healy, P. M. (2013). Business Analysis and Valuation: Using Financial
Statements. Florence: South-Western.
Robinson, T. R., Henry, E., Pirie, W. L., & Broihahn, M. A. (2015). International financial
statement analysis. John Wiley & Sons.
Ross, S. A., Westerfield, R. W., & Jordan, B. D. (2013). Corporate finance: Fundamentals. Boston,
MA: McGraw-Hill.
Salmi, T., Yli-Olli, P., & Virtanen, I. (1990). On the classification of financial ratios: A factor and
transformation analysis of accrual, cash flow and market-based ratios. Vaasa: Universitas
Wasaensis.
Tacken, D. (2019). Renault: CEO's Legal Issues Have Made This French Car Manufacturer A
Bargain. Retreived from https://seekingalpha.com/article/4234675-renault-ceos-legal-
issues-made-french-car-manufacturer-bargain, 16 November 2019.
Tesla. (2019). Form 10-K - FY2015 – FY2018. Tesla Motors, Inc. Retreived from
https://ir.tesla.com/sec-filings, 15 November 2019.
Nissan. (2019). Nissan LEAF. Retreived from https://www.nissan.ee/soidukid/uued-
soidukid/leaf.html, (19 December 2019).
Tugas, F.C. (2012). A Comparative Analysis of the Financial Ratios of Listed Firms Belonging to
the Education Subsector in the Philippines for the Years 2009-2011. International Journal
of Business and Social Science Vol. 3 No. 21.
37
Wesoff, E. (2011). Nissan's Ghosn on the Future of the Zero-Emission Car. Retreived from
https://seekingalpha.com/article/274845-nissans-ghosn-on-the-future-of-the-zero-
emission-car, (09 November 2019).
White, G. I., Sondhi, A. C., & Fried, D. (1997). The analysis and use of financial statements.
Hoboken, NJ: Wiley.
Yahoo Finance. Tesla, Inc. (TSLA) Stock Price, Quote, History & News. (2019). Retreived from
https://finance.yahoo.com/quote/TSLA?p=TSLA, 01 December 2019.
Yahoo Finance. Nissan Motor Company (NSANF) Stock Price, Quote, History & News. (2019).
Retreived from https://finance.yahoo.com/quote/NSANF?p=NSANF, 01 December 2019.

38
APPENDICES
Appendix 1. Balance sheet of Tesla, Inc., FY2015-2018 (mUSD)
Fiscal year, ending 2015-12 2016-12 2017-12 2018-12
Assets Current assets Cash Cash and cash equivalents 1,197 3,393 3,368 3,686
Total cash 1,197 3,393 3,368 3,686
Receivables 169 499 515 949
Inventories 1,278 2,067 2,264 3,113
Prepaid expenses 125 194 268 366
Other current assets 23 106 155 193
Total current assets 2,792 6,260 6,571 8,306
Non-current assets Property, plant and equipment Gross property, plant and equipment 5,766 16,055 22,436 22,886
Accumulated Depreciation -571 -1,018 -1,944 -3,195
Net property, plant and equipment 5,195 15,037 20,492 19,691
Goodwill 60 68
Intangible assets 376 362 282
Other long-term assets 106 991 1,171 1,391
Total non-current assets 5,301 16,404 22,085 21,433
Total assets 8,092 22,664 28,655 29,740
Liabilities and stockholders' equity Liabilities Current liabilities Short-term debt 633 1,150 897 2,568
Capital leases Accounts payable 916 1,860 2,390 3,404
Taxes payable 101 153 186 349
Accrued liabilities 322 1,005 1,257 1,122
Deferred revenues 707 1,427 1,869 1,423
Other current liabilities 137 232 1,076 1,127
Total current liabilities 2,816 5,827 7,675 9,992
Non-current liabilities Long-term debt 2,082 5,978 9,418 9,404
Capital leases Deferred taxes liabilities Accrued liabilities Deferred revenues 446 852 1,178 991
Minority interest 785 997 834
Other long-term liabilities 1,659 4,469 5,150 3,595

39
Appendix 1 continuation
Total non-current liabilities 4,187 12,084 16,743 14,824
Total liabilities 7,004 17,911 24,418 24,816
Stockholders’ equity
Common stock 0 0 0 0
Additional paid-in capital 3,415 7,774 9,178 10,249
Retained earnings -2,322 -2,997 -4,974 -5,318
Accumulated other comprehensive income -4 -24 33 -8
Total stockholders' equity 1,089 4,753 4,237 4,923
Total liabilities and stockholders' equity 8,092 22,664 28,655 29,739
Source: Morningstar (2019)
40
Appendix 2. Income statement of Tesla, Inc., FY2015-2018 (mUSD)
Fiscal year, ending 2015-12 2016-12 2017-12 2018-12
Revenue 4,046 7,000 11,759 21,461
Cost of revenue 3,123 5,401 9,536 17,419
Gross profit 924 1,599 2,222 4,042
Operating expenses Research and development 718 834 1,378 1,460
Sales, General and administrative 922 1,432 2,476 2,834
Restructuring, merger and acquisition 135
Other operating expenses -135
Total operating expenses 1,640 2,267 3,855 4,295
Operating income -717 -667 -1,632 -253
Interest Expense 119 199 471 663
Other income (expense) -40 120 -106 -89
Income before taxes -876 -746 -2,209 -1,005
Provision for income taxes 13 27 32 58
Net income from continuing operations -889 -773 -2,241 -1,063
Other 98 279 86
Net income -889 -675 -1,961 -976
Net income available to common shareholders -889 -675 -1,961 -976
Outstanding shares in Millions 128 144 166 173
Earnings per share (in USD) Basic -6.93 -4.68 -11.83 -5.72
Diluted -6.93 -4.68 -11.83 -5.72
Weighted average shares outstanding Basic 128 144 166 171
Diluted 128 144 166 171
EBITDA -334 400 -102 1,559
EBIT -717 -667 -1,632 -253
Source: Morningstar (2019)
41
Appendix 3. Balance sheet of Nissan Motor Company, FY2015-2018 (mJPY)
Fiscal year, ending 2016-03 2017-03 2018-03 2019-03
Assets Current assets Cash Cash and cash equivalents 918,771 1,122,484 1,134,838 1,219,588
Short-term investments 73,384 121,524 71,200 139,470
Total cash 992,155 1,244,008 1,206,038 1,359,058
Receivables 837,704 808,981 739,851 512,164
Inventories 1,274,566 1,273,161 1,290,549 1,257,923
Deferred income taxes 251,689 156,457 152,452 0
Other current assets 7,391,459 7,979,942 8,293,955 8,463,960
Total current assets 10,747,573 11,462,549 11,682,845 11,613,105
Non-current assets Property, plant and equipment Gross property, plant and equipment 5,216,902 5,275,221 5,265,634 5,305,698
Net property, plant and equipment 5,216,902 5,275,221 5,265,634 5,305,698
Intangible assets 130,877 127,807 128,782 134,471
Deferred income taxes 187,106 176,354 175,940 326,759
Prepaid pension benefit 4,691 8,456 10,552 8,499
Other long-term assets 1,086,494 1,370,621 1,483,148 1,563,813
Total non-current assets 6,626,070 6,958,459 7,064,056 7,339,240
Total assets 17,373,643 18,421,008 18,746,901 18,952,345
Liabilities and stockholders' equity Liabilities Current liabilities Short-term debt 3,246,038 3,118,756 2,755,226 3,762,772
Capital leases 14,916 31,565 25,766 19,846
Accounts payable 1,479,689 1,578,594 1,646,638 1,580,452
Deferred income taxes 51 2 2 0
Other current liabilities 2,023,493 2,325,303 2,316,754 2,367,461
Total current liabilities 6,764,187 7,054,220 6,744,386 7,730,531
Non-current liabilities Long-term debt 3,725,883 4,596,962 4,941,116 4,231,030
Capital leases 14,460 20,398 16,248 16,038
Deferred taxes liabilities 691,809 601,398 395,026 339,991
Pensions and other benefits 424,123 369,346 352,861 378,967
Minority interest 418,978 304,898 303,914 320,835
Other long-term liabilities 612,436 611,548 608,529 632,278
Total non-current liabilities 5,887,689 6,504,550 6,617,694 5,919,139
Total liabilities 12,651,876 13,558,770 13,362,080 13,649,670

42
Appendix 3 continuation
Stockholders' equity Additional paid-in capital 1,411,460 1,423,278 1,421,727 1,420,496
Retained earnings 4,150,740 4,349,136 4,908,747 4,961,980
Treasury stock -148,684 -140,697 -139,970 -139,457
Accumulated other comprehensive income -691,749 -769,479 -805,683 -940,344
Total stockholders' equity 4,721,767 4,862,238 5,384,821 5,302,675
Total liabilities and stockholders' equity 17,373,643 18,421,008 18,746,901 18,952,345
Source: Morningstar (2019)
43
Appendix 4. Income statement of Nissan Motor Company, FY2015-2018
(mJPY)
Fiscal year, ending 2016-03 2017-03 2018-03 2019-03
Revenue 12,189,519 11,720,041 11,951,169 11,574,247
Cost of revenue 9,796,998 9,422,551 9,814,001 9,670,402
Gross profit 2,392,521 2,297,490 2,137,168 1,903,845
Operating expenses
Sales, General and administrative 711,100 647,992 634,903 673,639
Other operating expenses 888,143 907,270 927,505 911,982
Total operating expenses 1,599,243 1,555,262 1,562,408 1,585,621
Operating income 793,278 742,228 574,760 318,224
Interest Expense -24,806 -14,128 -12,670 -13,478
Other income (expense) -35,538 237,057 148,653 172,962
Income before taxes 732,934 965,157 710,743 477,708
Provision for income taxes -180,141 -264,639 52,914 -135,793
Net income from continuing operations 552,793 700,518 763,657 341,915
Other -28,952 -37,019 -16,765 -22,777
Net income 523,841 663,499 746,892 319,138
Net income available to common shareholders 523,841 663,499 746,892 319,138
Earnings per share (in JPY)
Basic 125 166 191 82
Diluted 125 166 191 82
Weighted average shares outstanding
Basic 4,191 3,998 3,911 3,911
Diluted 4,191 3,998 3,911 3,911
EBITDA 1,590,626 1,820,342 1,581,380 1,356,770
Source: Morningstar (2019)
44
Appendix 5. Financial ratios of Tesla, Inc.
Altman’s Z-score 2015 2016 2017 2018
Value of Z-score 2.797 1.152 1.306 1.657
Source: Author’s calculations
Liquidity ratios 2015 2016 2017 2018
Current ratio 0.99 1.07 0.86 0.83
Quick ratio 0.54 0.72 0.56 0.52
Cash ratio 0.43 0.58 0.44 0.37
Leverage ratios 2015 2016 2017 2018
Total debt ratio 0.87 0.79 0.85 0.83
Cash coverage ratio -2.81 2.01 -0.22 2.35
Debt to equity 2.49 1.50 2.43 2.43
Turnover ratios 2015 2016 2017 2018
Total asset turnover 0.50 0.31 0.41 0.72
Receivables turnover 23.94 14.03 22.83 22.61
Receivables in days 15.25 26.02 15.99 16.14
Profitability ratios 2015 2016 2017 2018
Return on equity -81.63% -14.20% -46.28% -19.83%
Net profit margin -21.97% -9.64% -16.68% -4.55%
Market value ratios 2015 2016 2017 2018
Market-to-book 27.10 6.37 12.30 11.13
EV/EBITDA

45
Appendix 6. Financial ratios of Nissan Motor Company
Liquidity Ratios 2015 2016 2017 2018
Current ratio 1.59 1.62 1.73 1.50
Quick ratio 1.40 1.44 1.54 1.34
Cash ratio 0.14 0.16 0.17 0.16
Leverage Ratios 2015 2016 2017 2018
Total debt ratio 0.73 0.74 0.71 0.72
Cash coverage ratio -64.12 -128.85 -124.81 -100.67
Debt to equity 1.48 1.59 1.43 1.51
Turnover Ratios 2015 2016 2017 2018
Total asset turnover 0.70 0.64 0.64 0.61
Receivables turnover 14.55 14.49 16.15 22.60
Receivables in days 25.1 25.2 22.6 16.2
Profitability Ratios 2015 2016 2017 2018
Return on equity 11.09% 13.65% 13.87% 6.02%
Net profit margin 4.30% 5.66% 6.25% 2.76%
Market Value Ratios 2015 2016 2017 2018
Market-to-book 0.92 0.88 0.80 0.69
EV/EBITDA 10.08 9.12 10.42 11.74
Altman’s Z-score 2015 2016 2017 2018
Value of Z-score 1.820 1.769 1.792 1.619
Source: Author’s calculations

46
Appendix 7. Formulas of financial ratios used
Name Formula
Current ratio Current assets / current liabilities
Quick ratio (Current assets – inventory) / current liabilities
Cash ratio Cash / current liabilities
Total debt ratio (Total assets – total equity) / total assets
Cash coverage ratio EBIT + (depreciation + amortisation) / interest expenses
Debt to equity (Short-term debt + long-term debt) / total equity
Total asset turnover Sales / total assets
Receivables turnover Sales / accounts receivable
Receivables in days 365 / receivables turnover
Return on equity Net income / shareholders’ equity
Net profit margin Net income / sales
Market-to-book ratio Market value per share / book value per share
EV/EBITDA (Market capitalisation + total debt – total cash) / EBITDA
Source: Ross et al (2013), Glauntier and Underdown (1995), Damodaran (2018)

47
Appendix 8. Non-exclusive licence
A non-exclusive licence for reproduction and for granting public access to the graduation
thesis1
I ___________________________________ (author’s name)(date of birth:…………………..)
1. Give Tallinn University of Technology a permission (non-exclusive licence) to use free of
charge my creation
_____________________________________________________________________________
_____________________________________________________________________________
_____________________________________________________________________________,
(title of the graduation thesis)
supervised by__________________________________________________________________,
(name of the supervisor)
1.1. to reproduce with the purpose of keeping and publishing electronically, including for the
purpose of supplementing the digital collection of TalTech library until the copyright expires;
1.2. to make available to the public through the web environment of Tallinn University of
Technology, including through the digital collection of TalTech library until the copyright
expires.
2. I am aware that the author will also retain the rights provided in Section 1.
3. I confirm that by granting the non-exclusive licence no infringement is committed to the third
persons’ intellectual property rights or to the rights arising from the personal data protection act
and other legislation.
1 The non-exclusive licence is not valid during the access restriction period with the exception of
the right of the university to reproduce the graduation thesis only for the purposes of preservation.
Oliver Arthur Kikkas 03 October 1997
Kalle Ahi
Financial Performance Assessment of Tesla, Inc. and Nissan Motor Company