old bar beach coastal protection … · old bar beach coastal protection structure design...
TRANSCRIPT

OLD BAR BEACH COASTAL PROTECTION STRUCTURE DESIGN INVESTIGATION
GREATER TAREE CITY COUNCIL
10 December 2013
8A0271

8A0271gpb‐Old Bar Design Investigation‐FINAL
Document title Old Bar Beach Coastal Protection Structure Design
Investigation
Document short title Old Bar Design Investigation
Status Final
Date 10 December 2013
Project name Old Bar
Project number 8A0271
Client Greater Taree City Council
Reference 8A0271gpb‐Old Bar Design Investigation‐FINAL
Suite 5, Level 5
100 Walker Street
NORTH SYDNEY NSW 2060
+61 (0) 2 8854 5000
www.royalhaskoningdhv.com
HASKONING AUSTRALIA
MARITIME & WATERWAYS

8A0271gpb‐Old Bar Design Investigation‐FINAL ‐ I ‐
EXECUTIVE SUMMARY
Coastal recession rates at Old Bar Beach are currently some of the highest on the NSW coast. In
2008, three houses at the southern end of the subdivision were threatened by storms and
demolished. Today more private and public property is under threat.
Greater Taree City Council has recently prepared a Draft Coastal Zone Management Plan (CZMP) for
Old Bar (WorleyParsons, 2013). The cost estimates for beach protection run into the tens of millions
of dollars. Planned retreat is recommended as the preferred strategy, a default position based upon
the affordability and availability of any other option contained within the Plan. The Draft CZMP has
not been exhibited or adopted by Council nor has it been endorsed by the State Government. As
such the Draft CZMP has no status. Council recognises that planned retreat is a difficult option for
the community to accept.
Council has retained Haskoning Australia (HKA) to investigate a structural solution which balances
the reasonable concerns of property owners with public beach access and amenity. To be eligible
for funding assistance from the State Government, Council and the community must settle on a
suitably robust and proven long‐term protection strategy.
The investigation area at Old Bar Beach extends over 2 km, from the Old Bar Surf Club in the north
to the MidCoast Water exfiltration ponds in the south. Shown in the Figure ES 1 this area includes
the threatened shorefront properties at Lewis Street, Pacific Parade immediately to the north, the
Old Bar Public School and State Environmental Planning Policy 26 Littoral Rainforest.
It was envisaged at the outset that any shore based structural solution would need to be staged with
the critical area for Stage 1 located opposite Lewis Street, north to about Rose Street.
Council identified eight guiding design principles to be achieved with the long term coastal
protection option, namely:
(i) Proven performance and cost‐effective
(ii) Minimise impact on beach amenity and public access
(iii) Resilient and adaptable design
(iv) Public safety
(v) Management of end effects
(vi) Racecourse Creek entrance stability
(vii) Management of shoreline recession impacts
(viii) Feasible structural life
The preliminary design involved a consideration of design life, foreshore protection principles and
staging (triggers), public access and safety principles, ground conditions, construction footprint with
respect to private/public property boundaries, design water levels (including effects of sea level rise),
scour, breaking wave heights, wave runup and overtopping, acceptable damage in storms,
maintenance regime and responsibility, rock sources, construction access, stormwater drainage and
privacy of adjoining landowners.
The range of available options, investigated in the Draft CZMP, is summarised herein. This
comprises ‘do nothing’, planned retreat, revetment, groyne field, offshore reef and beach
nourishment (stand alone and combination). Coastal revetments can be designed with a high
degree of certainty. Similar certainty is presently not available for any of the other structural
8A0271gpb‐Old Bar Design Investigation‐FINAL ‐ II ‐
options. As such, a revetment is considered to provide the most reliable and effective means of
coastal protection at Old Bar Beach.
However, revetments can exacerbate localised erosion. There are end effects and possible
outflanking as the adjacent shoreline continues to recede. If the shoreline is not permitted to
retreat, based on observed recession rates the sandy foreshore at Old Bar is expected to be lost
within approximately 10 to 20 years.
The desirable design life for any seawall is 50 years. Although Old Bar Beach is characterised by an
aggressively receding shoreline, a design philosophy has been applied which permits this life to be
achieved.
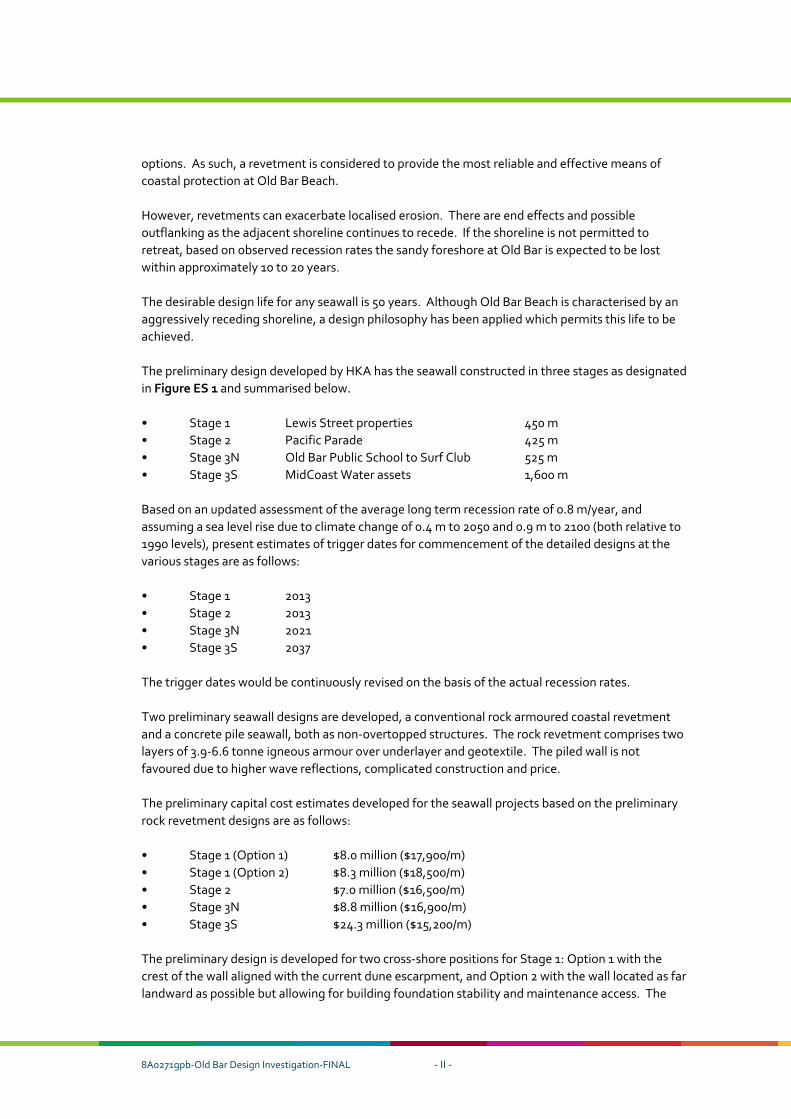
The preliminary design developed by HKA has the seawall constructed in three stages as designated
in Figure ES 1 and summarised below.
• Stage 1 Lewis Street properties 450 m
• Stage 2 Pacific Parade 425 m
• Stage 3N Old Bar Public School to Surf Club 525 m
• Stage 3S MidCoast Water assets 1,600 m
Based on an updated assessment of the average long term recession rate of 0.8 m/year, and
assuming a sea level rise due to climate change of 0.4 m to 2050 and 0.9 m to 2100 (both relative to
1990 levels), present estimates of trigger dates for commencement of the detailed designs at the
various stages are as follows:
• Stage 1 2013
• Stage 2 2013
• Stage 3N 2021
• Stage 3S 2037
The trigger dates would be continuously revised on the basis of the actual recession rates.
Two preliminary seawall designs are developed, a conventional rock armoured coastal revetment
and a concrete pile seawall, both as non‐overtopped structures. The rock revetment comprises two
layers of 3.9‐6.6 tonne igneous armour over underlayer and geotextile. The piled wall is not
favoured due to higher wave reflections, complicated construction and price.
The preliminary capital cost estimates developed for the seawall projects based on the preliminary
rock revetment designs are as follows:
• Stage 1 (Option 1) $8.0 million ($17,900/m)
• Stage 1 (Option 2) $8.3 million ($18,500/m)
• Stage 2 $7.0 million ($16,500/m)
• Stage 3N $8.8 million ($16,900/m)
• Stage 3S $24.3 million ($15,200/m)
The preliminary design is developed for two cross‐shore positions for Stage 1: Option 1 with the
crest of the wall aligned with the current dune escarpment, and Option 2 with the wall located as far
landward as possible but allowing for building foundation stability and maintenance access. The

8A0271gpb‐Old Bar Design Investigation‐FINAL ‐ III ‐
affected landowners prefer Option 1 while the NSW Office of Environment and Heritage prefer
Option 2.
For preliminary costing of maintenance, 0.5% per year is proposed between 2013 and 2038 (mid‐
life), and 2% per year between 2038 and 2063. An additional maintenance provision for sand
placement to manage end effects is required in the order of 500‐1,000 m3 /year per wall end on
average following exposure of that wall end as a consequence of long term recession and storms.
The cost estimates developed in the report make no allowance for any costs associated with
property acquisition.
While Stages 1 and 2 are required in the short term, Stages 3N and 3S are not expected to be
implemented for a number of years. Progressing to the latter stages of the seawall project at Old
Bar has the advantage of being able to monitor the wall and beach behaviour over a reasonable
period of time. If beach recession trends change, then the time for implementation of Stages 3N
and 3S would also change. For these latter stages, it would also be prudent to explore any cost‐
benefits associated with possible relocation of selected public assets rather than their protection.
8A0271gpb‐OldBarDesignInvestigation‐FINAL.docx ‐ IV ‐
Figure ES 1 ‐ Preliminary design developed by HKA with seawall constructed in three stages.
8A0271gpb‐Old Bar Design Investigation‐FINAL ‐ I ‐
CONTENTS
Page
EXECUTIVE SUMMARY I
1 INTRODUCTION 1 1.1 Background 1 1.2 Objectives 2 1.3 Works Area 2 1.4 Scope of Work 3 1.5 Nomenclature: Seawalls and Coastal Revetments 3 1.6 Level Datum and Chainage 4 1.7 Acknowledgements 4
2 INCEPTION DISCUSSIONS WITH GTCC AND OEH 5 2.1 Pre‐Tender Discussions 5 2.2 Inception Meeting 5
3 SITE INSPECTIONS 6 3.1 Inspection at Pre‐Tender Meeting (9/9/13) 6 3.2 Detailed Walkover Inspection (23/9/13) 7
4 CONCEPTUAL UNDERSTANDING OF SEDIMENT DYNAMICS 8 4.1 Introduction 8 4.2 Old Bar Coastal Erosion Study (Sinclair Knight & Partners, 1981) 8 4.3 Black Head to Crowdy Head Coastal Hazard Definition Study (WorleyParsons,
2010a) 9 4.3.1 Conceptual Processes Model – Ambient Conditions 9 4.3.2 Conceptual Processes Model – Storm Conditions 11 4.3.3 Influence of Farquhar Inlet and Racecourse Creek 13
4.4 Old Bar Beach Stabilisation Investigation Feasibility Study (ASR, 2011) 13 4.5 HKA Understanding of Sediment Dynamics to inform Preliminary Design of
Coastal Protection Structure 13
5 APPRAISAL OF STRUCTURAL AND NON‐STRUCTURAL OPTIONS TO ADDRESS
EROSION AT OLD BAR BEACH 16 5.1 Introduction 16 5.2 Do Nothing 16 5.3 Planned Retreat 16 5.4 Revetment 17 5.5 Beach Nourishment 18 5.6 Revetment and Beach Nourishment 20 5.7 Groyne Field and Beach Nourishment 23 5.8 Offshore Reef and Beach Nourishment 25
6 RECENT COASTAL ENGINEERING INVESTIGATIONS AND PROJECTS AT OLD BAR
BEACH 28 6.1 Introduction 28
8A0271gpb‐Old Bar Design Investigation‐FINAL ‐ II ‐
6.2 Multipurpose Reef Proposal 28 6.2.1 ASR Investigation 28 6.2.2 WRL Peer Review 30
6.3 Lewis Street DA 31 6.3.1 General 31 6.3.2 Determination 32
6.4 AUS Seawalls / Tideline 32 6.4.1 Background 32 6.4.1 Waterlöffel Model Testing 33 6.4.2 Waterlöffel Seawall Performance in KwaZulu Natal 35 6.4.1 Large Waterlöffel Blocks to Improve Seawall Performance 36
7 GTCC DESIGN PRINCIPLES FOR COASTAL PROTECTION STRATEGY 38 7.1 Introduction 38 7.2 Proven Performance and Cost Effectiveness 38 7.3 Minimise Impact on Beach Amenity and Public Access 38 7.4 Resilient and Adaptable Design 39 7.5 Public Safety Requirements 39 7.6 Management of End Effects 40 7.7 Racecourse Creek Entrance Stability 41 7.8 Management of Shoreline Recession Impacts 42 7.9 Feasible Structural Life 42
8 SELECTION OF PREFERRED LONG TERM COASTAL PROTECTION OPTION 44
9 PRELIMINARY DESIGN OF COASTAL PROTECTION STRUCTURE FOR OLD BAR
BEACH 46 9.1 Basis of Design (BOD) 46
9.1.1 Design Life 46 9.1.2 Foreshore Protection Principles and Staging (Triggers) 46 9.1.3 Public Access and Safety Principles 48 9.1.4 Ground Conditions 48 9.1.5 Construction Footprint with respect to Private/Public Property
Boundaries 49 9.1.6 Design Water Levels (including effects of SLR) 50 9.1.7 Design Scour Level at the Structure 51 9.1.8 Design Breaking Wave Heights at the Structure 52 9.1.9 Design Wave Runup Level 52 9.1.10 Acceptable Damage in Design Storm 53 9.1.11 Maintenance Regime and Responsibility 54 9.1.12 Rock Quarry Sources 55 9.1.13 Construction Access to the Beach 55 9.1.14 Stormwater Drainage Provisions 56 9.1.15 Privacy of Adjoining Landowners 56
9.2 Compilation of Available Survey, Geotechnical Information and Utilities 56 9.3 Mapping of Coastal Hazards 56 9.4 CAD Preliminary Design 56
9.4.1 Rock Revetment 56 9.4.2 Concrete Piled Wall 60
9.5 Preliminary Project Cost Estimates 64

8A0271gpb‐Old Bar Design Investigation‐FINAL ‐ III ‐
10 WORKS IMPLEMENTATION, MONITORING AND REVIEW 65
11 COMMUNITY DROP‐IN SESSION AND FEEDBACK 66
12 REFERENCES 67
APPENDICES
APPENDIX A: MEETING NOTES
APPENDIX B: SITE INSPECTION NOTES
APPENDIX C: DESIGN OF GABION WALL AT ENTRANCE TO RACECOURSE CREEK
APPENDIX D: AVAILABLE BOREHOLE LOGS FOR OLD BAR BEACH
APPENDIX E: ASSESSMENT OF RECESSION TRENDS, DESIGN WAVE HEIGHTS AND SCOUR
LEVELS
APPENDIX F: DRAWINGS
APPENDIX G: PRELIMINARY COST ESTIMATES
APPENDIX H: SURVEY RESPONSES FROM COMMUNITY DROP‐IN SESSION HELD AT CLUB
OLD BAR, THURSDAY 21 NOVEMBER 2013
8A0271gpb‐Old Bar Design Investigation‐FINAL ‐ 1 ‐
1 INTRODUCTION
1.1 Background
There is a long history of erosion and threat to coastal properties at Old Bar Beach. Up to 2004 the
beach was receding at a rate of approximately 0.5 m/year. Since 2004 there has been a substantial
acceleration in the rate of recession which at present is typically 2 m/year and in some places as high
as 4 m/year. The recession rates at Old Bar Beach are currently some of the highest on the NSW
coast. In 2008, three houses at the southern end of the coastal subdivision were threatened by
storms and demolished. Today, particularly following the updated assessment of coastline hazards
(WorleyParsons, 2010a), more private and public property is under threat.
In the mid‐1990’s, the Meridian Resort was being developed. The resort buildings at the time were
constructed landward of the 100 year erosion line. By 2008, after a re‐evaluation of the coastal
hazards using updated photogrammetry, the immediate erosion line had reached the main buildings
on the site. At present these buildings are located within the immediate erosion zone.
The coastline management process for Greater Taree was commenced in 2008. This progressed to
the completion of a Coastline Hazard Definition Study (WorleyParsons, 2010a), a Coastline
Management Study (WorleyParsons, 2010b) and a Draft Coastal Zone Management Plan (CZMP)
(WorleyParsons, 2013). These investigations described a range of possible options, all of which were
high cost. There were also issues with public access, and potential structural options, many of which
were linked to uncertain performance and required concurrent beach nourishment. The feasibility
of introducing nourishment to Old Bar Beach has been questioned in the Coastline Management
Study.
The cost estimates for beach protection at Old Bar run into the tens of millions of dollars. Planned
retreat is recommended as the preferred strategy, a default position based upon the affordability
and availability of any other option contained within the plan. Council recognises that planned
retreat is a difficult option for the community to accept.
Council is at present seeking a compromise solution, one which balances the reasonable concerns of
property owners, with public beach access and amenity. Council’s approach is to provide for public
access to and along the beach to the extent that this can be best achieved. Ultimately it would be
the community, supported by Council and the NSW Office of Environment and Heritage (OEH), that
decides how it moves forward at Old Bar. If a coastal protection scheme is to incorporate funding
assistance from the State Government, then it would be necessary for Council and the community
to settle on a suitably robust and proven long‐term protection strategy.
In 2012 a group of landowners along Lewis Street at the southern end of the beach submitted to the
NSW Coastal Panel a Development Application (DA) for a protection structure comprising sand‐
filled geotextile containers. This DA was refused. The refusal highlighted the need to develop an
integrated solution to the erosion problem at Old Bar, and there was also a concern for seawall end
effects and impacts on beach amenity.
Prior to the Lewis Street DA, an offshore reef was proposed by some community members as a
solution to the erosion problem. A feasibility study for an artificial multi‐purpose reef (MPR) to
protect the beach was finalised in 2011 for the Old Bar Beach Sand Replenishment Group, a group
formed by concerned local residents with the objective to replenish and preserve sand on the beach.
The MPR proposal involves two reef structures, each about 110 m long and located 250 m offshore

8A0271gpb‐Old Bar Design Investigation‐FINAL ‐ 2 ‐
with crest level 0.5 m below mean sea level. The artificial reef proposal is not supported by the State
Government agencies or Council. There is concern regarding the assured performance of the reef,
and a shore‐based protective strategy is now sought. An alternative proprietary crib seawall
solution has also been suggested (AUS Seawalls), however State Government agencies are
concerned that this option would not meet the design objectives.
To progress the management investigations, Council is seeking a preliminary design for a coastal
protection structure at Old Bar Beach. Council and OEH see this as involving a back‐beach
revetment. It is understood by relevant stakeholders that a back‐beach revetment would be
exposed in storms and may lead to a lowering of the beach due to wave reflections. If the long‐term
recession trend continues ultimately the beach would be lost and the sensible approach would be to
provide for longshore access either along or immediately landward of the crest of the structure.
1.2 Objectives
Council requires a technical investigation and report which recommends a preferred coastal
protection structure for Old Bar Beach. The key objectives are to:
• develop a realistic long‐term option;
• provide a preliminary design and cost estimate;
• advise on maintenance requirements; and
• advise on monitoring to gauge impacts of the structure on the beach and foreshore.
The design and implementation of the structure would be staged in accordance with the
development of the erosion threat and to achieve a more manageable costing stream.
There is no requirement for the consultancy to engage the community as part of the investigation.
During the study timetable for this project, Council ran a consultation and communication strategy
simultaneously. This included the presentation of the design to a community drop‐in session held in
Old Bar on Thursday 21 November 2013.
Landscape design input associated with the protective structure is not required. The consultancy is
limited to engineering considerations only.
The NSW Government is currently preparing its Stage 2 reforms to the Coastal Protection Act 1979.
It is the expectation of both Council and OEH that the coastal protection design outcome developed
for Old Bar would be consistent with and potentially inform the development of the Stage 2
reforms.
1.3 Works Area
The investigation area at Old Bar Beach extends over 2 km, from the Old Bar Surf Club in the north
to the MidCoast Water exfiltration ponds in the south. The works area is shown in the attached
Drawings (Appendix F).
The works area covers the threatened shorefront properties at Lewis Street and the road at Pacific
Parade, the entrance to Racecourse Creek, the dunes seaward of the Old Bar Public School, State
Environmental Planning Policy (SEPP) 26 Littoral Rainforest, and the Old Bar Surf Lifesaving Club.
The SEPP 26 areas along the foreshore occur both on the southern side of Lewis Street and behind
the dunes between Racecourse Creek and the Surf Club.

8A0271gpb‐Old Bar Design Investigation‐FINAL ‐ 3 ‐
It is envisaged at the outset of the investigation that any shore based structural solution would need
to be staged with the critical area for Stage 1 extending south from about Rose Street.
1.4 Scope of Work
Council nominated a 12 week investigation culminating in the delivery of a final report.
Haskoning Australia (HKA) proposed an investigation involving eleven Core tasks and one
Provisional task, as follows:
Core Tasks
• Collation and review of background information
• Site inspection and engineering investigations
• Review conceptual understanding of sediment dynamics
• Summarise structural and non‐structural options to address erosion at Old Bar Beach
• Summarise recent coastal engineering design investigations and projects at Old Bar Beach
• Consider GTCC design principles for coastal protection strategy
• Select a preferred long‐term coastal protection option
• Site meetings and drop‐in session
• Preliminary design of coastal protection structure at Old Bar Beach
• Reporting
• Liaison with GTCC
Provisional Task
• Provisional additional meeting
HKA would remain in close contact with Council, and OEH as required, over the course of the
12 week project. Communications would be by telephone and email. In accordance with the Brief,
HKA would engage Council and OEH in a weekly telephone conference, conducted on Thursdays
commencing 27 September 2013.
A fourth meeting was proposed as a Provisional item.
1.5 Nomenclature: Seawalls and Coastal Revetments
Seawalls and coastal revetments are shore‐parallel structures at the transition between the low‐
lying beach and the higher foreshore or dune. The main difference between a seawall and a coastal
revetment is that a revetment is more sloping than a seawall. A revetment has a distinct slope (e.g.
1v:1.5h), where a seawall is mostly vertical or close to vertical. Revetments usually have a rougher
exterior than seawalls, but can also be smooth.
Seawalls are usually constructed at the foot of the dune or edge of the foreshore. Coastal
revetments may be constructed at the same location or may even be buried further landward (called
terminal revetments).
It is common for coastal revetments to be referred to as seawalls, but not vice versa.
8A0271gpb‐Old Bar Design Investigation‐FINAL ‐ 4 ‐
1.6 Level Datum and Chainage
All reference to Reduced Level (RL) in this report is given in metres above Australian Height Datum
(AHD). AHD is a local datum which is approximately equal to current Mean Sea Level at the
coastline of mainland Australia.
A chainage system is set up which overlays the OEH photogrammetric block and profile chainage
system for Wallabi Point in the south (S), Old Bar in the central portion of the works area (C), and
Farquhar Inlet in the north (N). Since the OEH profiles are essentially shore‐normal, it follows that
chainages are measured along the crest of the back‐beach escarpment (or future revetment where
this is proposed). The chainage system is shown on the Drawings.
1.7 Acknowledgements
HKA acknowledges the input provided by Laura Black and Richard Pamplin from Greater Taree City
Council (GTCC) in steering the investigation, and Jane Gibbs and Peter Evans from the Office of
Environment and Heritage (OEH) as the officer representatives from the NSW State Government.
Other assistance was provided by Bruce Moore from GTCC and Bob Clout, photogrammetrist from
OEH.

8A0271gpb‐Old Bar Design Investigation‐FINAL ‐ 5 ‐
2 INCEPTION DISCUSSIONS WITH GTCC AND OEH
2.1 Pre‐Tender Discussions
A mandatory Pre‐tender Meeting was attended by Gary Blumberg from HKA on 9/9/13. This
meeting was also attended by Laura Black, Richard Pamplin and Bruce Moore from GTCC, Peter
Evans from OEH, and the other invited consultant tenderers. Notes prepared by Mr Blumberg from
the Pre‐tender Meeting and selected photos of the site are attached at Appendix A.
2.2 Inception Meeting
The Inception Meeting was held at GTCC chambers in Taree on 23/9/13. This meeting was attended
by Gary Blumberg and Patrick Lawless from HKA, Laura Black, Richard Pamplin and Bruce Moore
from GTCC, and Peter Evans and Andrew McIntyre from OEH. Notes prepared by Mr Blumberg
from the Inception Meeting are also attached in Appendix A.
The provisional program was discussed and confirmed at the Inception Meeting. The additional
data sources listed in the Brief were also requested. Other aspects of the work for which clarification
was sought included shoreline structure design life, options for plant access to the beach and names
of Council’s usual rock quarry sources.

8A0271gpb‐Old Bar Design Investigation‐FINAL ‐ 6 ‐
3 SITE INSPECTIONS
A site inspection was made during the Pre‐tender Meeting (Section 2.1) and immediately following
the Inception Meeting (Section 2.2).
3.1 Inspection at Pre‐Tender Meeting (9/9/13)
A walkover inspection of Old Bar Beach was made by Gary Blumberg from HKA during the Pre‐
tender Meeting on 9 September 2013. The wind during this inspection was from the NE with 1 to
1.5 m waves breaking within the surf zone. The tide was high and falling.
While OEH indicated that it was not aware of bedrock in the vicinity of the back‐beach, a weak
siltstone outcrop was encountered during the pre‐tender visit (Photo 1). This was observed close to
an indurated mound between Racecourse Creek and the Surf Club, emerging at the base of the dune
(Photo 2). The distribution of these geotechnical features are of interest to the design. A selection
of other relevant photos taken during the Pre‐tender Meeting is provided below.
Photo 1 – Weak siltstone exposed in the back beach
escarpment approximately 200 m south of the Surf
Club (photo date 9/9/13)
Photo 2 – Indurated sand outcrop exposed in the
back beach escarpment approximately 200 m south
of the Surf Club (photo date 9/9/13)
Photo 3 – Norfolk Island pine tree undermined by
erosion; a number of similar trees have been lost in
recent years at Old Bar Beach (photo date 9/9/13)
Photo 4 ‐ Geotextile covered erosion escarpment at
Meridian Resort with timber steps to the beach
(photo date 9/9/13)
8A0271gpb‐Old Bar Design Investigation‐FINAL ‐ 7 ‐
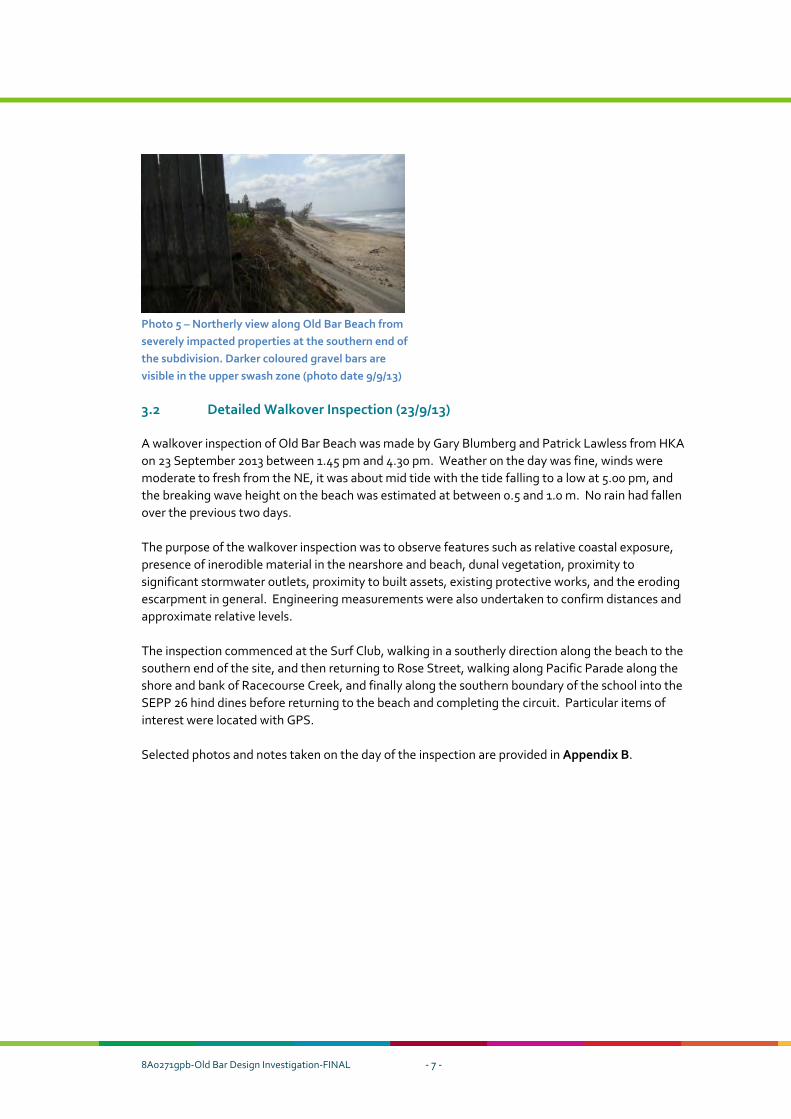
Photo 5 – Northerly view along Old Bar Beach from
severely impacted properties at the southern end of
the subdivision. Darker coloured gravel bars are
visible in the upper swash zone (photo date 9/9/13)
3.2 Detailed Walkover Inspection (23/9/13)
A walkover inspection of Old Bar Beach was made by Gary Blumberg and Patrick Lawless from HKA
on 23 September 2013 between 1.45 pm and 4.30 pm. Weather on the day was fine, winds were
moderate to fresh from the NE, it was about mid tide with the tide falling to a low at 5.00 pm, and
the breaking wave height on the beach was estimated at between 0.5 and 1.0 m. No rain had fallen
over the previous two days.
The purpose of the walkover inspection was to observe features such as relative coastal exposure,
presence of inerodible material in the nearshore and beach, dunal vegetation, proximity to
significant stormwater outlets, proximity to built assets, existing protective works, and the eroding
escarpment in general. Engineering measurements were also undertaken to confirm distances and
approximate relative levels.
The inspection commenced at the Surf Club, walking in a southerly direction along the beach to the
southern end of the site, and then returning to Rose Street, walking along Pacific Parade along the
shore and bank of Racecourse Creek, and finally along the southern boundary of the school into the
SEPP 26 hind dines before returning to the beach and completing the circuit. Particular items of
interest were located with GPS.
Selected photos and notes taken on the day of the inspection are provided in Appendix B.

8A0271gpb‐Old Bar Design Investigation‐FINAL ‐ 8 ‐
4 CONCEPTUAL UNDERSTANDING OF SEDIMENT DYNAMICS
4.1 Introduction
A sound understanding of coastal processes and associated sediment dynamics is essential to inform
assessment of the various coastal protection options available for Old Bar Beach. This is particularly
important for the works area where sediment transport processes are highly complex and sediment
loss mechanisms are not fully understood.
Various descriptions of sediment dynamics at Old Bar Beach are available from a number of
different sources. A review of these descriptions is presented in the following sections.
4.2 Old Bar Coastal Erosion Study (Sinclair Knight & Partners, 1981)
The Old Bar Coastal Erosion Study (SKP, 1981) presented a conceptual coastal processes model for
Old Bar, largely based on:
a geomorphological/geological assessment of the area;
analysis of photogrammetric data collected between 1940 and 1979;
analysis of historical aerial photography;
wave and storm surge analysis;
historical assessment of the status of Farquhar Inlet in relation to observed erosion/accretion
trends.
A summary of the key observations outlined in SKP (1981) for Old Bar Beach are as follows:
Variations of the energy distribution along the beach exist because of the nearshore reef
system, which may influence erosion rates.
Adjacent to Old Bar, although a very slight dominance of northerly longshore transport exists,
the potential for longshore transport in both directions is nearly equal.
Further south the net direction of longshore sediment transport along Old Bar Beach is to the
south.
Accordingly, long term erosion is expected to occur at the northern section of the beach
(beyond which northward and southward transport is balanced, but at which the long term
direction is to the south) while accretion is expected at the southern end adjacent to Saltwater
headland (Wallabi Point).
Refraction analysis and wave directions observed in aerial photographs indicate that the
nearshore reef at Old Bar modifies the local inshore wave climate in a way similar to the more
prominent rocky headlands located further south.
The reef system is responsible for a weak sedimentary compartment at Old Bar such that
erosional tendencies at the beach are dictated by local refraction effects.
It is possible that sand taken offshore in rip cells and deposited over the reef might not return to
the beach under favourable conditions due to the barrier effect of the upward projection of
parts of the reef.
The offshore sediment distribution patterns show that any net sand losses to offshore areas
must form as a thin veneer over the existing sediments out to depths of 20‐25 m.

8A0271gpb‐Old Bar Design Investigation‐FINAL ‐ 9 ‐
4.3 Black Head to Crowdy Head Coastal Hazard Definition Study (WorleyParsons, 2010a)
The Black Head to Crowdy Head Coastline Hazard Definition Study (WorleyParsons, 2010a) noted that
the regional coastal processes compartment between Black Head and Crowdy Head is highly
complex due to the presence of Farquhar Inlet and Harrington Entrance, as well as a number of
control features including Wallabi Point and Urana Bombora.
WorleyParsons (2010a) presented conceptual process models for Old Bar Beach under both ambient
and storm conditions. Attempts to explain recent increases in beach recession were also presented,
while the potential influence of Farquhar Inlet and Racecourse Creek on sediment dynamics at Old
Bar Beach was also investigated. A summary of the key findings reported by WorleyParsons (2010a)
are presented below.
WRL undertook a peer review of WorleyParsons (2010a), and noted that the coastal processes
presented for Old Bar Beach are speculative but plausible (WRL, 2010).
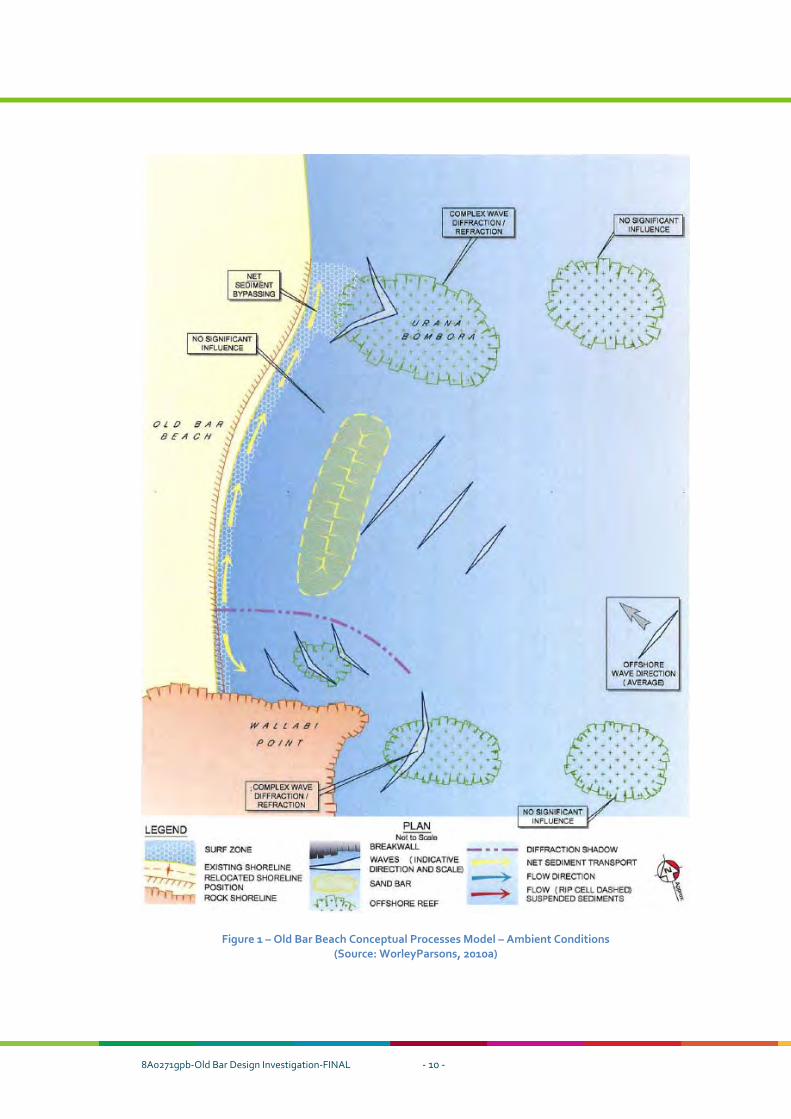
4.3.1 Conceptual Processes Model – Ambient Conditions
The conceptual processes model proposed by WorleyParsons (2010a) for Old Bar Beach under
ambient conditions is presented in Figure 1, which can be summarised as follows:
Net northward sediment transport occurs along the beach, while refraction and diffraction
effects cause lateral expansion flow to the south and localised accretion at the southern end.
Sediment bypassing of Urana Bombora occurs to the north along the inshore zone, representing
a net loss of sand from the beach compartment. This is largely due to the bombora generally
not being emergent above RL ‐2.5, which limits the effectiveness of this feature to form a
barrier to sediment transport.
Nearshore conditions are characterised by significant longshore currents and high suspended
sediment loads. This may be related to the relatively deep nearshore area (trough) and steep
beach face, whereby waves approach the shoreline relatively unrefracted and break in a narrow
high energy surf zone at a relatively large angle to the shoreline promoting high longshore
currents with a high sediment load.
8A0271gpb‐Old Bar Design Investigation‐FINAL ‐ 10 ‐
Figure 1 – Old Bar Beach Conceptual Processes Model – Ambient Conditions (Source: WorleyParsons, 2010a)
8A0271gpb‐Old Bar Design Investigation‐FINAL ‐ 11 ‐
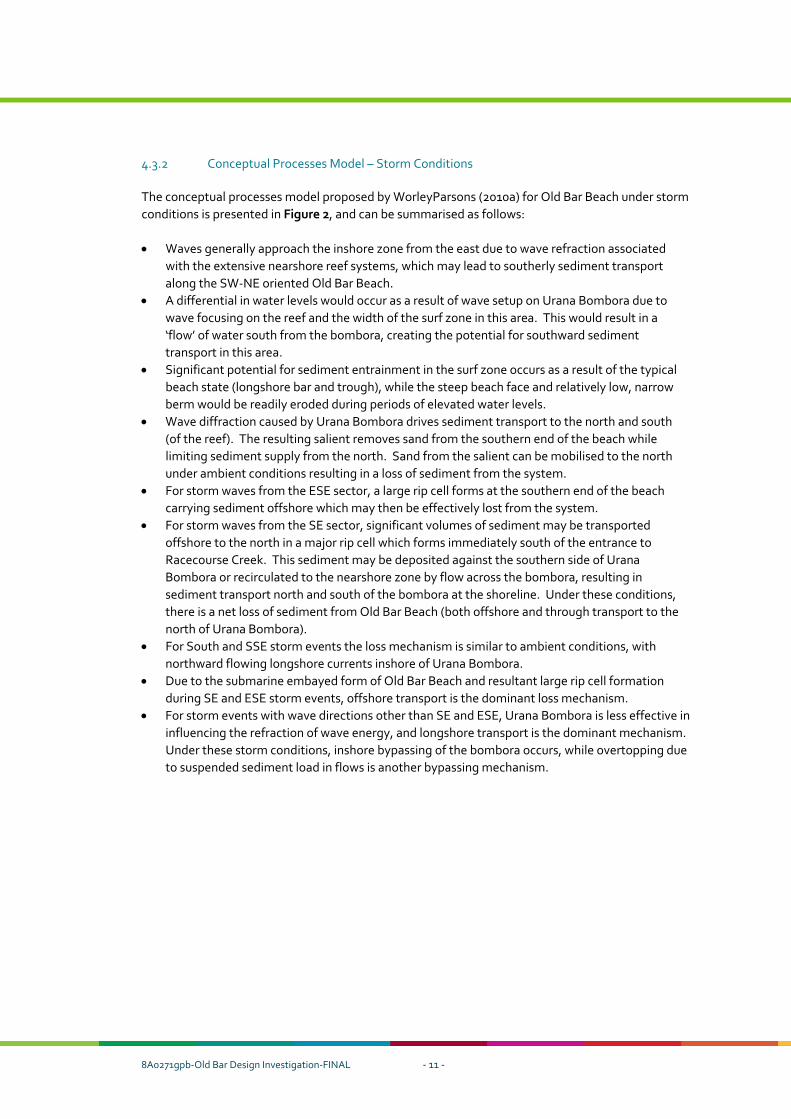
4.3.2 Conceptual Processes Model – Storm Conditions
The conceptual processes model proposed by WorleyParsons (2010a) for Old Bar Beach under storm
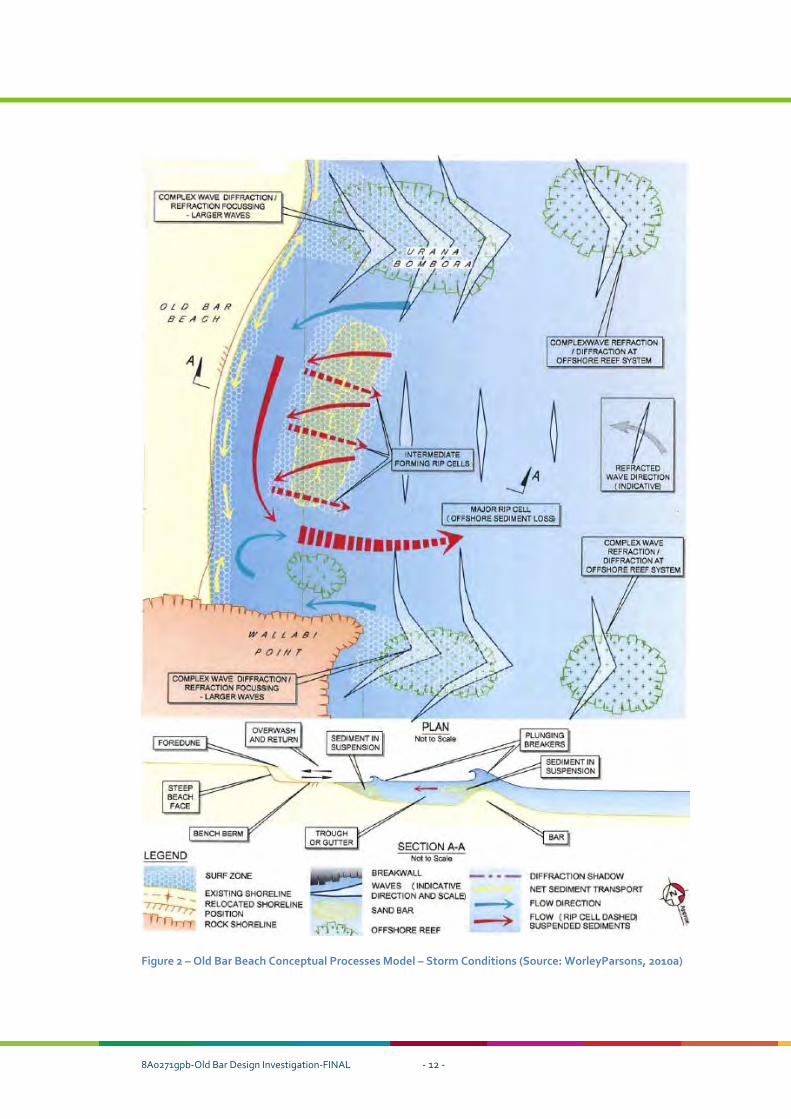
conditions is presented in Figure 2, and can be summarised as follows:
Waves generally approach the inshore zone from the east due to wave refraction associated
with the extensive nearshore reef systems, which may lead to southerly sediment transport
along the SW‐NE oriented Old Bar Beach.
A differential in water levels would occur as a result of wave setup on Urana Bombora due to
wave focusing on the reef and the width of the surf zone in this area. This would result in a
‘flow’ of water south from the bombora, creating the potential for southward sediment
transport in this area.
Significant potential for sediment entrainment in the surf zone occurs as a result of the typical
beach state (longshore bar and trough), while the steep beach face and relatively low, narrow
berm would be readily eroded during periods of elevated water levels.
Wave diffraction caused by Urana Bombora drives sediment transport to the north and south
(of the reef). The resulting salient removes sand from the southern end of the beach while
limiting sediment supply from the north. Sand from the salient can be mobilised to the north
under ambient conditions resulting in a loss of sediment from the system.
For storm waves from the ESE sector, a large rip cell forms at the southern end of the beach
carrying sediment offshore which may then be effectively lost from the system.
For storm waves from the SE sector, significant volumes of sediment may be transported
offshore to the north in a major rip cell which forms immediately south of the entrance to
Racecourse Creek. This sediment may be deposited against the southern side of Urana
Bombora or recirculated to the nearshore zone by flow across the bombora, resulting in
sediment transport north and south of the bombora at the shoreline. Under these conditions,
there is a net loss of sediment from Old Bar Beach (both offshore and through transport to the
north of Urana Bombora).
For South and SSE storm events the loss mechanism is similar to ambient conditions, with
northward flowing longshore currents inshore of Urana Bombora.
Due to the submarine embayed form of Old Bar Beach and resultant large rip cell formation
during SE and ESE storm events, offshore transport is the dominant loss mechanism.
For storm events with wave directions other than SE and ESE, Urana Bombora is less effective in
influencing the refraction of wave energy, and longshore transport is the dominant mechanism.
Under these storm conditions, inshore bypassing of the bombora occurs, while overtopping due
to suspended sediment load in flows is another bypassing mechanism.
8A0271gpb‐Old Bar Design Investigation‐FINAL ‐ 12 ‐
Figure 2 – Old Bar Beach Conceptual Processes Model – Storm Conditions (Source: WorleyParsons, 2010a)
8A0271gpb‐Old Bar Design Investigation‐FINAL ‐ 13 ‐
4.3.3 Influence of Farquhar Inlet and Racecourse Creek
WorleyParsons (2010a) analysed specific periods of photogrammetric data in an attempt to identify
any relationship between the observed erosion at Old Bar Beach and the entrance status of Farquhar
Inlet. The influence of stabilisation works at the entrance to Racecourse Creek was also
investigated, however this was not found to have any significant influence on sand volumes along
Old Bar Beach. In particular, it was noted that the observed dune stabilisation in the immediate
vicinity of the creek entrance could be attributed to stabilisation of the creek alignment (relating to
catchment flows) and not because the constructed gabion wall acting as a groyne to stabilise
longshore sediment transport.
WorleyParsons (2010a) postulated that Farquhar Inlet acts as a significant sediment sink during and
following closure, resulting in erosion of Old Bar Beach. This is due to a reduction in nearshore sand
shoals (ebb tide delta) and infilling of the inlet through aeolian processes, which reduces sand
volumes in the nearshore zone offshore from the entrance. This process changes the nearshore
bathymetry that otherwise combines with Urana Bombora to stabilise (relatively) Old Bar Beach by
supplying sand during southerly bypassing, and reducing the rate of northerly bypassing of Urana
Bombora.
The influence of Farquhar Inlet on erosion at Old Bar Beach was also discussed in Gordon (2013). In
general, it was surmised that the inlet takes sand in from the south (Old Bar Beach) and then
discharges sand offshore during flood events where some moves off to the north while the rest goes
back to re‐form the entrance shoals and berm. The implication of this for Old Bar Beach is that it
tends to experience intermittent phases of recession which occur after, but are linked to, major
floods.
4.4 Old Bar Beach Stabilisation Investigation Feasibility Study (ASR, 2011)
The Old Bar Beach Stabilisation Investigation Feasibility Study (ASR, 2011) suggested that the
ongoing erosion at Old Bar Beach was being caused by cross‐shore sediment transport during
storms. In addition, the observed beach erosion was attributed to erosion of the “old bar” itself, i.e.
the submerged river delta offshore. Offshore reefs comprised of river stones cemented together
with mud stone are elevated above the sandy seabed, and it has been reported that pieces of this
reef have washed up on the beach since the area was first settled in the 1940’s. Reduced elevation
of the offshore “old bar” would increase the potential for wave energy transmission to the shoreline
and lead to beach recession.
WRL undertook a peer review of ASR (2011), and noted that the postulated mechanism for erosion
at Old Bar Beach (i.e., erosion of the “old bar”) were plausible (WRL, 2012). WRL also noted that
that this mechanism could be exacerbated by sea level rise of 1 to 3 mm/year which has been
occurring over the past 50 years (You et al., 2009), leading to greater wave transmission or reduced
wave transformation over the nearshore reef. However, WRL (2011) suggested that other potential
mechanisms for erosion at Old Bar Beach, such as those presented in WorleyParsons (2010a), should
also be considered.
4.5 HKA Understanding of Sediment Dynamics to inform Preliminary Design of Coastal Protection Structure
A sound understanding of coastal processes and associated sediment dynamics is essential to inform
assessment of the various coastal protection options available for Old Bar Beach. Based on the

8A0271gpb‐Old Bar Design Investigation‐FINAL ‐ 14 ‐
information provided above, it is clear that the sediment transport processes at Old Bar Beach are
highly complex, with a range of processes dominating under different prevailing conditions. Despite
the number and extent of investigations undertaken to date, it is likely that these processes are not
fully understood, while the implications of sea level rise on sediment dynamics at Old Bar Beach are
also uncertain.
There appear to be a number of mechanisms which can potentially transport significant volumes of
sand outside the beach compartment, leading to ongoing shoreline recession. These mechanisms
are discussed further below. Conversely, sand supply to Old Bar Beach does not occur at significant
rates due to sand drift from the south, and instead appears to primarily rely on southward transport
during storm events, although it is noted that northward transport may also occur during storms
from the S and SSE sectors. In addition, major storms events may be associated with the
development of significant rip cells that transport sand outside the beach compartment, and
therefore should not be viewed as a mechanism for sand supply.
Indeed, cross‐shore sediment transport during storm events is considered to be a major sand loss
mechanism for the Old Bar Beach compartment, particularly under prevailing SE and ESE wave
directions which are most likely to result in the formation of large scale rip cells. Such conditions can
transport significant quantities of sand to water depths beyond the littoral zone where it is
effectively lost from the system, leading to further shoreline recession.
The influence of Farquhar Inlet also appears to be important, with evidence to suggest that Old Bar
Beach erodes in response to a closing of the entrance, and that the erosive process may continue for
an extended period due to the time lag in the morphological response. While the opening of
Farquhar Inlet during flood events can discharge significant quantities of sand into the nearshore
and offshore zones1, much of this material appears to move off to the north while the rest goes back
to re‐form the entrance shoals and berm.
In addition, sand that enters Farquhar Inlet following entrance opening is likely to predominantly
come from the beaches and dunes to the south, most notably Old Bar Beach (Gordon, 2013). Given
that the entire region consists of complex reefs with only a thin veneer of sand making up the beach
and nearshore zone (Coffey and Partners, 1981), and also considering the lack of significant sand
drift from the south, the main source of material supplying the net northward longshore transport is
likely to come from the sub‐aerial beach system at Old Bar (Gordon, 2013).
While the nearshore bathymetry indicates that Old Bar Beach is essentially embayed between
Wallabi Point and Urana Bombora, it is noted that the effectiveness of the bombora to form a barrier
to sediment transport is limited by the relatively low elevation of this feature (i.e., below RL ‐2.5).
This enables sediment bypassing to occur to the north along the inshore zone and also as
overtopping due to suspended sediment load in flows. This bypassing represents a net loss of sand
from the beach compartment and may become more significant in response to predicted sea level
rise.
Overall, it is considered that significant sand losses can occur at Old Bar Beach in response to either
longshore or cross‐shore processes. Spatially, these processes occur over regional scales in
response to the complex bathymetry in the area and the significant influence of entrance dynamics
associated with Farquhar Inlet. Temporally, sediment dynamics at Old Bar Beach could vary over
1 It is estimated that approximately 2 million m
3 of material was jetted offshore onto the shallow reefs as a
result of the June 2011 flood, estimated to be a 1 in 20 year (5% ARI) event (Gordon, 2013).
8A0271gpb‐Old Bar Design Investigation‐FINAL ‐ 15 ‐
time scales ranging from individual storm events to seasonal and decadal fluctuations, the latter
evident in the marked recessional trend plainly observed over the past 13 or so years. Effective
coastal protection options would need to consider the range of scales over which these processes
operate. It is fair to conclude that no single structural solution would adequately address all of the
sediment loss mechanisms occurring at Old Bar Beach.
8A0271gpb‐Old Bar Design Investigation‐FINAL ‐ 16 ‐
5 APPRAISAL OF STRUCTURAL AND NON‐STRUCTURAL OPTIONS TO ADDRESS EROSION AT OLD BAR BEACH
5.1 Introduction
A range of structural and non‐structural options available for Old Bar Beach are reported in the
Coastline Management Study (WorleyParsons, 2010b). These include:
Do nothing ‐ emergency response
Planned retreat
Revetment
Beach nourishment
Revetment and beach nourishment
Groyne field and beach nourishment
Offshore reef and beach nourishment
Each of these options are described in the following sections, including discussion of their potential
application for Old Bar Beach. The descriptions presented below are largely produced from previous
studies, particularly the Coastline Management Study (WorleyParsons, 2010b).
5.2 Do Nothing
It is understood that to “do nothing” and resort only to emergency response is not acceptable to
Council, OEH or the local community. As such, this option has not been considered further herein.
5.3 Planned Retreat
Planned retreat is a strategy that can be used to allow development to exist on a receding coastline
for a period of time until the risk to property becomes unacceptable. The trigger for implementing
planned retreat can be either time‐based (e.g. occupation of an area is allowed until a certain date)
or based on physical realisation of coastal hazards (e.g. when an erosion escarpment encroaches
within a specified buffer distance from a dwelling). If implemented on an undeveloped coastline,
planned retreat can be facilitated by construction of relocatable buildings, which can be readily
moved when development consent lapses and landowners are required to cease occupation and
retreat further landward.
In the case of a well‐developed coastline such as Old Bar, this approach becomes problematic to
implement as private landowners would be required to demolish their existing dwellings and
completely rebuild at significant cost. There are a number of issues associated with the
implementation of planned retreat at Old Bar, including:
retreat of dwellings is limited by the position of important infrastructure such as roadways,
sewer and water mains, and other private properties;
a planned retreat policy would place a time horizon on the development of portions of lots and
would devalue existing property;
it encourages landowners to implement illegal protective works to maintain the position of their
dwellings which may impact on beach amenity and increase risks to adjacent properties.
As outlined in WorleyParsons (2010b), the implementation of planned retreat at Old Bar Beach over
a 50 year planning period would likely involve the following:

8A0271gpb‐Old Bar Design Investigation‐FINAL ‐ 17 ‐
rezoning land at immediate risk form coastal erosion;
specific development controls for future developments, such as the requirement for light weight
timber construction on piers landward of the 50 year hazard line;
possible partial acquisition of land on the seaward side of Lewis Street to maintain legal public
access to the beach in the short‐term, and longer term acquisition of properties for continued
beach access where the entire lot, or close to the entire lot, is seaward of the 50 year hazard
line;
possible acquisition of land between the property boundary and 5 m setback line for properties
along Pacific Parade to maintain road access;
possible funding to a total of $9.9 million for acquisition of the properties;
relocation of exfiltration ponds at the Old Bar Wastewater Treatment Plant, estimated to cost
$2.5 million;
relocation of caravan park structures as they become at risk.
The Draft CZMP recommends planned retreat as the preferred strategy. This recommendation
stands as a default position based on the affordability and availability for any other option contained
within the Plan. It should be noted that the Draft CZMP is not an endorsed document by the State
Government or an adopted document by Council, and therefore has no status.
5.4 Revetment
Coastal revetments are structures built along the shoreline parallel to the beach. Revetments serve
a very limited function. Their purpose is to impose a landward limit to coastal erosion and recession
and to provide protection to development behind the structures. They are not provided with the
intention of building or maintaining a beach. Along the NSW coast, protective structures designed
and built today would most commonly comprise sloped, randomly placed layers of rock.
A terminal coastal revetment would typically be buried in the dune at the back of the beach, ideally
becoming exposed only temporarily in storms. However, given the significantly receding shoreline
at Old Bar, it is likely that the structure would become exposed in the short to medium term,
influencing erosive processes at the shoreline as described below.
Once revetments physically interrupt wave action at a beach, they can have a number of effects on
the beach. Primarily, they would reflect the wave energy striking them, leading to increased
backwash which is able to carry away beach sand. This sand tends to be removed locally from the
area in front of the wall. If the wall is not founded deep enough under the sand, ultimately this can
lead to undermining of the base of the structure and failure. Flatter wall slopes, and a rough and
permeable wall, would reduce the amount of wave reflection by dissipating the energy of the waves
and releasing the backwash more slowly.
A second effect is that by preventing erosion of the land behind the wall, the structure reduces the
amount of sand available to “feed” the beach erosion. This is the function of a natural dune. This
effect is less important where the seawall is short, but long stretches of wall can have a significant
effect on sediment supply, leading to “sediment starvation” and narrower beaches. This in turn
increases the wave energy reaching the seawall, which increases reflection, increases localised
scour, reduces beach width and so the process continues. Impacts may also be realised further
north, such as the entrance to Farquhar Inlet and Manning Point Beach, due to reduced sediment
supply from the south.

8A0271gpb‐Old Bar Design Investigation‐FINAL ‐ 18 ‐
Flanking erosion, or erosion at the ends of a seawall (“end effects”), is caused by a combination of
wave reflection, wave diffraction and starvation of sediment supply. Draft guidelines for assessing
the impacts of seawalls on beaches prepared by the (then) Department of Environment, Climate
Change and Water (DECCW) provides indicative quantities for additional erosion close to the end of
a seawall (DECCW, 2010b). For example, additional erosion of up to 80% could occur in the cross‐
shore extent, while additional erosion in the longshore extent could be expected over distances of
up to 70% of the wall length to a maximum of 500 m (DECCW, 2010b).
A suitably robust revetment at Old Bar Beach would be expected to adequately protect
development located landward of the structure. However, given the significantly receding shoreline
at Old Bar, the recession over time would likely result in the progressive development of an artificial
headland as sand is eroded from in front of, and at the ends of, the revetment (Figure 3).
Progressive extensions (alongshore) of the revetment over time, and/or construction of return walls
would likely be required to mitigate end effects.
The loss of beach adjacent to the revetment would adversely impact public amenity, beach access
and aesthetics. Safe public access would need to be incorporated into the revetment design along
the crest of the structure. For portions of Old Bar Beach, it is likely that the revetment would need
to be constructed on private land, so public access arrangements would need to consider land
ownership and privacy.
Figure 3 – Anticipated impact of localised revetment at Old Bar Beach (Source: WorleyParsons, 2010b)
5.5 Beach Nourishment
A massive beach nourishment scheme at Old Bar could be designed to provide protection for all
beachfront development at risk over a given planning period (say 50 years). As such, it would be
necessary to have a sufficient supply of sand store seaward of the development to accommodate

8A0271gpb‐Old Bar Design Investigation‐FINAL ‐ 19 ‐
design storm erosion demand, plus an allowance for ongoing sand loss associated with recession
due to net sediment loss and sea level rise, without adversely affecting the stability of the building
structures.
Massive beach nourishment at Old Bar would ensure that sand volumes lost from the beach
compartment due to either longshore or cross‐shore processes could be effectively replaced, albeit
in progressive nourishment cycles. The other key advantage of this option is that it eliminates the
requirement for any hard engineering structures on the beach or in the nearshore region. This
scheme could also be implemented in a flexible manner that responds to the latest sea level rise
observations and predictions, as well as future beach behaviour which is acknowledged to be
somewhat uncertain (Section 4.5).
However, the extensive beach compartment between Wallabi Point and Urana Bombora which
forms Old Bar Beach is essentially incomplete due to the relatively low elevation of Urana Bombora,
thereby enabling alongshore sediment losses to the north. This is in addition to the significant
offshore losses that are believed to occur during storms. Beach nourishment is typically poorly
suited to such systems due to a relative inefficiency of the compartment in retaining sand, requiring
more extensive and frequent nourishment campaigns. Moreover, the feasibility of massive beach
nourishment at Old Bar would be significantly limited by the scale and cost of such an undertaking,
as described below.
Any massive nourishment of Old Bar Beach would require a uniform increase in beach width along
the entire beach embayment from Wallabi Point to Urana Bombora, a shoreline distance of around
4.2 km. This would ensure that the beach is sustained in an equilibrium plan alignment in terms of
the natural wave and current processes. While it is acknowledged that the required degree of
protection varies along the beach, it would not be feasible to apply and sustain different
nourishment widths to different sections. Such an approach would lead to development of a
disequilibrium plan alignment that would likely require regular sand transfer from the northern end
of the beach (where sand would generally be expected to migrate due to natural processes such as
longshore drift) to the middle and southern sections.
The primary source of nourishment sand for Old Bar Beach would likely be from Farquhar Inlet.
However, given that cross‐shore sediment transport during storm events is considered a major sand
loss mechanism for the Old Bar Beach compartment, it is likely that significant volumes of nourished
sand would be lost offshore. This would result in a net reduction in sediment transport back into
Farquhar Inlet or bypassing the entrance to the north, which would be expected to lead to a net loss
of sediment from Manning Point Beach.
Nourishment sand could also be sourced from possible depositional areas immediately offshore of
the beach compartment. These areas are identified in WorleyParsons (2010a), although further
investigations would be required to confirm the presence and extent of these deposits. Moreover, it
should be noted that offshore mineral extraction along the NSW coastline is currently prohibited
under the Offshore Minerals Act 19992. It should also be noted that planning approval would be
required for any beach nourishment activities, including preparation of a detailed Environmental
Assessment.
2 While offshore sand extraction is presently prohibited, given the increasing number of studies supporting beach nourishment at several locations along the NSW coastline, e.g. PBP (2006) and AECOM (2010), it is reasonable to expect that the policy position of the NSW Government will be reviewed in the near future.
8A0271gpb‐Old Bar Design Investigation‐FINAL ‐ 20 ‐
Sand volumes required to nourish Old Bar Beach are estimated to be in the order of 1,000,000 m3
initially, with subsequent nourishment campaigns of around 1,000,000 m3 required approximately
every 10 years (WorleyParsons, 2010b). The total cost to implement such a scheme is estimated at
$147.1 million (WorleyParsons, 2010b), which is clearly not viable. In addition, it may not be possible
to fully source such significant sand volumes from the local sources identified above, with additional
offshore sand sources required to meet the nourishment volumes.
Costs could possibly be rationalised through the implementation of a sand back‐passing system
which transports sand onto Old Bar Beach via pipelines from Farquhar Inlet and/or offshore
depositional areas. A better understanding of regional sediment transport processes would be
required to further assess the feasibility of this option, including potential impacts on Farquhar Inlet
and Manning Point Beach. In any case, the scale and cost of such a scheme would likely exclude this
as a viable option.
The potential for choking of creek entrances would increase in response to beach nourishment
activities. As such, Council would need to ensure that mechanical clearance of sand from the
entrance to Racecourse Creek is undertaken on a regular basis. This sand would likely be relocated
in the southern or central portion of Old Bar Beach to replenish sand that presumably would have
migrated northwards to fill the creek entrance.
Overall, massive beach nourishment at Old Bar is not considered to be feasible at present. Beach
nourishment as a companion strategy with other primary works schemes is considered in
Sections 5.6 to 5.8.
5.6 Revetment and Beach Nourishment
As noted in Section 5.4, revetments can exacerbate localised erosion in front of the structure while
also resulting in end effects and possible outflanking as the adjacent shoreline continues to recede,
as expected at Old Bar Beach. In addition, the sandy foreshore at Old Bar would be expected to
disappear within several years of revetment construction given the observed high recession rates.
This would have potentially serious implications for public amenity, public access and aesthetics.
Revetments therefore are often considered in conjunction with beach nourishment programs, which
satisfies the dual objective of protecting development and maintaining beach amenity. Maintaining
a sufficient sand store in front of the revetment would also improve the longevity and overall
integrity of the structure as it would be less exposed to wave forces over its life. The revetment
design could also be rationalised saving costs because present day conditions could be assumed to
prevail throughout the structure’s design life.
For example, the design breaking wave heights impacting a revetment at Old Bar would be expected
to increase over the next 50 years (typical design life) as the beach recedes and sea levels rise (refer
Section 9.1.8). Adopting the mid‐life (2038) breaking wave height for design purposes (as proposed
for the present study, refer Section 9.1.8) would require rock masses for the revetment in the order
of three times larger than if the present day breaking wave height was adopted for design purposes.
Such a reduction in the required rock masses would achieve substantial cost savings. The footprint
of the structure would also be reduced, minimising incursion of the structure onto private land
and/or the existing beach.
Since a beach nourishment scheme for amenity purposes would not be required to meet the
objective of protecting development, the scale of nourishment activities described in Section 5.5

8A0271gpb‐Old Bar Design Investigation‐FINAL ‐ 21 ‐
could also be substantially reduced. WorleyParsons (2010b) estimated that sand volumes in the
order of 150,000 m3 would be required approximately every five years to maintain the (then) present
day beach widths in front of the revetment. The cost estimate for the nourishment component of
this option was estimated at around $2.5 million every five years, or $25 million over a 50 year design
life (2013$). This assumes that sand would be sourced from Farquhar Inlet and immediately offshore
from Old Bar Beach (Figure 4).
However, it is noted that the amenity nourishment scheme proposed in WorleyParsons (2010b) is
localised to the revetment and does not extend over the entire beach compartment. This may result
in the development of a disequilibrium plan alignment as the adjacent beach (north and south of the
revetment) continues to recede, accelerating the losses from the beach in front of the structure. The
stability of the nourished beach would progressively decrease over time, and the requirement for
periodic maintenance of dune profiles would increase in turn.
If nourishment was relied upon to maintain present day beach conditions in front of the revetment,
and the revetment design was rationalised accordingly as described above, it would need to be
guaranteed that nourishment activities would continue throughout the design life of the structure.
Otherwise, the structural integrity of the revetment may be reduced to unacceptable levels. This is
potentially problematic as it relies upon a commitment to ongoing funding which can never be
certain, and also require assurances with regard to sufficient sand sources.
In any case, the scale and cost of an amenity nourishment program is likely to render this option not
feasible, even if cost savings associated with a rationalised revetment design were taken into
account.

8A0271gpb‐Old Bar Design Investigation‐FINAL ‐ 22 ‐
Figure 4 –Revetment and nourishment scheme considered for Old Bar Beach in WorleyParsons (2010b)

8A0271gpb‐Old Bar Design Investigation‐FINAL ‐ 23 ‐
5.7 Groyne Field and Beach Nourishment
Groynes are structures that are aligned perpendicular to the shoreline to act as a physical barrier to
alongshore sediment transport, effectively trapping sand on the updrift side of the structure.
Multiple groynes are typically constructed at regular spacing along the shoreline to form a groyne
field, with the beach essentially transformed into a series of individual compartments.
Groyne fields are typically constructed on receding shorelines where longshore transport is the
dominant process, usually in one direction. While sand is captured on the updrift side of individual
groynes, corresponding erosion of the shoreline occurs immediately downdrift of the groyne, and is
particularly evident downdrift of the terminal (last) groyne. To some extent this can be managed by
reducing the groyne lengths with distance downdrift.
There are no open coast groynes located in NSW. Training walls at river entrances behave as
groynes, and it is fair to say that the legacy of these structures continues to challenge coastal
managers in dealing with interruption of longshore transport. The complexity of coastal processes
evident at Old Bar Beach casts considerable uncertainty over the effectiveness of groynes as a
reliable coastal protection measure.
Firstly, groynes are not considered to be appropriate for Old Bar Beach because longshore transport
occurs both to the north (ambient conditions) and south (storm conditions). Therefore, while
groynes constructed towards the northern end of the beach may have an accretionary effect on the
beach under ambient conditions, the natural ability of the system to re‐supply sand to the south
would be interrupted, with adverse implications for dune volumes, beach amenity and erosion
hazards generally.
Moreover, groynes would not address the cross‐shore sediment losses that are a dominant process
at Old Bar Beach, and recession would continue. In addition, groynes may exacerbate the
development of rip currents during storm events, which would enhance the offshore loss
mechanism and lead to further increases in recession rates. There may also be impacts on Farquhar
Inlet and Manning Point Beach as the sediment supply to these areas would be limited by the most
northern (terminal) groyne.
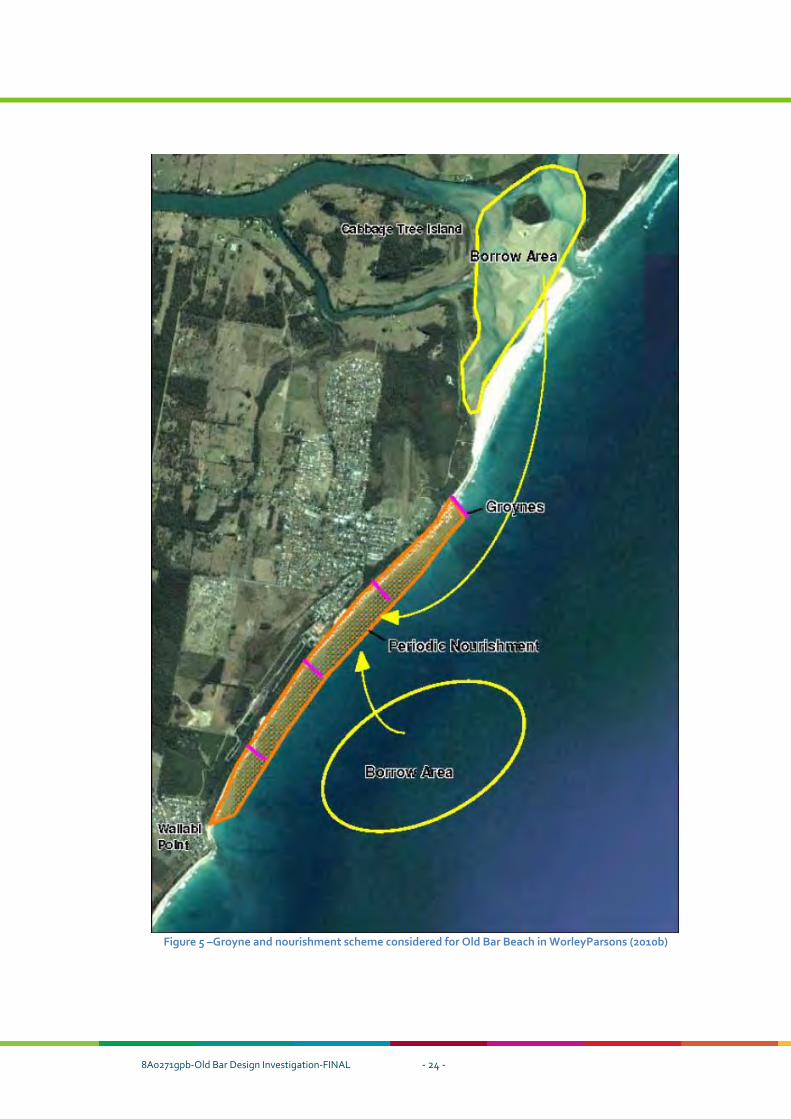
A groyne concept developed for Old Bar Beach was presented in WorleyParsons (2010b), and is
reproduced in Figure 5. This option also includes periodic nourishment to maintain the required
level of protection, with estimated nourishment volumes in the order of 640,000 m3 every 10 years.
The total cost to implement this option is estimated at $66.9 million, which is likely to be
prohibitively expensive in consideration of the uncertainties surrounding the effectiveness of such a
scheme.
8A0271gpb‐Old Bar Design Investigation‐FINAL ‐ 24 ‐
Figure 5 –Groyne and nourishment scheme considered for Old Bar Beach in WorleyParsons (2010b)

8A0271gpb‐Old Bar Design Investigation‐FINAL ‐ 25 ‐
5.8 Offshore Reef and Beach Nourishment
An offshore reef is essentially an underwater mound of material that reduces wave energy reaching
the shore, and thus reduces the risk of beach erosion affecting development. The reduction in wave
energy encourages sediment deposition in the sheltered area behind the breakwater leading to
formation of a salient (a shoreline bulge) or tombolo (salient forms to the extent that it attaches to
the reef/breakwater). Artificial reefs are now generally constructed from rock or sand‐filled
geotextile containers. At some sites, reefs have been designed to improve surfing conditions by
encouraging wave breaks in specific circumstances.
Two primary objectives of a nearshore breakwater/reef system are to provide protection to the
shoreline from storm damage, and to increase the life of a beach fill project. It may be possible to
provide a nearshore breakwater/reef arrangement to protect the shoreline at Old Bar Beach
supplemented as required with beach nourishment to ensure the required degree of protection.
WRL (2013) presented a comprehensive review of the use of artificial reefs for coastal protection in
NSW. Thirty‐two (32) existing reef structures around the world were reviewed, of which 29 were
intended to provide coastal protection as a primary or secondary objective. However,
approximately half of these “protection” structures were found to have no significant accretionary
impact on shoreline alignments compared to the predicted morphological response, with several of
the structures actually resulting in increased erosion/recession.
In general, WRL (2013) considered that an emergent breakwater would be likely to form a locally
widened beach on a relatively simple, straight coastline. However, the uncertainty in beach
response increases as crest elevation is lowered and the structure becomes submerged, e.g. artificial
reefs (WRL, 2013). In addition, WRL noted that many failures of these structures have occurred as a
result of structural problems due to complexities of building a structure in the active surf zone on
unconsolidated materials. Overall, the risk of these structures underperforming for coastal
protection compared with design is reasonably high, and this risk should be considered during the
planning and feasibility assessment of artificial reef projects.
An investigation was recently undertaken to assess the suitability of Old Bar Beach to an offshore
submerged reef structure (ASR, 2011). The structure would be designed to maximise the salient
response in the lee of the reef, developing a locally wider beach at Old Bar. However, it is
considered that more detailed and robust analysis would be required to reduce uncertainty in the
design and expected outcomes. This is discussed further in Section 6.2.
WorleyParsons (2010b) also presented an artificial reef concept plan for Old Bar Beach, which is
reproduced in Figure 5. This option includes periodic nourishment to maintain the required level of
protection, with estimated nourishment volumes in the order of 640,000 m3 every 10 years. The
total cost to implement this option is estimated at $52.9 million, which is likely to be prohibitively
expensive in consideration of the uncertainties surrounding the effectiveness of such a scheme.
The considerable complexities surrounding regional coastal processes at Old Bar Beach mean that
the ability to predict shoreline response to an artificial reef structure(s) at this location would be
highly uncertain. In addition, one of the mechanisms for erosion in the lee of submerged coastal
structures is thought to be the development of diverging longshore currents between the structure
and shoreline due to flow being directed over the structure due to wave breaking (Ranasinghe and
Turner, 2006). This mechanism is similar to that observed during highly erosive storm events at Old

8A0271gpb‐Old Bar Design Investigation‐FINAL ‐ 26 ‐
Bar, so there is a risk that an artificial reef structure would exacerbate the erosive processes that
currently occur (WorleyParsons, 2010b).
In addition, artificial reef structures would not necessarily prevent offshore transport of sediment
during storm events, leading to the possibility of continued recession. In addition, reef structures
may exacerbate the development of rip currents during storm events, which would enhance the
offshore loss mechanism and lead to further increases in recession rates.
It would be difficult, if not impossible, to design a reef to improve everyday surfing conditions at Old
Bar Beach (that is, for wave heights in the order of 1.0 to 2.0 m) while suitably addressing the risk to
development from beach erosion (when wave heights can be above 5 m and water levels due to high
tide and storm surge can cover the reef to a depth where the reef has little or no effect on reducing
erosion). To be effective during severe storms the top of the reef would need to be above water
level during calmer conditions. This would significantly increase cost and compromise safety.

8A0271gpb‐Old Bar Design Investigation‐FINAL ‐ 27 ‐
Figure 6 –Artificial reef and nourishment scheme proposed for Old Bar Beach in WorleyParsons (2010b)

8A0271gpb‐Old Bar Design Investigation‐FINAL ‐ 28 ‐
6 RECENT COASTAL ENGINEERING INVESTIGATIONS AND PROJECTS AT OLD BAR BEACH
6.1 Introduction
There are three recent investigations and project proposals for Old Bar Beach that warrant a
technical summary and discussion. This provides an insight to the scientific and engineering
deliberations of others in their proposals to protect the shoreline. The information is presented to
assist the design process for the current investigation and not to independently review and critique
these previous investigations and proposals.
The following recent investigations and proposals are addressed:
(i) Multipurpose reef proposal
(ii) Old Bar Erosion Protection Works DA (Lewis Street DA)
(iii) Crib seawall scheme (AUS Seawalls / Tideline)
6.2 Multipurpose Reef Proposal
6.2.1 ASR Investigation
The Old Bar Beach Sand Replenishment Group retained ASR Limited from New Zealand to
undertake a stabilisation feasibility study for Old Bar based on a multipurpose reef (MPR) system.
ASR reported in this matter in September 2011 (ASR, 2011).
The investigation was undertaken to assess the suitability of the site to an offshore submerged reef
structure. The structure would be designed to maximise the salient response in the lee of the reef,
developing a locally wider beach at Old Bar.
The ASR investigation considered bathymetric and topographic data, met‐ocean data, SWAN wave
modelling, and the empirical design and morphological modelling of reef structures. A rough order
of cost is also presented.
Available bathymetry was used to develop offshore, nearshore and inshore model grids for input to
the SWAN model (see below). The large grid had a 200 m resolution, and the nested nearshore and
inshore grids a 50 m and 10 m resolution respectively.
The met‐ocean data was compiled to provide a basic understanding of the site, calibrate numerical
models and develop the inshore wave climate. This comprised Aquadopp current and wave records
(6 weeks), WW3 wave data (1997‐2011), Crowdy Head offshore Waverider Buoy data (6 weeks
coinciding with Aquadopp records), and tidal and wind data. A single year of wave data (2005) was
selected as representative of the full seasonal climate for the SWAN modelling.
SWAN (Simulating WAves Nearshore) is an ocean wave propagation model which solves wave
equations for directional wave spectra. The wave field is described as it changes in time and space
taking into account wave growth due to wind stress, wave refraction and wave decay due to white
capping, bottom friction and depth limited breaking. The SWAN models were used to develop
boundary conditions for ASR’s in‐house WBEND and 2DBeach process and morphological models.

8A0271gpb‐Old Bar Design Investigation‐FINAL ‐ 29 ‐
To efficiently tackle the morphological modelling, empirical design methods were used to develop
first pass estimates for the reef geometry and placement. Also, in combination with the empirical
methods, some basic refraction/diffraction modelling was applied to determine the width of the surf
zone. ASR found that reefs with a crest tip approximately 300 m offshore would be appropriate for
morphological modelling.
Morphological modelling with reef crest levels of Mean Sea Level (MSL, RL 0), RL ‐0.5 and RL ‐1.0
was undertaken using 2DBEACH. ASR found that in taking all of the results into consideration along
with their experience of previous designed and measured results, an MPR placed 250 m offshore
with a crest level at RL ‐0.5, an alongshore length of approximately 110 m and a volume of
approximately 18,000 m3 would lead to the development of a salient with a volume of 20,000 to
25,000 m3 with some 500 to 600 m of beach widened by between 10 m at the ends and in excess of
40 m in the lee of the reef. Typical modelling results are shown in Figure 7.
Figure 7 – Results of 2DBEACH modelling for MPR with crest elevation of RL‐1, RL ‐0.5 and RL 0 (MSL),
shown from left to right (Source: ASR, 2011)
Two reef structures were considered, either as MPR’s, shore‐parallel breakwaters, or a combination
of the two. “Rough order” costs as sand‐filled geotextile container structures were reported as
follows (sand volume given in brackets):
MPR (17,900 m3) $4.3 to 4.9 million
Shore‐parallel breakwater (10,900 m3) $2.6 to 3.0 million
To reduce total project cost, it was proposed by ASR that the southern reef would be built with
reduced amenity incorporated into its design, i.e. it would be a shore‐parallel breakwater rather than
an MPR. A schematic layout of the MPR scheme is shown in Figure 8. It follows that the total cost
estimate for the dual reef scheme developed by ASR is $6.9 to 7.9 million, considered by ASR to
widen approximately 1,200 m of beach length at Old Bar in the area of most aggressive erosion.

8A0271gpb‐Old Bar Design Investigation‐FINAL ‐ 30 ‐
Figure 8 – Schematic layout of proposed MPR and shore‐parallel breakwater showing
conceptualisation of salient (beach width) response (Source: ASR, 2011)
6.2.2 WRL Peer Review
The Water Research Laboratory (WRL) of the University of New South Wales undertook a peer
review of the ASR investigation report in May 2012 (WRL, 2012).
Based on the level and the limitations of the analysis presented in ASR (2011), it was the reviewer’s
opinion that it was not possible to accurately assess the feasibility of a MPR for providing coastal
protection at Old Bar. They determined that caution should be taken when interpreting the
expected beach response and costs in ASR (2011), as the completed analysis showed that
significantly different beach responses may occur, and depending on this response the required
number of reef structures and cost may also be significantly different (from that predicted by ASR).
Furthermore, it was found that the level of hazard reduction that can be expected to be generated
by the reef was not defined in ASR (2011). As pointed out by WRL, this is a key parameter required
to properly assess the feasibility of this or other coastal protection options.
WRL concluded that while artificial reefs might provide adequate protection at Old Bar, more
detailed and robust analysis is required to reduce uncertainty in the design and expected outcomes.
8A0271gpb‐Old Bar Design Investigation‐FINAL ‐ 31 ‐
6.3 Lewis Street DA
6.3.1 General
The Meridian Resort located at 32 Lewis St, together with a number of neighbouring properties
covering No.’s 24‐40 Lewis Street, prepared and submitted in June 2012 DA no. CP12‐001 to the
NSW Coastal Panel for a sand filled geotextile container seawall. The application to the NSW
Coastal Panel was made under the State Environmental Planning Policy 2007 (Infrastructure) and was
determined by the NSW Coastal Panel in July 2013. The Coastal Panel is a statutory authority
established by the Coastal Protection Act 1979.
The development proposal involved construction of a seawall extending initially some 190 m along
the crest from 24 Lewis Street in the north to 34 Lewis Street in the south. The seawall comprised
between one and two layers of 2.5 m3 geotextile containers (nominally sized 650 × 1800 × 2400 mm
when filled), laid with their long edges shore‐parallel to a conventional stretcher‐bond pattern. The
overall wall was 11 courses high, with crest level set to a minimum of RL 6.0, and the underside of
the toe (as constructed) to a maximum of RL ‐1.0. The wall slope was 1:1.5 (v:h).
A row of containers with a scour flap was included along the seaward edge of the bottom course,
designed to rotate in the event of scour below RL ‐1.0. Although the existing design scour level for
the beach was adopted as RL ‐1.0, it is recognised that as the beach recedes with time, the design
scour level may lower, hence the provision for rotation of the leading container row.
The seawall generally comprised a double layer of containers except for the top five courses of the
wall which comprised a single layer initially, with the addition of a second layer to be placed if and
when required.
The footprint of the structure was located fully within the foreshore private property boundaries.
A minimum clearance of 1 m was achieved between the seaward property boundaries and the
seaward edge of the wall as placed. Sand fill behind the seawall crest up to approximately 7 m wide
was required to achieve the design alignment. It was also proposed as part of the project to
reinstate the beach profile such as to achieve a minimum back‐beach sand level at the face of the
seawall of RL 3.0.
The DA was amended twice over the course of the application. The DA design was undertaken by
International Coastal Management (ICM) based on the Gold Coast on behalf of the Owners
Corporation of Strata Plan 61034 (Meridian Resort).
According to ICM, the expected design life of the seawall was 25 years limited by UV exposure. The
cost of the project estimated for the DA was $630,000, or approximately $3,300/m based on a 190 m
long structure.
A Statement of Environmental Effects was prepared by ICM to support the DA. This document
describes the proposal, the environment of the site, and the interaction between the proposal and
the environment. Submissions were invited by the Coastal Panel and received from government
stakeholders and members of the community, and their responses can be viewed on the Coastal
Panel’s web site.
It is understood that the Coastal Panel, in making their determination, took a particular interest in
issues related to land ownership, quantification and management of seawall end effects, restoration
8A0271gpb‐Old Bar Design Investigation‐FINAL ‐ 32 ‐
of the beach during and after the life of the works, structural integrity and adequacy of the design
life, implications for possible rock placement at the toe in relation to amenity, public access and
public safety, and seawall alignment, in particular the opportunity to consider a more landward
alignment to address beach access issues.
6.3.2 Determination
In July 2013, the Coastal Panel refused consent to the application for three main reasons. In relation
to s55M(1) of the Coastal Protection Act 1979, the Panel was not satisfied that, over its expected
25 year life:
(i) the proposed seawall would not unreasonably limit (or be likely to unreasonably limit)
public access to or use of the beach in the vicinity of the seawall; and
(ii) the proposed seawall would not pose (or be likely to pose) a threat to public safety; and
(iii) that satisfactory arrangements had been offered by the Applicants to secure adequate
funding for the carrying out of restoration and maintenance works.
In coming to its decision, the Panel also took into consideration matters identified in SEPP 71 –
Coastal Protection, and matters prescribed in the Environmental Planning and Assessment (EP&A)
Act and Regulation, and the NSW Coastal Policy.
6.4 AUS Seawalls / Tideline
6.4.1 Background
AUS Seawalls has made representations to Council and the NSW Government regarding the
application of its seawall product for addressing coastal erosion at Old Bar. It is of interest to this
investigation to consider the technical applicability of the AUS Seawalls product to the site. HKA
has discussed the product with John Nelson, a proprietor of AUS Seawalls / Tideline (23/10/13 pers.
comm.), and a typical concept section sketch was provided (Figure 9), as well as details of model
testing against wave action (CSIR, 1991).
The AUS Seawalls / Tideline product comprises a crib wall constructed with the Waterlöffel block, a
derivative of the Löffelstein block. Both blocks are designed to retain soil embankments and
prevent erosion, the difference being that the Waterlöffel block is designed for use in streams and
channels (CSIR, 1991).
The Waterlöffel block incorporates a compartment wall and two wings which lock the individual
blocks together (Figure 10). When the wings and the compartment walls of the blocks are aligned,
by using a dry stacking method, a retaining wall is created. The wall prevents erosion by providing a
protective facing to the embankment. The front pockets of the blocks result in a large roughness in
the wall, reducing water velocities and dissipating energy.

8A0271gpb‐Old Bar Design Investigation‐FINAL ‐ 33 ‐
Figure 9 – AUS Seawalls concept (John Nelson, AUS Seawalls / Tideline, 23/10/13 pers. comm.)
Although originally designed for use in areas where wave action is negligible, schemes have been
proposed and implemented where predominant forces on the blocks are due to wave action. HKA
understands that physical modelling investigations undertaken at CSIR in Stellenbosch, South
Africa, is the only modelling work undertaken to assess how the blocks stand up to wave forces.
HKA has also made its own enquiries of the performance of equivalent seawall installations in
Durban, South Africa.
6.4.1 Waterlöffel Model Testing
The CSIR investigation envisaged four stages for model testing: small scale tests of a typical wall
built to the standard recommended layout, tests on the wall with varying foundations and slopes,
larger scale tests and full scale monitoring. It is understood that to date stage one has been
completed and reported, this relating to the stability of the wall when subjected to varying wave
heights, and the effect of block packing density on the stability of the wall (CSIR, 1991).
A model scale of 1:10 was operated in accordance with Froude Law of similitude. Regular and
“pseudo‐random” waves were tested, the latter representing a more realistic situation produced by
continuously varying the wave period so that the waves could superimpose themselves on each
other to produce groups of high and low waves. Modelling of the ballast filter drain behind the wall
was approximated by using relatively large stones which would not be in accordance with the
Froude scaling law but considered reasonable for this application. A concrete capping slab was
placed over the top of the stacked block wall.

8A0271gpb‐Old Bar Design Investigation‐FINAL ‐ 34 ‐
Figure 10 – Waterlöffel block used in the AUS Seawalls
/ Tideline product
The model was constructed on a rigid cement foundation. This would simulate a bedrock
foundation, or a foundation located below scour level.
The tests indicated minimum packing densities to ensure interlocking and stability. All tests showed
wall failure due to wave attack greater than 2.0 m when large volumes of water overtopped the wall.
CSIR found that saturation of the backfill reduces the stability of the material which in turn can exert
outward forces on the block wall which, together with the wave induced forces, cause the wall to
fail. Although the modelling laws applicable to the saturation process were not fully governed by
Froude scaling, CSIR nevertheless formed an opinion that the test results are realistic and give a
reasonable reproduction of the failure mechanisms.
The test results indicated that, provided a packing density of 11.5 to 12 blocks per m2 is used, no
damage occurred to the block wall for the 0.7 m water depth for waves up to 2.0 m high lasting up to
12.6 hours prototype time. However, damage/failure did occur for these packing densities for the
1.3 m water depth and waves up to 2.35 m high after 1.6 to 2.4 hours prototype time. The blocks
may, however, be more stable under these conditions if the saturation of the sand behind the wall
could be avoided.
In setting out the limitations of the results, it was noted that the strength of the individual blocks
was not scaled; hence the model units were considerably stronger than their prototype counter‐
parts. The wings would be particularly vulnerable under repeated wave attack and if broken could

8A0271gpb‐Old Bar Design Investigation‐FINAL ‐ 35 ‐
cause the wall to fail. Also, as the model was founded on a concrete floor, it simulated a rigid
foundation. If the foundation settled due to scour, then the model results would not be applicable.
Finally, the modelling examined the structural failure of the wall due to the movement of the blocks.
The gross embankment stability with particular reference to slip circle failure was not correctly
scaled (CSIR, 1991).
6.4.2 Waterlöffel Seawall Performance in KwaZulu Natal
Waterlöffel seawalls have been built along selected sections of the KwaZulu Natal coast, in Knysna and in Cape Town, over the past 15 years. They were first introduced after the CSIR model study. According to the Waterlöffel brochure, the design engineer must give careful attention to the detail in the scheme, especially to protect the toe from scour, the top of the bank from run‐off and over topping and reinforcement of the backfill. Some walls using the system were damaged by heavy seas along the KwaZulu Natal coast in 2007; the reason given for this is that they were built with foundations on sand instead of bedrock. Standard designs for the correct installation of Waterlöffel walls must ensure that they are founded on bedrock.
Almost 4 km of Löffelstein walls were constructed at Brighton Beach, Umhlanga Rocks and Umdloti
in the 1980s. According to Corbella and Stretch (2012), a large proportion of these walls failed in the
March 2007 storm, and a section also failed at Brighton Beach and Umhlanga in 2011. The failures
were the result of water down‐rush, and overtopping washing sediment out from behind the walls.
This combination caused the walls to collapse. The failure mechanism highlighted the need for
adequate drainage and filtration behind the walls.
It was found that geotextile was placed in two methods behind the Löffelstein walls, some vertically
parallel to the face of the walls, and some both vertically and horizontally. Some of the walls with
the vertical geotextile panels failed, whereas none of the walls with both vertical and horizontal
geotextile failed. Corbella and Stretch (2012) surmised that the perpendicular geotextile tiebacks
limited the likelihood of sediment escaping through gaps in the parallel filter. While the walls failed
due to filtration problems, none of the walls were undermined. This was a consequence of the walls
being either founded on rock or on a bed of gabion mattresses below the lowest scour profile.
A photograph showing failure of a Waterlöffel seawall in Durban during the March 2007 storm is
provided in Figure 11.
It is noted that there is no rock within the scour zone at Old Bar Beach.
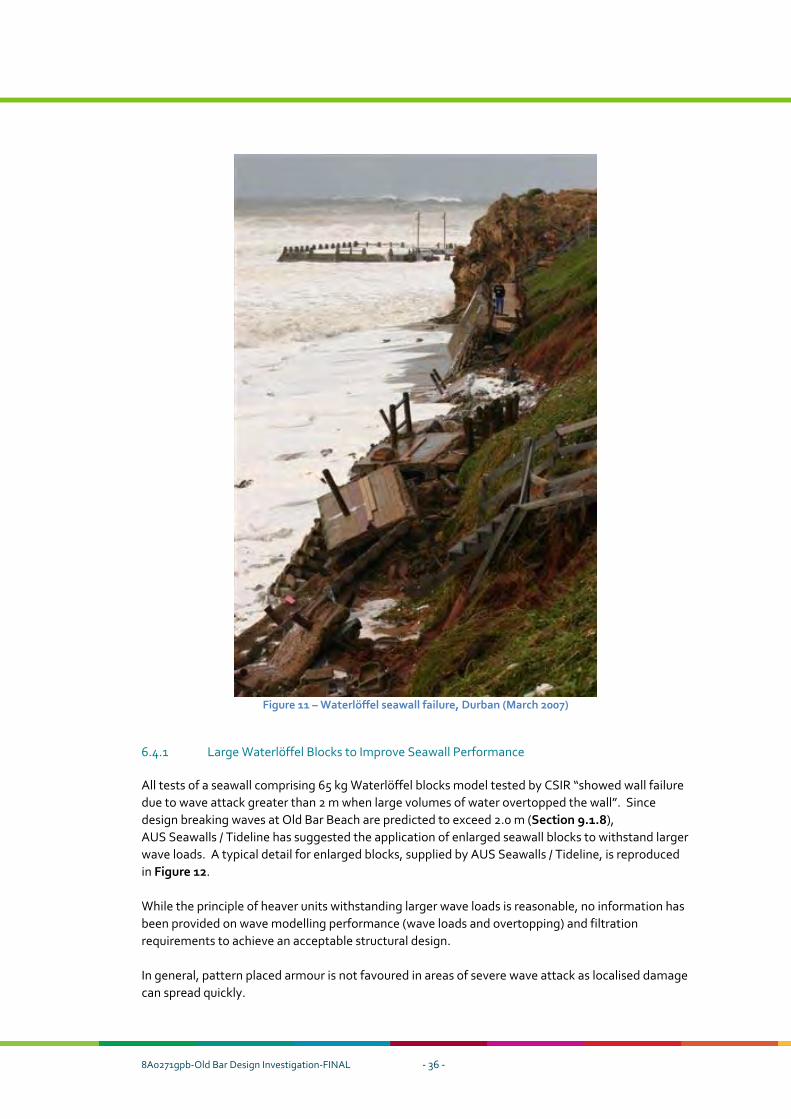
8A0271gpb‐Old Bar Design Investigation‐FINAL ‐ 36 ‐
Figure 11 – Waterlöffel seawall failure, Durban (March 2007)
6.4.1 Large Waterlöffel Blocks to Improve Seawall Performance
All tests of a seawall comprising 65 kg Waterlöffel blocks model tested by CSIR “showed wall failure
due to wave attack greater than 2 m when large volumes of water overtopped the wall”. Since
design breaking waves at Old Bar Beach are predicted to exceed 2.0 m (Section 9.1.8),
AUS Seawalls / Tideline has suggested the application of enlarged seawall blocks to withstand larger
wave loads. A typical detail for enlarged blocks, supplied by AUS Seawalls / Tideline, is reproduced
in Figure 12.
While the principle of heaver units withstanding larger wave loads is reasonable, no information has
been provided on wave modelling performance (wave loads and overtopping) and filtration
requirements to achieve an acceptable structural design.
In general, pattern placed armour is not favoured in areas of severe wave attack as localised damage
can spread quickly.

8A0271gpb‐Old Bar Design Investigation‐FINAL ‐ 37 ‐
Figure 12 – Enlarged Waterloffel block detail intended to cater for wave heights in
excess of 2 m (John Nelson, AUS Seawalls / Tideline 28/10/13, pers. comm.)

8A0271gpb‐Old Bar Design Investigation‐FINAL ‐ 38 ‐
7 GTCC DESIGN PRINCIPLES FOR COASTAL PROTECTION STRATEGY
7.1 Introduction
The key objective of the Brief is to develop a realistic long‐term coastal protection option extending
from the Surf Club in the north to the MidCoast Water exfiltration ponds in the south. In selecting
and developing this option, Council has identified eight guiding design principles to be achieved.
These principles are reproduced from the consultancy brief as follows:
(i) Proven performance and cost‐effective
(ii) Minimise impact on beach amenity and public access
(iii) Resilient and adaptable design
(iv) Public safety requirements
(v) Management of end effects
(vi) Racecourse Creek entrance stability
(vii) Management of shoreline recession impacts
(viii) Feasible structural life
HKA is mindful of potential overlap and possible conflict in a number of these principles. The
approach brought to this investigation has been to work through and discuss the principles with
Council and OEH based on accepted coastal engineering literature and HKA’s experience with
comparable sites and designs, particularly in NSW.
7.2 Proven Performance and Cost Effectiveness
Seawalls and coastal revetments are used extensively to protect developed back‐beach shorelines in
NSW. Their construction most probably commenced in Sydney at Coogee and Manly Beaches
around 1900, and today there are likely to be in excess of 10 km of sea defences along the NSW
coast (having regard to Gordon, 1989).
Based on his assessment of Sydney’s Sea Defences, Gordon (1989) found the cost of the defences
(primarily seawalls) to be less than 5% of the cost of the assets that were protected. The average
maintenance cost applied for seawalls and revetments was 1% of the capital replacement value per
year.
Available coastal protection options for Old Bar are discussed in Section 5. In HKA’s experience the
vast majority of spend on structural coastal protection in NSW is allocated to seawalls and
revetments.
7.3 Minimise Impact on Beach Amenity and Public Access
Council is seeking a coastal protection strategy that minimises impact on beach amenity and public
access balanced with protection of property, assets and infrastructure. This will always be
problematic on a receding coastline where the available beach width is being diminished between
the landward advance of the water line and shorefront properties.
Coastal protection options which stand to minimise impact on beach amenity and public access
would potentially include beach nourishment and offshore reefs or breakwaters. However, beach
nourishment must be excluded at Old Bar as a stand‐alone coastal protection strategy since vast

8A0271gpb‐Old Bar Design Investigation‐FINAL ‐ 39 ‐
quantities of sand would be required to offset, within a sustainable compartment and over a 50 year
planning timeframe, the high recession rates at Old Bar (average 0.8 m/year excluding sea level rise
(SLR) recession, Section 9.1) and also provide a suitable buffer against storm erosion (generally
220 m3/m from WorleyParsons, 2010a). ASR (2011) investigated an offshore reef to provide
protection and delivery of improved amenity (surfing), but questions as to its design and
performance have been raised in the peer review (WRL, 2012).
The impact of seawalls on beaches is a much mooted topic. Seawalls are maligned widely as culprits
of additional and permanent erosion that would otherwise not have occurred. However, the
available scientific literature does not support this. It does indicate that there is additional erosion in
front of a seawall which approximately equates to the volume of the beach and dune sand that is
locked up behind the wall which, if the wall was not there, would have fed the erosion demand (the
so‐called “approximate principle” after Dean (1986)). However, for typical seasonal transitions and
certainly within annual cycles, there is no evidence to suggest that the beach profiles are
significantly different between adjacent walled and non‐walled sections (Kraus and McDougal,
1996). So, additional sand is eroded in a storm in front of a wall, but that returns in the short term
(within a year). This is not to say that the construction of a seawall at Old Bar would not eventually
lead to the loss of the beach – it would simply be because the wall is fixed in position on a naturally
receding shoreline. The timeframe for loss of the beach would depend on the cross‐shore position
of the wall – the more landward the structure, the longer it would take until the fronting beach is
lost.
Unless a beach of adequate amenity width could be preserved at Old Bar, any seawall would need to
incorporate a longshore footpath either behind the crest or within the face of the wall itself. To
provide privacy to shorefront properties, it would be necessary for views from the footpath into the
properties to be suitably screened.
7.4 Resilient and Adaptable Design
There is uncertainty regarding the reasons for the large beach recession experienced at Old Bar, a
behaviour accentuated in the past decade. Coastal engineering investigations undertaken over the
past 30 years have each developed somewhat differing opinions (Section 4). Council requires that
the coastal protection option developed for Old Bar be resilient and adaptable to all possible process
drivers, irrespective of the uncertainty.
A seawall would offer the most reliable coastal protection strategy notwithstanding the likely total
loss of the beach in the medium to longer term.
A random placed rock armoured revetment would be more resilient and adaptable than a block
sandstone seawall or similar pattern‐placed wall. If sea level rises as is predicted, topping up to cater
for increased toe scour and breaking wave heights should be achievable with a random placed rock
structure.
7.5 Public Safety Requirements
It is required that the design not compromise public safety. To achieve this it would be necessary to
ensure safe longshore and cross shore pedestrian access in the vicinity of a structure. For a seawall
located on a receding beach it would be necessary to provide for a footpath within or landward of
the structure when a suitable beach width becomes unavailable.

8A0271gpb‐Old Bar Design Investigation‐FINAL ‐ 40 ‐
Based on the recent recession behaviour observed at Old Bar fronting the Meridian Resort, it is
predicted that the Mean High Water Mark under normal everyday wave conditions would start to lap
the current position of the toe of the back‐beach embankment for a typical non‐eroded beach state
within approximately 10‐20 years. At about that time the safety of persons walking along the beach
in the vicinity of the Resort could start to be compromised under normal wave conditions. Like most
beaches, walking along any part of Old Bar Beach today under storm conditions may be unsafe.
7.6 Management of End Effects
A seawall may also lead to flanking erosion at both ends of the structure.
According to DECCW (2010b) additional erosion close to the ends of a seawall can be estimated in its
cross‐shore and alongshore extents. For a runup level up to RL 8 (which accounts for all existing and
future design conditions at Old Bar up to the end of the 50 year planning in 2063) it is recommended
in DECCW (2010b) that the cross shore extent of the erosion be increased by 80% due to the
presence of the wall, and the longshore extent increased by 70% of the length of the seawall or
500 m, whichever is the lesser. The distribution of the cross shore extent of the erosion within the
footprint of the flank may be estimated from the description provided in Figure 13, i.e. that the 80%
maximum applies at approximately 1/3 of the distance of the longshore erosion measured from the
end of the structure (James Carley, WRL, pers. comm.).
Under unidirectional longshore sediment transport the flanking impact at the updrift end of the wall
is likely to be substantially reduced.
Managing end effects can be achieved with periodic placements of sand, possibly scraped from
other areas along the beach. This is addressed as a maintenance action for the proposed seawall at
Old Bar (Section 9.1.11).
Figure 13 – Excess erosion (r) due to presence of a structure as a function of
structure length (Ls) after McDougal et al. (1987)

8A0271gpb‐Old Bar Design Investigation‐FINAL ‐ 41 ‐
Photo 6 – Example of severe washout due to overtopping and flanking erosion at the southern end of Stockton Seawall, Newcastle NSW (photo July 1999, courtesy NCC). The design crest level of the seawall
is RL 5.5, and Hs max during the event was reported at 6.1 m (DHI, 2006).
7.7 Racecourse Creek Entrance Stability
Racecourse Creek has its outlet adjacent to Pacific Parade, entering the back‐beach from the north.
The creek entrance meanders over a beach length of some 150 m resulting in an unvegetated back‐
beach area mostly lying between RL 1 and RL 3 and up to 60 m wide. North and south of the creek
entrance the subaerial beach is narrow, generally lacking a substantial beach berm. Flood flows
from the creek periodically scour the back‐beach, maintaining low sand reserves in the creek
entrance area. AWACS (1991) reported on a management strategy to stabilise the entrance to
Racecourse Creek, implemented by Council in mid‐1992.
AWACS proposed a 100 m long gabion training wall located at the southern end of Pacific Parade,
extending to opposite Rose Street. As shown in the final design (GTCC Dwg No G285, May 1992
reproduced in Appendix C), the wall alignment transitions through a horizontal curve of
approximately 75 degrees directed shore‐normal at its seaward end. The training wall comprises a
3 x 1 m2 stacked placement of box gabions seated on the back edge of a 6 × 2 × 0.3 m reno mattress.
The wall crest at the top gabion basket is set at RL 2 and the underside of the reno mattress at
RL ‐0.3 (and locally at RL ‐0.5 at the seaward end). The general wall section is mirror‐duplicated at
the seaward end of the wall to bolster the structure to accommodate wave scour from either the
north or the south. The construction cost of the gabion training wall is not known.
AWACS adopted the following values for the training wall design:
Channel scour RL ‐2
Elevated water/flood level RL 2.2

8A0271gpb‐Old Bar Design Investigation‐FINAL ‐ 42 ‐
Flood velocity 3.6 m/s
Beach scour level RL ‐1.0
Breaking wave height 2.9 m
In the longer term SLR could have adverse effects on coastal hazards. AWACS postulated a 0.25 m
SLR over 50 years potentially causing an additional 20 m of shoreline recession thereby exposing the
training wall to increased wave energy. The design philosophy adopted by AWACS to cope with SLR
assumed that the normal requirements for wall maintenance would suffice given the ability of the
design to be modified in the future.
While the construction details of the gabion wall are not known, it is expected that the gabions
would be PVC coated galvanized wire. Today the gabion wall is totally covered with sand (it was not
visible during our site visits on 9 and 23 September 2013). From time to time the head of the wall
has become exposed in the beach berm and Council has had occasion to remove parts of the
exposed structure to protect beach users from possible injuries on the wire baskets. The condition
of the baskets generally is not known.
The head of the training wall is located over 200 m from the back‐beach erosion escarpment
opposite Rose Street. At its extremity the head of the wall presents as a shore‐normal structure and
any predominant longshore movement of sand would be expected to accumulate on the updrift side
of this seaward end of the wall. However, no bias in the sediment accumulation here is apparent on
the beach today or in the photogrammetry, indicating that the wall crest is either too low or too
short to trap longshore movements, or that the net longshore movements are small. The latter
could be interpreted as supporting the conceptual model of sediment transport presented in
WorleyParsons (2010a) which refers to a bi‐directional transport with ambient sand movement from
south to north, and movement in storms from north to south.
The design parameters adopted by AWACS for the training wall are reasonable and there would
appear to be merit in keeping the wall over the medium term, to stabilise the entrance to the creek
and to protect the adjoining shoreline. There could be some advantage in utilizing the position of
the training wall to help manage flanking effects from the northern end of a first stage seawall
constructed to protect the private properties along Lewis Street.
7.8 Management of Shoreline Recession Impacts
Recent beach surveys and photogrammetry at Old Bar clearly show an acceleration of beach
recession over the past decade. WorleyParsons (2010a) adopted 0.6 m/year as a long term rate of
shoreline recession, excluding the effects of SLR. With the most recent photogrammetry and beach
surveys included (2009, 2012 and 2013), the average long term recession rate for the 2 km works
area is revised upwards to 0.8 m/year, excluding the effects of SLR (Section 9.1)
Any coastal protection structure would need to be designed to accommodate a lowering cross‐shore
coastal profile associated with shoreline recession.
7.9 Feasible Structural Life
All coastal structures deteriorate over time. Early maintenance is generally recommended to
prevent more significant damage. Regular inspection of the structure would permit early detection
allowing implementation of economic maintenance measures. In accordance with AS 4997

8A0271gpb‐Old Bar Design Investigation‐FINAL ‐ 43 ‐
Guidelines for Design of Maritime Structures, the design working life for normal maritime structures is
50 years.
The planning timeframes adopted in the Draft CZMP are 50 years and 100 years
(WorleyParsons, 2013). Council has requested that the design of the coastal protection structure for
Old Bar allow for a structural life of 50 years.
In discussion with Council and OEH, HKA has adopted a design regime for a coastal protection
structure at Old Bar which is based on the structure experiencing less than 5% damage for a 100 year
Average Recurrence Interval (ARI) storm occurring at mid‐life (2038), and accepting a higher level of
damage at the end of life (2063) but less than full structural failure. According to CERC (1984), full
structural failure of a random‐placed armour revetment is associated with approximately 30%
damage (Section 9.1).

8A0271gpb‐Old Bar Design Investigation‐FINAL ‐ 44 ‐
8 SELECTION OF PREFERRED LONG TERM COASTAL PROTECTION OPTION
It is understood that to “do nothing” and resort only to emergency response is not acceptable to
Council, OEH or the local community. Similarly, it is understood that a policy stance of planned
retreat without landholder compensation is likely to be regarded as unacceptable at the present
time. As such, engineering solutions are likely to be necessary to address the erosion threat at Old
Bar Beach.
Massive beach nourishment to provide protection for all beachfront development at risk is not
considered to be feasible at present. The expansive and essentially ‘open’ beach compartment
between Wallabi Point and Farquhar Inlet is poorly suited to nourishment as an option due to a
relative inefficiency of the compartment in retaining sand. Moreover, the feasibility of massive
beach nourishment at Old Bar would be significantly limited by the scale and cost of such an
undertaking. Securing viable sand sources may also be problematic.
Groyne fields are typically constructed on receding shorelines where significant longshore transport
exists, usually in one direction. As such, groynes are not considered to be appropriate for Old Bar
Beach because longshore transport is understood to occur both to the north and south. Moreover,
groynes would not address the cross‐shore sediment losses that are a dominant process at Old Bar
Beach, and recession would continue unless significant beach nourishment programs were
implemented. In addition, groynes may exacerbate the development of rip currents and associated
erosional processes, while impacts on Farquhar Inlet and Manning Point Beach may be realised as
the sediment supply to these areas would be limited by the groyne field.
The risk of artificial reef structures, as proposed for Old Bar, underperforming for coastal protection
is high. The considerable complexities surrounding regional coastal processes at Old Bar Beach
mean that the ability to predict shoreline response to an artificial reef structure(s) at this location is
uncertain. Furthermore, these structures would not prevent offshore transport of sediment during
storm events, leading to the likelihood of continued recession. In addition, reef structures may
exacerbate the development of rip currents during storm events, which would enhance the offshore
loss mechanism and lead to further increases in recession rates.
Coastal revetments can be designed with a high degree of certainty that the structure will satisfy the
objective of protecting development at risk. Similar certainty is presently not available for any of
the other structural options discussed herein. As such, a revetment is considered to provide the
most reliable and effective means of coastal protection at Old Bar Beach.
However, revetments can exacerbate localised erosion in front of the structure while also resulting in
end effects and possible outflanking as the adjacent shoreline continues to recede, as expected at
Old Bar Beach. In addition, the sandy foreshore at Old Bar is expected to be lost within say 10 to 20
years of revetment construction based on observed recession rates (Section 7.5), which would have
potentially serious implications for public amenity, public access and aesthetics.
A revetment constructed in conjunction with beach nourishment would satisfy the dual objective of
protecting development and maintaining beach amenity. Maintaining a sufficient sand store in
front of the revetment would also improve the longevity and overall integrity of the revetment
structure, providing some opportunity to rationalise revetment design. However, the scale and cost
of an amenity nourishment program would be significant, rendering this option not feasible at the
present time.

8A0271gpb‐Old Bar Design Investigation‐FINAL ‐ 45 ‐
A revetment has therefore been identified as the preferred coastal protection option for Old Bar
Beach. This structure would be designed for the primary objective of protecting development. It is
recognised that this approach would ultimately result in a loss of beach amenity if the shoreline
continues to recede, with other engineering options required to address this issue if required.

8A0271gpb‐Old Bar Design Investigation‐FINAL ‐ 46 ‐
9 PRELIMINARY DESIGN OF COASTAL PROTECTION STRUCTURE FOR OLD BAR BEACH
9.1 Basis of Design (BOD)
In accordance with HKA’s standard quality procedures, a Basis of Design for a seawall at Old Bar has
been developed in consultation with GTCC and OEH. This sets out the key criteria for the
preliminary design and the range of design assumptions. The following elements are included.
• Design life
• Foreshore protection principles and staging (triggers)
• Public access and safety principles
• Ground conditions
• Construction footprint with respect to private/public property boundaries
• Design water levels (including effects of SLR)
• Design scour level at the structure
• Design breaking wave heights at the structure and wave runup and overtopping
• Acceptable % damage in design storms
• Maintenance regime and responsibility
• Rock quarry sources
• Construction access to the beach
• Stormwater drainage provisions
Privacy of adjoining landowners
9.1.1 Design Life
The desirable design life of the seawall is 50 years (Section 7.9). Although Old Bar Beach is
characterised by an aggressively receding shoreline, a design philosophy has been applied which
permits this life to be achieved (refer Sections 9.1.6 to 9.1.11).
9.1.2 Foreshore Protection Principles and Staging (Triggers)
The most threatened zone within the works area is located along the Lewis Street foreshore. There
are also problems at the entrance to Racecourse Creek, evidenced particularly by the rapid retreat of
the dune spit on the eastern side of the entrance. With the very high recession rates experienced
over the past decade or so, there is also now a concern over the medium term for the protection of
the Old Bar Public School in David Street, and the MidCoast Water exfiltration pits further to the
south. The progression of the coastal hazard diminishes at the northern extent of the works area
where relative stability is provided in the lee of the Urana Bombora.
Importantly, a seawall is the only protection strategy at Old Bar supported by the draft Coastal Zone
Management Plan with the requisite technical confidence to actually provide protection
(WorleyParsons, 2013).
It is recognised that the cost of any seawall to protect the full works area would be substantial.
Staging would therefore be a necessary inclusion, with events or conditions specified to trigger
implementation of subsequent stages. Even with staging, funding of a seawall is beyond the
resources of Council even when assisted through the NSW Coastal Management Program.
8A0271gpb‐Old Bar Design Investigation‐FINAL ‐ 47 ‐
Based on the information at hand, it is proposed that the seawall be constructed in three stages as
designated in Drawing MA‐0001 (Appendix F) and summarised below.
Stage 1 Lewis Street properties 450 m
Stage 2 Pacific Parade 425 m
Stage 3N Old Bar Public School to Surf Club 525 m
Stage 3S MidCoast Water assets 1,600 m
If erosion continues to be an issue in the zone between Stages 2 and 3N, possibly exacerbated by
entrance hazard at the entrance to Racecouse Creek, it could be necessary to extend the southern
end of the Stage 3N wall to achieve an overlap with the northern end of the Sage 2 wall. Having
regard to normal wave diffraction patterns and an expected maximum incident wave angle at the
back of the beach (say 15 degrees from shore‐normal), a provisional design overlap distance of
approximately 50 m would be envisaged. This optional treatment to the end of the Stage 3 N wall is
shown in the Drawings in Appendix F.
Each stage would be timed such that protection is provided to the existing houses and major public
assets located within that stage when they are assessed to be at significant threat from erosion as
measured by the Zone of Slope Adjustment (after the model reported in Nielsen et al 1992) in the
1% Annual Exceedance Probability (AEP) design storm. When a single house or major public asset is
assessed by Council to be so threatened, that shall constitute the trigger for Council (assuming
external funding is available for construction) to develop the detailed design and to call tenders for
that stage of the seawall works, on the understanding that the seawall in that stage would be fully
constructed within a period of four years. Four years is considered to represent a prudent but
suitably expeditious timeframe to attend to the environmental approvals, and to put in place the
necessary funding arrangements and implement a project stage through to completion.
Based on HKA’s updated assessment of average long term beach recession rates of 0.8 m/year for
Old Bar, and assuming a SLR of 0.4 m to 2050 and 0.9 m to 2100 (both relative to 1990 levels),
present estimates of the trigger dates for commencement of the detailed designs at the various
stages are as follows:
Stage 1 2013
Stage 2 2013
Stage 3N 2021
Stage 3S 2037
Note that the trigger dates would be continuously revised on the basis of the actual recession rates.
Refer Section 10 for further comments on works implementation, monitoring and review.
There should be an opportunity to utilise the existing gabion wall to assist in mitigating flanking
effects developed at the northern end of a Stage 1 wall constructed to protect the Lewis Street
foreshore.
In general terms, there may be scope to rationalise a delay in the implementation of Stage 2 on the
basis that risk is lower than for the private properties in Stage 1 since no building structures are
immediately threatened in Stage 2, and the probability of persons being affected by a slope
adjustment failure in Stage 2 may also be lower. This would need to be reviewed through an actual
risk assessment which quantified probability of impacts, consequences, other means of risk
reduction (e.g. evacuation), and so on. There would also appear to be an opportunity to stage the

8A0271gpb‐Old Bar Design Investigation‐FINAL ‐ 48 ‐
works in Stage 2, with the southern portion of that stage likely to require treatment before the
northern portion, the latter remaining at least partially protected by the residual sand dune on the
seaward side of the entrance to Racecourse Creek (see also comment on wall type for the northern
end of Stage 2, Section 9.4.2).
Further comments on seawall construction staging are provided in Section 10.
9.1.3 Public Access and Safety Principles
The provision of public pedestrian access along the beach fronting the seawall, over the life of the
seawall, would not be feasible. However, a walkway would be provided along the structure itself, set
at a level such that privacy to the adjoining foreshore properties was not unduly compromised. In
those situations where the adjoining backyards are reasonably level up to and including the seaward
wall of the dwelling, it is proposed that the walkway be set at a level which is nominally 2 m below
the backyard level. In those other situations where the backyards slope downwards to the back‐
beach and ocean, this may be more difficult to achieve. However, the design of the upper seawall
and walkway would be mindful of views from the walkway back into the private properties, including
for example native trees and shrubs of suitable mature growth profile to screen landward views from
the walkway but to minimise impacts on seaward views from the properties.
It is also proposed that private access steps and a lockable gate be included linking each affected
property with the walkway. The steps would be treated pine supported on pole construction, and
the gate either treated pine or aluminium. It would seem reasonable that the steps and gate be
provided as part of the seawall construction project, however the safe operation, ongoing
maintenance and replacement as required of the steps and gate due to weathering and wear‐and‐
tear over the life of the seawall could be the responsibility of the landowner.
The walkway would be exposed to wave runup and overtopping in severe storms occurring today,
with the frequency of such events increasing over the life of the seawall (Section 9.1.9)
9.1.4 Ground Conditions
The beach at Old Bar generally comprises medium to fine sand interspersed with layers of gravel.
The seabed in the nearshore zone is mapped into areas of inner nearshore sediment extending out
to RL‐5 to ‐10, and beyond that outer nearshore sediment out to RL ‐15 to ‐20. These sediment
zones at the bed are interspersed with rock reef. For the works area, the reef at the seabed
encroaches to approximately 400 m of the Surf Club, diverting offshore to over 1 km from the
shoreline opposite Lewis Street and Pacific Parade (Sinclair Knight & Partners, 1981).
Information on subsurface conditions beneath the beach and foreshore within the works area is
limited to six boreholes drilled by PWD in September 1981, and a further three boreholes for the Old
Bar Sewerage reticulation design, also by PWD in 1981. Two cores were taken from the beach
opposite Rose Street in 1992 for the gabion entrance stabilisation works (shown in AWACS, 1991),
and while a summary of these is reported by AWACS the logs themselves could not be found. The
locations of all boreholes are shown in Appendix D.
This main beach drilling exercise in 1981 found layers of gravel and sand beds (1 to 4 m thick)
overlaying clay of variable hardness (1.4 to over 3 m thick), in turn overlaying resistant material,
interpreted as most probably siltstone. In the vicinity Lewis Street and the southern end of Pacific

8A0271gpb‐Old Bar Design Investigation‐FINAL ‐ 49 ‐
Parade the bedrock horizon is at or below RL ‐6, generally rising to approximately RL‐3 opposite the
northern end of Pacific Parade and RL ‐1.7 opposite the Surf Club.
Based on interpreted ground levels, the boreholes drilled for Old Bar Sewerage indicate sand down
to approximately RL 4 along Pacific Parade, becoming indurated or clay at approximately RL1.5.
Close to the Public School near the corner of Smith Street and Ungala Road, the soils down to RL 4
are described as gritty, with shale at RL 3 overlaying clay at RL 2.5.
For the purposes of seawall preliminary design in the works area and based on the available
geotechnical data there is insufficient information to rely on material resistant to wave or current
erosion residing in the typical scour zone down to say RL ‐2.
9.1.5 Construction Footprint with respect to Private/Public Property Boundaries
It is OEH’s preference for the seawall to be constructed as far landward as possible to minimise the
impact of the structure on the beach over the planning timeframe, and to maximise the life of the
works. For Council the priority is shared between minimising beach impacts, preserving shoreline
access and limiting the encroachment of the structure into foreshore private properties. A balance is
required to address these considerations.
Council has requested that preliminary designs be developed for two cross‐shore positions for the
seawall:
1. The wall located such that following construction the top of the wall sits in alignment with the
current dune escarpment location, thereby having no further encroachment into the properties
(along Lewis Street for Stage 1).
2. The wall located as far as possible landward towards the existing structures, but still allowing at
least a minimum clearance to provide maintenance access along the top. This second option
addresses OEH’s preference.
Two basic criteria must be satisfied with both options. Firstly, a 6 m minimum maintenance corridor
must be available between the back of the seawall and the most seaward structural wall of the
houses to provide future access to suitably sized construction plant if ever required. Secondly, a
Factor of Safety (FOS) of 1.3 would be accepted as a reasonable temporary minimum at the
foundations of the houses during seawall construction. The latter could be achieved by a
combination of suitable temporary batter slopes and the implementation, if required, of temporary
shoring close to the foundations of the houses.
The conceptual layout to achieve the Option 1 and 2 profiles, applicable to Stage 1, is shown in
Figure 14.

8A0271gpb‐Old Bar Design Investigation‐FINAL ‐ 50 ‐
Figure 14 – Conceptual layout to achieve Option 1 and 2 profiles, Stage 1. Sections at Ch. 600C shown, refer Section 1.6 and Appendix F.
All the foreshore property boundaries along Lewis Street extend onto the dune, and some further
seaward onto the beach. At the southern end of Lewis Street where the erosion impacts have been
most severe, the private properties extend up to approximately 30 m seaward of the existing beach
escarpment crest.
9.1.6 Design Water Levels (including effects of SLR)
The components which give rise to elevated still water levels during storms (excluding wave setup)
comprise astronomical tide, wind setup and barometric setup (the combined effect is termed storm
surge). Design water levels are recommended in the Coastal Risk Management Guide (DECCW,
2010a), based on over 100 years of data obtained from the Fort Denison tide gauge in Sydney
Harbour. While these levels are primarily applicable in the Newcastle – Sydney – Wollongong area,
they are also considered to be appropriate for the NSW Mid‐North Coast. The 100 year ARI design
water level of RL 1.44 has therefore been adopted for Old Bar Beach.
The latest (Fifth Assessment) Intergovernmental Panel on Climate Change (IPCC) predictions of
future SLR are between about 0.26 to 0.98 m at about 2100 (relative to 1990), depending on the

8A0271gpb‐Old Bar Design Investigation‐FINAL ‐ 51 ‐
emissions scenario adopted (IPCC, 2013). The NSW Sea Level Rise Policy Statement (DECCW, 2009)
included SLR planning benchmarks of 0.4 m at 2050 and 0.9 m at 2100 (both relative to 1990), with
the two benchmarks allowing for consideration of SLR over different timeframes. While the
benchmarks were subsequently withdrawn by the NSW Government, these projections are widely
accepted by competent scientific opinion and local governments in NSW and have therefore been
adopted for the present study as per WorleyParsons (2010a).
Accordingly, SLR estimates for the end of the 50‐year design life (2063) and mid‐way through the
design life (2038) are 0.53 m and 0.28 m respectively (relative to 1990). Corresponding extreme
water levels (excluding wave setup) were calculated as the sum of the 100 year ARI design water
level and estimated SLR discounting the estimated amount of global average SLR that has occurred
between 1990 and present3.
Extreme water levels (excluding wave setup) adopted for the present study are therefore
RL 1.65 (2038) and RL 1.90 (2063).
9.1.7 Design Scour Level at the Structure
In NSW, a foundation level of approximately RL ‐1 is commonly adopted for flexible coastal
structures located at the back of the active beach area. This is based on stratigraphic evidence of
historic scour levels, and observed scour levels during major storms in front of existing permeable
and non‐permeable seawalls along the NSW coast (Nielsen et al, 1992; Foster et al, 1975).
Design scour levels at the structure were investigated by WRL (Appendix E). Scour levels were
determined from SBEACH modelling undertaken for the present day, 2030 and 2050 planning
periods for ongoing underlying recession rates of 0.8 m/year (long‐term average trend) and
2.5 m/year (extreme case). Scour levels for the 0.8 m/year recession scenario are considered to be
appropriate for design purposes, and are summarised in Table 1. Note that the 2038 and 2063
estimates were determined by interpolation and extrapolation of the 2030 and 2050 scour levels
given by WRL.
Table 1: Estimated Scour Levels at Structure
Planning Scenario Scour Level (RL)
Present Day (2013) ‐1.6
Mid‐Life (2038) ‐1.9
Design Life (2063) ‐2.9
It is evident that the estimated scour levels would vary relatively significantly over the 50‐year
design life of the structure. As such, while a design toe level of RL ‐1 has been adopted for the
structure, the toe has been designed to self‐launch due to settlement associated with the possible
future scour levels outlined in Table 1, allowing for appropriate maintenance. This is discussed
further in Section 9.4.1.
3 It is estimated that global sea level is currently rising at approximately 3 mm/year (DECCW, 2009; 2010a). Sea level rise between 1990 and 2013 is therefore estimated at 0.069 m.
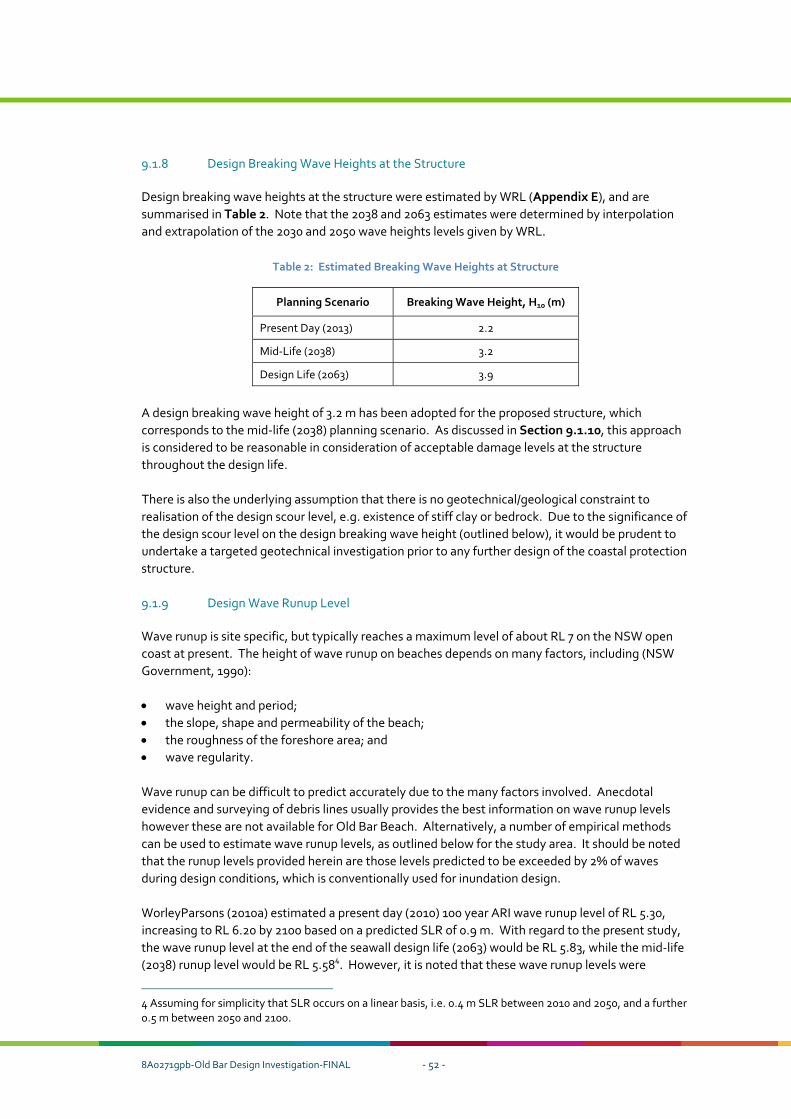
8A0271gpb‐Old Bar Design Investigation‐FINAL ‐ 52 ‐
9.1.8 Design Breaking Wave Heights at the Structure
Design breaking wave heights at the structure were estimated by WRL (Appendix E), and are
summarised in Table 2. Note that the 2038 and 2063 estimates were determined by interpolation
and extrapolation of the 2030 and 2050 wave heights levels given by WRL.
Table 2: Estimated Breaking Wave Heights at Structure
Planning Scenario Breaking Wave Height, H10 (m)
Present Day (2013) 2.2
Mid‐Life (2038) 3.2
Design Life (2063) 3.9
A design breaking wave height of 3.2 m has been adopted for the proposed structure, which
corresponds to the mid‐life (2038) planning scenario. As discussed in Section 9.1.10, this approach
is considered to be reasonable in consideration of acceptable damage levels at the structure
throughout the design life.
There is also the underlying assumption that there is no geotechnical/geological constraint to
realisation of the design scour level, e.g. existence of stiff clay or bedrock. Due to the significance of
the design scour level on the design breaking wave height (outlined below), it would be prudent to
undertake a targeted geotechnical investigation prior to any further design of the coastal protection
structure.
9.1.9 Design Wave Runup Level
Wave runup is site specific, but typically reaches a maximum level of about RL 7 on the NSW open
coast at present. The height of wave runup on beaches depends on many factors, including (NSW
Government, 1990):
wave height and period;
the slope, shape and permeability of the beach;
the roughness of the foreshore area; and
wave regularity.
Wave runup can be difficult to predict accurately due to the many factors involved. Anecdotal
evidence and surveying of debris lines usually provides the best information on wave runup levels
however these are not available for Old Bar Beach. Alternatively, a number of empirical methods
can be used to estimate wave runup levels, as outlined below for the study area. It should be noted
that the runup levels provided herein are those levels predicted to be exceeded by 2% of waves
during design conditions, which is conventionally used for inundation design.
WorleyParsons (2010a) estimated a present day (2010) 100 year ARI wave runup level of RL 5.30,
increasing to RL 6.20 by 2100 based on a predicted SLR of 0.9 m. With regard to the present study,
the wave runup level at the end of the seawall design life (2063) would be RL 5.83, while the mid‐life
(2038) runup level would be RL 5.584. However, it is noted that these wave runup levels were
4 Assuming for simplicity that SLR occurs on a linear basis, i.e. 0.4 m SLR between 2010 and 2050, and a further 0.5 m between 2050 and 2100.

8A0271gpb‐Old Bar Design Investigation‐FINAL ‐ 53 ‐
determined using the method described by Hanslow and Nielsen (1995), which is based on field
measurements on natural beaches. It would generally be expected that slightly higher wave runup
levels would be realised on armoured revetments.
The Shore Protection Manual (USACE, 1984), SPM 1984, provides several methods for estimating
wave runup levels for coastal structures. The appropriate method usually depends on the adopted
design water level and breaking wave height at the structure, which were determined by WRL for
Old Bar Beach (Appendix E). Runup levels were initially determined for a smooth, impermeable
slope (Figure 7‐11 in SPM 1984) and then corrected for roughness and scale effects. The present
day, 2038 and 2063 wave runup levels determined from SPM 1984 were RL 4.74, RL 6.05 and RL 7.31
respectively.
The Eurotop Overtopping Manual (Eurotop, 2007) provides guidance on the prediction of wave
overtopping for coastal structures, including wave runup on rock slopes. The method recommended
for design and safety assessment of crest height (Equation 6.2 in Eurotop (2007)) was adopted for
the present study. Key inputs for this method include the design water level and breaking wave
height at the structure, which were determined by WRL for Old Bar Beach (Appendix E), while
correction factors were applied for roughness and the effect of the lower (toe) berm which reduce
runup levels. The present day, 2038 and 2063 wave runup levels determined from Eurotop (2007)
were RL 5.10, RL 6.14 and RL 6.89 respectively.
Calculated wave runup levels for Old Bar Beach are summarised in Table 3. It is considered
reasonable for the purposes of revetment preliminary design to adopt RL 6.2 as the design wave
runup level. This level would cater for the mid‐life (2038) scenario, while subsequent increases in
predicted wave runup levels could be addressed through future raisings of the revetment crest
height if required.
Table 3: Calculated Wave Runup Levels (RL m)
Method / Source Present Day (2013) Mid‐Life (2038) Design Life (2063)
WorleyParsons (2010a) 5.30 5.58 5.83
SPM 1984 4.74 6.05 7.31
Eurotop (2007) 5.10 6.14 6.89
9.1.10 Acceptable Damage in Design Storm
It is normal practice to design coastal structures for 0‐5% damage in the design storm. This level of
damage is implicit in the acceptance of design damage coefficients presented in Coastal
Engineering Manual, CEM (USACE, 2002). For armoured seawalls and revetments, CEM refers to a
range of procedures for structural design.
CEM refers to the Shore Protection Manual (SPM) 1977 and 1984 methods associating stone shape,
placement type, structure slope, breaking or non‐breaking waves and damage coefficient (Kd) with
levels of damage (D). For the preliminary seawall design a breaking wave on the structure of 3.2 m
has been selected, equivalent to H10 applicable to the mid‐point of the planning period (2038) (refer
Section 9.1.8), and applied a Kd of 2.85 equal to the average of the SPM 1977 (2.2) and 1984 (3.5)
values. While not strictly correct in relation to the application of Hs and H10 with the two SPM

8A0271gpb‐Old Bar Design Investigation‐FINAL ‐ 54 ‐
methods, the combined selection of wave height and damage coefficient is considered reasonable
and suitably conservative for preliminary design purposes.
SPM 1984 provides a methodology for assessing armour damage for events where the wave height
exceeds the design wave height. SPM 1984 also reports that damage levels greater than 30% signify
complete failure of a random‐placed armour revetment structure. Based on the assessment of wave
height and scour at the site undertaken by WRL, addressed in Sections 9.1.7 and 9.1.8 respectively,
it can be shown that the design wave height selected for the seawall at Old Bar would not be
expected to result in the complete failure of the structure for a design storm occurring at the end of
the planning period in 2063.
9.1.11 Maintenance Regime and Responsibility
As noted in Section 7.9, coastal structures deteriorate over time and early maintenance is generally
recommended to prevent more significant damage. Typical average maintenance costs for seawalls
and revetments in NSW are approximately 1% of the capital replacement value per year
(Gordon, 1989).
Given that the adopted design wave height exceeds the actual design wave height over the first half
of the 50 year life of the wall, the maintenance spend over this first 25 years should be less than the
typical average maintenance spend. Over the second half of the wall’s life, the maintenance spend
could then be expected to tend to the average except for the fact that Old Bar is exposed to higher
than average recession rates. For preliminary costing purposes 0.5% per year has been adopted
between 2013 and 2038, and 2% per year between 2038 and 2063. The maintenance may not take
place on an annual basis but at period intervals some years apart.
Addressing flanking erosion is a maintenance action (Section 7.6). Based on the guidance provided
in DECCW (2010b) and Figure 13, the estimated periodic placements to manage end effects would
be in the order of 500‐1,000 m3 /year per wall end on average, following exposure of the wall end as a
consequence of long term recession5.
The sand required for periodic placements to manage end effects could be “backpassed” from the
relatively wide beach located in the lee of the Urana Bombora to the north of the Surf Club and in
the general vicinity of the beach access on the northern side of the caravan park. This material could
either be scraped and relocated using conventional scraping plant, or excavated and transported by
trucks.
It is appropriate for the maintenance responsibility to rest with the owner of the asset.
5 Assuming that Stages 1 and 2 were constructed together and the pre‐storm receded shoreline had reached the wall end, the flanking erosion as a consequence of the seawall, gauged over the full length of the “end effect” (Section 7.6) is predicted to exceed the erosion assuming no wall in place by some 35%. It is not feasible nor is it necessary to be restoring (by way of a sand placement) the fully eroded flank post‐storm. This would be expected to recover by natural accretion over the ensuing weeks to months to the same extent as the adjoining walled shoreline. However, it may be necessary to alleviate the flanking erosion immediately adjacent to the wall end which may be impacting on nearby assets. The estimated 500‐1,000 m
3/year per wall end on average
assumes that a 25 m length of shoreline immediately adjacent to the wall would be treated with a 3 to 6 m wide placement at the restored dune crest. In time, as the neighbouring unprotected shoreline recedes, the flanking influence is likely to diminish as the wall performs increasingly as a headland and the adjacent shoreline assumes a cuspate (curved) regime planform.

8A0271gpb‐Old Bar Design Investigation‐FINAL ‐ 55 ‐
9.1.12 Rock Quarry Sources
HKA has made enquiries of quarries on the Mid North Coast regarding availability of suitable
igneous rock to construct a seawall at Old Bar. Discussions have taken place with Boral (Toorima),
Pacific Blue Metal (Possum Brush), Hunter Quarries (Karuah), and Holcim (Possum Brush).
Boral showed most interest, providing petrographic and material reports to give an indication of
their product. Boral confirmed that its quarry at Bulley’s Road, Johns River would be able to supply
suitable armour rock, adjusting their blasting procedure to target the size of material required.
Loading and delivery would require large rock grab excavators and low loader semi –trailers which
should be able to carry 4 to 5 armour rocks per load. Boral have advised an indicative ex‐pit supply
rate of $50/tonne, plus $190/hour for the low loader, both inclusive of GST (Adrian Becker, 30/10/13
pers. comm.).
Pacific Blue Metal (Possum Brush) can supply large rock in the 3 to 10 t range, but they advise that it
would be difficult to obtain and expensive to supply rock that has restrictive grading and material
acceptance requirements (Charlie Kennett, 28/10/13 pers. comm.).
Hunter Quarries (Karuah) are not that interested. Their indicative price if product is available is
$60/tonne delivered plus GST (contacted 23/10/13).
Holcim (Possum Brush) are not really interested because of the specified rock size and their rock
quota. They requested that they be advised if the project was to proceed and they would then
recheck their quota and supply (Scott, 11/10/13 pers. comm.).
An issue for the quarries generally was that they had standing supply arrangements with long term
customers (e.g. RMS) and this would be jeopardised by any one‐off large contract which, while
profitable for that project, would divert resources and consume their available quota and supply.
Based on feedback from the quarries and assessment of transport distances, HKA estimates that
suitable rock for Stage 1 could be supplied to Old Bar for say $75/tonne including GST.
9.1.13 Construction Access to the Beach
Authorised vehicle access to Old Bar Beach is limited to a track on the north side of the caravan park
1,100 m along the beach from the Surf Club. This is considered to be too far from the Stage 1,
Stage 2 and Stage 3S areas to provide a suitable route for construction plant and materials access.
For Stage 1 a temporary access track would be constructed by cut and fill at Rose Street and/or from
the Crown Land at the southern end of Lewis Street. Any additional fill needed to build the track(s)
would comprise sand sourced from the beach. The access track at Rose Street could then be
reimplemented for Stage 2 with the seaward side of Pacific Parade cordoned off to assist with the
construction access. Temporary access tracks across the foreshore in the vicinity of the works are
also likely for Stage 3.
All temporary access routes would be restored and replanted with dunal vegetation at the end of
each project stage.
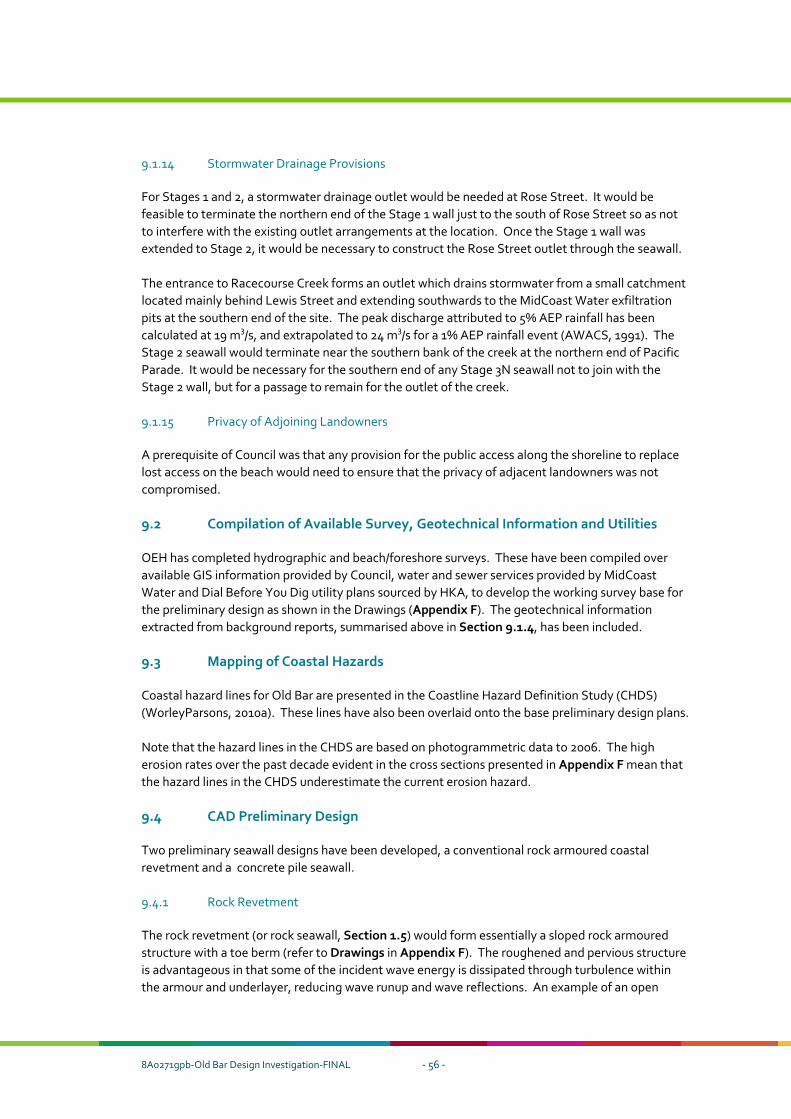
8A0271gpb‐Old Bar Design Investigation‐FINAL ‐ 56 ‐
9.1.14 Stormwater Drainage Provisions
For Stages 1 and 2, a stormwater drainage outlet would be needed at Rose Street. It would be
feasible to terminate the northern end of the Stage 1 wall just to the south of Rose Street so as not
to interfere with the existing outlet arrangements at the location. Once the Stage 1 wall was
extended to Stage 2, it would be necessary to construct the Rose Street outlet through the seawall.
The entrance to Racecourse Creek forms an outlet which drains stormwater from a small catchment
located mainly behind Lewis Street and extending southwards to the MidCoast Water exfiltration
pits at the southern end of the site. The peak discharge attributed to 5% AEP rainfall has been
calculated at 19 m3/s, and extrapolated to 24 m3/s for a 1% AEP rainfall event (AWACS, 1991). The
Stage 2 seawall would terminate near the southern bank of the creek at the northern end of Pacific
Parade. It would be necessary for the southern end of any Stage 3N seawall not to join with the
Stage 2 wall, but for a passage to remain for the outlet of the creek.
9.1.15 Privacy of Adjoining Landowners
A prerequisite of Council was that any provision for the public access along the shoreline to replace
lost access on the beach would need to ensure that the privacy of adjacent landowners was not
compromised.
9.2 Compilation of Available Survey, Geotechnical Information and Utilities
OEH has completed hydrographic and beach/foreshore surveys. These have been compiled over
available GIS information provided by Council, water and sewer services provided by MidCoast
Water and Dial Before You Dig utility plans sourced by HKA, to develop the working survey base for
the preliminary design as shown in the Drawings (Appendix F). The geotechnical information
extracted from background reports, summarised above in Section 9.1.4, has been included.
9.3 Mapping of Coastal Hazards
Coastal hazard lines for Old Bar are presented in the Coastline Hazard Definition Study (CHDS)
(WorleyParsons, 2010a). These lines have also been overlaid onto the base preliminary design plans.
Note that the hazard lines in the CHDS are based on photogrammetric data to 2006. The high
erosion rates over the past decade evident in the cross sections presented in Appendix F mean that
the hazard lines in the CHDS underestimate the current erosion hazard.
9.4 CAD Preliminary Design
Two preliminary seawall designs have been developed, a conventional rock armoured coastal
revetment and a concrete pile seawall.
9.4.1 Rock Revetment
The rock revetment (or rock seawall, Section 1.5) would form essentially a sloped rock armoured
structure with a toe berm (refer to Drawings in Appendix F). The roughened and pervious structure
is advantageous in that some of the incident wave energy is dissipated through turbulence within
the armour and underlayer, reducing wave runup and wave reflections. An example of an open

8A0271gpb‐Old Bar Design Investigation‐FINAL ‐ 57 ‐
coast rock armoured revetment constructed in NSW is located at Stockton in Newcastle. The typical
cross‐section design profile for the Stockton structure is provided in Figure 15.
Figure 15 – Design profile for Stockton Seawall. Design breaking wave height for this structure was approximately 2.6 – 2.9 m. The specified rock armour mass is not shown but is back‐calculated at
approximately 4 tonne (assumed density 2.5 T/m3)
The works are designed to be implemented in four stages (Section 9.1.2) with two options for cross‐
shore position presented for Stage 1(Section 9.1.5).
WorleyParsons (2010b) presented a sloped rock revetment concept for Old Bar Beach. This is
understood to be an overtopped design with the wall crest level set at RL 5, 1 m below the nominal
design 2% runup level of RL 6 established by WorleyParsons for back‐beach or dune runup. The
larger sized rock buried behind the crest accounts for the overtopping loads on the back of the wall.
Although the design breaking wave height would not appear to be specified in the Coastline Zone
Management Study, the WorleyParsons concept is shown to include 2.8 tonne median rock armour
(Figure 16 and Figure 17).
The Stage 1 and Stage 2 wall alignment proposed in this investigation essentially follow the
WorleyParsons revetment alignment, and the wall section is designed as a non‐overtopped
structure. The armour crest level is set at RL 6.2 which is the calculated design 2% wave runup for a
100 year ARI event occurring at the mid‐point of the 50 year planning period (Section 9.1.9).
The proposed rock wall toe level is set at RL ‐1.0, the same as that adopted by WorleyParsons but
notably 1 m above the Stockton wall toe level. Based on a long term average recession rate of
0.8 m/year plus an allowance for SLR recession, the design scour level at the structure today is
calculated by WRL at RL ‐0.8, reducing to RL ‐1.7 at 2030 and RL ‐2.5 at 2050 (refer Appendix E). For
the extreme estimate for long‐term recession of 2.5 m/year, the design scour is calculated by WRL
to reduce to RL ‐2.8 and RL ‐4.1 at 2030 and 2050 respectively. It is proposed that the 5 m wide toe
berm (as measured at RL ‐1.0) is reasonable to accommodate future storm scour through self‐

8A0271gpb‐Old Bar Design Investigation‐FINAL ‐ 58 ‐
launching of the toe rocks over the life of the structure, allowing for suitable maintenance. The
selection of toe level is always a risk based cost decision, weighing up construction feasibility, cost
and maintenance implications. It is HKA’s view that attempting to construct a seawall toe as low as
RL ‐2.0 at Old Bar would be most difficult and costly given the narrow beach berm and the likely
close proximity of wave runup to the construction footprint.
As noted previously, a geotechnical investigation should be carried out to assess, among other
things, whether the calculated scour levels referred to above are likely to be achieved in practice, as
part of any further design development.
Figure 16 – Concept revetment alignment in Coastline Zone Management Study
(WorleyParsons, 2010b)
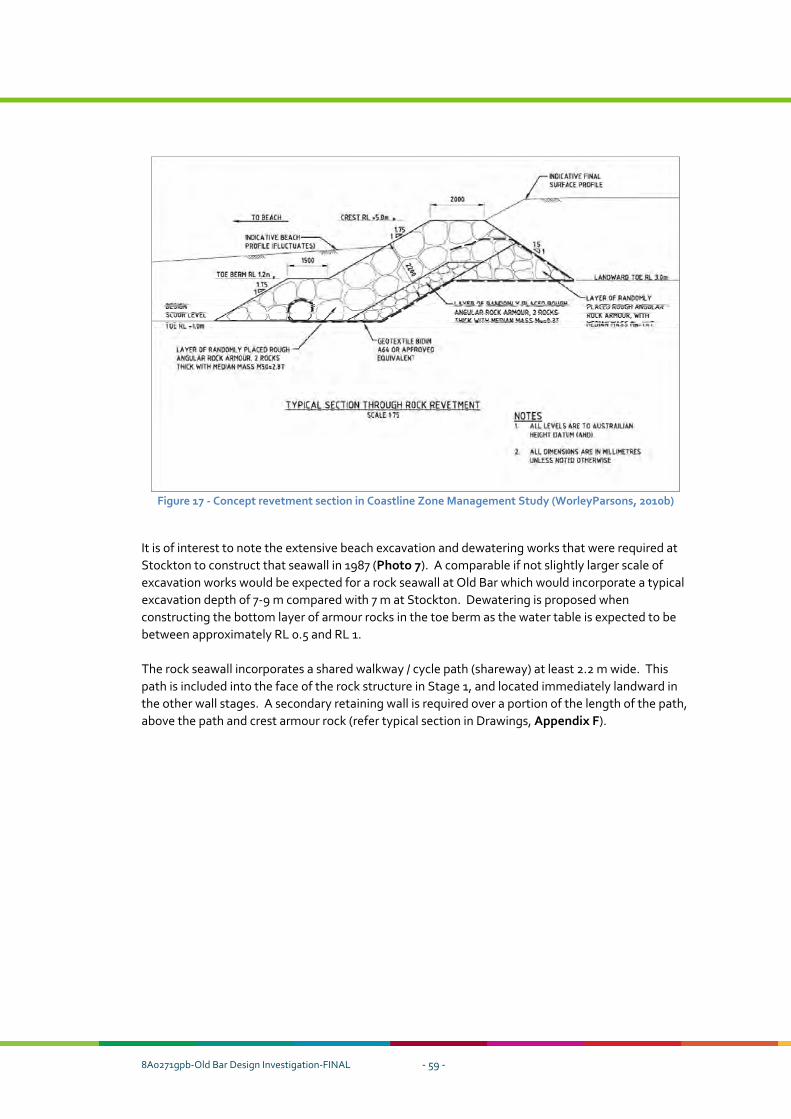
8A0271gpb‐Old Bar Design Investigation‐FINAL ‐ 59 ‐
Figure 17 ‐ Concept revetment section in Coastline Zone Management Study (WorleyParsons, 2010b)
It is of interest to note the extensive beach excavation and dewatering works that were required at
Stockton to construct that seawall in 1987 (Photo 7). A comparable if not slightly larger scale of
excavation works would be expected for a rock seawall at Old Bar which would incorporate a typical
excavation depth of 7‐9 m compared with 7 m at Stockton. Dewatering is proposed when
constructing the bottom layer of armour rocks in the toe berm as the water table is expected to be
between approximately RL 0.5 and RL 1.
The rock seawall incorporates a shared walkway / cycle path (shareway) at least 2.2 m wide. This
path is included into the face of the rock structure in Stage 1, and located immediately landward in
the other wall stages. A secondary retaining wall is required over a portion of the length of the path,
above the path and crest armour rock (refer typical section in Drawings, Appendix F).
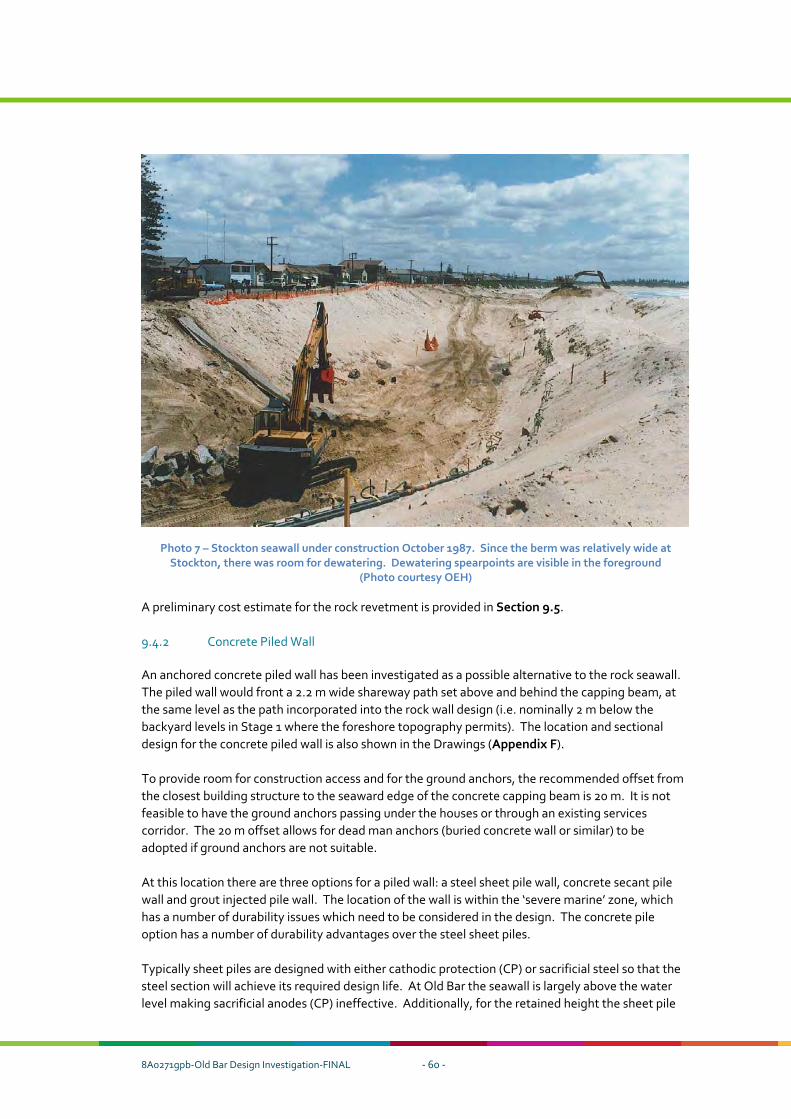
8A0271gpb‐Old Bar Design Investigation‐FINAL ‐ 60 ‐
Photo 7 – Stockton seawall under construction October 1987. Since the berm was relatively wide at Stockton, there was room for dewatering. Dewatering spearpoints are visible in the foreground
(Photo courtesy OEH)
A preliminary cost estimate for the rock revetment is provided in Section 9.5.
9.4.2 Concrete Piled Wall
An anchored concrete piled wall has been investigated as a possible alternative to the rock seawall.
The piled wall would front a 2.2 m wide shareway path set above and behind the capping beam, at
the same level as the path incorporated into the rock wall design (i.e. nominally 2 m below the
backyard levels in Stage 1 where the foreshore topography permits). The location and sectional
design for the concrete piled wall is also shown in the Drawings (Appendix F).
To provide room for construction access and for the ground anchors, the recommended offset from
the closest building structure to the seaward edge of the concrete capping beam is 20 m. It is not
feasible to have the ground anchors passing under the houses or through an existing services
corridor. The 20 m offset allows for dead man anchors (buried concrete wall or similar) to be
adopted if ground anchors are not suitable.
At this location there are three options for a piled wall: a steel sheet pile wall, concrete secant pile
wall and grout injected pile wall. The location of the wall is within the ‘severe marine’ zone, which
has a number of durability issues which need to be considered in the design. The concrete pile
option has a number of durability advantages over the steel sheet piles.
Typically sheet piles are designed with either cathodic protection (CP) or sacrificial steel so that the
steel section will achieve its required design life. At Old Bar the seawall is largely above the water
level making sacrificial anodes (CP) ineffective. Additionally, for the retained height the sheet pile
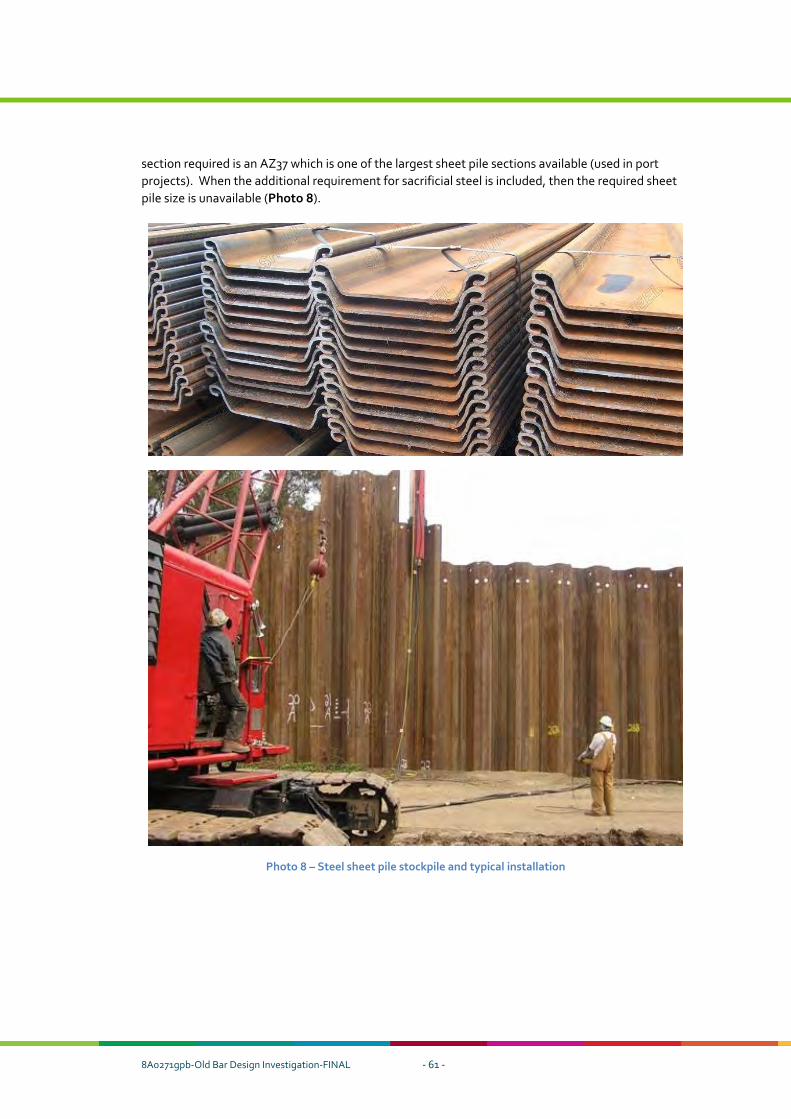
8A0271gpb‐Old Bar Design Investigation‐FINAL ‐ 61 ‐
section required is an AZ37 which is one of the largest sheet pile sections available (used in port
projects). When the additional requirement for sacrificial steel is included, then the required sheet
pile size is unavailable (Photo 8).
Photo 8 – Steel sheet pile stockpile and typical installation
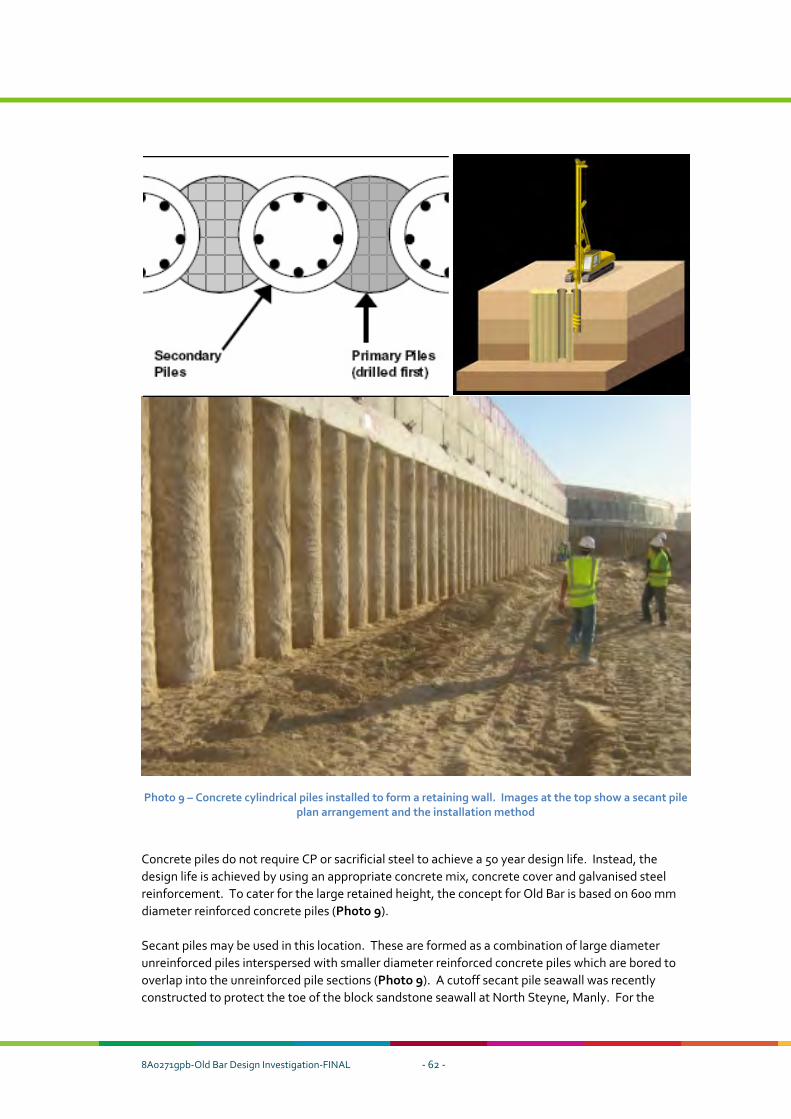
8A0271gpb‐Old Bar Design Investigation‐FINAL ‐ 62 ‐
Photo 9 – Concrete cylindrical piles installed to form a retaining wall. Images at the top show a secant pile plan arrangement and the installation method
Concrete piles do not require CP or sacrificial steel to achieve a 50 year design life. Instead, the
design life is achieved by using an appropriate concrete mix, concrete cover and galvanised steel
reinforcement. To cater for the large retained height, the concept for Old Bar is based on 600 mm
diameter reinforced concrete piles (Photo 9).
Secant piles may be used in this location. These are formed as a combination of large diameter
unreinforced piles interspersed with smaller diameter reinforced concrete piles which are bored to
overlap into the unreinforced pile sections (Photo 9). A cutoff secant pile seawall was recently
constructed to protect the toe of the block sandstone seawall at North Steyne, Manly. For the

8A0271gpb‐Old Bar Design Investigation‐FINAL ‐ 63 ‐
purposes of the current exercise, a design has been developed and priced based on an insitu
concrete pile wall with properties as follows:
Maximum retained
height
RL+8 Soil density – wet 16 kN/m3
Top of wall RL+6 Soil density – saturated 18 kN/m3
Scour level (potential) RL‐2 Concrete pile diameter 600 mm
Anchor level RL+5.2 Pile reinforcement 6 – N24
Anchor length 7 m to 15 m subject to
ground level and
geotechnical conditions
Wall design life 50 years
If this option is of interest to Council, the design could be refined at the detailed design stage
following completion of a geotechnical investigation.
The piles would be connected by a concrete capping beam which acts as a whaling to hold the piles
together. The capping beam would be approximately 1000 wide x 800 deep, catering for the
positional tolerance of the piles. The capping beam is also used to transfer load from the piles into
the ground anchors, which are expected to be spaced at approximately 3 m centres. The final size,
type and spacing of anchors would be based on the ground conditions which would be determined
by a dedicated ground investigation.
The piled wall has the advantages of being located relatively landward, thereby becoming exposed
in the profile later than the rock seawall for the same functional cross‐shore criteria. It is also
proposed that the capping beam be buried 2 m below the ground level, and the construction of the
shareway be delayed until the wall is exposed and longshore beach access is unacceptably impacted.
A secondary retaining wall would be provided above the capping beam (refer typical section in the
Drawings, Appendix F).
A preliminary cost estimate for the concrete piled wall is provided in Section 9.5.
A piled wall, although more expensive than a rock wall (Section 9.5), has the one advantage of
occupying a narrower footprint. This would achieve a small delayed interaction with the receding
beach for the same cross‐shore wall crest location. However, the piled structure requires a toe level
which must fully accommodate future design scour levels. If scour exceeds predictions and the pile
toe is undermined, settlement and instability would then result on the landward side. There is no
flexibility in the design behaviour of a pile toe as there is with a rock toe which can be designed to
self‐launch to protect against lower scour levels.
Vertical pile walls are also highly reflective leading to increased scour in front of the wall and delayed
recovery of the beach.
It is unlikely that a piled wall would be favoured at Old Bar except perhaps towards the northern end
of Stage 2 where the seawall corridor is constrained and where protection may need to be extended
along Pacific Parade into the lee of the dune promontory between Racecourse Creek and the beach
waterline, which may not have fully retreated. The nature of the wall construction in this location
would depend on the timing of the Stage 2 project and its finally selected northern end point
determined as part of the detailed design.
8A0271gpb‐Old Bar Design Investigation‐FINAL ‐ 64 ‐
9.5 Preliminary Project Cost Estimates
A preliminary project cost estimate has been prepared inclusive of a suitable contingency on the
construction component. This construction work would include mobilisation of plant to site, setup
of Contractors Work Area, development and implementation of works EMP, preconstruction survey,
earthworks, rock works, concrete works and anchors (where required), ancillary items such as
pedestrian access paths and steps, roadway repairs, fencing, WAE survey, demobilisation and
cleanup. To complete the project estimate, fees have been included for an Environmental Impact
Statement, detailed design development including a geotechnical investigation, tendering and
award, and construction supervision and administration.
The Brief calls for a cost estimate developed to within +/‐ 20%. This is not feasible without adequate
geotechnical information. A cost contingency of 25% has been included into the construction
component of the overall project, with the exception of rock supply where a contingency of 15% has
been applied on the basis of firm discussions with suppliers.
A breakdown of the cost estimates are provided in Appendix G.
The preliminary capital cost estimates developed for the seawall projects based on the preliminary
rock revetment designs are as follows:
• Stage 1 (Option 1) $8.0 million ($17,900/m)
• Stage 1 (Option 2) $8.3 million ($18,500/m)
• Stage 2 $7.0 million ($16,500/m)
• Stage 3N $8.8 million ($16,900/m)
• Stage 3S $24.3 million ($15,200/m)
The preliminary cost estimate developed for the concrete piled wall is in the order of $25,000/m,
excluding the cost of the shareway path and the retaining wall above the seawall crest.
For preliminary costing of seawall maintenance, 0.5% per year is proposed between 2013 and 2038,
and 2% per year between 2038 and 2063. An additional maintenance provision for sand placement
to manage end effects is required in the order of 500‐1,000 m3 /year per wall end on average
following exposure of that wall end as a consequence of long term recession (Section 9.1.11).
Finally it is noted that the project cost estimates presented above make no allowance for any costs
associated with the acquisition of property.
8A0271gpb‐Old Bar Design Investigation‐FINAL ‐ 65 ‐
10 WORKS IMPLEMENTATION, MONITORING AND REVIEW
It is proposed that the seawall would be implemented in a number of stages commencing with the
most threatened section of shoreline opposite Lewis Street. The Stage 2 works extend northwards
to protect Pacific Parade. While the road in Stage 2 is at immediate risk of being undermined in a
design storm occurring today, there may be scope to rationalise a delay in its implementation on the
basis that risk to life and property in Stage 2 is lower than for the private properties in Stage 1.
There would also appear to be the opportunity to stage the works in Stage 2, with the southern
portion of that stage likely to require treatment before the northern portion, the latter remaining at
least partially protected by the residual sand dune on the seaward side of the entrance to
Racecourse Creek.
The constructed seawall(s) and the beach at Old Bar should be monitored to assess any changes to
the recession trend, and also to gauge seawall performance. Design modifications to the seawall
should be considered on the basis of ongoing performance.
While Stages 1 and 2 are required in the short term, Stages 3S and 3N are not expected to be
implemented for a number of years. Progressing to the latter stages of the seawall project at Old
Bar has the advantage of being able to monitor the wall and beach behaviour over a reasonable
period of time. If beach recession trends change, then the time for implementation of Stages 3S and
3N would also change. For these latter stages, it would also be prudent to explore any cost benefits
associated with possible relocation of selected public assets rather than their protection.
8A0271gpb‐Old Bar Design Investigation‐FINAL ‐ 66 ‐
11 COMMUNITY DROP‐IN SESSION AND FEEDBACK
HKA, assisted by Council and OEH, convened a community drop‐in session at Club Old Bar on
Thursday 21 November 2013 between 2.00 pm and 5.00 pm.
Selected copies of the Drawings were displayed, together with photos showing typical seawalls, and
seawall construction projects. The intention with these photos was to convey the type of structures
that were being considered for Old Bar and the likely scale of the construction project. Summary
sheets were also displayed on the various shoreline protection options discussed in the HKA report.
The drop‐in session provided Council, OEH and HKA the opportunity to explain the coastal
protection project, and canvas with members of the community the selected protection options and
impacts. The opportunity for involvement was positively received by the community.
The attendance recorded on tally sheet was 72 although this did not capture all who attended. OEH
estimated that between 80 and 95 people attended the drop‐in session. This was considered to be a
positive response, indicating high level of community interest. A survey form was available for
completion on the day, completed by 42 attendees.
A summary of the survey responses is provided below in Table 4. Details of the survey responses are
provided in a spreadsheet in Appendix H. Names of respondents have been removed to protect
privacy.
Table 4 – Summary of Key Responses from Surveys at the Community Drop‐In Session
Key Response Number Percentage6
Opposed to a wall 10 24
Support for a wall 13 31
Wall but not rock 1 2
Concern and questions but neither opposition
nor support for seawall
7 17
Neither opposition nor support 1 2
Reef support 9 21
Supports all measures 1 2
Total 42 99
At the time of finalising this report Council continues to receive submissions relating to the proposed
seawall.
6 Reported to nearest per cent

8A0271gpb‐Old Bar Design Investigation‐FINAL ‐ 67 ‐
12 REFERENCES
AECOM (2010)
Beach Sand Nourishment Scoping Study – Maintaining Sydney’s Beach Amenity against Climate
Change Sea Level Rise
Prepared for Sydney Coastal Councils Group Inc., 18 February 2010
ASR Ltd (2011)
Old Bar Beach Stabilisation Investigation: Feasibility Study
ASR Ref: 130‐2011, September 2011
Australian Water and Coastal Studies [AWACS] (1991)
Racecourse Creek Entrance at Old Bar – A Management Strategy
Report 91/11, August 1991.
Coffey and Partners (1981)
Geomorphological Assessment Wallabi Point to Crowdy Head, Taree
Prepared for Sinclair Knight and Partners
Corbella S and Stretch D (2012)
Coastal Defences on the KwaZulu‐Natal coast of South Africa: A Review with Particular Reference to
Geotextiles
Journal of South African Institution of Civil Engineers, Vol 54 No 2, October 2012
CSIR (1991)
Wave Model Tests on Waterlöffel Blocks
Submitted to Grinaker Precast, August 1991
Dean, R. G (1986)
Coastal Armoring: Effects, Principles and Mitigation
Proceedings of the 20th Coastal Engineering Conference
American Society of Civil Engineers, Vol 3, pp 1843‐1857
NSW Department of Environment, Climate Change and Water [DECCW] (2009)
NSW Sea Level Rise Policy Statement
DECCW 2009/708, October, ISBN 978‐1‐74232‐464‐7
NSW Department of Environment, Climate Change and Water [DECCW] (2010a)
Coastal Risk Management Guide: Incorporating Sea Level Rise Benchmarks in Coastal Risk
Assessments
DECCW 2010/760, August 2010, ISBN 978‐1‐74232‐922‐2 Department of Environment, Climate Change and Water [DECCW] (2010b) Draft Guidelines for Assessing the Impacts of Seawalls ISBN 978 1 74293 0695, December 2010
DHI (2006)
Stockton Beach Coastal Processes Study
Prepared by Danish Hydraulics Institute for Newcastle City Council
December 2006

8A0271gpb‐Old Bar Design Investigation‐FINAL ‐ 68 ‐
Foster, D.N., Gordon, A.D. and Lawson, N.V. (1975)
The Storms of May‐June 1974, Sydney, NSW
Proceedings of the 2nd Australian Conference on Coastal and Ocean Engineering, Gold Coast,
Queensland.
Gordon AD (1989)
Sydney’s Sea Defences
9th Australasian Conference on Coastal and Ocean Engineering, December 1989
Gordon AD (2013)
Coastal Acclimatisation to Intermittently Open River Entrances (IORE)
Coasts and Ports Conference, September 2013
Hanslow, DG and Nielsen, P (1995)
Field Measurements of Runup on Natural Beaches
12th Australian Coastal and Ocean Engineering Conference, Melbourne
Intergovernmental Panel on Climate Change [IPCC] (2013)
Working Group I Contribution to the IPCC Fifth Assessment Report
Climate Change 2013: The Physical Science Basis
Summary for Policy Makers
Twelfth Centre of Working Group I, 27 September 2013
Kraus NC and McDougal WG (1996)
The Effects of Seawalls on the Beach: Part 1, An Updated Literature Review
Journal of Coastal Research, 12(3), 691‐701, Summer 1996
McDougal WG, Sturtevant MA, and Komar PD (1987)
Laboratory and Field Investigations of the Impact of Shoreline Stabilisation Structures on Adjacent
Properties
Coastal Sediments ’87, ASCE, 961‐973
New South Wales [NSW] Government (1990)
Coastline Management Manual
September 1990, ISBN 0730575063
Nielsen, A.F., Lord, D.B. and Poulos, H.G. (1992)
Dune Stability Considerations for Building Foundations
Australian Civil Engineering Transactions, The Institution of Engineers, Australia, Vol.CE34 No.2,
p.167‐174.
Patterson Britton & Partners [PBP] (2006)
Scoping Study on the Feasibility to Access the Cape Byron Sand Lobe for Sand Extraction for Beach
Nourishment
Prepared for Byron Shire Council, March 2006
Ranasinghe R and Turner IL (2006)
Shoreline Response to Submerged Structures: A Review
Journal of Coastal Engineering, 53, 589‐611

8A0271gpb‐Old Bar Design Investigation‐FINAL ‐ 69 ‐
Sinclair Knight & Partners [SKP] (1981)
Old Bar Coastal Erosion Study
Prepared for Department of Public Works, NSW, November 1981 (DRAFT)
USACE (1984)
Shore Protection Manual
Coastal Engineering Research Center, Vicksberg USA
USACE (2002)
Coastal Engineering Manual
EM 1110‐2‐1100, April 2002
Water Research Laboratory [WRL] (2010)
Peer Review of Black Head to Crowdy Head Coastline Hazard Definition Study and Management
Options Study
WRL Technical Report 2010/21, July 2010
Water Research Laboratory [WRL] (2012)
Old Bar Submerged Artificial Reef Review
WRL2012001 JTC:MJB LR20120530, 30 May 2012
Water Research Laboratory [WRL] (2013)
A Review of Artificial Reefs for Coastal Protection in NSW
WRL Technical Report 2012/08 (IN DRAFT), March 2013
WorleyParsons (2010a)
Black Head to Crowdy Head
Coastline Hazard Definition Study Volume 1: Report
Prepared for Greater Taree City Council, 301017‐00051, September 2010
WorleyParsons (2010b)
Greater Taree Coastline Management Study, Black Head to Crowdy Head
Prepared for Greater Taree City Council, October 2010
WorleyParsons (2013)
A Coastal Zone Management Plan for Greater Taree
Draft report prepared for Greater Taree City Council, March 2013
You Z‐J, Lord DB and Watson PJ (2009)
Estimation of Relative Sea Level Rise from Fort Denison Tide Gauge Data
Proceedings of the 19th Australasian Coastal and Ocean Engineering Conference, Wellington, New
Zealand