oko bank presentation - op
TRANSCRIPT

1
OKO Bank Presentation
I Finnish EconomyII Finnish Financial IndustryIII OP Bank GroupIV OKO BankV Funding Strategy

2
I Finnish Economy
3
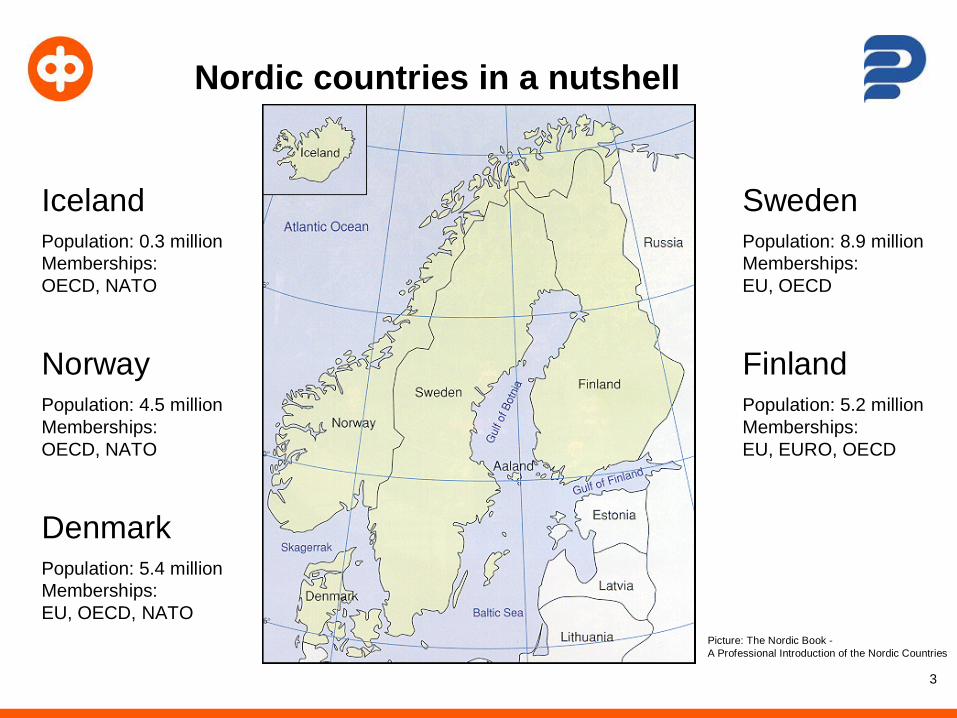
Nordic countries in a nutshell
FinlandPopulation: 5.2 millionMemberships:EU, EURO, OECD
SwedenPopulation: 8.9 millionMemberships:EU, OECD
DenmarkPopulation: 5.4 millionMemberships:EU, OECD, NATO
NorwayPopulation: 4.5 millionMemberships:OECD, NATO
IcelandPopulation: 0.3 millionMemberships:OECD, NATO
Picture: The Nordic Book -A Professional Introduction of the Nordic Countries
OPK/Strat.suunn./at/BKThuoltomaat(v) 4
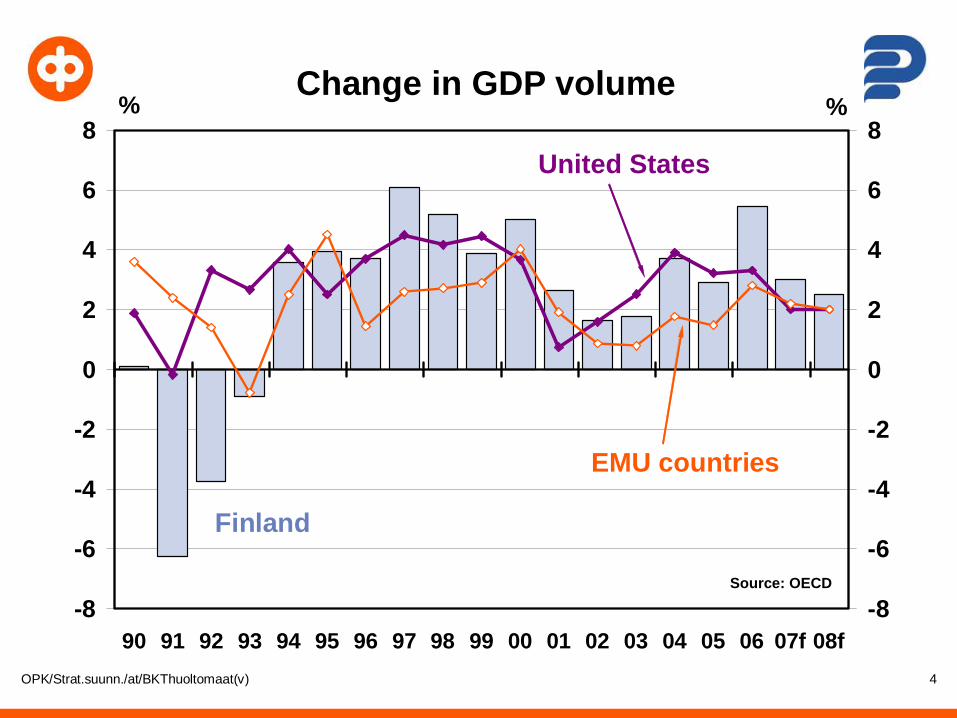
Change in GDP volume
-8
-6
-4
-2
0
2
4
6
8
90 91 92 93 94 95 96 97 98 99 00 01 02 03 04 05 06 07f 08f
%
-8
-6
-4
-2
0
2
4
6
8%
Finland
EMU countries
United States
Source: OECD
OPK/Strat.suunn./at/Vaihtotase 5
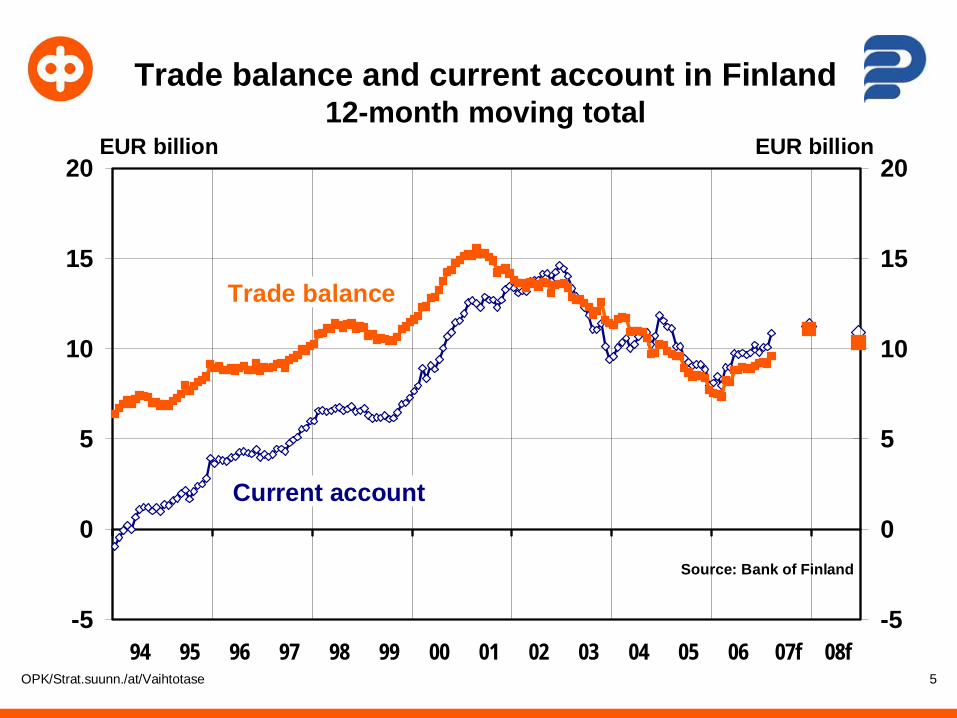
Trade balance and current account in Finland12-month moving total
-5
0
5
10
15
20
94 95 96 97 98 99 00 01 02 03 04 05 06 07f 08f
EUR billion
-5
0
5
10
15
20EUR billion
Current account
Trade balance
Source: Bank of Finland
OPK/Strat.suunn./at/KuinMaat 6
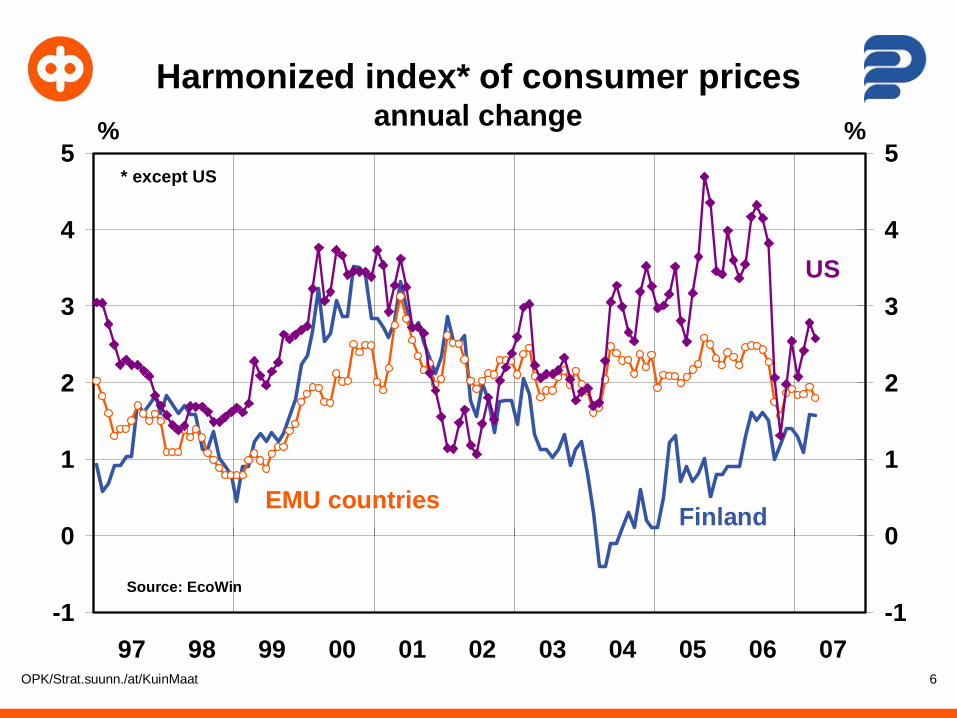
Harmonized index* of consumer pricesannual change
-1
0
1
2
3
4
5
97 98 99 00 01 02 03 04 05 06 07
%
-1
0
1
2
3
4
5%
US
EMU countries Finland
* except US
Source: EcoWin
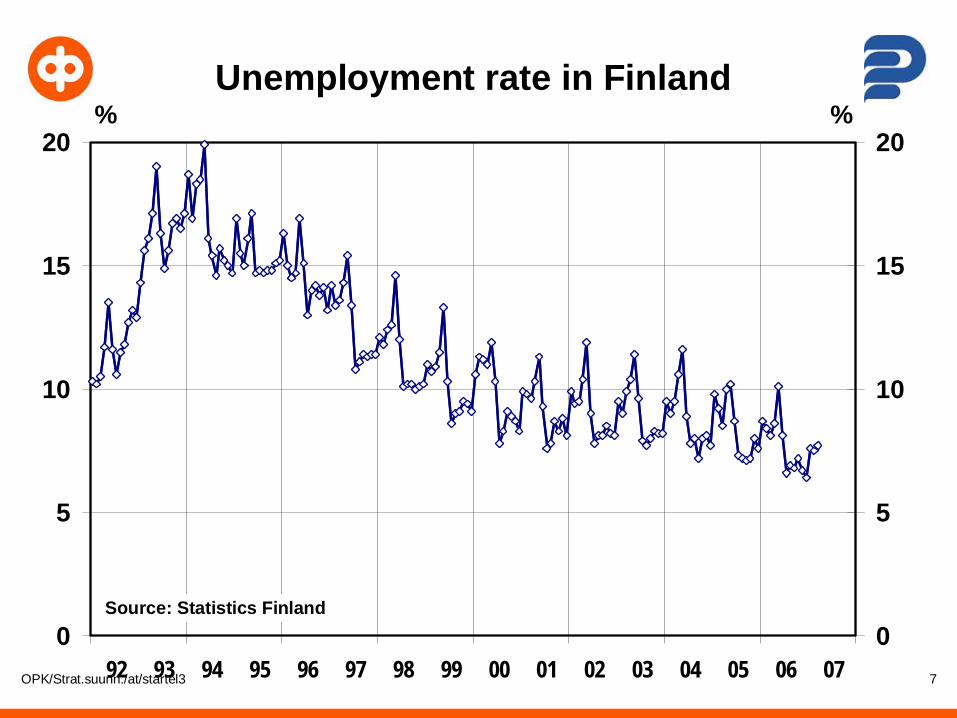
OPK/Strat.suunn./at/startel3 7
Unemployment rate in Finland
0
5
10
15
20
92 93 94 95 96 97 98 99 00 01 02 03 04 05 06 07
%
0
5
10
15
20%
Source: Statistics Finland

8
II Finnish Financial Industry

9
Market shares in the Finnish banking market
Market shares of deposits in FinlandMarch 31, 2007
0
5
10
15
20
25
30
35
40
Nordea* OP BankGroup
DanskeBank*
Savings Banks
Local Cooper. Banks
AktiaSavings
Bank
Other
%
* 28.2.2007 Sources: Bank of Finland, banks' interim reports, estimations
Market shares of loans in FinlandMarch 31, 2007
0
5
10
15
20
25
30
35
Nordea* OP BankGroup
DanskeBank*
Handels-banken
Savings Banks
Aktia Savings
Bank
Other
%
* 28.2.2007 Sources: Bank of Finland, banks' interim reports, estimations

10
Market Shares of SMEs*)
*) The market share of the number of customersTietoykkönen Oy (1996-2003)Add Value Oy (2004-2005)
55 %
50 %47 %
44 %47 %
42 %40 % 41 % 41 % 40 % 39 %
9 %7 %
0 %
5 % 3 % 3 % 4 % 4 % 4 % 4 %
39 %
35 %36 %35 %35 %37 %
32 %33 %
32 %29 %
34 %
9 %10 %9 %10 %8 %
11 %8 %9 %9 %
7 %5 %6 %6 %7 %8 %6 %7 %7 %
5 %4 % 5 %6 %6 %
0 %
10 %
20 %
30 %
40 %
50 %
60 %
1996(n=1000)
1997(n=2010)
1998(n=2041)
1999(n=2000)
2000(n=2013)
2001(n=2011)
2002(n=2012)
2003(n=2015)
2004(n=2016)
2005(n=2011)
2006(n=2012)
Nordea OP Bank Group Sampo Bank Savings Banks' Association /Aktia Local Co-operative Banks Association

OPK/Strat.suunn./vv/rahoyhtmo 11
Mutual fund companies´market shares 1998 - 2006
0
5
10
15
20
25
30
35
Nordea OP BankGroup
Sampo Gyllenberg Evli FIM Others
%
Source: Finnish Association of Mutual Funds
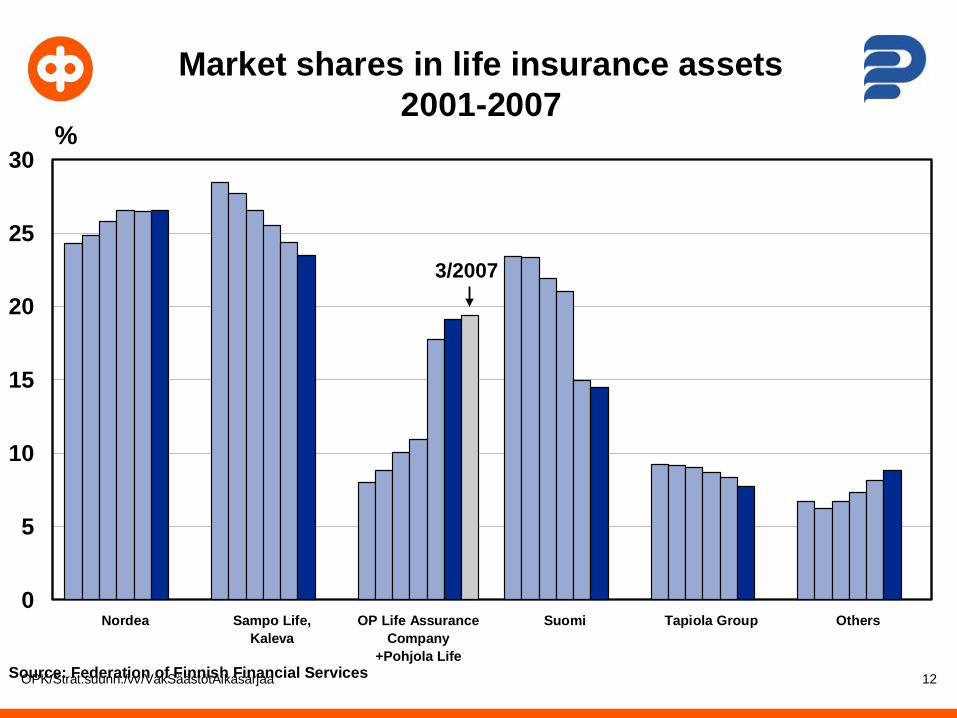
OPK/Strat.suunn./vv/VakSäästötAikasarjaa 12
Market shares in life insurance assets2001-2007
0
5
10
15
20
25
30
Nordea Sampo Life,Kaleva
OP Life AssuranceCompany
+Pohjola Life
Suomi Tapiola Group Others
%
Source: Federation of Finnish Financial Services
3/2007

13
Market shares in life insurance Gross premiums written 2006
28,3 27,9
22,3
6,5 6,28,8
0
5
10
15
20
25
30
35
OP BankGroup
Nordea Sampo * Tapiola Skandia Others
%
* Sampo Life and Kaleva

14
Market shares of non-life insurancepremiums written 2006
Domestic direct insurance27,6
26,3
20,5
10,48,6
6,6
0
5
10
15
20
25
30
If Pohjola* Tapiola** FenniaGroup***
Other
%Source: Federation of FinnishFinancial Services
* Pohjola Non-Life, A-Insurance and Eurooppalainen ** incl. Turva *** incl. Palonvara
Local Insurance

15
III OP Bank Group
Structure, strategies and financial performance

16
The Structure of OP Bank Group and OKO Bank Group
OP Bank Group Central Cooperative
OP Bank Group Central Cooperative
MutualFunds
MutualFunds
Life Insurance
Life Insurance
Retail Bank inHelsinki Area
Retail Bank inHelsinki Area
OKO BankOKO Bank
Non-lifeInsuranceNon-life
Insurance
GroupTreasuryGroup
TreasuryAsset
ManagementAsset
ManagementCapital MarketsCapital Markets
231 Member
CooperativeBanks
231 Member
CooperativeBanks
OtherOther
Banking and Investment
Services
Banking and Investment
Services
CorporateBanking
CorporateBanking
CorporateCustomersCorporateCustomers
Private Customers
Private Customers
Legal structure: OP Bank Group has joint and several liability for each others commitments.
CorporateCustomersCorporateCustomers
CorporateCustomersCorporateCustomers
Private Customers
Private Customers BalticBaltic

17
Joint Responsibility for Liability
• Joint responsibility within the OP Bank Group is based on the Cooperative Bank Act and the Member Credit Institutions are committed to the joint responsibility in their articles of association (commercial banks) or statutes (Member Cooperative Banks)• In the event that a Member Credit Institution or the Central Cooperative is
unable to pay any debts owed the other Member Credit Institutions/ Central Cooperative are jointly and severally responsible for paying that debt
• The outstanding debt is apportioned among the Central Cooperative and the Member Credit Institutions in proportion to their assets as a percentage of the total group assets from the most recently adopted balance sheets
• The joint responsibility under the cooperative system includes the Central Cooperative and its Member Credit Institutions• The Member Cooperative Banks of the OP Bank Group, OKO Bank Plc,
Helsinki OP Bank Plc, OP-Kotipankki Oyj and OP Mortgage Bank• Insurance companies within the OP Bank Group are not included in the
cooperative joint responsibility

18
We are the market leader in all our
core business areas and the leading
financial services group in Finland.
OP Bank Group’s vision

OPK/Strat.suunn./vv/talluo1900 19
OP Bank Groupon the deposit and lending markets*
0
10
20
30
40
1902 1922 1942 1962 1982 2002 2022
%
Market shareof deposits
Market share of lending
* Up until 12/2002 deposit banks' loans to and deposits placed by Finnish non-MFI's; since 1/2003 MFI's loans to and deposits placed by euro area non-MFI's
Latest value 3/2007

20
OP Bank Group
Income statement
€ million1 January to 31 March 2007 2006 € million %Net interest income 244 202 43 21Other income 313 300 13 4 Total income 558 502 56 11Personnel costs 140 134 6 4Other expenses 149 145 4 3 Total expenses 289 278 10 4Impairment losses on receivables 1 -2 2Returns to owner-members 23 14 9 62Earnings before tax 246 211 35 16
Change

21
OP Bank Group
Earnings before tax, 12 month moving total1995-2003 FAS
0
100
200
300
400
500
600
700
800
900
95 96 97 98 99 00 01 02 03 04 05 06 03/07
€ million

22
OP Bank Group
Ratios
03/2007 03/2006Net interest margin, % * 1.6 1.5Cost/ income ratio, Banking and Investment Services, % 48.7 52.5Return on equity (ROE), % 14.4 12.3Return on equity at fair value, % 15.5 9.4Return on assets (ROA), % 1.22 1.05Non-performing and zero-interest bearing receivables of loans and guarantees, % 0.4 0.4T ier 1 ratio, % 12.8 12.8Capital adequacy ratio, % 14.3 13.9
* Net interest income as a % of average total assets

23
€ million 03/2007 03/2006
Total assets 62 680 56 118Credit stock 40 889 35 859Non-performing and zero-interest claims 162 163Deposits 26 322 24 152Equity capital 5 259 4 587
OP Bank Group
Balance sheet item s
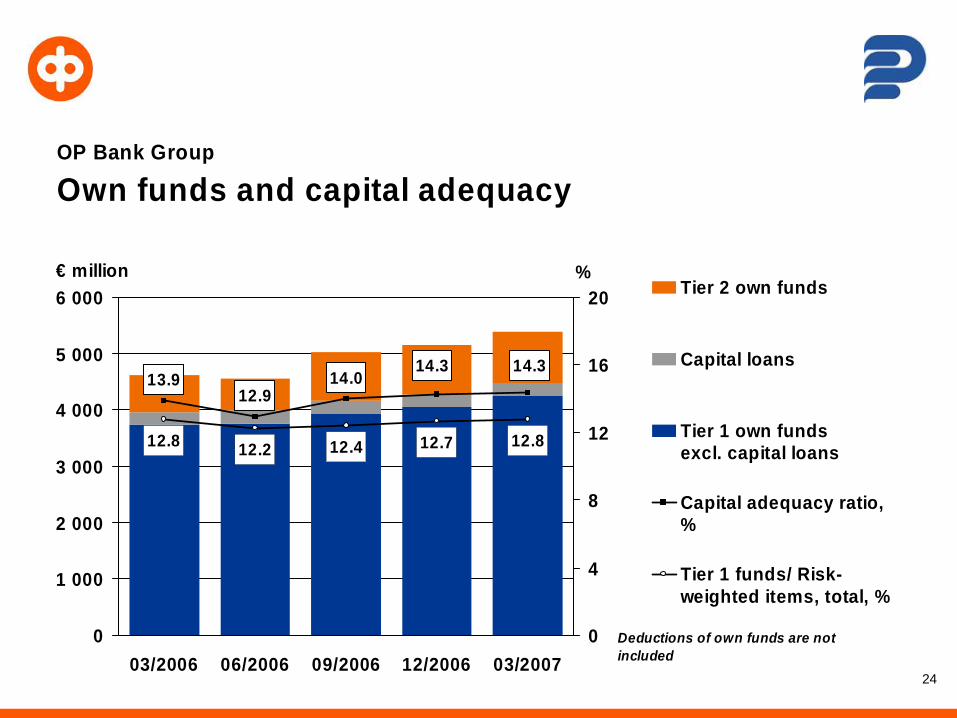
24
OP Bank Group
Own funds and capital adequacy
12.8 12.2 12.4 12.7 12.8
13.9 14.012.9
14.314.3
0
1 000
2 000
3 000
4 000
5 000
6 000
03/2006 06/2006 09/2006 12/2006 03/2007
€ million
0
4
8
12
16
20%
Tier 2 own funds
Capital loans
Tier 1 own funds excl. capital loans
Capital adequacy ratio,%
Tier 1 funds/ Risk-weighted items, total, %
Deductions of own funds are not included
25
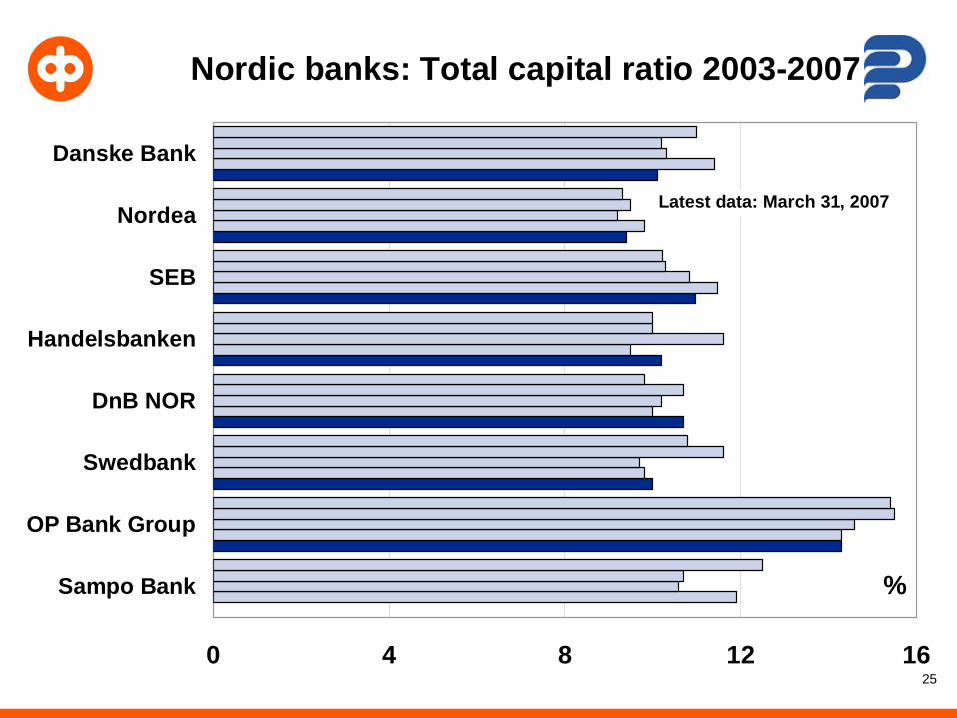
Nordic banks: Total capital ratio 2003-2007
0 4 8 12 16
Sampo Bank
OP Bank Group
Swedbank
DnB NOR
Handelsbanken
SEB
Nordea
Danske Bank
%
Latest data: March 31, 2007

26
Others8 %
Services9 %
Telecommunications and electronics
2 %
Communication and publishing
1 %
Other industry5 %
Forest industry4 %
Metal industry6 %
Real-estate activities25 %
Energy2 %
Transports and traffics5 %
Food industry3 %
Wholesale and retail trade13 %
Housing associations11 %
Construction6 %
Corporates28 %
Households: housing loans
48 %
Households: other loans
24 %
Asset Mix OP Bank GroupLoans and leasing assets by sectorMarch 31, 2007

27
OP Bank Group
Loans and leasing assets by sector
€ million € million % 31.3.2007 Of loans
Enterprises and housing companies 11 638 28 % 10 221 29 % 1 417 14 % 59 0.5% Industry 2 310 6 % 2 226 6 % 84 4 % 13 0.5% Construction 718 2 % 652 2 % 66 10 % 6 0.8% Trade and catering 1 693 4 % 1 351 4 % 342 25 % 11 0.7% Real-estate investment 2 761 7 % 2 450 7 % 311 13 % 14 0.5% Other enterprises 2 820 7 % 2 428 7 % 392 16 % 12 0.4% Housing companies 1 336 3 % 1 114 3 % 222 20 % 4 0.3%Finance and insurance 34 0 % 7 0 % 26 355 % 0 0.0%Public sector entities and non-profit organisations 774 2 % 719 2 % 55 8 % 1 0.1%Households 28 042 69 % 24 733 69 % 3 309 13 % 102 0.4% Housing loans 19 476 48 % 16 884 47 % 2 592 15 % 43 0.2%Foreign 448 1 % 216 1 % 231 107 % 0 0.0%Other items, net -50 0 % -44 -6Total 40 886 100 % 35 853 100 % 5 033 14 % 162 0.4%
Non-performing and zero-interest loansChange
31.3.2007 31.3.2006

28
OP Bank GroupCorporate loans and leasing assets by industry
€ million
Housing associations 1 336 11 % 4 7 %Food industry 403 3 % 2 3 %Energy 251 2 % 0 0 %Wholesale and retail trade 1 499 13 % 9 15 %Real-estate activities 2 761 24 % 14 24 %Transports and traffics 621 5 % 4 7 %Metal industry 663 6 % 3 5 %Forest industry 442 4 % 3 5 %Other industry 533 5 % 3 5 %Others 919 8 % 3 4 %Services 1 069 9 % 6 11 %Construction 718 6 % 6 10 %Telecommunications and electronics 268 2 % 1 1 %Communication and publishing 154 1 % 2 3 %Total 11 638 100 % 59 100 %
Non-performing
31.3.2007and zero-
interest loans

29
€ million 31.3.2007 31.3.2006 Change, % 31.12.2006
Households 102 92 10.2 78 Companies 55 69 -19.9 47 Housing corporations and others 5 2 3 Total 162 163 -0.9 128
Non-performing loans of loan and guarantee portfolio, % 0.4 0.4 -0.1* 0.3
* Percentage points
OP Bank Group
Non-performing and zero-interest loans

30
Diversified business mix
59 %
41 %
Banking and InvestmentServices
Non-Life Insurance
OKO Bank Group - earnings before tax, 1-3/2007
74 %
12 %
14 %
Banking and InvestmentServices
Non-Life Insurance
Life Insurance
OP Bank Group - Earnings before tax, 1-3/2007

31
IV OKO Bank

32
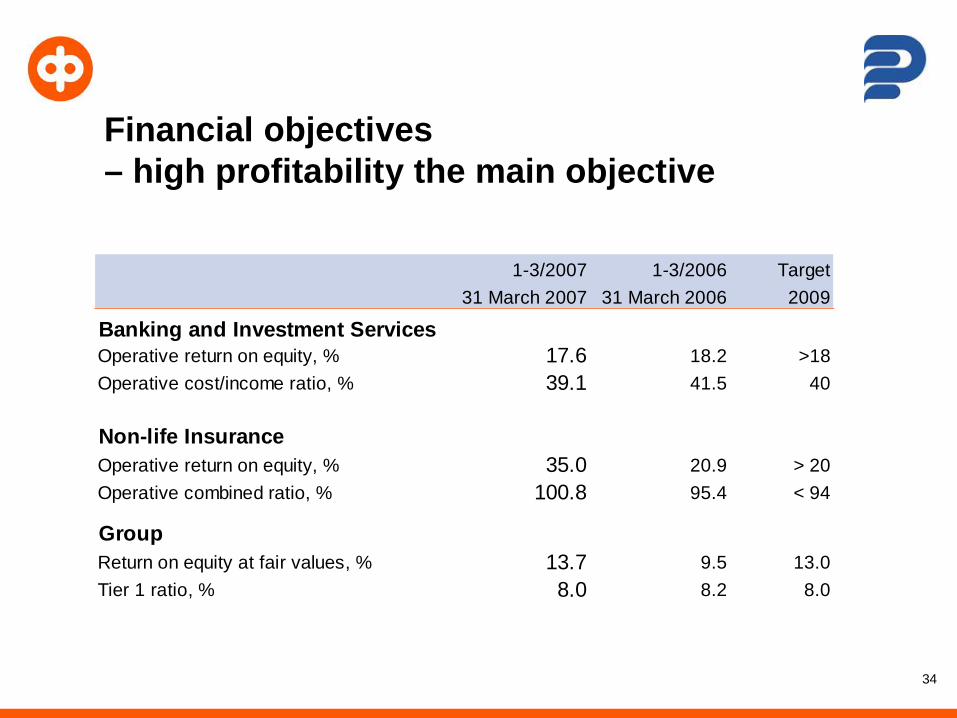
Strategic targets
• Leading market position• ROE 13%• Banking and Investment Services: expense / income ratio 40%• Non-life Insurance: combined ratio < 94% excl. amortisation on
intangible assets related to Pohjola acquisition Measures

33
Quarterly key figures
1-3/2007 1-3/2006 1-12/2006 31 March 2007 31 March 2006 31 Dec 2006
Earnings before tax, € million 65 69 223Return on equity at fair values, % *) 13.7 8.5 9.5Tier 1 ratio , % 8.0 8.8 8.2Solvency ratio,% 12.7 11.7 12.9Earnings per share, € 0.25 0.26 0.89Earnings per share, diluted € 0.25 0.26 0.89Equity per share, € ***) 8.65 8.33 8.99
*) Return on equity has been calculated at fair values since 2006. Income has been annualised
34
1-3/2007 1-3/2006 Target31 March 2007 31 March 2006 2009
Banking and Investment ServicesOperative return on equity, % 17.6 18.2 >18Operative cost/income ratio, % 39.1 41.5 40
Non-life InsuranceOperative return on equity, % 35.0 20.9 > 20Operative combined ratio, % 100.8 95.4 < 94
GroupReturn on equity at fair values, % 13.7 9.5 13.0Tier 1 ratio, % 8.0 8.2 8.0
Financial objectives – high profitability the main objective
35
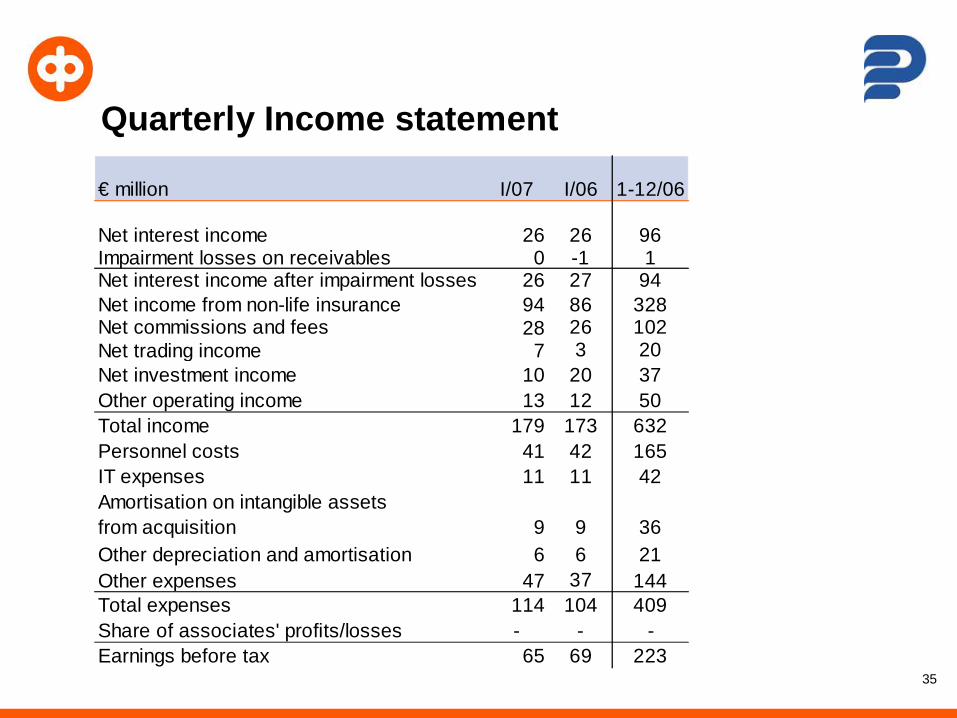
Quarterly Income statement
€ million I/07 I/06 1-12/06
Net interest income 26 26 96Impairment losses on receivables 0 -1 1Net interest income after impairment losses 26 27 94Net income from non-life insurance 94 86 328Net commissions and fees 28 26 102Net trading income 7 3 20Net investment income 10 20 37Other operating income 13 12 50Total income 179 173 632Personnel costs 41 42 165IT expenses 11 11 42Amortisation on intangible assets from acquisition 9 9 36Other depreciation and amortisation 6 6 21Other expenses 47 37 144Total expenses 114 104 409Share of associates' profits/losses - - -Earnings before tax 65 69 223

36
V Funding Strategy

Source: Companies' Internet pages 4/07 37
Long - term credit ratings *) Moody's Investors Service & Poor's Ratings
OKO Bank Danske BankNordeaDnB NORHandelsbankenSwedbankSEB
If **)Pohjola **)
Finnish Sovereign
*) Long-term funding**) Insurance financial strength
A+
AA-
Fitch Standard
AA-AA- AA-
AA-Aa1
Aa1
Aa1
AA-A+
Aa2
AA-
A+
-
A+
Aa1
Aa1
Aa1AA-
A+
Aaa AAA AAA
A2A3
AA+
--

38
02468
10121416182022242628
31.12.2004 31.12.2005 31.12.2006 31.3.2007
€ billion
Liabilities to MemberCooperative BanksLiabilities to other financialinstitutionsLiabilities to customers
Non-life insurance liabilities
Life insurance liabilities
Debt securities issued to thepublicSubordinated liabilities
Capital loans
Shareholders' equity andminority interestsOther items
16.5 €billion
22.3 €billion24.2 €billion
37%
41%
55%19%
7%
7%9%
9%
9%9%
8%
5%
26.5 € billion
9%
4%3%
56%
9%5%
25%
Balance sheet – Funding
39
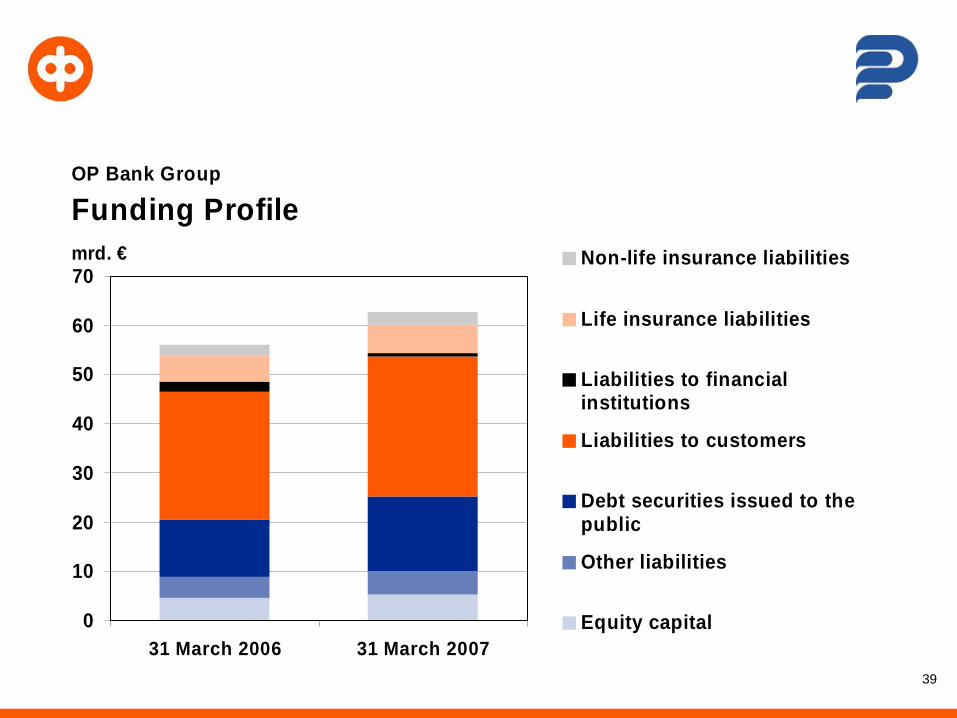
OP Bank Group
Funding Profile
0
10
20
30
40
50
60
70
31 March 2006 31 March 2007
mrd. € Non-life insurance liabilities
Life insurance liabilities
Liabilities to financialinstitutions
Liabilities to customers
Debt securities issued to thepublic
Other liabilities
Equity capital

40
OP Bank Group
Quarterly loans and deposits
0
10
20
30
40
50
I II III IV/06 I II III IV/07
€ billion
Loans (excl. loansmediated fromTreasury funds)
Deposits
41
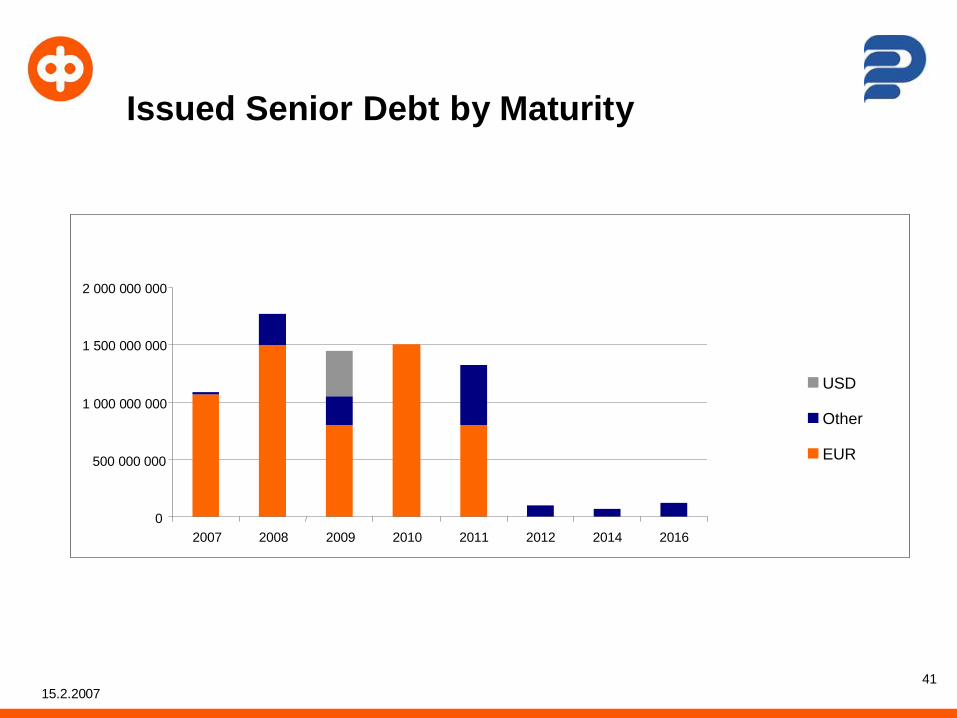
Issued Senior Debt by Maturity
15.2.2007
0
500 000 000
1 000 000 000
1 500 000 000
2 000 000 000
2007 2008 2009 2010 2011 2012 2014 2016
USD
Other
EUR

42
LT2, UT2 and Tier1 by Call date
0
50 000 000
100 000 000
150 000 000
200 000 000
250 000 000
300 000 000
350 000 000
400 000 000
450 000 000
2007 2010 2011 2012 2014 2015 2055
Tier1Upper tier2Lower tier2
15.2.2007

43
Contact persons at OKO Bank for debt investor relations
Mr Timo RitakallioDeputy Chief Executive OfficerHead of Banking and Investment Servicestel. +358 10 252 4322mob. +358 500 536 346e-mail:[email protected]
Mr Hanno HirvinenExecutive Vice PresidentHead of Group Treasurytel. +358 10 252 2221mob. +358 50 522 8322e-mail:[email protected]
www.okobank.com

44